traffic environment advisory committee meeting officer...
TRANSCRIPT

Traffic Environment Advisory Committee Meeting Officer Briefing Note
TEAC Meeting Date: 28 November 2013 Applicant Details: Local Residents Date of Receipt: 20/06/2012 & 07/08/2012 Location: Ferris Street & Goondoon Street CSR (if entered): 142731 & 146180 Subject: Potential Safety issues on Ferris Street and
Goondoon Street
Purpose:
The purpose of this report is to allow Council to consider the outcome of the investigation into the speed, volume and compliance of vehicles using Ferris Street and Goondoon Street, Gladstone. The investigation was initiated after receiving allegations that vehicles are speeding and travelling the wrong way along the slip lane at the intersection of Ferris Street and Goondoon Street.
Officer's Recommendation:
That Council:-
1. Note that the speed and volume of vehicles using Ferris Street and Goondoon Street, Gladstone is acceptable and no treatments are required.
2. Endorse Option 3, the installation of a splitter island along Goondoon Street, Gladstone to stop vehicles going the wrong way along the slip lane (Drawing No. 13-088-900), at a cost of $7,500 from the 2013/2014 Road Services TEAC allocation.
T.5.13.6.1

Background:
On the 20 June 2012 and 07 August 2012, local residents of Ferris Street and Goondoon Street requested that Council Officers investigate a number of issues relating to the Ferris Street and Goondoon Street area. The issues raised were:-
Vehicles speeding along Ferris Street and Goondoon Street; A large volume of vehicles using the street, which was considered to be caused by people 'rat-
running'; and Vehicles driving the wrong way along the slip lane connecting Ferris Street to Goondoon
Street.
A letter dated 14 June 2012 was sent to one of the customers regarding a previous Customer Service Request (CSR) 131226, in relation to speeding along Ferris Street. In the letter the applicant was advised that traffic counts on Ferris Street had been completed and speeding was not an issue. Following this letter the applicant lodged another CSR (142731) raising concerns about the number of vehicles using Ferris Street. Following this CSR, a second CSR (146180) was created by another resident in the area.
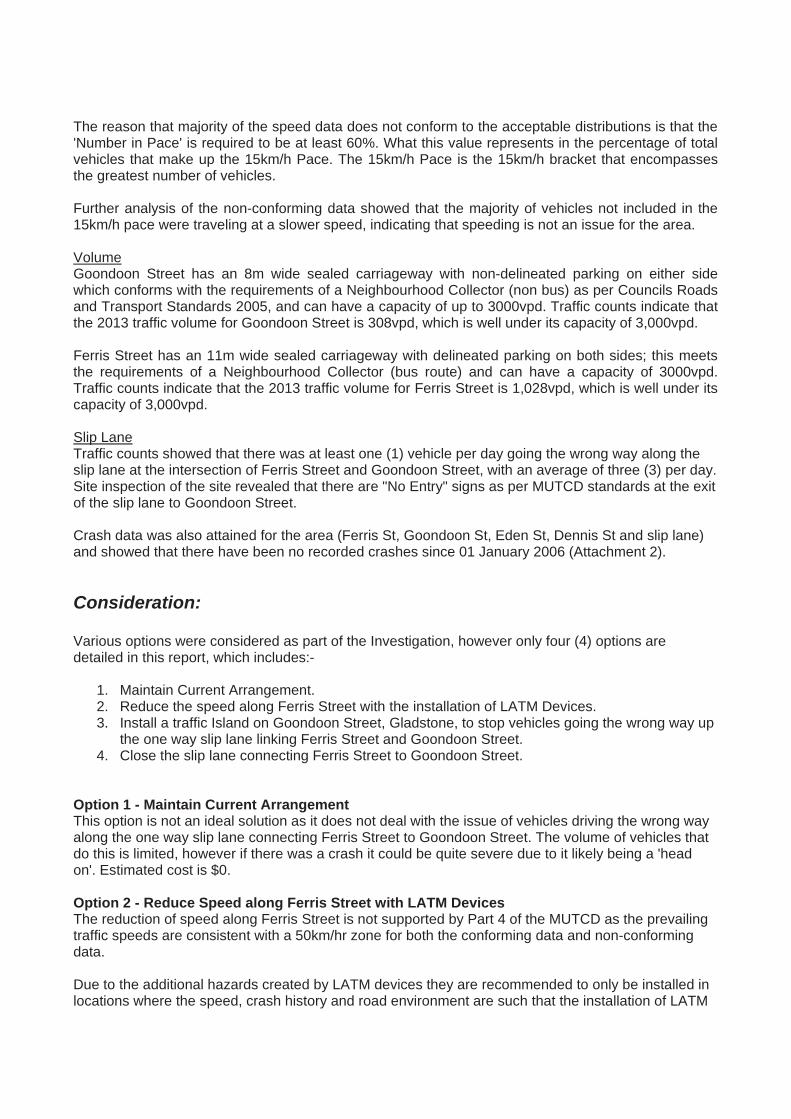
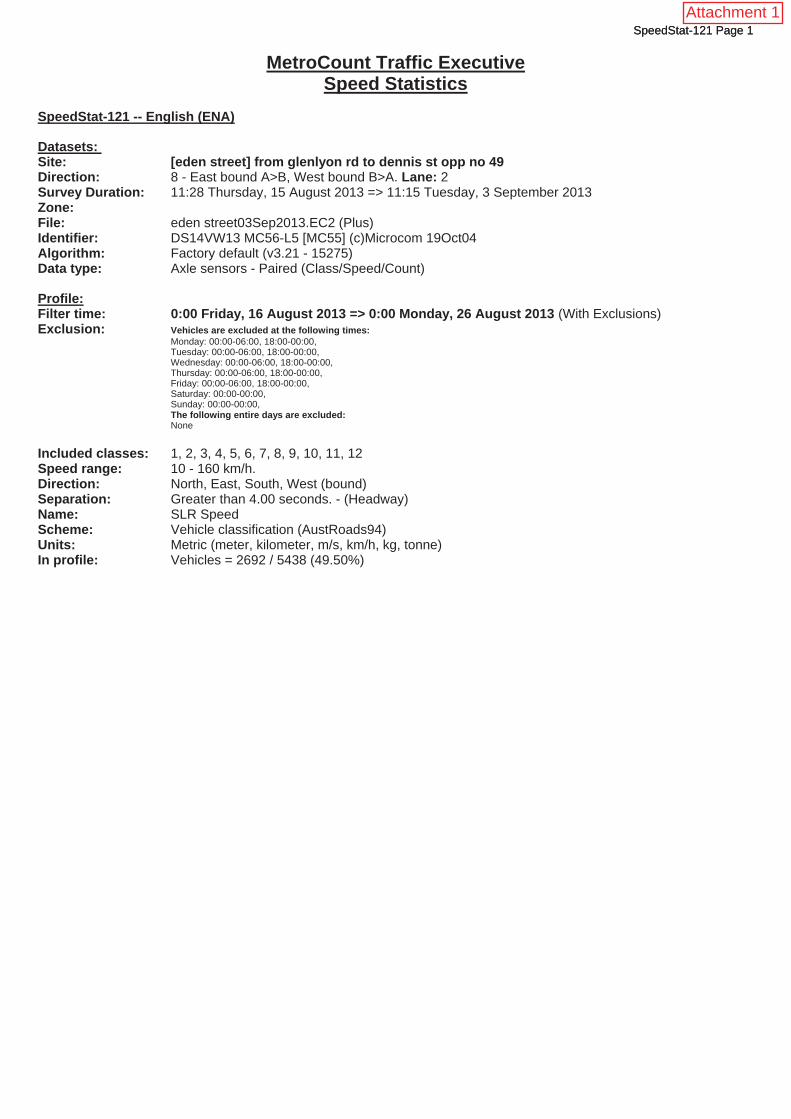
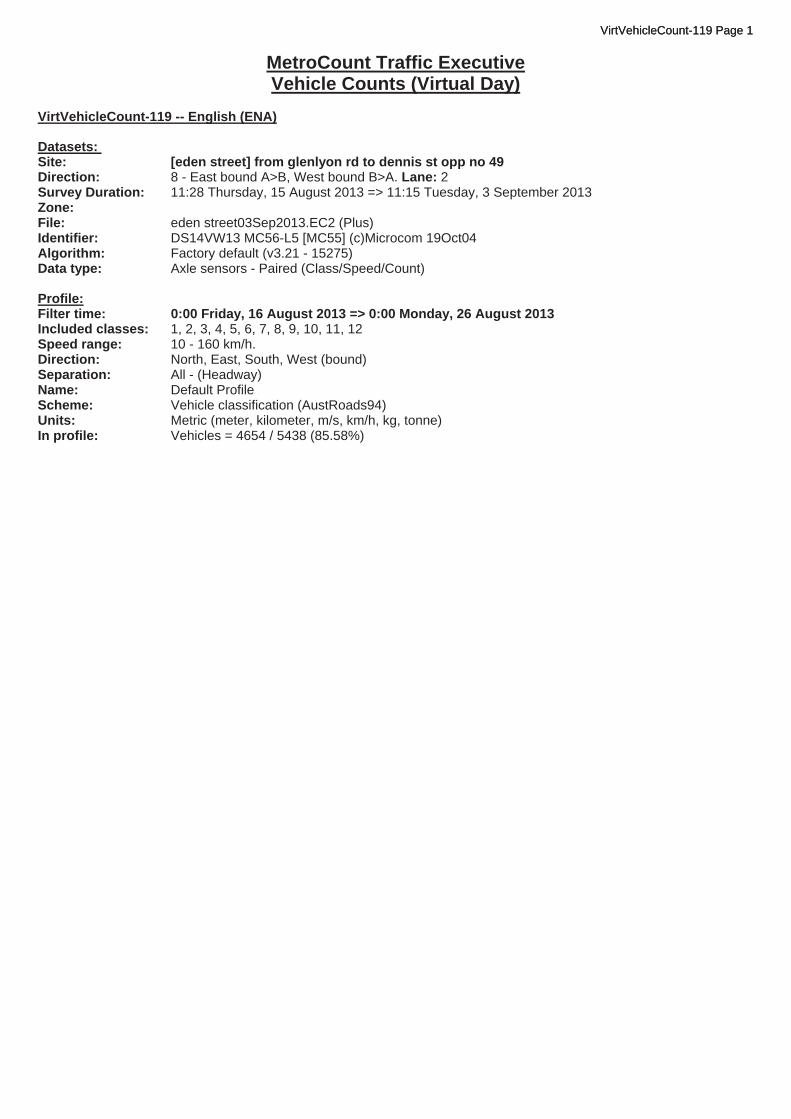
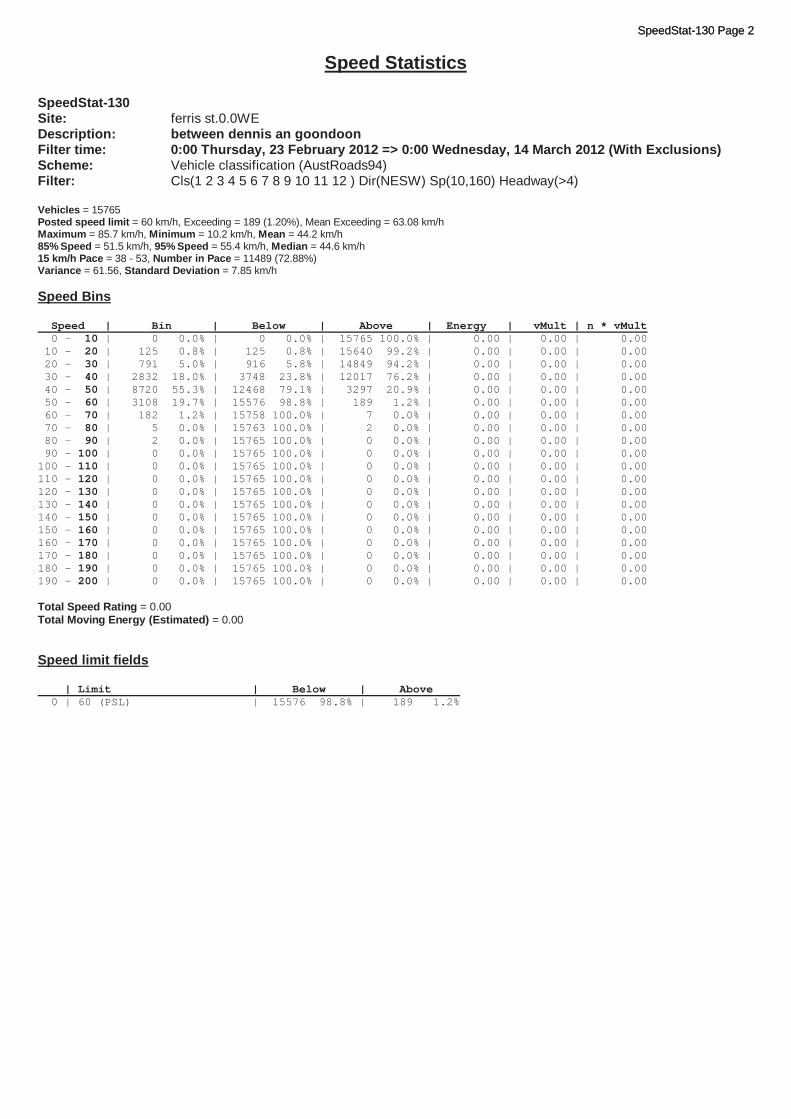
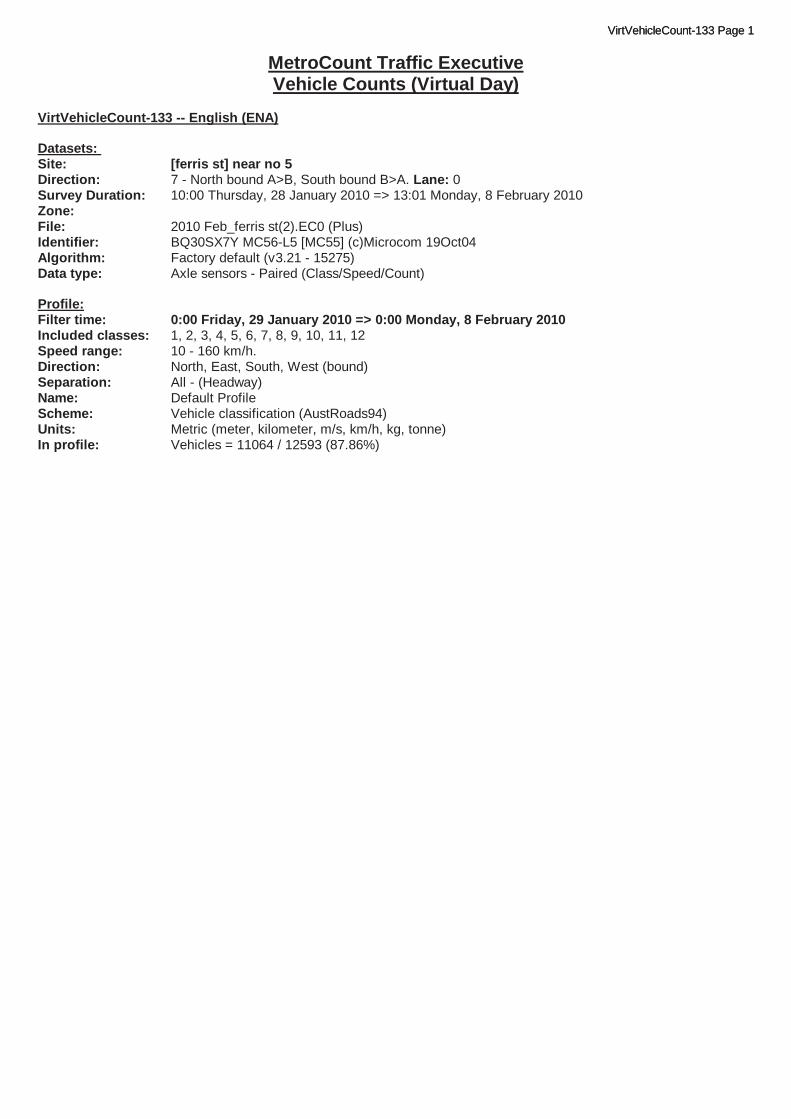
Following the request, traffic classification counters were installed (in September 2013) in front of 49 Eden Street, 4 Ferris Street, 206 Goondoon Street, and in the slip lane between Ferris Street and Goondoon Street. A summary of the data from the traffic counts installed in 2013 and ones previously installed in 2010 and 2012 can be seen in Attachment 1 and is summarised in Table 1. The prevailing speed data has been collected and refined to meet the requirements of Part 4 of the MUTCD.
Location AADT Mean Speed
Upper 15km/h
PaceNumberin Pace
Recommended Speed (MUTCD)
(Units) vpd km/h km/h % km/h 2013 Ferris Street Slip lane 1142 30.6 38 83.87 2013 - 4 Ferris Street 1028 44 52 79.84 50 (existing) 2012 - 3 Ferris Street 1385 44.2 53 51.5 Data does not conform 2010 - 5 Ferris Street 1106 47.5 56 71.37 50 (existing) 2013 - 206 Goondoon Street 308 42.1 48 54.17 Data does not conform 2012 - 206 Goondoon Street 300 41.1 51 59.03 Data does not conform 2013 - 49 Eden Street 465 40.3 47 69.35 40 Table 1 - Traffic counter results
SpeedPrevailing traffic speeds play a major role when determining the appropriate speed for a road. Part 4 of the MUTCD details the processed used to determine the appropriateness of the existing speed using prevailing traffic speeds. This process is a two (2) stage process. The first stage is to determine if the prevailing speed data conforms to the acceptable speed distributions specified in Table C1 of Part 4 of the MUTCD. If the data conforms to the acceptable speed distribution, it indicates the existing speed is acceptable pending review of the crash data, and you do not need to progress to the second stage. If the data does not conform to the acceptable distributions specified in Table C1, you must then progress onto Stage 2.
For Stage 2, the prevailing speed data is assessed against the acceptable speed distribution values in Table C2 of Part 4 of the MUTCD. The Stage 2 assessment is used to determine the recommended new speed limit. If the Stage 2 assessment recommends the existing speed limit, then this indicates that the prevailing speed data does not conform to acceptable standards and therefore the prevailing vehicle speed assessment should be discarded for the particular section.
The reason that majority of the speed data does not conform to the acceptable distributions is that the 'Number in Pace' is required to be at least 60%. What this value represents in the percentage of total vehicles that make up the 15km/h Pace. The 15km/h Pace is the 15km/h bracket that encompasses the greatest number of vehicles.
Further analysis of the non-conforming data showed that the majority of vehicles not included in the 15km/h pace were traveling at a slower speed, indicating that speeding is not an issue for the area.
VolumeGoondoon Street has an 8m wide sealed carriageway with non-delineated parking on either side which conforms with the requirements of a Neighbourhood Collector (non bus) as per Councils Roads and Transport Standards 2005, and can have a capacity of up to 3000vpd. Traffic counts indicate that the 2013 traffic volume for Goondoon Street is 308vpd, which is well under its capacity of 3,000vpd.
Ferris Street has an 11m wide sealed carriageway with delineated parking on both sides; this meets the requirements of a Neighbourhood Collector (bus route) and can have a capacity of 3000vpd. Traffic counts indicate that the 2013 traffic volume for Ferris Street is 1,028vpd, which is well under its capacity of 3,000vpd.
Slip Lane Traffic counts showed that there was at least one (1) vehicle per day going the wrong way along the slip lane at the intersection of Ferris Street and Goondoon Street, with an average of three (3) per day. Site inspection of the site revealed that there are "No Entry" signs as per MUTCD standards at the exit of the slip lane to Goondoon Street.
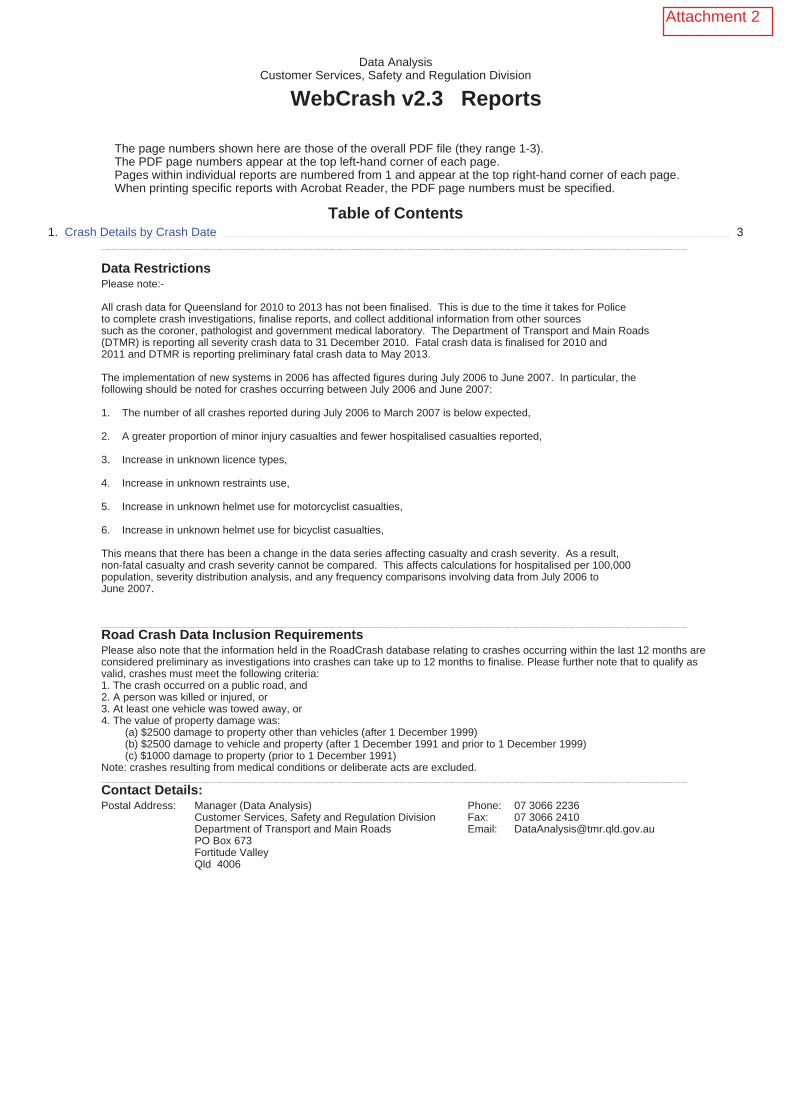
Crash data was also attained for the area (Ferris St, Goondoon St, Eden St, Dennis St and slip lane) and showed that there have been no recorded crashes since 01 January 2006 (Attachment 2).
Consideration:
Various options were considered as part of the Investigation, however only four (4) options are detailed in this report, which includes:-
1. Maintain Current Arrangement. 2. Reduce the speed along Ferris Street with the installation of LATM Devices. 3. Install a traffic Island on Goondoon Street, Gladstone, to stop vehicles going the wrong way up
the one way slip lane linking Ferris Street and Goondoon Street. 4. Close the slip lane connecting Ferris Street to Goondoon Street.
Option 1 - Maintain Current Arrangement This option is not an ideal solution as it does not deal with the issue of vehicles driving the wrong way along the one way slip lane connecting Ferris Street to Goondoon Street. The volume of vehicles that do this is limited, however if there was a crash it could be quite severe due to it likely being a 'head on'. Estimated cost is $0.
Option 2 - Reduce Speed along Ferris Street with LATM DevicesThe reduction of speed along Ferris Street is not supported by Part 4 of the MUTCD as the prevailing traffic speeds are consistent with a 50km/hr zone for both the conforming data and non-conforming data.
Due to the additional hazards created by LATM devices they are recommended to only be installed in locations where the speed, crash history and road environment are such that the installation of LATM

is required to improve the overall safety of the road. As the speed analysis indicates that speeding is not an issue, the crash history has no recorded crashes, and that the road environment still has excessive capacity, the installation of LATM devices are not recommended at this location. A cost estimated was not investigated due to costs varying greatly depending on LATM treatment installed.
These Streets are minor collector streets within the CBD and as the population in Gladstone increases, an increase in traffic volume is expected.
Option 3 - Install Traffic Island on Goondoon StreetWhile the number of vehicles going the wrong way is low, the crash severity that would result from a head on collision would be high. Installing a blister island on Goondoon Street would be the simplest solution to improve the situation. Attachment 3 (Drawing No. 13-088-900) shows the concept layout for the blister island.
It is noted that a car could still access the slip lane in the wrong direction to the south of the island, however the extents of the blister lighting is limited by the existing street lighting and the lighting requirements. The installation of the proposed blister island shown in Attachment 3 would cost an estimated $7,500. If the blister island was increased in length additional lighting would be required. The cost of the additional lighting would be approximately $20,000 and include a 18 month wait due to wait times imposed by Ergon.
Option 4 - Close the Slip Lane The option of closing the slip lane was suggested by the customer as a way to stop the people going the wrong way down the slip lane and stop the number of people bypassing the lights at Tank Street/Glenlyon Street (rat-running). This option would have the desired effect in that it would completely stop people traveling the wrong way up the slip lane as it would no longer exist, and the extended travel time of having to go up to the to the intersection of Ferris Street and Goondoon Street, Gladstone would potentially deter people taking the shortcut. However this option also comes with a number of issues. Attachment 4 (Drawing No. 13-088-901) illustrates that to achieve the necessary sight distance for this intersection all parking would need to be removed from the south western side of Goondoon Street. The trees and shrubs located on the corner at 1 Ferris Street would also need to be trimmed/removed (Attachment 5).
The costs associated with Option 4 are substantially more than Option 3. Approximate cost break downs are listed below:-
$20,000, Installation of Kerb and Signage to block of existing slip lane $30,000, Widening of the corner of Goondoon Street & Ferris Street to enable left hand turns $20,000 to $50,000 (and 18 month wait/delay) relocation of existing power pole with street light $30,000 Removal of existing slip lane and replace with topsoil.
o Existing slip lane could remain though there would be maintenance and safety issues associated with this.
$10,000 Storm Water Management (currently the stormwater flows down the slip lane) o May not be necessary if slip lane remains.
It should be noted that as part of the four (4) lane upgrade project for Glenlyon Road, the option of banning right hand turns into Ferris Street is being investigated, which would also reduce the number of vehicles using it as a bypass around the lights at Tank Street/Glenlyon Street.
Communication and Consultation (Internal / External):
This item has been discussed internally within Technical Services and with Road Services.

Legal and Policy Implications:
Nil
Financial and Resource Implications:
Option 3, splitter island on Goondoon Street (no additional lighting) could be completed using the 2013/2014 Road Services TEAC budget. The cost of all other options is too excessive to be covered, a special budgetary item would have to be created or included in the 2014/2015 budget.
Commentary:
Nil
Summary:
Nil
Attachments:
1. Traffic Data 2. Crash Data 3. Drawing No. 13-088-900 4. Drawing No. 13.088-901 5. Sight distance photo of corner lot shrubs
Briefing Note Originally Drafted by: Engineer - Planning (Traffic)
Date: 24 October 2013
SpeedStat-121 Page 1
MetroCount Traffic ExecutiveSpeed Statistics
SpeedStat-121 -- English (ENA)
Datasets:Site: [eden street] from glenlyon rd to dennis st opp no 49Direction: 8 - East bound A>B, West bound B>A. Lane: 2Survey Duration: 11:28 Thursday, 15 August 2013 => 11:15 Tuesday, 3 September 2013 Zone:File: eden street03Sep2013.EC2 (Plus)Identifier: DS14VW13 MC56-L5 [MC55] (c)Microcom 19Oct04Algorithm: Factory default (v3.21 - 15275)Data type: Axle sensors - Paired (Class/Speed/Count)
Profile:Filter time: 0:00 Friday, 16 August 2013 => 0:00 Monday, 26 August 2013 (With Exclusions)Exclusion: Vehicles are excluded at the following times:
Monday: 00:00-06:00, 18:00-00:00, Tuesday: 00:00-06:00, 18:00-00:00, Wednesday: 00:00-06:00, 18:00-00:00, Thursday: 00:00-06:00, 18:00-00:00, Friday: 00:00-06:00, 18:00-00:00, Saturday: 00:00-00:00, Sunday: 00:00-00:00, The following entire days are excluded:None
Included classes: 1, 2, 3, 4, 5, 6, 7, 8, 9, 10, 11, 12Speed range: 10 - 160 km/h.Direction: North, East, South, West (bound)Separation: Greater than 4.00 seconds. - (Headway)Name: SLR SpeedScheme: Vehicle classification (AustRoads94)Units: Metric (meter, kilometer, m/s, km/h, kg, tonne)In profile: Vehicles = 2692 / 5438 (49.50%)
SpeedStat-121 Page 1Attachment 1

SpeedStat-121 Page 2
Speed Statistics
SpeedStat-121Site: eden street.2.0EW Description: from glenlyon rd to dennis st opp no 49Filter time: 0:00 Friday, 16 August 2013 => 0:00 Monday, 26 August 2013 (With Exclusions)Scheme: Vehicle classification (AustRoads94)Filter: Cls(1 2 3 4 5 6 7 8 9 10 11 12 ) Dir(NESW) Sp(10,160) Headway(>4)
Vehicles = 2692Posted speed limit = 60 km/h, Exceeding = 14 (0.52%), Mean Exceeding = 63.15 km/hMaximum = 74.5 km/h, Minimum = 11.5 km/h, Mean = 40.3 km/h85% Speed = 47.9 km/h, 95% Speed = 52.2 km/h, Median = 40.3 km/h15 km/h Pace = 32 - 47, Number in Pace = 1867 (69.35%)Variance = 58.95, Standard Deviation = 7.68 km/h
Speed Bins
Speed | Bin | Below | Above | Energy | vMult | n * vMult 0 - 10 | 0 0.0% | 0 0.0% | 2692 100.0% | 0.00 | 0.00 | 0.00 10 - 20 | 28 1.0% | 28 1.0% | 2664 99.0% | 0.00 | 0.00 | 0.00 20 - 30 | 198 7.4% | 226 8.4% | 2466 91.6% | 0.00 | 0.00 | 0.00 30 - 40 | 1056 39.2% | 1282 47.6% | 1410 52.4% | 0.00 | 0.00 | 0.00 40 - 50 | 1157 43.0% | 2439 90.6% | 253 9.4% | 0.00 | 0.00 | 0.00 50 - 60 | 239 8.9% | 2678 99.5% | 14 0.5% | 0.00 | 0.00 | 0.00 60 - 70 | 13 0.5% | 2691 100.0% | 1 0.0% | 0.00 | 0.00 | 0.00 70 - 80 | 1 0.0% | 2692 100.0% | 0 0.0% | 0.00 | 0.00 | 0.00 80 - 90 | 0 0.0% | 2692 100.0% | 0 0.0% | 0.00 | 0.00 | 0.00 90 - 100 | 0 0.0% | 2692 100.0% | 0 0.0% | 0.00 | 0.00 | 0.00100 - 110 | 0 0.0% | 2692 100.0% | 0 0.0% | 0.00 | 0.00 | 0.00110 - 120 | 0 0.0% | 2692 100.0% | 0 0.0% | 0.00 | 0.00 | 0.00120 - 130 | 0 0.0% | 2692 100.0% | 0 0.0% | 0.00 | 0.00 | 0.00130 - 140 | 0 0.0% | 2692 100.0% | 0 0.0% | 0.00 | 0.00 | 0.00140 - 150 | 0 0.0% | 2692 100.0% | 0 0.0% | 0.00 | 0.00 | 0.00150 - 160 | 0 0.0% | 2692 100.0% | 0 0.0% | 0.00 | 0.00 | 0.00160 - 170 | 0 0.0% | 2692 100.0% | 0 0.0% | 0.00 | 0.00 | 0.00170 - 180 | 0 0.0% | 2692 100.0% | 0 0.0% | 0.00 | 0.00 | 0.00180 - 190 | 0 0.0% | 2692 100.0% | 0 0.0% | 0.00 | 0.00 | 0.00190 - 200 | 0 0.0% | 2692 100.0% | 0 0.0% | 0.00 | 0.00 | 0.00Total Speed Rating = 0.00Total Moving Energy (Estimated) = 0.00
Speed limit fields
| Limit | Below | Above 0 | 60 (PSL) | 2678 99.5% | 14 0.5%
SpeedStat-121 Page 2
VirtVehicleCount-119 Page 1
MetroCount Traffic ExecutiveVehicle Counts (Virtual Day)
VirtVehicleCount-119 -- English (ENA)
Datasets:Site: [eden street] from glenlyon rd to dennis st opp no 49Direction: 8 - East bound A>B, West bound B>A. Lane: 2Survey Duration: 11:28 Thursday, 15 August 2013 => 11:15 Tuesday, 3 September 2013 Zone:File: eden street03Sep2013.EC2 (Plus)Identifier: DS14VW13 MC56-L5 [MC55] (c)Microcom 19Oct04Algorithm: Factory default (v3.21 - 15275)Data type: Axle sensors - Paired (Class/Speed/Count)
Profile:Filter time: 0:00 Friday, 16 August 2013 => 0:00 Monday, 26 August 2013Included classes: 1, 2, 3, 4, 5, 6, 7, 8, 9, 10, 11, 12Speed range: 10 - 160 km/h.Direction: North, East, South, West (bound)Separation: All - (Headway)Name: Default ProfileScheme: Vehicle classification (AustRoads94)Units: Metric (meter, kilometer, m/s, km/h, kg, tonne)In profile: Vehicles = 4654 / 5438 (85.58%)
VirtVehicleCount-119 Page 1

VirtVehicleCount-119 Page 2
* Virtual Day - Total=465, 15 minute drops 0000 0100 0200 0300 0400 0500 0600 0700 0800 0900 1000 1100 1200 1300 1400 1500 1600 1700 1800 1900 2000 2100 2200 2300 2 2 1 1 2 4 6 18 33 31 35 36 39 31 32 34 42 44 31 17 10 9 4 3 0 1 1 0 0 1 1 3 6 9 9 9 9 7 8 8 9 10 8 5 3 2 1 1 1 1 0 0 0 1 1 6 8 9 10 11 11 9 7 9 10 14 8 5 3 2 1 1 1 0 0 1 1 1 2 5 8 7 9 8 9 9 8 9 11 10 8 4 2 2 1 0 0 0 0 1 1 1 3 4 11 7 8 8 10 6 9 8 12 10 7 4 3 3 1 0AM Peak 1030 - 1130 (37), AM PHF=0.83 PM Peak 1630 - 1730 (47), PM PHF=0.84
Numbers have been rounded to the nearest integer.
VirtVehicleCount-119 Page 2

VehicleCount-123 Page 1
MetroCount Traffic ExecutiveVehicle Counts
VehicleCount-123 -- English (ENA)
Datasets:Site: [ferris st slip lane] slip lane at intersection of ferris st and goondoon st on park sideDirection: 7 - North bound A>B, South bound B>A. Lane: 2Survey Duration: 10:37 Thursday, 15 August 2013 => 10:30 Tuesday, 3 September 2013 Zone:File: ferris st slip lane03Sep2013.EC2 (Plus)Identifier: N0064M46 MC56-L5 [MC55] (c)Microcom 19Oct04Algorithm: Factory default (v3.21 - 15275)Data type: Axle sensors - Paired (Class/Speed/Count)
Profile:Filter time: 0:00 Friday, 16 August 2013 => 0:00 Tuesday, 3 September 2013Included classes: 1, 2, 3, 4, 5, 6, 7, 8, 9, 10, 11, 12Speed range: 10 - 160 km/h.Direction: ABSeparation: All - (Headway)Name: Default ProfileScheme: Vehicle classification (AustRoads94)Units: Metric (meter, kilometer, m/s, km/h, kg, tonne)In profile: Vehicles = 20494 / 22032 (93.02%)
VehicleCount-123 Page 1

VehicleCount-123 Page 2
* Friday, 16 August 2013 - Total=1396, 15 minute drops 0000 0100 0200 0300 0400 0500 0600 0700 0800 0900 1000 1100 1200 1300 1400 1500 1600 1700 1800 1900 2000 2100 2200 2300 1 0 1 0 1 18 31 74 247 153 82 84 86 76 104 118 79 81 73 36 25 19 5 2 0 0 1 0 0 5 7 15 47 50 25 23 22 15 23 34 24 17 17 9 5 6 0 0 2 0 0 0 0 0 3 10 17 56 28 18 17 29 24 20 26 19 22 17 10 6 3 2 1 0 0 0 0 0 1 3 5 20 69 35 19 18 19 26 26 26 16 20 21 12 7 5 1 1 0 1 0 0 0 0 7 9 22 75 40 20 26 16 11 35 32 20 22 18 5 7 5 2 0 0AM Peak 0815 - 0915 (250), AM PHF=0.83 PM Peak 1430 - 1530 (121), PM PHF=0.86
* Saturday, 17 August 2013 - Total=826, 15 minute drops 0000 0100 0200 0300 0400 0500 0600 0700 0800 0900 1000 1100 1200 1300 1400 1500 1600 1700 1800 1900 2000 2100 2200 2300 2 5 1 0 1 9 15 18 79 73 75 95 63 54 51 53 40 57 65 29 17 17 4 3 2 1 1 0 0 2 7 5 12 17 18 21 18 13 15 17 11 17 22 8 4 2 0 1 0 0 2 0 0 1 3 4 3 18 20 19 21 10 15 16 17 7 8 19 7 4 6 1 1 1 0 2 0 0 0 2 1 3 23 18 16 22 20 18 12 10 13 13 15 5 4 5 3 1 0 0 0 0 0 0 2 3 7 26 18 22 31 15 8 8 9 9 19 9 9 5 4 0 0 1AM Peak 1100 - 1200 (95), AM PHF=0.77 PM Peak 1745 - 1845 (75), PM PHF=0.85
* Sunday, 18 August 2013 - Total=551, 15 minute drops 0000 0100 0200 0300 0400 0500 0600 0700 0800 0900 1000 1100 1200 1300 1400 1500 1600 1700 1800 1900 2000 2100 2200 2300 2 4 3 1 1 5 13 19 3 6 61 73 48 59 39 45 38 41 43 19 7 18 2 1 0 0 0 0 0 1 4 7 0 1 11 11 10 15 11 14 8 10 15 6 1 2 2 1 0 1 0 2 0 0 1 1 9 0 1 23 22 18 14 14 17 10 8 5 9 3 4 0 0 0 0 1 1 1 0 0 6 3 2 3 13 24 12 15 7 12 13 12 12 3 3 4 0 0 0 1 3 0 0 1 3 2 0 1 1 14 16 8 15 7 2 7 11 11 1 0 8 0 0 0AM Peak 1100 - 1200 (73), AM PHF=0.76 PM Peak 1300 - 1400 (59), PM PHF=0.98
* Monday, 19 August 2013 - Total=1343, 15 minute drops 0000 0100 0200 0300 0400 0500 0600 0700 0800 0900 1000 1100 1200 1300 1400 1500 1600 1700 1800 1900 2000 2100 2200 2300 0 0 0 1 1 13 25 93 238 129 111 73 85 89 99 119 94 71 52 26 11 12 1 0 0 0 0 0 0 5 11 19 33 41 19 24 21 27 30 32 30 18 16 7 1 3 0 0 0 0 0 0 1 0 1 6 12 67 39 36 21 23 18 23 29 24 23 14 6 3 5 0 0 1 0 0 0 0 0 2 6 26 80 26 32 11 20 23 26 29 26 15 16 7 5 2 1 0 1 0 0 0 0 1 5 2 36 58 23 24 17 21 21 20 29 14 15 6 6 2 2 0 0 0AM Peak 0815 - 0915 (246), AM PHF=0.77 PM Peak 1500 - 1600 (119), PM PHF=0.93
* Tuesday, 20 August 2013 - Total=1323, 15 minute drops 0000 0100 0200 0300 0400 0500 0600 0700 0800 0900 1000 1100 1200 1300 1400 1500 1600 1700 1800 1900 2000 2100 2200 2300 2 0 0 0 1 15 32 91 254 127 83 80 93 83 80 112 95 81 41 23 20 8 1 1 0 0 0 0 0 2 11 15 58 52 21 15 23 14 24 34 20 22 8 10 6 2 1 0 0 1 0 0 0 0 5 8 19 64 30 19 25 31 25 21 24 25 24 10 9 2 2 0 0 0 1 0 0 0 0 4 7 26 62 29 25 21 25 23 16 30 28 20 13 4 7 2 0 0 0 0 0 0 0 1 4 6 31 70 16 18 19 14 21 19 24 22 15 10 0 5 2 0 1 0AM Peak 0800 - 0900 (254), AM PHF=0.91 PM Peak 1500 - 1600 (112), PM PHF=0.82
* Wednesday, 21 August 2013 - Total=1319, 15 minute drops 0000 0100 0200 0300 0400 0500 0600 0700 0800 0900 1000 1100 1200 1300 1400 1500 1600 1700 1800 1900 2000 2100 2200 2300 0 0 0 1 2 18 35 88 258 121 79 72 76 64 111 126 81 64 56 37 21 7 1 1 0 0 0 0 1 4 5 24 55 51 20 13 21 10 21 28 17 17 20 16 9 4 0 0 0 0 0 0 0 0 5 10 19 63 24 22 20 29 15 30 32 20 17 11 9 4 1 0 1 0 0 0 0 0 0 1 11 25 80 26 17 22 17 19 23 41 23 15 14 9 5 1 1 0 0 0 0 0 1 1 8 9 20 60 20 20 17 9 20 37 25 21 15 11 3 3 1 0 0 0AM Peak 0800 - 0900 (258), AM PHF=0.81 PM Peak 1445 - 1545 (138), PM PHF=0.84
* Thursday, 22 August 2013 - Total=1334, 15 minute drops 0000 0100 0200 0300 0400 0500 0600 0700 0800 0900 1000 1100 1200 1300 1400 1500 1600 1700 1800 1900 2000 2100 2200 2300 0 1 0 0 1 16 30 81 246 123 83 78 92 87 84 121 73 70 72 40 16 16 2 2 0 0 0 0 0 4 9 13 43 39 20 15 19 17 19 31 10 16 17 15 7 7 1 1 1 0 0 0 0 0 4 5 17 57 42 25 18 36 21 15 41 14 26 16 11 4 3 0 0 0 0 0 0 0 0 1 10 26 69 21 16 25 15 27 16 30 25 11 21 5 1 4 0 1 0 0 1 0 0 1 7 6 25 77 21 22 20 22 22 34 19 24 17 18 9 4 2 1 0 1AM Peak 0800 - 0900 (246), AM PHF=0.80 PM Peak 1445 - 1545 (136), PM PHF=0.83
* Friday, 23 August 2013 - Total=1429, 15 minute drops 0000 0100 0200 0300 0400 0500 0600 0700 0800 0900 1000 1100 1200 1300 1400 1500 1600 1700 1800 1900 2000 2100 2200 2300 2 1 0 0 5 12 36 95 233 134 93 89 99 79 102 127 84 58 95 51 17 10 4 3 1 0 0 0 1 4 9 21 45 45 26 26 28 30 26 30 33 13 22 14 4 2 1 1 1 0 0 0 0 0 1 8 19 55 33 27 23 27 15 23 38 17 14 14 10 5 1 2 1 2 0 0 0 0 0 2 11 24 63 26 22 18 23 19 25 35 21 12 28 14 5 1 1 1 0 1 1 0 0 4 5 8 31 70 30 18 22 21 15 28 24 13 19 31 13 3 6 0 0 0AM Peak 0800 - 0900 (233), AM PHF=0.83 PM Peak 1445 - 1545 (131), PM PHF=0.86
* Saturday, 24 August 2013 - Total=886, 15 minute drops 0000 0100 0200 0300 0400 0500 0600 0700 0800 0900 1000 1100 1200 1300 1400 1500 1600 1700 1800 1900 2000 2100 2200 2300 3 2 1 0 1 16 14 26 73 76 93 101 64 53 51 58 55 40 82 38 9 9 17 4 1 0 0 0 0 7 3 5 22 19 30 36 25 20 10 16 11 9 34 17 6 3 2 0 1 2 1 1 0 0 2 5 9 22 21 21 25 10 11 11 16 16 10 22 11 1 0 6 3 1 0 1 0 0 0 2 2 7 15 24 21 20 13 12 12 11 13 6 14 5 2 3 6 0 1 0 0 0 0 1 5 4 5 14 12 21 20 16 10 18 15 15 15 12 5 0 3 3 1 0AM Peak 1030 - 1130 (103), AM PHF=0.72 PM Peak 1745 - 1845 (85), PM PHF=0.63
* Sunday, 25 August 2013 - Total=633, 15 minute drops 0000 0100 0200 0300 0400 0500 0600 0700 0800 0900 1000 1100 1200 1300 1400 1500 1600 1700 1800 1900 2000 2100 2200 2300 3 1 3 1 2 5 6 19 30 56 51 54 68 62 41 50 37 38 59 22 10 8 6 1 1 0 0 0 0 1 1 6 9 18 10 15 17 7 13 12 14 11 22 7 3 0 1 0 0 1 1 1 0 0 1 3 7 6 15 15 12 17 18 14 9 12 9 15 6 3 0 3 0 0 1 0 2 0 1 0 1 3 2 16 21 13 16 17 5 15 5 11 14 5 2 7 2 0 0 0 0 0 1 1 3 1 3 13 7 5 14 18 20 9 14 6 7 8 4 2 1 0 1 0AM Peak 1145 - 1245 (64), AM PHF=0.94 PM Peak 1200 - 1300 (68), PM PHF=0.94
VehicleCount-123 Page 2

VehicleCount-123 Page 3
* Monday, 26 August 2013 - Total=1260, 15 minute drops 0000 0100 0200 0300 0400 0500 0600 0700 0800 0900 1000 1100 1200 1300 1400 1500 1600 1700 1800 1900 2000 2100 2200 2300 0 1 0 0 2 15 29 96 232 144 73 82 83 69 75 110 68 75 65 23 11 5 0 2 0 0 0 0 0 5 10 19 38 48 18 21 18 23 25 31 18 22 16 9 3 2 0 0 0 0 0 0 0 0 1 5 17 55 32 24 26 25 16 16 36 22 22 20 8 3 1 0 1 0 0 1 0 0 0 3 4 26 73 36 17 18 23 16 16 23 10 12 20 3 2 2 0 1 1 0 0 0 0 2 6 10 34 66 28 14 17 17 14 18 20 18 19 9 3 3 0 0 0 0AM Peak 0815 - 0915 (242), AM PHF=0.83 PM Peak 1500 - 1600 (110), PM PHF=0.76
* Tuesday, 27 August 2013 - Total=1375, 15 minute drops 0000 0100 0200 0300 0400 0500 0600 0700 0800 0900 1000 1100 1200 1300 1400 1500 1600 1700 1800 1900 2000 2100 2200 2300 1 0 0 0 3 20 30 101 263 130 82 82 103 80 86 117 70 89 63 31 12 8 3 1 0 0 0 0 0 2 6 20 45 50 27 18 27 20 23 25 16 21 14 9 3 0 2 0 0 0 0 0 0 0 5 8 21 61 38 9 22 28 20 17 28 21 20 16 10 1 4 0 1 0 1 0 0 0 0 5 8 22 81 25 16 28 21 19 19 40 17 24 16 11 4 1 0 0 1 0 0 0 0 3 8 8 38 76 17 30 14 27 21 27 24 16 24 17 1 4 3 1 0 0AM Peak 0815 - 0915 (268), AM PHF=0.83 PM Peak 1445 - 1545 (120), PM PHF=0.75
* Wednesday, 28 August 2013 - Total=1352, 15 minute drops 0000 0100 0200 0300 0400 0500 0600 0700 0800 0900 1000 1100 1200 1300 1400 1500 1600 1700 1800 1900 2000 2100 2200 2300 1 0 0 0 1 19 42 100 248 121 94 76 93 69 101 112 93 64 64 27 15 10 1 1 0 0 0 0 0 4 13 14 54 48 22 14 26 16 21 44 20 24 23 13 9 2 0 0 1 0 0 0 0 1 4 8 26 57 35 22 15 20 18 25 25 21 14 16 5 2 4 1 0 0 1 0 0 0 0 6 10 24 67 14 26 23 25 19 23 21 25 12 14 6 1 3 0 1 0 0 0 0 0 0 5 11 36 70 24 24 24 22 16 32 22 27 14 11 3 3 1 0 0 0AM Peak 0800 - 0900 (248), AM PHF=0.89 PM Peak 1415 - 1515 (124), PM PHF=0.70
* Thursday, 29 August 2013 - Total=1401, 15 minute drops 0000 0100 0200 0300 0400 0500 0600 0700 0800 0900 1000 1100 1200 1300 1400 1500 1600 1700 1800 1900 2000 2100 2200 2300 1 1 0 0 1 24 27 84 243 141 106 87 83 74 84 138 94 65 70 37 25 11 4 1 1 0 0 0 0 4 7 15 51 54 28 32 20 21 19 29 21 21 25 14 8 6 1 1 0 0 1 0 0 0 5 5 15 56 33 23 16 29 17 23 47 32 18 14 10 5 3 2 0 0 0 0 0 0 1 7 5 26 73 21 23 20 15 14 22 36 22 11 15 4 7 1 1 0 0 0 0 0 0 0 8 10 28 63 33 32 19 19 22 20 26 19 15 16 9 5 1 0 0 0AM Peak 0815 - 0915 (246), AM PHF=0.84 PM Peak 1500 - 1600 (138), PM PHF=0.73
* Friday, 30 August 2013 - Total=1351, 15 minute drops 0000 0100 0200 0300 0400 0500 0600 0700 0800 0900 1000 1100 1200 1300 1400 1500 1600 1700 1800 1900 2000 2100 2200 2300 0 0 1 0 0 20 30 77 241 116 106 89 77 87 82 114 91 82 67 43 12 9 6 1 0 0 1 0 0 5 7 10 35 46 33 22 19 21 14 32 26 24 21 12 4 2 2 1 0 0 0 0 0 0 6 5 21 61 27 30 16 22 25 27 22 25 21 15 9 2 3 1 0 0 0 0 0 0 0 3 9 21 82 18 22 23 18 19 11 31 26 12 14 15 4 0 3 0 1 0 0 0 0 0 6 9 25 63 25 21 28 18 22 30 29 14 25 17 7 2 4 0 0 0AM Peak 0815 - 0915 (252), AM PHF=0.77 PM Peak 1445 - 1545 (115), PM PHF=0.90
* Saturday, 31 August 2013 - Total=812, 15 minute drops 0000 0100 0200 0300 0400 0500 0600 0700 0800 0900 1000 1100 1200 1300 1400 1500 1600 1700 1800 1900 2000 2100 2200 2300 1 1 1 0 1 7 17 23 73 86 87 80 75 59 45 38 36 54 61 28 14 14 7 4 0 0 0 0 0 2 5 8 12 25 25 22 23 19 12 5 8 11 10 11 1 5 1 0 1 0 0 0 0 0 1 3 6 21 18 25 23 25 7 10 12 8 17 19 13 1 1 3 1 0 1 1 0 0 1 3 3 2 25 20 21 26 15 18 10 11 10 12 15 4 2 5 2 1 0 0 0 1 0 0 1 6 7 15 23 16 9 12 15 13 10 10 14 17 0 10 3 1 2 0AM Peak 0945 - 1045 (94), AM PHF=0.94 PM Peak 1200 - 1300 (75), PM PHF=0.75
* Sunday, 1 September 2013 - Total=567, 15 minute drops 0000 0100 0200 0300 0400 0500 0600 0700 0800 0900 1000 1100 1200 1300 1400 1500 1600 1700 1800 1900 2000 2100 2200 2300 1 3 2 0 2 7 11 32 32 50 54 56 57 45 29 39 32 42 45 14 4 6 3 1 1 0 0 0 0 0 0 10 3 12 8 9 16 12 9 12 10 14 15 9 1 0 2 0 0 0 1 1 0 1 1 4 15 12 18 18 11 12 16 4 5 11 7 13 1 0 0 0 1 0 0 2 0 0 1 5 2 3 5 10 8 13 15 8 7 13 5 13 9 4 0 5 1 0 0 0 0 1 0 0 1 5 4 12 10 20 23 14 9 9 9 6 8 8 0 3 1 0 0 0AM Peak 1145 - 1245 (66), AM PHF=0.72 PM Peak 1200 - 1300 (57), PM PHF=0.89
* Monday, 2 September 2013 - Total=1336, 15 minute drops 0000 0100 0200 0300 0400 0500 0600 0700 0800 0900 1000 1100 1200 1300 1400 1500 1600 1700 1800 1900 2000 2100 2200 2300 0 1 1 0 5 16 29 82 258 123 91 71 91 77 88 130 85 68 60 36 11 8 4 1 0 0 0 0 1 2 12 14 51 42 19 21 21 18 24 29 20 18 19 12 3 1 3 1 - 0 0 0 0 0 2 3 16 59 33 23 17 23 24 17 39 31 20 11 15 3 3 0 0 - 0 0 0 0 2 2 5 20 81 26 30 12 24 17 22 34 19 18 15 7 3 1 0 0 - 0 1 1 0 2 10 9 32 67 22 19 21 23 18 25 28 15 12 15 2 2 3 1 0 -AM Peak 0800 - 0900 (258), AM PHF=0.80
VehicleCount-123 Page 3
VehicleCount-124 Page 1
MetroCount Traffic ExecutiveVehicle Counts
VehicleCount-124 -- English (ENA)
Datasets:Site: [ferris st slip lane] slip lane at intersection of ferris st and goondoon st on park sideDirection: 7 - North bound A>B, South bound B>A. Lane: 2Survey Duration: 10:37 Thursday, 15 August 2013 => 10:30 Tuesday, 3 September 2013 Zone:File: ferris st slip lane03Sep2013.EC2 (Plus)Identifier: N0064M46 MC56-L5 [MC55] (c)Microcom 19Oct04Algorithm: Factory default (v3.21 - 15275)Data type: Axle sensors - Paired (Class/Speed/Count)
Profile:Filter time: 0:00 Friday, 16 August 2013 => 0:00 Tuesday, 3 September 2013Included classes: 1, 2, 3, 4, 5, 6, 7, 8, 9, 10, 11, 12Speed range: 10 - 160 km/h.Direction: BASeparation: All - (Headway)Name: Default ProfileScheme: Vehicle classification (AustRoads94)Units: Metric (meter, kilometer, m/s, km/h, kg, tonne)In profile: Vehicles = 65 / 22032 (0.30%)
VehicleCount-124 Page 1

VehicleCount-124 Page 2
* Friday, 16 August 2013 - Total=1, 15 minute drops 0000 0100 0200 0300 0400 0500 0600 0700 0800 0900 1000 1100 1200 1300 1400 1500 1600 1700 1800 1900 2000 2100 2200 2300 0 0 0 0 0 0 0 0 0 0 0 0 0 0 0 0 0 1 0 0 0 0 0 0 0 0 0 0 0 0 0 0 0 0 0 0 0 0 0 0 0 0 0 0 0 0 0 0 0 0 0 0 0 0 0 0 0 0 0 0 0 0 0 0 0 0 0 0 0 0 0 0 0 0 0 0 0 0 0 0 0 0 0 0 0 0 0 0 0 0 0 1 0 0 0 0 0 0 0 0 0 0 0 0 0 0 0 0 0 0 0 0 0 0 0 0 0 0 0 0 0 0 0 0AM Peak 0000 - 0100 (0), AM PHF=1.00 PM Peak 1645 - 1745 (1), PM PHF=0.25
* Saturday, 17 August 2013 - Total=1, 15 minute drops 0000 0100 0200 0300 0400 0500 0600 0700 0800 0900 1000 1100 1200 1300 1400 1500 1600 1700 1800 1900 2000 2100 2200 2300 0 0 0 0 0 0 0 0 0 0 0 0 1 0 0 0 0 0 0 0 0 0 0 0 0 0 0 0 0 0 0 0 0 0 0 0 0 0 0 0 0 0 0 0 0 0 0 0 0 0 0 0 0 0 0 0 0 0 0 0 0 0 0 0 0 0 0 0 0 0 0 0 0 0 0 0 0 0 0 0 0 0 0 0 0 0 0 0 0 0 0 0 0 0 0 0 0 0 0 0 0 0 0 0 0 0 0 0 0 0 0 1 0 0 0 0 0 0 0 0 0 0 0 0AM Peak 0000 - 0100 (0), AM PHF=1.00 PM Peak 1200 - 1300 (1), PM PHF=0.25
* Sunday, 18 August 2013 - Total=13, 15 minute drops 0000 0100 0200 0300 0400 0500 0600 0700 0800 0900 1000 1100 1200 1300 1400 1500 1600 1700 1800 1900 2000 2100 2200 2300 0 0 0 0 0 0 0 0 3 2 8 0 0 0 0 0 0 0 0 0 0 0 0 0 0 0 0 0 0 0 0 0 0 0 8 0 0 0 0 0 0 0 0 0 0 0 0 0 0 0 0 0 0 0 0 0 0 1 0 0 0 0 0 0 0 0 0 0 0 0 0 0 0 0 0 0 0 0 0 0 0 0 0 1 0 0 0 0 0 0 0 0 0 0 0 0 0 0 0 0 0 0 0 0 0 0 0 2 1 0 0 0 0 0 0 0 0 0 0 0 0 0 0 0AM Peak 0915 - 1015 (10), AM PHF=0.31 PM Peak 1200 - 1300 (0), PM PHF=1.00
* Monday, 19 August 2013 - Total=5, 15 minute drops 0000 0100 0200 0300 0400 0500 0600 0700 0800 0900 1000 1100 1200 1300 1400 1500 1600 1700 1800 1900 2000 2100 2200 2300 0 0 0 0 0 0 0 0 0 0 0 0 1 0 1 1 0 1 0 0 0 0 1 0 0 0 0 0 0 0 0 0 0 0 0 0 0 0 0 0 0 0 0 0 0 0 0 0 0 0 0 0 0 0 0 0 0 0 0 0 0 0 0 1 1 0 0 0 0 0 0 0 0 0 0 0 0 0 0 0 0 0 0 0 0 0 1 0 0 0 0 0 0 0 0 0 1 0 0 0 0 0 0 0 0 0 0 0 0 0 0 0 0 0 0 0 1 0 0 0 0 0 0 0AM Peak 1145 - 1245 (1), AM PHF=0.25 PM Peak 1200 - 1300 (1), PM PHF=0.25
* Tuesday, 20 August 2013 - Total=2, 15 minute drops 0000 0100 0200 0300 0400 0500 0600 0700 0800 0900 1000 1100 1200 1300 1400 1500 1600 1700 1800 1900 2000 2100 2200 2300 0 0 0 0 0 0 0 0 0 0 0 0 0 0 0 0 0 2 0 0 0 0 0 0 0 0 0 0 0 0 0 0 0 0 0 0 0 0 0 0 0 0 0 0 0 0 0 0 0 0 0 0 0 0 0 0 0 0 0 0 0 0 0 0 0 0 0 0 0 0 0 0 0 0 0 0 0 0 0 0 0 0 0 0 0 0 0 0 0 0 0 1 0 0 0 0 0 0 0 0 0 0 0 0 0 0 0 0 0 0 0 0 0 0 0 0 1 0 0 0 0 0 0 0AM Peak 0000 - 0100 (0), AM PHF=1.00 PM Peak 1700 - 1800 (2), PM PHF=0.50
* Wednesday, 21 August 2013 - Total=3, 15 minute drops 0000 0100 0200 0300 0400 0500 0600 0700 0800 0900 1000 1100 1200 1300 1400 1500 1600 1700 1800 1900 2000 2100 2200 2300 0 0 0 0 0 0 0 0 0 1 0 0 0 0 0 1 0 1 0 0 0 0 0 0 0 0 0 0 0 0 0 0 0 0 0 0 0 0 0 0 0 0 0 0 0 0 0 0 0 0 0 0 0 0 0 0 0 0 0 0 0 0 0 0 0 0 0 0 0 0 0 0 0 0 0 0 0 0 0 0 0 0 0 0 0 0 0 0 0 1 0 0 0 0 0 0 0 0 0 0 0 0 0 0 0 0 0 0 1 0 0 0 0 0 0 0 1 0 0 0 0 0 0 0AM Peak 0900 - 1000 (1), AM PHF=0.25 PM Peak 1445 - 1545 (1), PM PHF=0.25
* Thursday, 22 August 2013 - Total=5, 15 minute drops 0000 0100 0200 0300 0400 0500 0600 0700 0800 0900 1000 1100 1200 1300 1400 1500 1600 1700 1800 1900 2000 2100 2200 2300 0 0 0 0 0 0 0 0 3 0 0 0 0 0 0 0 1 1 0 0 0 0 0 0 0 0 0 0 0 0 0 0 0 0 0 0 0 0 0 0 0 0 0 0 0 0 0 0 0 0 0 0 0 0 0 0 0 0 0 0 0 0 0 0 0 1 0 0 0 0 0 0 0 0 0 0 0 0 0 0 0 0 3 0 0 0 0 0 0 0 0 0 0 0 0 0 0 0 0 0 0 0 0 0 0 0 0 0 0 0 0 0 0 0 0 0 1 0 0 0 0 0 0 0AM Peak 0745 - 0845 (3), AM PHF=0.25 PM Peak 1530 - 1630 (1), PM PHF=0.25
* Friday, 23 August 2013 - Total=5, 15 minute drops 0000 0100 0200 0300 0400 0500 0600 0700 0800 0900 1000 1100 1200 1300 1400 1500 1600 1700 1800 1900 2000 2100 2200 2300 0 0 0 0 0 0 0 0 0 0 0 0 1 0 1 2 0 1 0 0 0 0 0 0 0 0 0 0 0 0 0 0 0 0 0 0 0 0 0 0 0 0 0 0 0 0 0 0 0 0 0 0 0 0 0 0 0 0 0 0 0 1 0 0 0 0 0 0 0 0 0 0 0 0 0 0 0 0 0 0 0 0 0 0 0 0 0 0 0 2 0 0 0 0 0 0 0 0 0 0 0 0 0 0 0 0 0 0 0 0 0 0 0 1 0 0 1 0 0 0 0 0 0 0AM Peak 1130 - 1230 (1), AM PHF=0.25 PM Peak 1445 - 1545 (3), PM PHF=0.38
* Saturday, 24 August 2013 - Total=1, 15 minute drops 0000 0100 0200 0300 0400 0500 0600 0700 0800 0900 1000 1100 1200 1300 1400 1500 1600 1700 1800 1900 2000 2100 2200 2300 0 0 0 0 0 0 0 0 0 0 0 0 0 1 0 0 0 0 0 0 0 0 0 0 0 0 0 0 0 0 0 0 0 0 0 0 0 0 0 0 0 0 0 0 0 0 0 0 0 0 0 0 0 0 0 0 0 0 0 0 0 0 0 0 0 0 0 0 0 0 0 0 0 0 0 0 0 0 0 0 0 0 0 0 0 0 0 1 0 0 0 0 0 0 0 0 0 0 0 0 0 0 0 0 0 0 0 0 0 0 0 0 0 0 0 0 0 0 0 0 0 0 0 0AM Peak 0000 - 0100 (0), AM PHF=1.00 PM Peak 1245 - 1345 (1), PM PHF=0.25
* Sunday, 25 August 2013 - Total=2, 15 minute drops 0000 0100 0200 0300 0400 0500 0600 0700 0800 0900 1000 1100 1200 1300 1400 1500 1600 1700 1800 1900 2000 2100 2200 2300 0 0 0 0 0 0 0 0 0 0 2 0 0 0 0 0 0 0 0 0 0 0 0 0 0 0 0 0 0 0 0 0 0 0 1 0 0 0 0 0 0 0 0 0 0 0 0 0 0 0 0 0 0 0 0 0 0 0 0 0 0 0 0 0 0 0 0 0 0 0 0 0 0 0 0 0 0 0 0 0 0 0 0 0 0 0 0 0 0 0 0 0 0 0 0 0 0 0 0 0 0 0 0 0 0 0 0 0 0 1 0 0 0 0 0 0 0 0 0 0 0 0 0 0AM Peak 1000 - 1100 (2), AM PHF=0.50 PM Peak 1200 - 1300 (0), PM PHF=1.00
VehicleCount-124 Page 2

VehicleCount-124 Page 3
* Monday, 26 August 2013 - Total=6, 15 minute drops 0000 0100 0200 0300 0400 0500 0600 0700 0800 0900 1000 1100 1200 1300 1400 1500 1600 1700 1800 1900 2000 2100 2200 2300 0 0 0 0 0 0 0 1 0 0 0 0 0 0 1 0 0 4 0 0 0 0 0 0 0 0 0 0 0 0 0 1 0 0 0 0 0 0 1 0 0 0 0 0 0 0 0 0 0 0 0 0 0 0 0 0 0 0 0 0 0 0 0 0 0 0 1 0 0 0 0 0 0 0 0 0 0 0 0 0 0 0 0 0 0 0 0 0 0 0 0 1 0 0 0 0 0 0 0 0 0 0 0 0 0 0 0 0 0 0 0 0 0 0 0 0 2 0 0 0 0 0 0 0AM Peak 0615 - 0715 (1), AM PHF=0.25 PM Peak 1700 - 1800 (4), PM PHF=0.50
* Tuesday, 27 August 2013 - Total=6, 15 minute drops 0000 0100 0200 0300 0400 0500 0600 0700 0800 0900 1000 1100 1200 1300 1400 1500 1600 1700 1800 1900 2000 2100 2200 2300 0 0 0 1 0 0 0 0 0 1 0 1 0 0 0 0 1 1 0 1 0 0 0 0 0 0 0 1 0 0 0 0 0 0 0 0 0 0 0 0 0 0 0 0 0 0 0 0 0 0 0 0 0 0 0 0 0 0 0 0 0 0 0 0 0 1 0 0 0 0 0 0 0 0 0 0 0 0 0 0 0 0 0 1 0 1 0 0 0 0 0 0 0 1 0 0 0 0 0 0 0 0 0 0 0 0 0 0 0 0 0 0 0 0 0 0 1 0 0 0 0 0 0 0AM Peak 0215 - 0315 (1), AM PHF=0.25 PM Peak 1530 - 1630 (1), PM PHF=0.25
* Wednesday, 28 August 2013 - Total=1, 15 minute drops 0000 0100 0200 0300 0400 0500 0600 0700 0800 0900 1000 1100 1200 1300 1400 1500 1600 1700 1800 1900 2000 2100 2200 2300 0 0 0 0 0 0 0 0 0 0 0 0 0 0 0 0 0 1 0 0 0 0 0 0 0 0 0 0 0 0 0 0 0 0 0 0 0 0 0 0 0 0 0 0 0 0 0 0 0 0 0 0 0 0 0 0 0 0 0 0 0 0 0 0 0 0 0 0 0 0 0 0 0 0 0 0 0 0 0 0 0 0 0 0 0 0 0 0 0 0 0 1 0 0 0 0 0 0 0 0 0 0 0 0 0 0 0 0 0 0 0 0 0 0 0 0 0 0 0 0 0 0 0 0AM Peak 0000 - 0100 (0), AM PHF=1.00 PM Peak 1645 - 1745 (1), PM PHF=0.25
* Thursday, 29 August 2013 - Total=3, 15 minute drops 0000 0100 0200 0300 0400 0500 0600 0700 0800 0900 1000 1100 1200 1300 1400 1500 1600 1700 1800 1900 2000 2100 2200 2300 0 0 0 0 0 0 0 0 0 0 0 0 0 0 0 0 2 1 0 0 0 0 0 0 0 0 0 0 0 0 0 0 0 0 0 0 0 0 0 0 0 0 0 0 0 0 0 0 0 0 0 0 0 0 0 0 0 0 0 0 0 0 0 0 0 1 0 0 0 0 0 0 0 0 0 0 0 0 0 0 0 0 0 0 0 0 0 0 0 0 0 0 0 0 0 0 0 0 0 0 0 0 0 0 0 0 0 0 0 0 0 0 0 0 0 1 1 0 0 0 0 0 0 0AM Peak 0000 - 0100 (0), AM PHF=1.00 PM Peak 1600 - 1700 (2), PM PHF=0.50
* Friday, 30 August 2013 - Total=2, 15 minute drops 0000 0100 0200 0300 0400 0500 0600 0700 0800 0900 1000 1100 1200 1300 1400 1500 1600 1700 1800 1900 2000 2100 2200 2300 0 0 0 0 0 0 0 0 0 0 0 0 0 0 0 0 0 1 0 0 0 0 1 0 0 0 0 0 0 0 0 0 0 0 0 0 0 0 0 0 0 0 0 0 0 0 0 0 0 0 0 0 0 0 0 0 0 0 0 0 0 0 0 0 0 0 0 0 0 0 0 0 0 0 0 0 0 0 0 0 0 0 0 0 0 0 0 0 0 0 0 0 0 0 0 0 1 0 0 0 0 0 0 0 0 0 0 0 0 0 0 0 0 0 0 0 1 0 0 0 0 0 0 0AM Peak 0000 - 0100 (0), AM PHF=1.00 PM Peak 1700 - 1800 (1), PM PHF=0.25
* Saturday, 31 August 2013 - Total=4, 15 minute drops 0000 0100 0200 0300 0400 0500 0600 0700 0800 0900 1000 1100 1200 1300 1400 1500 1600 1700 1800 1900 2000 2100 2200 2300 0 0 0 0 0 0 0 0 0 0 0 0 1 1 1 0 1 0 0 0 0 0 0 0 0 0 0 0 0 0 0 0 0 0 0 0 0 0 1 0 0 0 0 0 0 0 0 0 0 0 0 0 0 0 0 0 0 0 0 0 0 0 0 0 0 0 0 0 0 0 0 0 0 0 0 0 0 0 0 0 0 0 0 0 0 0 0 1 0 0 1 0 0 0 0 0 0 0 0 0 0 0 0 0 0 0 0 0 0 0 0 1 0 0 0 0 0 0 0 0 0 0 0 0AM Peak 0000 - 0100 (0), AM PHF=1.00 PM Peak 1245 - 1345 (2), PM PHF=0.50
* Sunday, 1 September 2013 - Total=3, 15 minute drops 0000 0100 0200 0300 0400 0500 0600 0700 0800 0900 1000 1100 1200 1300 1400 1500 1600 1700 1800 1900 2000 2100 2200 2300 0 0 0 0 0 0 0 0 0 0 0 0 0 1 0 0 2 0 0 0 0 0 0 0 0 0 0 0 0 0 0 0 0 0 0 0 0 0 0 0 1 0 0 0 0 0 0 0 0 0 0 0 0 0 0 0 0 0 0 0 0 0 0 0 0 1 0 0 0 0 0 0 0 0 0 0 0 0 0 0 0 0 0 0 0 0 0 1 0 0 0 0 0 0 0 0 0 0 0 0 0 0 0 0 0 0 0 0 0 0 0 0 0 0 0 0 0 0 0 0 0 0 0 0AM Peak 0000 - 0100 (0), AM PHF=1.00 PM Peak 1530 - 1630 (2), PM PHF=0.50
* Monday, 2 September 2013 - Total=2, 15 minute drops 0000 0100 0200 0300 0400 0500 0600 0700 0800 0900 1000 1100 1200 1300 1400 1500 1600 1700 1800 1900 2000 2100 2200 2300 0 0 0 0 0 0 0 0 0 0 1 0 0 0 0 0 0 0 0 0 1 0 0 0 0 0 0 0 0 0 0 0 0 0 1 0 0 0 0 0 0 0 0 0 0 0 0 0 - 0 0 0 0 0 0 0 0 0 0 0 0 0 0 0 0 0 0 0 0 0 0 0 0 - 0 0 0 0 0 0 0 0 0 0 0 0 0 0 0 0 0 0 0 0 1 0 0 0 - 0 0 0 0 0 0 0 0 0 0 0 0 0 0 0 0 0 0 0 0 0 0 0 0 -AM Peak 0915 - 1015 (1), AM PHF=0.25
VehicleCount-124 Page 3

SpeedStat-141 Page 1
MetroCount Traffic ExecutiveSpeed Statistics
SpeedStat-141 -- English (ENA)
Datasets: Site: [ferris st slip lane] slip lane at intersection of ferris st and goondoon st on park sideDirection: 7 - North bound A>B, South bound B>A. Lane: 2Survey Duration: 10:37 Thursday, 15 August 2013 => 10:30 Tuesday, 3 September 2013 Zone:File: ferris st slip lane03Sep2013.EC2 (Plus)Identifier: N0064M46 MC56-L5 [MC55] (c)Microcom 19Oct04Algorithm: Factory default (v3.21 - 15275)Data type: Axle sensors - Paired (Class/Speed/Count)
Profile:Filter time: 0:00 Friday, 16 August 2013 => 0:00 Tuesday, 3 September 2013 (With Exclusions)Exclusion: Vehicles are excluded at the following times:
Monday: 00:00-06:00, 18:00-00:00, Tuesday: 00:00-06:00, 18:00-00:00, Wednesday: 00:00-06:00, 18:00-00:00, Thursday: 00:00-06:00, 18:00-00:00, Friday: 00:00-06:00, 18:00-00:00, Saturday: 00:00-00:00, Sunday: 00:00-00:00, The following entire days are excluded:Sunday, 18 August 2013
Included classes: 1, 2, 3, 4, 5, 6, 7, 8, 9, 10, 11, 12Speed range: 10 - 160 km/h.Direction: BA Separation: Greater than 4.00 seconds. - (Headway)Name: SLR SpeedScheme: Vehicle classification (AustRoads94)Units: Metric (meter, kilometer, m/s, km/h, kg, tonne)In profile: Vehicles = 31 / 22032 (0.14%)
SpeedStat-141 Page 1

SpeedStat-141 Page 2
Speed Statistics SpeedStat-141Site: ferris st slip lane.2.0NS Description: slip lane at intersection of ferris st and goondoon st on park sideFilter time: 0:00 Friday, 16 August 2013 => 0:00 Tuesday, 3 September 2013 (With Exclusions)Scheme: Vehicle classification (AustRoads94)Filter: Cls(1 2 3 4 5 6 7 8 9 10 11 12 ) Dir(BA) Sp(10,160) Headway(>4)
Vehicles = 31Posted speed limit = 60 km/h, Exceeding = 0 (0.00%), Mean Exceeding = 0.00 km/hMaximum = 58.2 km/h, Minimum = 16.1 km/h, Mean = 23.3 km/h85% Speed = 25.2 km/h, 95% Speed = 34.2 km/h, Median = 20.5 km/h15 km/h Pace = 12 - 27, Number in Pace = 28 (90.32%)Variance = 85.11, Standard Deviation = 9.23 km/h
Speed Bins
Speed | Bin | Below | Above | Energy | vMult | n * vMult 0 - 10 | 0 0.0% | 0 0.0% | 31 100.0% | 0.00 | 0.00 | 0.00 10 - 20 | 13 41.9% | 13 41.9% | 18 58.1% | 0.00 | 0.00 | 0.00 20 - 30 | 15 48.4% | 28 90.3% | 3 9.7% | 0.00 | 0.00 | 0.00 30 - 40 | 1 3.2% | 29 93.5% | 2 6.5% | 0.00 | 0.00 | 0.00 40 - 50 | 0 0.0% | 29 93.5% | 2 6.5% | 0.00 | 0.00 | 0.00 50 - 60 | 2 6.5% | 31 100.0% | 0 0.0% | 0.00 | 0.00 | 0.00 60 - 70 | 0 0.0% | 31 100.0% | 0 0.0% | 0.00 | 0.00 | 0.00 70 - 80 | 0 0.0% | 31 100.0% | 0 0.0% | 0.00 | 0.00 | 0.00 80 - 90 | 0 0.0% | 31 100.0% | 0 0.0% | 0.00 | 0.00 | 0.00 90 - 100 | 0 0.0% | 31 100.0% | 0 0.0% | 0.00 | 0.00 | 0.00100 - 110 | 0 0.0% | 31 100.0% | 0 0.0% | 0.00 | 0.00 | 0.00110 - 120 | 0 0.0% | 31 100.0% | 0 0.0% | 0.00 | 0.00 | 0.00120 - 130 | 0 0.0% | 31 100.0% | 0 0.0% | 0.00 | 0.00 | 0.00130 - 140 | 0 0.0% | 31 100.0% | 0 0.0% | 0.00 | 0.00 | 0.00140 - 150 | 0 0.0% | 31 100.0% | 0 0.0% | 0.00 | 0.00 | 0.00150 - 160 | 0 0.0% | 31 100.0% | 0 0.0% | 0.00 | 0.00 | 0.00160 - 170 | 0 0.0% | 31 100.0% | 0 0.0% | 0.00 | 0.00 | 0.00170 - 180 | 0 0.0% | 31 100.0% | 0 0.0% | 0.00 | 0.00 | 0.00180 - 190 | 0 0.0% | 31 100.0% | 0 0.0% | 0.00 | 0.00 | 0.00190 - 200 | 0 0.0% | 31 100.0% | 0 0.0% | 0.00 | 0.00 | 0.00Total Speed Rating = 0.00Total Moving Energy (Estimated) = 0.00
Speed limit fields
| Limit | Below | Above 0 | 60 (PSL) | 31 100.0% | 0 0.0%
SpeedStat-141 Page 2

SpeedStat-126 Page 1
MetroCount Traffic ExecutiveSpeed Statistics
SpeedStat-126 -- English (ENA)
Datasets:Site: [ferris street] from dennis st to goondoon st opp no 4Direction: 6 - West bound A>B, East bound B>A. Lane: 0Survey Duration: 10:13 Thursday, 15 August 2013 => 10:13 Tuesday, 3 September 2013 Zone:File: ferris street03Sep2013.EC0 (Plus)Identifier: FG34SCAC MC56-L5 [MC55] (c)Microcom 19Oct04Algorithm: Factory default (v3.21 - 15275)Data type: Axle sensors - Paired (Class/Speed/Count)
Profile:Filter time: 0:00 Friday, 16 August 2013 => 0:00 Tuesday, 3 September 2013 (With Exclusions)Exclusion: Vehicles are excluded at the following times:
Monday: 00:00-06:00, 18:00-00:00, Tuesday: 00:00-06:00, 18:00-00:00, Wednesday: 00:00-06:00, 18:00-00:00, Thursday: 00:00-06:00, 18:00-00:00, Friday: 00:00-06:00, 18:00-00:00, Saturday: 00:00-00:00, Sunday: 00:00-00:00, The following entire days are excluded:None
Included classes: 1, 2, 3, 4, 5, 6, 7, 8, 9, 10, 11, 12Speed range: 10 - 160 km/h.Direction: North, East, South, West (bound)Separation: Greater than 4.00 seconds. - (Headway)Name: SLR SpeedScheme: Vehicle classification (AustRoads94)Units: Metric (meter, kilometer, m/s, km/h, kg, tonne)In profile: Vehicles = 10841 / 19844 (54.63%)
SpeedStat-126 Page 1

SpeedStat-126 Page 2
Speed Statistics
SpeedStat-126Site: ferris street.0.0WE Description: from dennis st to goondoon st opp no 4Filter time: 0:00 Friday, 16 August 2013 => 0:00 Tuesday, 3 September 2013 (With Exclusions)Scheme: Vehicle classification (AustRoads94)Filter: Cls(1 2 3 4 5 6 7 8 9 10 11 12 ) Dir(NESW) Sp(10,160) Headway(>4)
Vehicles = 10841Posted speed limit = 60 km/h, Exceeding = 85 (0.78%), Mean Exceeding = 63.63 km/hMaximum = 79.1 km/h, Minimum = 10.2 km/h, Mean = 44.0 km/h85% Speed = 50.0 km/h, 95% Speed = 53.6 km/h, Median = 44.3 km/h15 km/h Pace = 37 - 52, Number in Pace = 8655 (79.84%)Variance = 45.35, Standard Deviation = 6.73 km/h
Speed Bins
Speed | Bin | Below | Above | Energy | vMult | n * vMult 0 - 10 | 0 0.0% | 0 0.0% | 10841 100.0% | 0.00 | 0.00 | 0.00 10 - 20 | 52 0.5% | 52 0.5% | 10789 99.5% | 0.00 | 0.00 | 0.00 20 - 30 | 326 3.0% | 378 3.5% | 10463 96.5% | 0.00 | 0.00 | 0.00 30 - 40 | 2068 19.1% | 2446 22.6% | 8395 77.4% | 0.00 | 0.00 | 0.00 40 - 50 | 6711 61.9% | 9157 84.5% | 1684 15.5% | 0.00 | 0.00 | 0.00 50 - 60 | 1599 14.7% | 10756 99.2% | 85 0.8% | 0.00 | 0.00 | 0.00 60 - 70 | 80 0.7% | 10836 100.0% | 5 0.0% | 0.00 | 0.00 | 0.00 70 - 80 | 5 0.0% | 10841 100.0% | 0 0.0% | 0.00 | 0.00 | 0.00 80 - 90 | 0 0.0% | 10841 100.0% | 0 0.0% | 0.00 | 0.00 | 0.00 90 - 100 | 0 0.0% | 10841 100.0% | 0 0.0% | 0.00 | 0.00 | 0.00100 - 110 | 0 0.0% | 10841 100.0% | 0 0.0% | 0.00 | 0.00 | 0.00110 - 120 | 0 0.0% | 10841 100.0% | 0 0.0% | 0.00 | 0.00 | 0.00120 - 130 | 0 0.0% | 10841 100.0% | 0 0.0% | 0.00 | 0.00 | 0.00130 - 140 | 0 0.0% | 10841 100.0% | 0 0.0% | 0.00 | 0.00 | 0.00140 - 150 | 0 0.0% | 10841 100.0% | 0 0.0% | 0.00 | 0.00 | 0.00150 - 160 | 0 0.0% | 10841 100.0% | 0 0.0% | 0.00 | 0.00 | 0.00160 - 170 | 0 0.0% | 10841 100.0% | 0 0.0% | 0.00 | 0.00 | 0.00170 - 180 | 0 0.0% | 10841 100.0% | 0 0.0% | 0.00 | 0.00 | 0.00180 - 190 | 0 0.0% | 10841 100.0% | 0 0.0% | 0.00 | 0.00 | 0.00190 - 200 | 0 0.0% | 10841 100.0% | 0 0.0% | 0.00 | 0.00 | 0.00Total Speed Rating = 0.00Total Moving Energy (Estimated) = 0.00
Speed limit fields
| Limit | Below | Above 0 | 60 (PSL) | 10756 99.2% | 85 0.8%
SpeedStat-126 Page 2

VirtVehicleCount-125 Page 1
MetroCount Traffic ExecutiveVehicle Counts (Virtual Day)
VirtVehicleCount-125 -- English (ENA)
Datasets:Site: [ferris street] from dennis st to goondoon st opp no 4Direction: 6 - West bound A>B, East bound B>A. Lane: 0Survey Duration: 10:13 Thursday, 15 August 2013 => 10:13 Tuesday, 3 September 2013 Zone:File: ferris street03Sep2013.EC0 (Plus)Identifier: FG34SCAC MC56-L5 [MC55] (c)Microcom 19Oct04Algorithm: Factory default (v3.21 - 15275)Data type: Axle sensors - Paired (Class/Speed/Count)
Profile:Filter time: 0:00 Friday, 16 August 2013 => 0:00 Tuesday, 3 September 2013Included classes: 1, 2, 3, 4, 5, 6, 7, 8, 9, 10, 11, 12Speed range: 10 - 160 km/h.Direction: North, East, South, West (bound)Separation: All - (Headway)Name: Default ProfileScheme: Vehicle classification (AustRoads94)Units: Metric (meter, kilometer, m/s, km/h, kg, tonne)In profile: Vehicles = 18499 / 19844 (93.22%)
VirtVehicleCount-125 Page 1

VirtVehicleCount-125 Page 2
* Virtual Day - Total=1028, 15 minute drops 0000 0100 0200 0300 0400 0500 0600 0700 0800 0900 1000 1100 1200 1300 1400 1500 1600 1700 1800 1900 2000 2100 2200 2300 1 1 1 0 1 10 20 56 148 90 72 67 72 66 72 96 71 68 58 29 14 11 4 2 0 0 0 0 0 2 5 11 28 29 19 17 19 17 18 24 18 17 18 10 4 3 1 1 0 0 0 0 0 2 4 14 37 23 19 16 20 16 18 27 18 19 14 8 3 2 1 1 0 0 0 0 0 2 5 14 43 19 17 17 17 17 16 26 19 16 15 7 3 3 1 0 0 0 0 0 1 4 6 17 41 19 17 17 16 15 21 19 16 16 12 4 3 3 0 0AM Peak 0815 - 0915 (150), AM PHF=0.87 PM Peak 1445 - 1545 (99), PM PHF=0.93
Numbers have been rounded to the nearest integer.
VirtVehicleCount-125 Page 2

SpeedStat-127 Page 1
MetroCount Traffic ExecutiveSpeed Statistics
SpeedStat-127 -- English (ENA)
Datasets:Site: [goondoon street] from eden st to ferris st near no 206Direction: 5 - South bound A>B, North bound B>A. Lane: 0Survey Duration: 11:00 Thursday, 15 August 2013 => 10:49 Tuesday, 3 September 2013 Zone:File: goondoon street03Sep2013.EC0 (Plus)Identifier: AD24768C MC56-L5 [MC55] (c)Microcom 19Oct04Algorithm: Factory default (v3.21 - 15275)Data type: Axle sensors - Paired (Class/Speed/Count)
Profile:Filter time: 0:00 Friday, 16 August 2013 => 0:00 Friday, 30 August 2013 (With Exclusions)Exclusion: Vehicles are excluded at the following times:
Monday: 00:00-06:00, 18:00-00:00, Tuesday: 00:00-06:00, 18:00-00:00, Wednesday: 00:00-06:00, 18:00-00:00, Thursday: 00:00-06:00, 18:00-00:00, Friday: 00:00-06:00, 18:00-00:00, Saturday: 00:00-00:00, Sunday: 00:00-00:00, The following entire days are excluded:Sunday, 18 August 2013
Included classes: 1, 2, 3, 4, 5, 6, 7, 8, 9, 10, 11, 12Speed range: 10 - 160 km/h.Direction: North, East, South, West (bound)Separation: Greater than 4.00 seconds. - (Headway)Name: SLR SpeedScheme: Vehicle classification (AustRoads94)Units: Metric (meter, kilometer, m/s, km/h, kg, tonne)In profile: Vehicles = 2688 / 5536 (48.55%)
SpeedStat-127 Page 1

SpeedStat-127 Page 2
Speed Statistics
SpeedStat-127Site: goondoon street.0.0SN Description: from eden st to ferris st near no 206Filter time: 0:00 Friday, 16 August 2013 => 0:00 Friday, 30 August 2013 (With Exclusions)Scheme: Vehicle classification (AustRoads94)Filter: Cls(1 2 3 4 5 6 7 8 9 10 11 12 ) Dir(NESW) Sp(10,160) Headway(>4)
Vehicles = 2688Posted speed limit = 60 km/h, Exceeding = 86 (3.20%), Mean Exceeding = 66.00 km/hMaximum = 94.5 km/h, Minimum = 10.9 km/h, Mean = 42.1 km/h85% Speed = 52.2 km/h, 95% Speed = 58.0 km/h, Median = 42.1 km/h15 km/h Pace = 33 - 48, Number in Pace = 1456 (54.17%)Variance = 105.63, Standard Deviation = 10.28 km/h
Speed Bins
Speed | Bin | Below | Above | Energy | vMult | n * vMult 0 - 10 | 0 0.0% | 0 0.0% | 2688 100.0% | 0.00 | 0.00 | 0.00 10 - 20 | 54 2.0% | 54 2.0% | 2634 98.0% | 0.00 | 0.00 | 0.00 20 - 30 | 250 9.3% | 304 11.3% | 2384 88.7% | 0.00 | 0.00 | 0.00 30 - 40 | 789 29.4% | 1093 40.7% | 1595 59.3% | 0.00 | 0.00 | 0.00 40 - 50 | 996 37.1% | 2089 77.7% | 599 22.3% | 0.00 | 0.00 | 0.00 50 - 60 | 513 19.1% | 2602 96.8% | 86 3.2% | 0.00 | 0.00 | 0.00 60 - 70 | 67 2.5% | 2669 99.3% | 19 0.7% | 0.00 | 0.00 | 0.00 70 - 80 | 13 0.5% | 2682 99.8% | 6 0.2% | 0.00 | 0.00 | 0.00 80 - 90 | 4 0.1% | 2686 99.9% | 2 0.1% | 0.00 | 0.00 | 0.00 90 - 100 | 2 0.1% | 2688 100.0% | 0 0.0% | 0.00 | 0.00 | 0.00100 - 110 | 0 0.0% | 2688 100.0% | 0 0.0% | 0.00 | 0.00 | 0.00110 - 120 | 0 0.0% | 2688 100.0% | 0 0.0% | 0.00 | 0.00 | 0.00120 - 130 | 0 0.0% | 2688 100.0% | 0 0.0% | 0.00 | 0.00 | 0.00130 - 140 | 0 0.0% | 2688 100.0% | 0 0.0% | 0.00 | 0.00 | 0.00140 - 150 | 0 0.0% | 2688 100.0% | 0 0.0% | 0.00 | 0.00 | 0.00150 - 160 | 0 0.0% | 2688 100.0% | 0 0.0% | 0.00 | 0.00 | 0.00160 - 170 | 0 0.0% | 2688 100.0% | 0 0.0% | 0.00 | 0.00 | 0.00170 - 180 | 0 0.0% | 2688 100.0% | 0 0.0% | 0.00 | 0.00 | 0.00180 - 190 | 0 0.0% | 2688 100.0% | 0 0.0% | 0.00 | 0.00 | 0.00190 - 200 | 0 0.0% | 2688 100.0% | 0 0.0% | 0.00 | 0.00 | 0.00Total Speed Rating = 0.00Total Moving Energy (Estimated) = 0.00
Speed limit fields
| Limit | Below | Above 0 | 60 (PSL) | 2602 96.8% | 86 3.2%
SpeedStat-127 Page 2

VirtVehicleCount-128 Page 1
MetroCount Traffic ExecutiveVehicle Counts (Virtual Day)
VirtVehicleCount-128 -- English (ENA)
Datasets:Site: [goondoon street] from eden st to ferris st near no 206Direction: 5 - South bound A>B, North bound B>A. Lane: 0Survey Duration: 11:00 Thursday, 15 August 2013 => 10:49 Tuesday, 3 September 2013 Zone:File: goondoon street03Sep2013.EC0 (Plus)Identifier: AD24768C MC56-L5 [MC55] (c)Microcom 19Oct04Algorithm: Factory default (v3.21 - 15275)Data type: Axle sensors - Paired (Class/Speed/Count)
Profile:Filter time: 0:00 Friday, 16 August 2013 => 0:00 Friday, 30 August 2013 (With Exclusions)Exclusion: Vehicles are excluded at the following times:
NoneThe following entire days are excluded:Sunday, 18 August 2013
Included classes: 1, 2, 3, 4, 5, 6, 7, 8, 9, 10, 11, 12Speed range: 10 - 160 km/h.Direction: North, East, South, West (bound)Separation: All - (Headway)Name: Default ProfileScheme: Vehicle classification (AustRoads94)Units: Metric (meter, kilometer, m/s, km/h, kg, tonne)In profile: Vehicles = 4010 / 5536 (72.43%)
VirtVehicleCount-128 Page 1

VirtVehicleCount-128 Page 2
* Virtual Day - Total=308, 15 minute drops 0000 0100 0200 0300 0400 0500 0600 0700 0800 0900 1000 1100 1200 1300 1400 1500 1600 1700 1800 1900 2000 2100 2200 2300 1 1 0 0 1 3 7 11 16 20 23 25 26 19 21 28 29 32 19 12 6 4 3 1 0 0 0 0 0 1 1 3 4 5 6 5 8 6 6 6 7 8 7 3 2 1 1 1 0 0 0 0 1 1 2 3 3 6 6 7 7 4 6 7 7 9 4 4 1 1 1 0 0 0 0 0 0 1 2 3 5 4 6 6 6 5 5 8 8 10 4 3 2 1 0 0 0 0 0 0 0 1 2 3 4 5 5 7 5 4 5 7 7 5 4 2 2 2 0 0AM Peak 1115 - 1215 (28), AM PHF=0.88 PM Peak 1645 - 1745 (34), PM PHF=0.87
Numbers have been rounded to the nearest integer.
VirtVehicleCount-128 Page 2

SpeedStat-130 Page 1
MetroCount Traffic ExecutiveSpeed Statistics
SpeedStat-130 -- English (ENA)
Datasets: Site: [ferris st] between dennis an goondoonDirection: 6 - West bound A>B, East bound B>A. Lane: 0Survey Duration: 8:03 Wednesday, 22 February 2012 => 8:56 Wednesday, 14 March 2012 Zone:File: ferris st14Mar2012.EC0 (Plus)Identifier: 2455GYVX MC56-6 [MC55] (c)Microcom 02/03/01 Algorithm: Factory default (v3.21 - 15275)Data type: Axle sensors - Paired (Class/Speed/Count)
Profile:Filter time: 0:00 Thursday, 23 February 2012 => 0:00 Wednesday, 14 March 2012 (With Exclusions)Exclusion: Vehicles are excluded at the following times:
Monday: 00:00-06:00, 18:00-00:00, Tuesday: 00:00-06:00, 18:00-00:00, Wednesday: 00:00-06:00, 18:00-00:00, Thursday: 00:00-06:00, 18:00-00:00, Friday: 00:00-06:00, 18:00-00:00, Saturday: 00:00-00:00, Sunday: 00:00-00:00, The following entire days are excluded:Saturday, 25 February 2012
Included classes: 1, 2, 3, 4, 5, 6, 7, 8, 9, 10, 11, 12Speed range: 10 - 160 km/h.Direction: North, East, South, West (bound)Separation: Greater than 4.00 seconds. - (Headway)Name: SLR SpeedScheme: Vehicle classification (AustRoads94)Units: Metric (meter, kilometer, m/s, km/h, kg, tonne)In profile: Vehicles = 15765 / 28866 (54.61%)
SpeedStat-130 Page 1
SpeedStat-130 Page 2
Speed Statistics SpeedStat-130Site: ferris st.0.0WE Description: between dennis an goondoonFilter time: 0:00 Thursday, 23 February 2012 => 0:00 Wednesday, 14 March 2012 (With Exclusions)Scheme: Vehicle classification (AustRoads94)Filter: Cls(1 2 3 4 5 6 7 8 9 10 11 12 ) Dir(NESW) Sp(10,160) Headway(>4)
Vehicles = 15765Posted speed limit = 60 km/h, Exceeding = 189 (1.20%), Mean Exceeding = 63.08 km/hMaximum = 85.7 km/h, Minimum = 10.2 km/h, Mean = 44.2 km/h85% Speed = 51.5 km/h, 95% Speed = 55.4 km/h, Median = 44.6 km/h15 km/h Pace = 38 - 53, Number in Pace = 11489 (72.88%)Variance = 61.56, Standard Deviation = 7.85 km/h
Speed Bins
Speed | Bin | Below | Above | Energy | vMult | n * vMult 0 - 10 | 0 0.0% | 0 0.0% | 15765 100.0% | 0.00 | 0.00 | 0.00 10 - 20 | 125 0.8% | 125 0.8% | 15640 99.2% | 0.00 | 0.00 | 0.00 20 - 30 | 791 5.0% | 916 5.8% | 14849 94.2% | 0.00 | 0.00 | 0.00 30 - 40 | 2832 18.0% | 3748 23.8% | 12017 76.2% | 0.00 | 0.00 | 0.00 40 - 50 | 8720 55.3% | 12468 79.1% | 3297 20.9% | 0.00 | 0.00 | 0.00 50 - 60 | 3108 19.7% | 15576 98.8% | 189 1.2% | 0.00 | 0.00 | 0.00 60 - 70 | 182 1.2% | 15758 100.0% | 7 0.0% | 0.00 | 0.00 | 0.00 70 - 80 | 5 0.0% | 15763 100.0% | 2 0.0% | 0.00 | 0.00 | 0.00 80 - 90 | 2 0.0% | 15765 100.0% | 0 0.0% | 0.00 | 0.00 | 0.00 90 - 100 | 0 0.0% | 15765 100.0% | 0 0.0% | 0.00 | 0.00 | 0.00100 - 110 | 0 0.0% | 15765 100.0% | 0 0.0% | 0.00 | 0.00 | 0.00110 - 120 | 0 0.0% | 15765 100.0% | 0 0.0% | 0.00 | 0.00 | 0.00120 - 130 | 0 0.0% | 15765 100.0% | 0 0.0% | 0.00 | 0.00 | 0.00130 - 140 | 0 0.0% | 15765 100.0% | 0 0.0% | 0.00 | 0.00 | 0.00140 - 150 | 0 0.0% | 15765 100.0% | 0 0.0% | 0.00 | 0.00 | 0.00150 - 160 | 0 0.0% | 15765 100.0% | 0 0.0% | 0.00 | 0.00 | 0.00160 - 170 | 0 0.0% | 15765 100.0% | 0 0.0% | 0.00 | 0.00 | 0.00170 - 180 | 0 0.0% | 15765 100.0% | 0 0.0% | 0.00 | 0.00 | 0.00180 - 190 | 0 0.0% | 15765 100.0% | 0 0.0% | 0.00 | 0.00 | 0.00190 - 200 | 0 0.0% | 15765 100.0% | 0 0.0% | 0.00 | 0.00 | 0.00Total Speed Rating = 0.00Total Moving Energy (Estimated) = 0.00
Speed limit fields
| Limit | Below | Above 0 | 60 (PSL) | 15576 98.8% | 189 1.2%
SpeedStat-130 Page 2

VirtVehicleCount-129 Page 1
MetroCount Traffic ExecutiveVehicle Counts (Virtual Day)
VirtVehicleCount-129 -- English (ENA)
Datasets: Site: [ferris st] between dennis an goondoonDirection: 6 - West bound A>B, East bound B>A. Lane: 0Survey Duration: 8:03 Wednesday, 22 February 2012 => 8:56 Wednesday, 14 March 2012 Zone:File: ferris st14Mar2012.EC0 (Plus)Identifier: 2455GYVX MC56-6 [MC55] (c)Microcom 02/03/01 Algorithm: Factory default (v3.21 - 15275)Data type: Axle sensors - Paired (Class/Speed/Count)
Profile:Filter time: 0:00 Thursday, 23 February 2012 => 0:00 Wednesday, 14 March 2012 (With Exclusions)Exclusion: Vehicles are excluded at the following times:
NoneThe following entire days are excluded:Saturday, 25 February 2012
Included classes: 1, 2, 3, 4, 5, 6, 7, 8, 9, 10, 11, 12Speed range: 10 - 160 km/h.Direction: North, East, South, West (bound)Separation: All - (Headway)Name: Default ProfileScheme: Vehicle classification (AustRoads94)Units: Metric (meter, kilometer, m/s, km/h, kg, tonne)In profile: Vehicles = 26307 / 28866 (91.13%)
VirtVehicleCount-129 Page 1

VirtVehicleCount-129 Page 2
* Virtual Day - Total=1385, 15 minute drops 0000 0100 0200 0300 0400 0500 0600 0700 0800 0900 1000 1100 1200 1300 1400 1500 1600 1700 1800 1900 2000 2100 2200 2300 1 1 1 1 2 25 47 95 205 109 87 92 98 86 94 113 88 89 73 38 16 16 5 2 1 0 0 0 1 2 7 17 47 33 22 20 27 23 20 30 22 22 21 14 4 4 2 1 0 0 0 0 0 4 10 18 58 25 23 23 22 20 21 31 22 23 21 11 4 5 2 1 0 0 0 0 0 9 11 22 58 26 19 26 24 21 22 28 21 23 16 8 4 5 1 0 0 0 0 0 1 9 18 38 43 24 23 24 25 22 30 24 23 22 16 6 4 3 1 0AM Peak 0800 - 0900 (205), AM PHF=0.89 PM Peak 1445 - 1545 (119), PM PHF=0.96
Numbers have been rounded to the nearest integer.
VirtVehicleCount-129 Page 2

SpeedStat-132 Page 1
MetroCount Traffic ExecutiveSpeed Statistics
SpeedStat-132 -- English (ENA)
Datasets: Site: [goondoon street] from tank st to eden st near no 206Direction: 5 - South bound A>B, North bound B>A. Lane: 2Survey Duration: 12:28 Thursday, 15 November 2012 => 11:03 Tuesday, 27 November 2012 Zone:File: goondoon street27Nov2012.EC2 (Plus)Identifier: BQ09CF79 MC56-L5 [MC55] (c)Microcom 19Oct04Algorithm: Factory default (v3.21 - 15275)Data type: Axle sensors - Paired (Class/Speed/Count)
Profile:Filter time: 0:00 Friday, 16 November 2012 => 0:00 Tuesday, 27 November 2012 (With Exclusions)Exclusion: Vehicles are excluded at the following times:
Monday: 00:00-06:00, 18:00-00:00, Tuesday: 00:00-06:00, 18:00-00:00, Wednesday: 00:00-06:00, 18:00-00:00, Thursday: 00:00-06:00, 18:00-00:00, Friday: 00:00-06:00, 18:00-00:00, Saturday: 00:00-00:00, Sunday: 00:00-00:00, The following entire days are excluded:Monday, 19 November 2012Tuesday, 20 November 2012
Included classes: 1, 2, 3, 4, 5, 6, 7, 8, 9, 10, 11, 12Speed range: 10 - 160 km/h.Direction: North, East, South, West (bound)Separation: Greater than 4.00 seconds. - (Headway)Name: SLR SpeedScheme: Vehicle classification (AustRoads94)Units: Metric (meter, kilometer, m/s, km/h, kg, tonne)In profile: Vehicles = 1379 / 3714 (37.13%)
SpeedStat-132 Page 1

SpeedStat-132 Page 2
Speed Statistics SpeedStat-132Site: goondoon street.2.0SN Description: from tank st to eden st near no 206Filter time: 0:00 Friday, 16 November 2012 => 0:00 Tuesday, 27 November 2012 (With Exclusions)Scheme: Vehicle classification (AustRoads94)Filter: Cls(1 2 3 4 5 6 7 8 9 10 11 12 ) Dir(NESW) Sp(10,160) Headway(>4)
Vehicles = 1379Posted speed limit = 60 km/h, Exceeding = 36 (2.61%), Mean Exceeding = 65.54 km/hMaximum = 75.7 km/h, Minimum = 10.7 km/h, Mean = 41.1 km/h85% Speed = 50.4 km/h, 95% Speed = 56.2 km/h, Median = 42.1 km/h15 km/h Pace = 36 - 51, Number in Pace = 814 (59.03%)Variance = 114.58, Standard Deviation = 10.70 km/h
Speed Bins
Speed | Bin | Below | Above | Energy | vMult | n * vMult 0 - 10 | 0 0.0% | 0 0.0% | 1379 100.0% | 0.00 | 0.00 | 0.00 10 - 20 | 65 4.7% | 65 4.7% | 1314 95.3% | 0.00 | 0.00 | 0.00 20 - 30 | 145 10.5% | 210 15.2% | 1169 84.8% | 0.00 | 0.00 | 0.00 30 - 40 | 337 24.4% | 547 39.7% | 832 60.3% | 0.00 | 0.00 | 0.00 40 - 50 | 584 42.3% | 1131 82.0% | 248 18.0% | 0.00 | 0.00 | 0.00 50 - 60 | 212 15.4% | 1343 97.4% | 36 2.6% | 0.00 | 0.00 | 0.00 60 - 70 | 31 2.2% | 1374 99.6% | 5 0.4% | 0.00 | 0.00 | 0.00 70 - 80 | 5 0.4% | 1379 100.0% | 0 0.0% | 0.00 | 0.00 | 0.00 80 - 90 | 0 0.0% | 1379 100.0% | 0 0.0% | 0.00 | 0.00 | 0.00 90 - 100 | 0 0.0% | 1379 100.0% | 0 0.0% | 0.00 | 0.00 | 0.00100 - 110 | 0 0.0% | 1379 100.0% | 0 0.0% | 0.00 | 0.00 | 0.00110 - 120 | 0 0.0% | 1379 100.0% | 0 0.0% | 0.00 | 0.00 | 0.00120 - 130 | 0 0.0% | 1379 100.0% | 0 0.0% | 0.00 | 0.00 | 0.00130 - 140 | 0 0.0% | 1379 100.0% | 0 0.0% | 0.00 | 0.00 | 0.00140 - 150 | 0 0.0% | 1379 100.0% | 0 0.0% | 0.00 | 0.00 | 0.00150 - 160 | 0 0.0% | 1379 100.0% | 0 0.0% | 0.00 | 0.00 | 0.00160 - 170 | 0 0.0% | 1379 100.0% | 0 0.0% | 0.00 | 0.00 | 0.00170 - 180 | 0 0.0% | 1379 100.0% | 0 0.0% | 0.00 | 0.00 | 0.00180 - 190 | 0 0.0% | 1379 100.0% | 0 0.0% | 0.00 | 0.00 | 0.00190 - 200 | 0 0.0% | 1379 100.0% | 0 0.0% | 0.00 | 0.00 | 0.00Total Speed Rating = 0.00Total Moving Energy (Estimated) = 0.00
Speed limit fields
| Limit | Below | Above 0 | 60 (PSL) | 1343 97.4% | 36 2.6%
SpeedStat-132 Page 2

VirtVehicleCount-131 Page 1
MetroCount Traffic ExecutiveVehicle Counts (Virtual Day)
VirtVehicleCount-131 -- English (ENA)
Datasets: Site: [goondoon street] from tank st to eden st near no 206Direction: 5 - South bound A>B, North bound B>A. Lane: 2Survey Duration: 12:28 Thursday, 15 November 2012 => 11:03 Tuesday, 27 November 2012 Zone:File: goondoon street27Nov2012.EC2 (Plus)Identifier: BQ09CF79 MC56-L5 [MC55] (c)Microcom 19Oct04Algorithm: Factory default (v3.21 - 15275)Data type: Axle sensors - Paired (Class/Speed/Count)
Profile:Filter time: 0:00 Friday, 16 November 2012 => 0:00 Tuesday, 27 November 2012 (With Exclusions)Exclusion: Vehicles are excluded at the following times:
NoneThe following entire days are excluded:Monday, 19 November 2012Tuesday, 20 November 2012
Included classes: 1, 2, 3, 4, 5, 6, 7, 8, 9, 10, 11, 12Speed range: 10 - 160 km/h.Direction: North, East, South, West (bound)Separation: All - (Headway)Name: Default ProfileScheme: Vehicle classification (AustRoads94)Units: Metric (meter, kilometer, m/s, km/h, kg, tonne)In profile: Vehicles = 2702 / 3714 (72.75%)
VirtVehicleCount-131 Page 1

VirtVehicleCount-131 Page 2
* Virtual Day - Total=300, 15 minute drops 0000 0100 0200 0300 0400 0500 0600 0700 0800 0900 1000 1100 1200 1300 1400 1500 1600 1700 1800 1900 2000 2100 2200 2300 1 1 0 1 3 5 8 14 16 18 23 23 23 21 21 21 25 29 19 12 6 4 2 3 0 0 0 0 0 0 3 4 4 5 6 6 5 5 5 6 6 7 6 3 2 1 0 1 0 0 0 0 0 2 2 3 4 5 5 6 6 6 5 6 7 11 5 3 2 2 1 1 0 0 0 0 2 1 1 3 4 4 5 5 7 5 4 5 5 7 5 4 1 1 1 0 0 0 0 1 0 2 2 4 4 5 7 6 5 5 8 4 6 5 4 2 2 0 0 0AM Peak 1045 - 1145 (24), AM PHF=0.84 PM Peak 1645 - 1745 (30), PM PHF=0.71
Numbers have been rounded to the nearest integer.
VirtVehicleCount-131 Page 2

SpeedStat-134 Page 1
MetroCount Traffic ExecutiveSpeed Statistics
SpeedStat-134 -- English (ENA)
Datasets: Site: [ferris st] near no 5Direction: 7 - North bound A>B, South bound B>A. Lane: 0Survey Duration: 10:00 Thursday, 28 January 2010 => 13:01 Monday, 8 February 2010 Zone:File: 2010 Feb_ferris st(2).EC0 (Plus)Identifier: BQ30SX7Y MC56-L5 [MC55] (c)Microcom 19Oct04Algorithm: Factory default (v3.21 - 15275)Data type: Axle sensors - Paired (Class/Speed/Count)
Profile:Filter time: 0:00 Friday, 29 January 2010 => 0:00 Monday, 8 February 2010 (With Exclusions)Exclusion: Vehicles are excluded at the following times:
Monday: 00:00-06:00, 18:00-00:00, Tuesday: 00:00-06:00, 18:00-00:00, Wednesday: 00:00-06:00, 18:00-00:00, Thursday: 00:00-06:00, 18:00-00:00, Friday: 00:00-06:00, 18:00-00:00, Saturday: 00:00-00:00, Sunday: 00:00-00:00, The following entire days are excluded:None
Included classes: 1, 2, 3, 4, 5, 6, 7, 8, 9, 10, 11, 12Speed range: 10 - 160 km/h.Direction: North, East, South, West (bound)Separation: Greater than 4.00 seconds. - (Headway)Name: SLR SpeedScheme: Vehicle classification (AustRoads94)Units: Metric (meter, kilometer, m/s, km/h, kg, tonne)In profile: Vehicles = 6060 / 12593 (48.12%)
SpeedStat-134 Page 1

SpeedStat-134 Page 2
Speed Statistics SpeedStat-134Site: ferris st.0.0NS Description: near no 5Filter time: 0:00 Friday, 29 January 2010 => 0:00 Monday, 8 February 2010 (With Exclusions)Scheme: Vehicle classification (AustRoads94)Filter: Cls(1 2 3 4 5 6 7 8 9 10 11 12 ) Dir(NESW) Sp(10,160) Headway(>4)
Vehicles = 6060Posted speed limit = 60 km/h, Exceeding = 275 (4.54%), Mean Exceeding = 63.17 km/hMaximum = 79.3 km/h, Minimum = 10.3 km/h, Mean = 47.5 km/h85% Speed = 55.1 km/h, 95% Speed = 59.4 km/h, Median = 48.2 km/h15 km/h Pace = 41 - 56, Number in Pace = 4325 (71.37%)Variance = 78.77, Standard Deviation = 8.88 km/h
Speed Bins
Speed | Bin | Below | Above | Energy | vMult | n * vMult 0 - 10 | 0 0.0% | 0 0.0% | 6060 100.0% | 0.00 | 0.00 | 0.00 10 - 20 | 93 1.5% | 93 1.5% | 5967 98.5% | 0.00 | 0.00 | 0.00 20 - 30 | 222 3.7% | 315 5.2% | 5745 94.8% | 0.00 | 0.00 | 0.00 30 - 40 | 551 9.1% | 866 14.3% | 5194 85.7% | 0.00 | 0.00 | 0.00 40 - 50 | 2673 44.1% | 3539 58.4% | 2521 41.6% | 0.00 | 0.00 | 0.00 50 - 60 | 2246 37.1% | 5785 95.5% | 275 4.5% | 0.00 | 0.00 | 0.00 60 - 70 | 259 4.3% | 6044 99.7% | 16 0.3% | 0.00 | 0.00 | 0.00 70 - 80 | 16 0.3% | 6060 100.0% | 0 0.0% | 0.00 | 0.00 | 0.00 80 - 90 | 0 0.0% | 6060 100.0% | 0 0.0% | 0.00 | 0.00 | 0.00 90 - 100 | 0 0.0% | 6060 100.0% | 0 0.0% | 0.00 | 0.00 | 0.00100 - 110 | 0 0.0% | 6060 100.0% | 0 0.0% | 0.00 | 0.00 | 0.00110 - 120 | 0 0.0% | 6060 100.0% | 0 0.0% | 0.00 | 0.00 | 0.00120 - 130 | 0 0.0% | 6060 100.0% | 0 0.0% | 0.00 | 0.00 | 0.00130 - 140 | 0 0.0% | 6060 100.0% | 0 0.0% | 0.00 | 0.00 | 0.00140 - 150 | 0 0.0% | 6060 100.0% | 0 0.0% | 0.00 | 0.00 | 0.00150 - 160 | 0 0.0% | 6060 100.0% | 0 0.0% | 0.00 | 0.00 | 0.00160 - 170 | 0 0.0% | 6060 100.0% | 0 0.0% | 0.00 | 0.00 | 0.00170 - 180 | 0 0.0% | 6060 100.0% | 0 0.0% | 0.00 | 0.00 | 0.00180 - 190 | 0 0.0% | 6060 100.0% | 0 0.0% | 0.00 | 0.00 | 0.00190 - 200 | 0 0.0% | 6060 100.0% | 0 0.0% | 0.00 | 0.00 | 0.00Total Speed Rating = 0.00Total Moving Energy (Estimated) = 0.00
Speed limit fields
| Limit | Below | Above 0 | 60 (PSL) | 5785 95.5% | 275 4.5%
SpeedStat-134 Page 2
VirtVehicleCount-133 Page 1
MetroCount Traffic ExecutiveVehicle Counts (Virtual Day)
VirtVehicleCount-133 -- English (ENA)
Datasets: Site: [ferris st] near no 5Direction: 7 - North bound A>B, South bound B>A. Lane: 0Survey Duration: 10:00 Thursday, 28 January 2010 => 13:01 Monday, 8 February 2010 Zone:File: 2010 Feb_ferris st(2).EC0 (Plus)Identifier: BQ30SX7Y MC56-L5 [MC55] (c)Microcom 19Oct04Algorithm: Factory default (v3.21 - 15275)Data type: Axle sensors - Paired (Class/Speed/Count)
Profile:Filter time: 0:00 Friday, 29 January 2010 => 0:00 Monday, 8 February 2010Included classes: 1, 2, 3, 4, 5, 6, 7, 8, 9, 10, 11, 12Speed range: 10 - 160 km/h.Direction: North, East, South, West (bound)Separation: All - (Headway)Name: Default ProfileScheme: Vehicle classification (AustRoads94)Units: Metric (meter, kilometer, m/s, km/h, kg, tonne)In profile: Vehicles = 11064 / 12593 (87.86%)
VirtVehicleCount-133 Page 1

VirtVehicleCount-133 Page 2
* Virtual Day - Total=1106, 15 minute drops 0000 0100 0200 0300 0400 0500 0600 0700 0800 0900 1000 1100 1200 1300 1400 1500 1600 1700 1800 1900 2000 2100 2200 2300 2 1 1 2 2 11 21 59 163 107 84 87 76 65 86 91 66 59 52 35 12 15 5 5 1 0 0 0 0 1 5 14 32 36 22 19 23 17 20 23 18 19 14 12 3 3 2 2 0 0 0 0 0 2 4 11 46 23 19 18 17 17 19 24 19 15 13 9 4 5 1 1 1 0 0 1 0 4 5 13 46 26 21 27 16 15 20 22 14 13 12 7 3 5 1 1 1 1 0 0 2 5 7 22 39 22 22 23 20 17 26 22 15 13 13 6 2 2 1 1AM Peak 0815 - 0915 (167), AM PHF=0.91 PM Peak 1445 - 1545 (95), PM PHF=0.93
Numbers have been rounded to the nearest integer.
VirtVehicleCount-133 Page 2
Data AnalysisCustomer Services, Safety and Regulation Division
WebCrash v2.3 Reports
The page numbers shown here are those of the overall PDF file (they range 1-3).The PDF page numbers appear at the top left-hand corner of each page.Pages within individual reports are numbered from 1 and appear at the top right-hand corner of each page.When printing specific reports with Acrobat Reader, the PDF page numbers must be specified.
Table of Contents1. Crash Details by Crash Date 3
Data RestrictionsPlease note:-
All crash data for Queensland for 2010 to 2013 has not been finalised. This is due to the time it takes for Police to complete crash investigations, finalise reports, and collect additional information from other sources such as the coroner, pathologist and government medical laboratory. The Department of Transport and Main Roads (DTMR) is reporting all severity crash data to 31 December 2010. Fatal crash data is finalised for 2010 and 2011 and DTMR is reporting preliminary fatal crash data to May 2013.
The implementation of new systems in 2006 has affected figures during July 2006 to June 2007. In particular, the following should be noted for crashes occurring between July 2006 and June 2007:
1. The number of all crashes reported during July 2006 to March 2007 is below expected,
2. A greater proportion of minor injury casualties and fewer hospitalised casualties reported,
3. Increase in unknown licence types,
4. Increase in unknown restraints use,
5. Increase in unknown helmet use for motorcyclist casualties,
6. Increase in unknown helmet use for bicyclist casualties,
This means that there has been a change in the data series affecting casualty and crash severity. As a result, non-fatal casualty and crash severity cannot be compared. This affects calculations for hospitalised per 100,000 population, severity distribution analysis, and any frequency comparisons involving data from July 2006 to June 2007.
Road Crash Data Inclusion RequirementsPlease also note that the information held in the RoadCrash database relating to crashes occurring within the last 12 months are considered preliminary as investigations into crashes can take up to 12 months to finalise. Please further note that to qualify as valid, crashes must meet the following criteria: 1. The crash occurred on a public road, and 2. A person was killed or injured, or 3. At least one vehicle was towed away, or 4. The value of property damage was: (a) $2500 damage to property other than vehicles (after 1 December 1999) (b) $2500 damage to vehicle and property (after 1 December 1991 and prior to 1 December 1999) (c) $1000 damage to property (prior to 1 December 1991) Note: crashes resulting from medical conditions or deliberate acts are excluded.
Contact Details:Postal Address: Manager (Data Analysis) Phone: 07 3066 2236
Customer Services, Safety and Regulation Division Fax: 07 3066 2410Department of Transport and Main Roads Email: [email protected] Box 673Fortitude ValleyQld 4006
Attachment 2

CONF
IDEN
TIAL
NOTE: This report has been limited to the maximum of 500 records.
Report ConstraintsGeographic ConstraintsMap
and
Date and Time ConstraintsContinuous time: 01-Jan-2006 to 31-Dec-2013
Glegg St
Williamson St
Hunter St
Worthington St
Hill Crescent eslin St
Fisher St
Oconnell St
Side St
Dawso
n Rd
Bole
s St
Hanson Rd
Daws
on R
d
Fish
er S
t
Glenlyon St
Oaka La
Moura C
rescent
Wood St
Young St
Gladstone
N
0m 1000m200m 400m 600m 800m
● Qualifying Crashes (0) satisfying all constraints (geographic, date/time, and other).
Drawing sequence: All Crashes, Qualifying Crashes, Zone Crashes. Each set overlays the previous.
No data was found which satisfies the specified constraints.
Report 1
Crash Details by Crash Date
Gladstone.pzbaker.092518
PDF Page 3 of 3 Page 1 of 1

GLAD
STON
E RE
GION
AL C
OUNC
IL
RPEQ
NOTE
* Ind
icates
sign
ature
s on o
rigina
l issu
e of
draw
ing or
lates
t rev
ision
of th
e dra
wing
.
BLIS
TE
R I
SLA
ND
CO
NC
EP
T
0G
LAD
STO
NE
RE
GIO
NA
L C
OU
NC
ILP.
J.BAK
ER
P.J.B
AKER
0C
ON
CE
PT
13-0
88.d
wg
K:\D
ES
IGN
PR
OJE
CTS
\13-
088
Gon
ndoo
n S
treet
& F
erris
Stre
et S
lip L
ane\
DE
SIG
N\D
RA
WIN
GS
A.H
.D.
G.D
.A.9
4 Zo
ne 5
6
1100
BE
FO
RE
YO
U D
IG
DIA
L
CO
NC
EP
T0
2.510
12.5m
7.55
SCAL
E 1:2
50 A
T OR
IGIN
AL S
IZE
PROP
OSED
BLIS
TER
ISLA
ND
Atta
chm
ent3

GLAD
STON
E RE
GION
AL C
OUNC
IL
RPEQ
NOTE
* Ind
icates
sign
ature
s on o
rigina
l issu
e of
draw
ing or
lates
t rev
ision
of th
e dra
wing
.
SLIP
LA
NE
CLO
SU
RE
CO
NC
EP
T
0P.
J.BAK
ER
P.J.B
AKER
0C
ON
CE
PT
13-0
88.d
wg
K:\D
ES
IGN
PR
OJE
CTS
\13-
088
Gon
ndoo
n S
treet
& F
erris
Stre
et S
lip L
ane\
DE
SIG
N\D
RA
WIN
GS
A.H
.D.
G.D
.A.9
4 Zo
ne 5
6
1100
BE
FO
RE
YO
U D
IG
DIA
L
CO
NC
EP
T0
520
25m
1510
SCAL
E 1:5
00 A
T OR
IGIN
AL S
IZE
LEGE
ND
NEW
CON
CRET
E IS
LAND
S
SIGH
T DI
STAN
CE R
EQUI
RED
(SIS
D)
AREA
TO
BE R
ECON
STRU
CTED
Atta
chm
ent4

Attachment 5