traffic engineering
TRANSCRIPT

TRAFFIC ENGINEERING
Definition: - it is that branch of engg which deals with the improvement of traffic performance of road networks and terminals.OrIt is the science of measuring traffic and travel, the study of the basic laws relating to traffic flow and generation and application of this knowledge to the professional practice of planning, designing and operating traffic systems to achieve safe and efficient movement of persons and goods.
Objective of traffic engg Achieve efficient free and rapid flow of traffic Helping in reducing the no. of accidents.
Study of traffic engg (TPTGTA) Traffic characteristics ---- improvement of traffic facilities( vehicle , human[road user]) Traffic studies and analysis Traffic operation-control and regulation ---- laws of speed limit, installation of traffic control
device Planning and analysis ---- Geometric design--- Horizontal and vertical curve design Administration and management ----“3E’s” concept
1. Traffic characteristicsRoad user characteristics:
Involved--- human in the form of ‘pedestrians, drivers, cyclist, motorist.Factors
a. Physicalsb. Mentalc. Psychologicald. Environmental
a. Physical: - Vision include ‘acuity of vision’, ‘peripheral vision’, ‘eye movement’, ‘glare vision and
recovery’, and ‘depth judgment’, hearing, strength, general respond to traffic situations.
Acuity of vision - field of clearest vision cone of 3 degree, in vertical plane the field of clear vision is 2/3 rd
of that of horizontal plane.Peripheral vision - vision around the vehicle by the eyeEye movement - for seeing around features we have to move our eye, the total time taken for the eye movement depends on some of the physical characteristics including response stimuli.Glare vision and recovery- it is response of bright light and darkness i.e. adoptability to change of light(light to dark or dark to light).Depth judgment – judging depth distance on the road and speed of vehicles used to respond when any things happening on road.
b. Mental: -Knowledge, skill, intelligence, experience, literacy
Knowledge – It of vehicle characteristics, traffic rule, traffic behavior, driving practice and rxn to and situations.Skill – it is based on the driving practice and responds to any bad situation on the road.

Intelligence & Literacy – understanding the traffic situations, regulations, special instructions and timely action Experience –reactions to any traffic situations become more instantaneous with experience.
c. Psychological: -It affects the reaction to traffic situations of road user to a great extent. It includes the
emotional factors like attentiveness, fear, anger, impatience, superstition, general attitude towards traffic, regulation and maturity.Impatience is most dangerous factor it causes many accidents, it is due to some annoying reason on the road or at the home or elsewhere.
d. Environmental factors: -It affects the traffic behavior of road user and traffic characteristics, facilities to the
traffic, atmosphere conditions and the locality. The adoptability to different traffic stream characteristics depends on the driver’s characteristics as well as the motivation. Mainly the reaction time is influence by PIEV theory but it is mostly affected by environmental and modifying factors and also based on road user characteristics.Driver’s characteristics such as simple rxn time, depth judgment, field vision, visual acuity, glare recovery, respond to traffic situations can also be affected by alcohol, illness, fatigue and drugs. These reduce the alertness but increase the rxn time.
Vehicular characteristicsAffects the design and traffic performance as road is design for some vehicles not for all types of vehicles. Vehicles standards should be uniform for a country. Standards mean dimensions and weight of vehicles.It is classified in two types1. Static characteristics2. Dynamic characteristics
1. Static characteristics: -It includes the dimensions, weight and maximum turning angle (for steering).
Dimensions mean height of vehicle, height of drives seat (visibility distance), and height of head light (for head light distance in night (mainly in valley curve), chassis clearance (for speed breaker and adulations on the road), length (show the capacity of vehicles also affects the visibility, overtaking distance, braking distance, maneuverability of vehicles. Gross weight, axle and wheel loads of vehicle govern the structural design of pavements and cross drainage structures.
2. Dynamic characteristics: -It includes speed & accelerations (depends on power of engine and the resistance to be overcome
in geometric design), braking characteristics and some aspects of vehicle body design. The stability of vehicles and its safe movement in horizontal curves depends on width of wheel base and height of center of gravity. Riding comfort on vertical curves is due to suspension system of the vehicle.
Speed of vehicle: -It affects sight distance, super elevation, length of transition curve(on horizontal and vertical
curve), limiting radii of horizontal curves, width of pavement, design gradient, capacity of traffic lane, design and control measures on intersections.
Braking characteristics: -It is used to measure the skid resistance of road under prevailing conditions at the desired speed.
To determine this we have to know about1. Braking distance – distance upto which vehicle moves when brakes are fully applied.2. Initial speed – that speed on which the vehicle is moving before application of brake.3. Actual duration of brake application

Formula usedv2=u2+2 as
v=u+ats=ut+0.5 a t 2
f =ag
f = v2
2gLWhere, v= final speed (m/s), u= initial speed (m/s), a= acceleration (m/s2), t= duration of brake application (s), L= braking distance (m), f= skid resistance, g= acceleration due to gravity
Traffic studiesFor analysis of traffic characteristics, help in deciding the geometric design feature and traffic control for safe and efficient traffic movements. Collecting traffic data is called traffic census.
The various traffic studies generally carried out are:1) Traffic volume study2) Speed studies
a) Spot speed studyb) Speed and delay study
3) Origin and destination (O&D) study4) Traffic flow characteristics5) Traffic capacity study6) Parking study7) Accidents study or the traffic flops
1. Traffic Volume Study: -It is the no. of vehicles crossing a section of road per unit time at a selected period. Used as a
quantity measure of flow; the commonly used units are vehicles per day and vehicles per hour.It is
1. Detailed volume data Classified volume Turning volume Direction of traffic Lane distribution
Its objectives are: True measure of relative importance of road and deciding the priority for improvement and
expansion. Used in planning, traffic operation and control of existing facilities and designing of new facility. Used in analysis of traffic patterns and trends. Useful in structural design of pavements, in geometric design and in computing road way
capacity. Used for design for intersection, in planning signal timing, channelization and other control
device.True picture is too obtained by hourly traffic volume data. The direction of each class of traffic flow is also noted. At intersections the traffic flow in each direction of flow including turning movements are recorded.
Counting of traffic volume: -

1. Mechanical counting – it is of fixed or portable type; automatically record the total no. of vehicle crossing a section of the road throughout the day and night i.e. 24 hours active (recording the total hourly volume). It counts the vehicles based on their impulse which is directly operated by electricity.
Other mechanical detectors are photo-electric cells, magnetic detector and radar detectors.The main drawback is that it is not possible to get the traffic volumes of various classes of traffic in the stream and details of turning movements.
2. Manual counting – record by human on prescribed record sheet, possible to collect that data which are not possible by mechanical counting, such as vehicle classification, turning movements and counts where the loading conditions or no. of occupants are required. This is only adopted when there is specific work is to be done i.e. on specific advantage.
Presentations of traffic volume data: - Annual average daily traffic (AADT or ADT) – help in deciding the relative importance
of a route and in phasing the road developments. Trend charts showing volume tends over period of years are prepared. Variation charts showing hourly, daily and seasonal variations are also prepared. Help in
deciding the facilities and regulation needed during peak period. Traffic flow maps. Help in traffic volume distribution at a glance. Volume flow diagram at intersections. Helps in intersections design. Thirtieth highest hourly volume is the hourly volume that will exceed only 29 times in a
year and all other hourly volumes of the year will be less than this value. It generally taken as hourly volume design. The high facilities designed (30 th highest hourly volume) must be satisfactory from both facility and economic considerations.
SPEED STUDYSpeed of vehicle depends on many factors like geometric features, traffic conditions, time, place,
environmental conditions and driver.Different types of speed
Spot speed – instantaneous speed of vehicle at particular location. Average speed – average of spot speed of many vehicles pass from that point.
It is measured in two ways: -1. Space mean speed – represents the average speed of vehicles in a certain road length of road.
V s=3.6 dn
∑i=1
n
t i

Where, Vs= space-mean speed, kmphd= length of road considered, mn= number of individual vehicle observationsti= observed travel time (sec) for ith vehicle to travel distance d, m.
2. Time mean speed – represents speed distribution of vehicle at a point on the roadway and it is the instantaneous speed at that point.
V t=∑i=1
n
V i
nWhere Vt= time mean speed, kmphVi= observed instantaneous speed of ith vehicles, kmphn= number of vehicles observed
Spot speed study: -It may be useful in these following ways: -
o To use in planning traffic control and in traffic regulation.o In geometric design or for deciding design speed for new facilities.o Study accidents on road.o Study the traffic capacity.o Decide the speed trends.o Compare diverse types and vehicles under specified conditions.
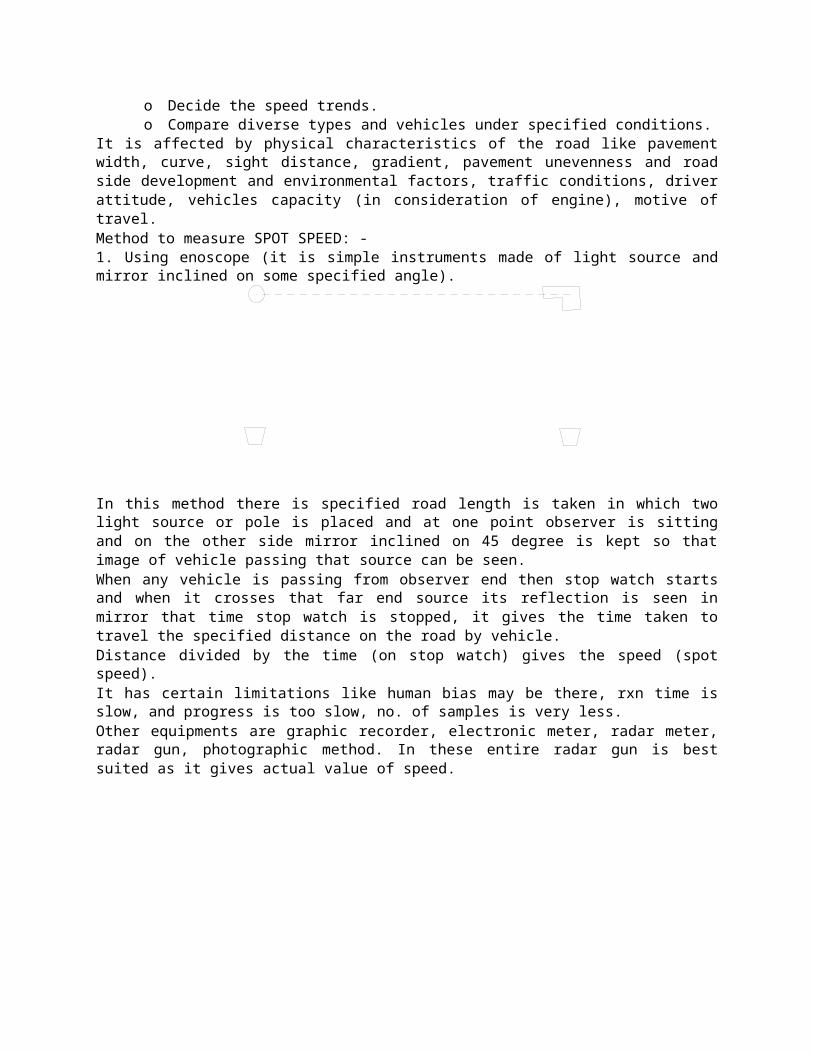
It is affected by physical characteristics of the road like pavement width, curve, sight distance, gradient, pavement unevenness and road side development and environmental factors, traffic conditions, driver attitude, vehicles capacity (in consideration of engine), motive of travel.Method to measure SPOT SPEED: -1. Using enoscope (it is simple instruments made of light source and mirror inclined on some specified angle).
In this method there is specified road length is taken in which two light source or pole is placed and at one point observer is sitting and on the other side mirror inclined on 45 degree is kept so that image of vehicle passing that source can be seen.When any vehicle is passing from observer end then stop watch starts and when it crosses that far end source its reflection is seen in mirror that time stop watch is stopped, it gives the time taken to travel the specified distance on the road by vehicle.Distance divided by the time (on stop watch) gives the speed (spot speed).It has certain limitations like human bias may be there, rxn time is slow, and progress is too slow, no. of samples is very less.Other equipments are graphic recorder, electronic meter, radar meter, radar gun, photographic method. In these entire radar gun is best suited as it gives actual value of speed. Presentation of SPOT SPEED data: -

a) Average speed of vehiclesb) Cumulative speed of vehicles
A graph is plotted with the average values of each speed group on the X- axis and cumulative percent of vehicles travelled at or below the different speeds on Y- axis. There are three speed is very important 85th percent speed (maximum speed allowed to road) 15 th percent speed (minimum speed allowed to the road) and 98th percent speed (used for geometric design).
The drivers exceeding 85th percent speed considered as moving with more than safe speed limit.
c) Modal average: - it is graph between % frequencies to speed.
Speed and delay study: -This gives us running speed, overall speed, fluctuations in speed and delay b/w the stations. It
also gives the information about amount, location, time and frequency of delay and also helpful in study the spot of congestion in that stream (mostly on intersections). Also used in benefit cost analysis. Various methods of carrying out this study: -
Floating car or riding check License plate method Interview method Elevated observations Photography observations
Floating car method: -In this method a test car is injected in the stream with the average speed of stream so that
minimum no of vehicles overtake it and minimum no of vehicles are overtaken by it. Then there are four observers to take all the observations.1st observer – it has two stop watches, one is used to take delay time at control points like intersections and other for individual delay.2nd observer – he writes the cause, duration, location of delays on prescribed table.3rd observer – he notes down the no. of vehicles which are overtaken and which is overtaking this vehicle.4th observer – he counts and notes down the no. of vehicles which are coming from opposite direction of the moving stream in which the test vehicle is moving.Formula used
t=tw−ny
q
q=na+n y
t a+ tw
Where, q= flow of vehicles (volume per min), in one direction of the streamna= average no. of vehicles counted in the opposite direction of test vehicle movement.ny= the average no. of vehicles overtaking the test vehicles minus the avg no. of vehicles overtaken when the test is in the direction of q.tw= average journey time in minute, when test car is moving in the direction of q.ta= average journey time in minute, when test car is moving against the direction of q.
ORIGIN & DISTINATION STUDIESIt is carried out mainly due to
1. Plan the road network2. Plan the other facilities for vehicular traffic.3. Plan the schedule of different modes of transportation for the trip demand of commuters.
It determines their nos., origin and destination of each zone. This provides the basic data for determining the desired directions of flow or the desire lines. Various applications of O&D study: -
1. To judge the adequacy of existing routes and plan new networks.2. To plan transportation system.

3. Locate new bridges and terminals and intermediate stops for traffic demands, terminal facilities and public transport.
4. To establish design standards for the road, traffic.5. To locate the possible express way along the desire lines.
Method of collecting O&D data Road side interview method – interview of user and drivers on the interview spot on the road to
find the place and time of origin and destination, route, locations of stoppage, purpose of trip, no. of passengers and vehicles, and type of vehicles by a group of persons.Advantage – data collect quickly in short time, field organization is simple, and team trained quickly.Drawbacks – vehicles stopped for interview cause delayed in vehicular movement, annoying for road user and drivers.
License plate method – the license of any vehicles is noted down when it is entering any area and license is also noted when vehicle is going out to that area. Used in finding the time of entering and exiting of vehicles.Advantage – easy and quick, not cause vehicular delay, team trained quickly.Drawbacks – involves a lot of office works, only helpful for small area of consideration, large no. of team required.
Return post card method – in this method user of that locality are given some post card having a form which includes some questions, which is supposed to fill by user and post it.Advantage – suitable where traffic is heavy, team need not to be trained.Drawbacks – user may not be interested.
Home interview method – interview the user and driver to their home as a full interview or questionnaire interview.
Work spot interview method Tag-on-car method
Desire lines: - these are straight line connecting the origin points with destinations, summarized into different area groups; its width depends on the importance of that route (proportional to no. of trips in both directions). Its map enables to decide the actual desire of the road users and helps in find the necessities of new road link, a diversion, a by-pass or a new bridge.
TRAFFIC FLOW CHARACTERISTICS Traffic man oeuvres are
1. Diverging2. Merging3. Crossing4. Weaving – crossing at different angle then 90 degree.
Capacity analysis1. Traffic volume – it is the no. of vehicles moving in specified direction on a given lane or road
way that pass a given point or cross-section during specified unit of time. Expressed as vehicle per hour or vehicle per day.
2. Traffic density – it is the no. of vehicles occupying a unit length of a lane of road way at given instant, usually expressed as vehicles per kilometer. Traffic volume is product of the traffic density and vehicle speed.
3. Traffic capacity – it is the ability of a road way to accommodate traffic volume. It is expressed as the maxm no. of vehicle in a lane or a road that can pass o given point in unit time, usually an hour.
It is of 3 types: -a. Basic capacity – It is the maximum no. of passenger cars that can pass a
given point on a lane or a road way during 1 hour under the most ideal road way and traffic conditions which can possibly be attained. It is an ideal and theoretical concept.Maximum capacity (C) which is possible

Speed
Volume
Speed
Volume Density Density
120
100
80
60
40
20
Operating speed
V/C ratio
General concept of level of service
C=1000VS
Where,V= speed in kmph.S= average c/c distance of vehicles in m.
b. Possible capacity – it is the maximum no. of vehicles that can pass a given point on a lane or road way during one hour under prevailing conditions of traffic and roadway. It varies from 0 to basic capacity.
c. Practical capacity – it is the maximum no. of vehicle that can pass a given point on a lane or roadway during one hour, without traffic density being so great as to cause unreasonable delay, hazard or restriction on free driving on drivers. It is called design capacity.
Factor affecting practical capacity: -1. Lane width – lane width decreases, capacity also decreases.2. Speed of vehicles.3. Width of shoulders – shoulders are counted in effective width of lane.4. No. of commercial vehicles on the road – due to large in size they occupy greater space.5. Alignment – improper alignments reduce the capacity.6. Presence of intersections at grade – more the intersections less the capacity, as it reduce the free
flow of traffic.7. Others factor – stream speed, one or two way traffic movements, no. of traffic lanes, vehicular
and drivers characteristics, composition of traffic and the traffic volume.Some facts: -a. Capacity of a single lane road (3.75 m wide) with earthen shoulders = 1000 PCUs/day.b. Capacity of a single lane road (3.75 m wide) with 1m hard shoulders = 2500 PCUs/day.c. Capacity of a two lane road (7.00 m wide) with earthen shoulders = 10000 PCUs/ day.
V/C ratio is less then level of service is more and vice versa
Passenger car unit (PCU)
Actual
All the vehicles on the road have different characteristics in physical sense, and all make the traffic a heterogeneous traffic called mixed traffic flow. This cause problem in generalization any modification for the traffic, so all the vehicles are converted into their equivalent PASSENGER CAR such that they make an uniformity in traffic modification. It is based on vehicle size, weight, and most importantly hindrance in traffic due to this vehicle.Here some of the vehicle whose equivalent PCU is given
1. Car, Auto, Jeep 1.02. Rickshaw 1.53. Cycle, M/C, scooter 0.54. Bus, Truck 3.05. Horse cart 4.06. Small bullock cart 6.07. Big bullock cart 8.0
Traffics are converted into equivalent PCU.
PARKING STUDIESParking is that space where vehicles are stayed.Various aspects to be investigated during parking studies are:
i. Parking demand ii. Parking characteristics iii. Parking space inventory
Two types of parking1. On-street or Kerb parking.2. Off street parking.
TRAFFIC ENVIRONMENTPollution by traffic: -
1. Noise pollution – unwanted sound cause by movement of vehicles and by horn of vehicles, which are not liked by majority of people. Traffic is major source of noise pollution about 55% of total noise pollution.
2. Air pollution – emission of harmful gases by the vehicles caused air pollution.Noise pollution:-
When noise increases its limit then this pollution comes in picture. IRC has listed acceptable limit of noise in different area of traffic.
1. Rural area 25 – 35 dB.2. Suburban area 30 – 40 dB.3. Residential area (urban) 35 – 45 dB.4. Urban (residential+ business) 40 – 45 dB.5. City 45 – 50 dB.6. Industrial 50 – 60 dB.
In any case it must not increase more than 60 dB.Measures to reduce noise level: -
1. Motor vehicle control2. Land use control3. Tree along road4. Buffer zone5. Use of noise barrier – raised portion on the side of road.
Modal studyNoise level = 10.15+ 12.4* log (QW) – 0.041V – 0.465 d.
Where,Qw= no. of vehicles d= distance from edge.V = speed, kmphAir pollution: -

It is caused by the emission of harmful gases as a byproduct from the vehicles.Constituents of air pollutionCO, CO2, Hydro Carbon, NO2, SO2, Lead, Suspended particulate matter (SPM)% contribution in air pollution by different types of vehicles in the traffic:-Type %contribution2 wheeler 77.7Car 11.53 wheeler 5.4Trucks 3.4Buses 2.0
Measures to reduce air pollution: - Use of unleaded petrol. Use of more public transport. Planting more trees along the side of NH, SH mainly. Upgrading engine from 2 strokes to 3 or 4 strokes. Compulsory servicing of vehicles at regular time interval. Use of electrical vehicles. Better planning for lesser stops. Use of CNG in public and well as private transport. Use of bicycles for small distance.
ACCIDENTS STUDIES: -Objectives of accidents studies are: -
1. To evaluate safety.2. To evaluate existing design.3. To support purposed designs.4. To carry out before and after studies and to demonstrate the improvement in the problem.5. To compute financial losses.6. To give economic justification.
Causes of accidents:i. The road user – it involves driver, pedestrians, and passengers.ii. The vehicles – it includes vehicle defects, and vehicle characteristics.iii. The road and its conditions – it includes road conditions, road design, and poor design of
road.iv. Environmental factors and other factors – it includes weather, unmanned crossing, animals,
incorrect sign, and no prior notice.Accidents studies and records:
i. Collections of accidents data – it includes time location, people involved, nature of accidents, road and vehicles conditions, primary cause of accidents and accidents losses.
ii. Accidents report – it is a form a part of report which is to submitted to police authorities for legal actions.
iii. Accidents record – it includes a. Locations files – useful to check the locations of accidents.b. Spot maps – shows the accidents by spot, pin or symbols on a map. c. Condition diagram – it is a drawing to scale showing all important physical conditions of
an accidents location to be studied.d. Collisions diagram – drawing showing approximate path of vehicles and pedestrians
involved in the accidents.

Accidents investigation:Following investigations are to be carried out when accidents occurs:
i. Recording general observationsa. Measurement of length of skid marks due to partial and full skidding.b. Recording the relative position of vehicles and object involved.c. Details of accidents, injuries, and damage.d. Condition diagram of accidents locations.
ii. Drivers testa. Alcohol contentb. Test on drivers characteristics like reaction time, distance judgment, angle of clear vision,
glare vision and recovery.iii. Skid resistance of pavement surfaceiv. Vehicle test
a. Test on conditions of brakes and steering.b. Test on essential accessories and general conditions of vehicle
v. Probable cause of accidentsvi. Cost analysis
a. Injuries and fatalities.b. Damage to vehicle.c. Property damage.d. Investigation and legal proceedings.
Analysis of individual traffic accidents:Modes of vehicular accidents
1. A moving vehicle collides with parked vehicle.2. Two vehicles approaching from two opposite direction collide each other.3. Collision at intersections.4. Moving vehicle collides with stationary object like tree, building etc.
All the above listed things are related to speed of vehicle.Black spot – it is that area on road which is most prone to accidents.
Analysis of speed of vehicles1. By considering conservation of energy
a. Work done by friction to reduce the energy (speed) of vehicles when brakes are applied.b. Momentum conservation before and after collision.
Situations in accidents Before collision – reduction of kinetic energy due to application of brakes and frictional force
overcome that energy.i.e. Kinetic energy of vehicle = work done by frictional force (skid resistance* skid marks* weight)

At collision – momentum of both vehicles before and after collision remains sameBefore collision the speed of vehicle is same as it is obtained from step – 1.
After collision – both vehicle just combine and move some distance with another speed.Energy conservation is used to find out its final velocity before it stops.