traffic analysis for canada border services …downloads/appendix_q_traffic analysis... · a...
TRANSCRIPT

CANADIAN TRANSIT COMPANY Ambassador Bridge Enhancement Project
Avalon Consulting Professionals of Ontario, LLP Submitted in December 2007, updated in April 2011, and revised in May 2012
CEAA ENVIRONMENTAL ENVIRONMENTAL IMPACT ASSESSMENT
AMBASSADOR BRIDGE ENHANCEMENT PROJECT Replacement Span and Plaza Expansion
APPENDIX Q
TRAFFIC ANALYSIS FOR
CANADA BORDER SERVICES AGENCY AMBASSADOR BRIDGE PLAZA MASTER
PLAN

Traffic Analysis for
Canada Border Services Agency Ambassador Bridge Plaza Master Plan
Prepared By:
24 Jarvis Street Fort Erie, Ontario, L2A 2S1 Canada
ACE Project No: 5109964
March 2012

i
TABLE OF CONTENTS
Page 1.0 TRAFFIC DATA COLLECTION .......................................................................... 1 2.0 TRAFFIC ANALYSIS ........................................................................................... 2

ii
LIST OF TABLES Table 2-1 Existing Conditions - AM/PM Intersection Level of Service Summary……….5 Table 2-2 Detour Conditions with No Improvements - AM/PM Intersection Level of Service Summary…………………………………………………………...……………..9 Table 2-3 Detour Conditions with Improvements - AM/PM Intersection Level of Service Summary…………………………………………………………………...…………….12
LIST OF FIGURES Figure 2-1 – Existing Year 2012 AM (PM) Peak Hour Traffic Volumes .......................... 3 Figure 2-2 – Existing Geometry ......................................................................................... 4 Figure 2-3 – Existing Year 2012 AM (PM) Detour Peak Hour Traffic Volumes .............. 7 Figure 2-4 – Improved Geometry under Detour Scenario ................................................ 11
LIST OF APPENDICES A. TRAFFIC COUNTS B. TRAFFIC REDISTRIBUTION C. TRAFFIC ANALYSIS C1. 2012 EXISTING ANALYSIS C2. 2012 DETOUR ANALYSIS WITH NO IMPROVEMENTS C3. 2012 DETOUR ANALYSIS WITH IMPROVEMENTS

1
1.0 TRAFFIC DATA COLLECTION
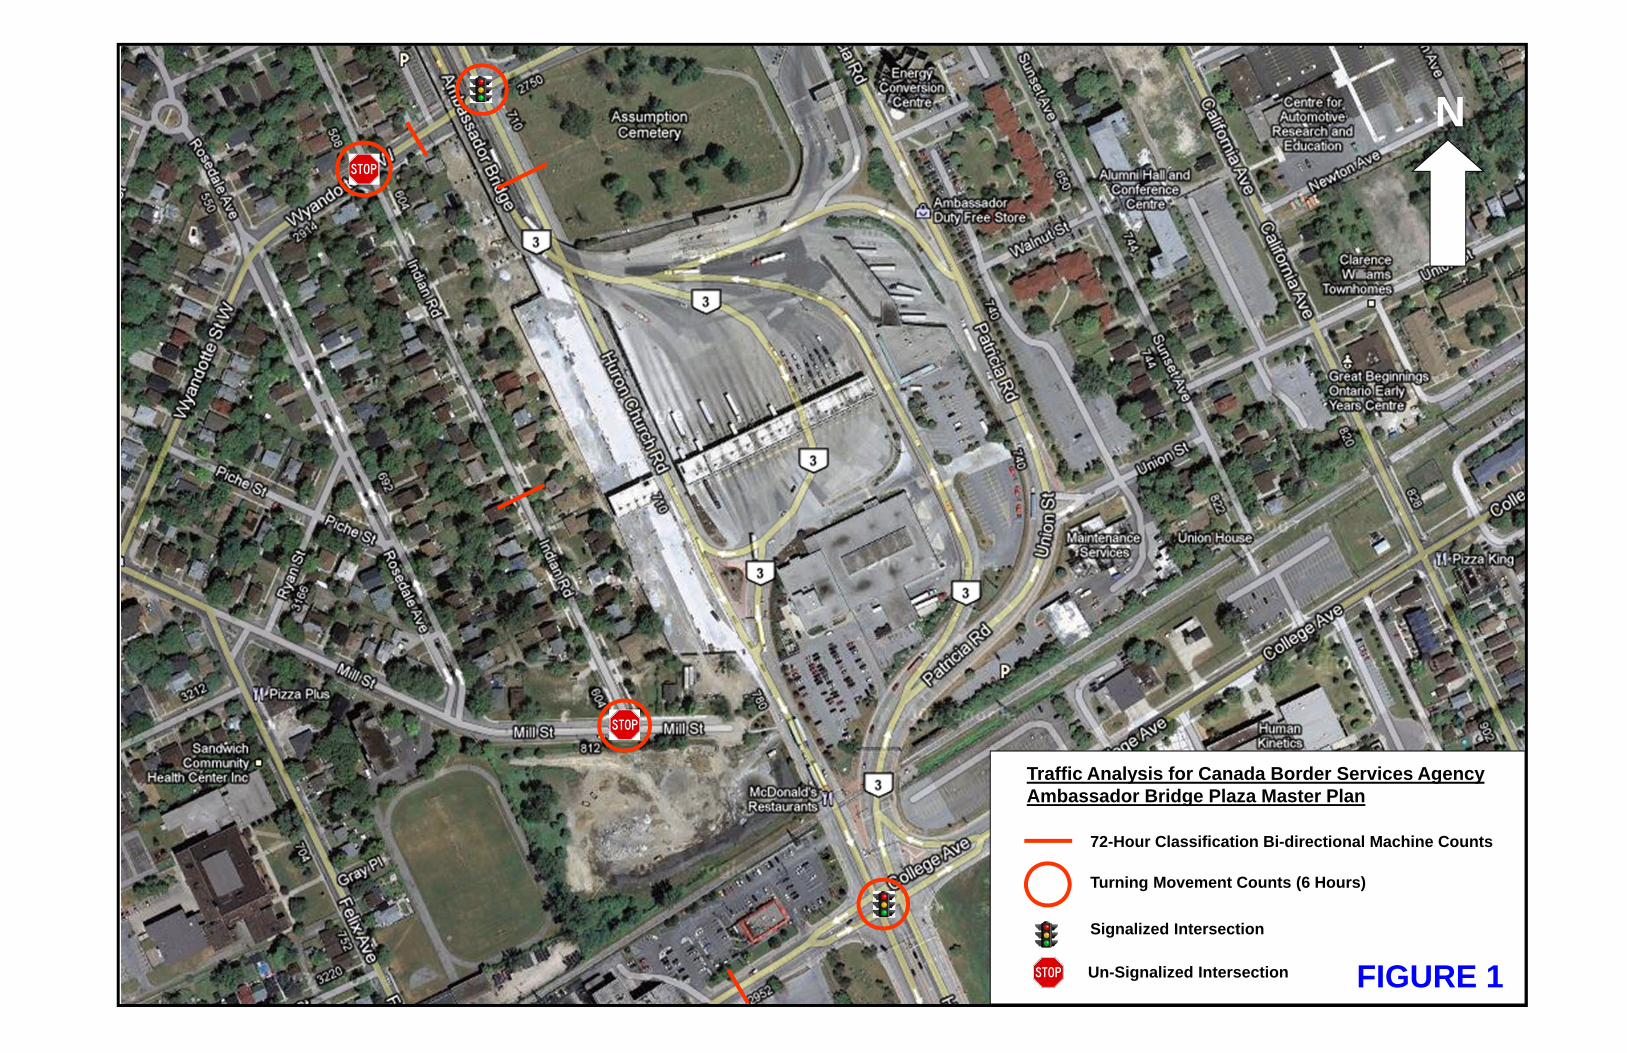
Traffic data including 72 hour bi-directional classification counts and 6 hour vehicle
turning movement counts were conducted for this study during the month of February,
2012.
72 hour machine bi-directional classification counts were conducted between February 7,
2012 and February 9, 2012 at the locations listed below.
Huron Church Road - South of Wyandotte Street
Wyandotte Street - West of Huron Church Road
Indian Road - South of Wyandotte Street
College Avenue - West of Huron Church Road
Manual 6- hour vehicle turning movement counts were conducted on February 8, 2012
for the morning, midday and evening peak hours (from 7:00 am - 9:00 am, 11:00 am -
1:00 pm and 4:00 pm – 6:00 pm). The turning movement counts were conducted at the
four intersections listed below.
College Avenue @ Huron Church Road (signalized)
Mill Street @ Indian Road (un-signalized)
Indian Road @ Wyandotte Street (un-signalized)
Huron Church Road @ Wyandotte Street (signalized)
The count location map and the detail data regarding all the traffic counts collected have
been included in Appendix A.

2
2.0 TRAFFIC ANALYSIS
A traffic analysis was performed as a part of this study in order to evaluate the detour
scenario when Huron Church Road is closed in both the northbound and the southbound
direction between Wyandotte Street and the Toll Plaza. Analyses were conducted for the
existing scenario, detour scenario without any improvements to the existing network and
detour scenario with improvements to the existing network. The truck percentages used
in the analyses have been obtained from the actual peak hour turning movement counts.
The existing year 2012 AM and PM peak hour traffic volumes are shown in Figure 2-1.
The existing geometry is shown in Figure 2-2. An intersection analysis with the existing
geometry and the 2012 traffic volumes was performed using the Highway Capacity
Software (HCS+) for the signalized and the un-signalized study intersections to
determine the existing level of service, volume to capacity (v/c) ratio and delay during
the AM and PM peak hours. The HCS worksheets are included in Appendix C1. The
results of the existing analysis are summarized in Table 2-1.


5
Table 2-1
Existing Conditions - AM/PM Intersection Level of Service and Delay Summary
Intersection (Control)
Movement
AM Peak Hour PM Peak Hour By Movement Overall By Movement Overall
LOS Delay
(Sec/Veh) V/C LOSDelay
(Sec/Veh) LOSDelay
(Sec/Veh) V/C LOSDelay
(Sec/Veh) Indian Road
at Mill Street (Stop
Controlled)
EBL A 7.3 0.00
A 8.5
A 7.2 0.00
A 8.3 SBLTR A 8.5 0.00 A 8.3 0.00
Indian Road at
Wyandotte Street (Stop
Controlled)
EBL A 7.4 0.01
B 10.0
A 7.5 0.00
B 10.6 WBL A 7.5 0.00 A 7.5 0.00
NBLTR A 9.0 0.00 A 9.2 0.01
SBLTR B 10.0 0.01 B 10.6 0.02
Huron Church Road at College Avenue
(Signalized)
EBL C 28.7 0.27
C 20.9
C 27.4 0.12
C 22.5
EBTR C 28.6 0.29 C 28.4 0.27
WBL C 29.7 0.35 D 38.2 0.68
WBT C 27.9 0.19 C 28.5 0.27
WBR C 27.1 0.09 C 26.9 0.06
NBL C 30.3 0.29 D 37.8 0.32
NBTR B 17.8 0.62 C 24.3 0.60
SBL D 36.2 0.10 C 28.7 0.09
SBTR C 21.5 0.36 B 17.2 0.57
Huron Church Road at
Wyandotte Street
(Signalized)
EBLTR C 21.3 0.31
B 17.4
C 21.1 0.30
C 20.1
WBLTR C 22.7 0.49 C 29.1 0.68
NBLTR A 8.7 0.02 A 9.0 0.08
SBL A 9.1 0.11 A 9.4 0.15
SBTR B 10.1 0.27 B 10.9 0.37
The level of service results from the existing analysis show that all the study intersections
operate at acceptable level of service under the existing scenario.

6
Detour Condition
Traffic was reassigned in the existing roadway network reflecting the detour which will
occur when Huron Church Road is closed in both the northbound and the southbound
direction between Wyandotte Street and the Toll Plaza. The redistributed AM and PM
peak hour traffic volumes for the year 2012 are shown in Figure 2-3. The redistribution
of the traffic has been included in Appendix B.
Under the detour scenario, Indian Road will be extended to College Avenue.


8
Detour Analysis
Analysis was conducted for the detour scenario without any improvements to the existing
network with the existing control at each intersection and analysis was also conducted to
identify the improvements to the existing network under the detour scenario for traffic
operation at acceptable level of service.
Detour Analysis with No Improvement
An intersection analysis with the existing volumes and geometry with the proposed
detour was performed using the Highway Capacity Software (HCS+) for the signalized
and un-signalized study intersections to determine the level of service, volume to
capacity (v/c) ratio and delay during the AM and PM peak hours. The HCS worksheets
are included in Appendix C2. The results of the detour analysis without any
improvements are summarized in Table 2-2.
9
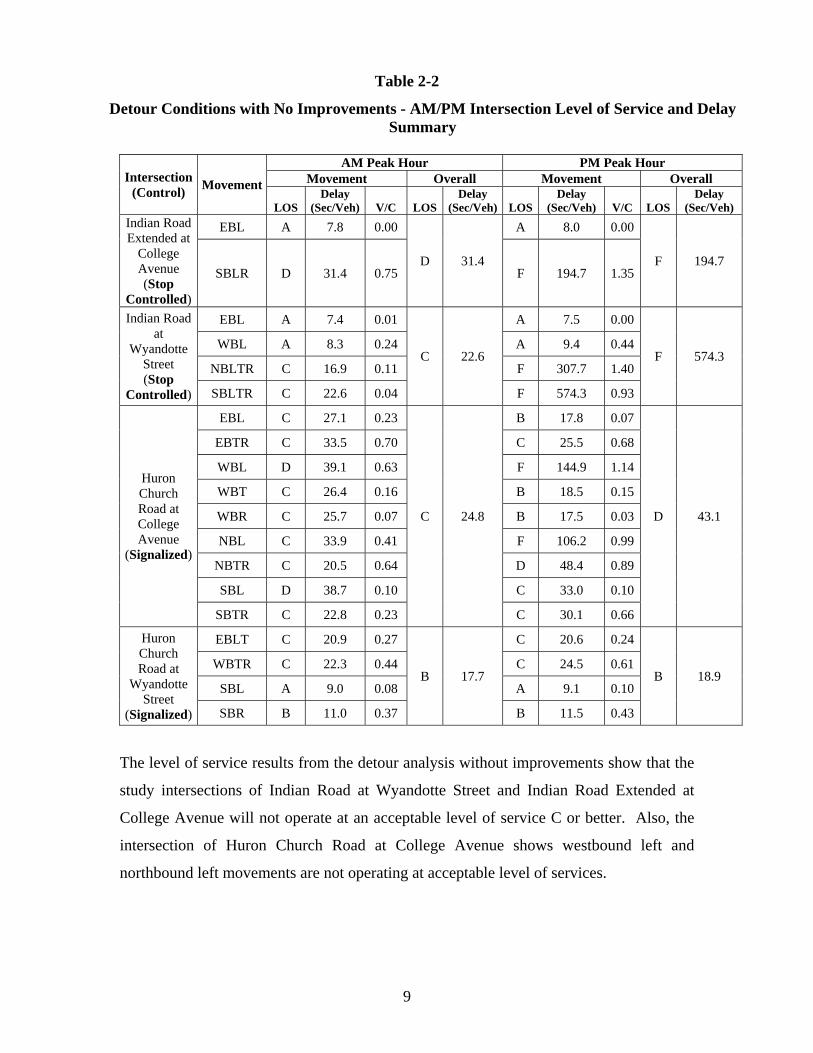
Table 2-2
Detour Conditions with No Improvements - AM/PM Intersection Level of Service and Delay Summary
Intersection (Control)
Movement
AM Peak Hour PM Peak Hour Movement Overall Movement Overall
LOS Delay
(Sec/Veh) V/C LOSDelay
(Sec/Veh) LOSDelay
(Sec/Veh) V/C LOSDelay
(Sec/Veh) Indian Road Extended at
College Avenue (Stop
Controlled)
EBL A 7.8 0.00
D 31.4
A 8.0 0.00
F 194.7 SBLR D 31.4 0.75 F 194.7 1.35
Indian Road at
Wyandotte Street (Stop
Controlled)
EBL A 7.4 0.01
C 22.6
A 7.5 0.00
F 574.3 WBL A 8.3 0.24 A 9.4 0.44
NBLTR C 16.9 0.11 F 307.7 1.40
SBLTR C 22.6 0.04 F 574.3 0.93
Huron Church Road at College Avenue
(Signalized)
EBL C 27.1 0.23
C 24.8
B 17.8 0.07
D 43.1
EBTR C 33.5 0.70 C 25.5 0.68
WBL D 39.1 0.63 F 144.9 1.14
WBT C 26.4 0.16 B 18.5 0.15
WBR C 25.7 0.07 B 17.5 0.03
NBL C 33.9 0.41 F 106.2 0.99
NBTR C 20.5 0.64 D 48.4 0.89
SBL D 38.7 0.10 C 33.0 0.10
SBTR C 22.8 0.23 C 30.1 0.66
Huron Church Road at
Wyandotte Street
(Signalized)
EBLT C 20.9 0.27
B 17.7
C 20.6 0.24
B 18.9 WBTR C 22.3 0.44 C 24.5 0.61
SBL A 9.0 0.08 A 9.1 0.10
SBR B 11.0 0.37 B 11.5 0.43
The level of service results from the detour analysis without improvements show that the
study intersections of Indian Road at Wyandotte Street and Indian Road Extended at
College Avenue will not operate at an acceptable level of service C or better. Also, the
intersection of Huron Church Road at College Avenue shows westbound left and
northbound left movements are not operating at acceptable level of services.

10
Detour Analysis with Improvement
Additional improvements were identified that will be needed for the operation of the
study intersections at an acceptable level of service under the detour scenario. These
additional needed improvements are listed below and are shown in Figure 2-4.
Signalization of the intersection of Indian Road at Wyandotte Street.
Signalization of the intersection of Indian Road Extended at College
Avenue.
Conversion of the eastbound shared right-through lane for the intersection
of Huron Church Road at College Avenue to an exclusive right turn lane.
An intersection analysis with these improvements which are also shown in Figure 2-4
and the 2012 detour traffic volumes was performed using the Highway Capacity Software
(HCS+) for the signalized study intersections to determine the level of service, volume to
capacity (v/c) ratio and delay during the AM and PM peak hours. The HCS worksheets
are included in Appendix C3. The results of the detour analysis with improvements are
summarized in Table 2-3.


12
Table 2-3
Detour Conditions with Improvements - AM/PM Intersection Level of Service and Delay Summary
Intersection (Control)
Movement
AM Peak Hour PM Peak Hour Movement Overall Movement Overall
LOS Delay
(Sec/Veh) V/C LOS Delay
(Sec/Veh) LOSDelay
(Sec/Veh) V/C LOS Delay
(Sec/Veh)Indian Road Extended at
College Avenue
(Signalized)
EBL B 20.0 0.53
B 16.3
B 18.9 0.44
B 19.9 WBTR B 18.9 0.43 C 21.5 0.60
SBLR B 11.5 0.43 B 19.5 0.79
Indian Road at
Wyandotte Street
(Signalized)
EBLTR B 19.6 0.27
B 10.2
C 20.8 0.26
C 20.2 WBLTR A 4.9 0.46 B 17.8 0.86
NBLTR C 31.8 0.19 C 32.6 0.52
SBLTR C 30.9 0.05 C 28.4 0.05
Huron Church Road at College Avenue
(Signalized -Revised Eastbound Geometry)
EBL C 27.1 0.23
C 22.8
C 25.5 0.09
C 31.8
EBT C 27.2 0.26 C 26.6 0.21
EBR C 23.4 0.67 C 33.1 0.89
WBL C 27.5 0.27 C 29.7 0.46
WBT C 26.4 0.16 C 26.5 0.20
WBR C 25.7 0.07 C 25.0 0.04
NBL C 33.9 0.41 D 46.4 0.65
NBTR C 20.5 0.64 D 36.5 0.70
SBL D 38.7 0.10 C 30.4 0.08
SBTR C 22.8 0.23 C 26.6 0.56
Huron Church Road at
Wyandotte Street
(Signalized)
EBLT C 20.9 0.27
B 17.7
C 20.6 0.24
B 18.9 WBTR C 22.3 0.44 C 24.5 0.61
SBL A 9.0 0.08 A 9.1 0.10
SBR B 11.0 0.37 B 11.5 0.43
Based on the traffic analysis conducted with all the recommended improvements, the
study intersections will operate at an acceptable level of service under the detour
condition.

APPENDICES

APPENDIX A
TRAFFIC COUNTS
Traffic Analysis for Canada Border Services AgencyAmbassador Bridge Plaza Master Plan
72-Hour Classification Bi-directional Machine Counts
Turning Movement Counts (6 Hours)
N
FIGURE 1Signalized Intersection
Un-Signalized Intersection

Page 1
Site Code: 1Station ID: D9
Huron Church Rdbtw Wyandotte St - The Plaza
Date Start: 07-Feb-12Date End: 09-Feb-12
Your Company NameStreet Address
Location, Zip or Postal CodePhone or Tag Line
NBStart Cars & 2 Axle 2 Axle 3 Axle 4 Axle <5 Axl 5 Axle >6 Axl <6 Axl 6 Axle >6 Axl Time Bikes Trailers Long Buses 6 Tire Single Single Double Double Double Multi Multi Multi Total
07/02/12 0 8 1 1 0 1 0 0 0 0 0 0 0 1101:00 0 3 2 0 0 0 0 0 0 0 0 0 0 502:00 0 1 0 0 0 0 0 1 0 0 0 0 0 203:00 0 1 0 1 0 0 0 0 0 0 0 0 0 204:00 0 3 3 0 0 0 0 0 0 0 0 0 0 605:00 0 8 1 0 1 1 0 0 0 0 0 0 0 1106:00 0 16 2 2 1 0 0 1 0 0 0 0 0 2207:00 0 20 5 1 4 0 0 0 0 0 0 0 0 3008:00 0 29 6 5 3 0 0 0 0 0 0 0 0 4309:00 0 19 6 2 0 0 1 0 0 0 0 0 0 2810:00 0 17 7 2 4 0 0 0 0 0 0 0 0 3011:00 0 29 2 3 3 1 0 0 0 0 0 0 0 38
12 PM 0 28 12 1 1 0 0 0 0 0 0 0 0 4213:00 0 28 5 6 1 2 2 0 0 1 0 0 0 4514:00 0 35 10 3 4 1 2 0 0 0 0 0 0 5515:00 0 30 15 6 5 1 2 1 0 2 0 0 0 6216:00 0 62 17 3 1 5 2 0 2 0 0 0 0 9217:00 0 72 17 4 3 5 1 1 1 0 0 0 0 10418:00 0 57 17 6 1 3 1 0 0 0 0 0 0 8519:00 0 47 15 7 2 2 3 0 1 1 0 0 0 7820:00 0 68 15 11 4 0 1 0 0 1 0 0 0 10021:00 0 64 14 5 2 4 1 0 0 0 0 0 0 9022:00 0 46 19 6 3 0 0 0 0 0 0 0 0 7423:00 0 51 9 4 0 0 2 1 0 0 0 0 0 67
DayTotal
0 742 200 79 43 26 18 5 4 5 0 0 0 1122
Percent 0.0% 66.1% 17.8% 7.0% 3.8% 2.3% 1.6% 0.4% 0.4% 0.4% 0.0% 0.0% 0.0% AM Peak 08:00 10:00 08:00 07:00 00:00 09:00 02:00 08:00
Vol. 29 7 5 4 1 1 1 43PM Peak 17:00 22:00 20:00 15:00 16:00 19:00 15:00 16:00 15:00 17:00
Vol. 72 19 11 5 5 3 1 2 2 104

Page 2
Site Code: 1Station ID: D9
Huron Church Rdbtw Wyandotte St - The Plaza
Date Start: 07-Feb-12Date End: 09-Feb-12
Your Company NameStreet Address
Location, Zip or Postal CodePhone or Tag Line
NBStart Cars & 2 Axle 2 Axle 3 Axle 4 Axle <5 Axl 5 Axle >6 Axl <6 Axl 6 Axle >6 Axl Time Bikes Trailers Long Buses 6 Tire Single Single Double Double Double Multi Multi Multi Total
08/02/12 0 2 0 0 0 0 0 0 0 0 0 0 0 201:00 0 4 0 0 0 0 0 0 0 0 0 0 0 402:00 0 1 1 0 0 0 0 0 0 0 0 0 0 203:00 0 4 0 2 1 0 0 0 0 0 0 0 0 704:00 0 3 0 1 0 0 0 0 0 0 0 0 0 405:00 0 5 2 2 0 0 0 0 0 0 0 0 0 906:00 0 14 2 0 0 0 1 0 0 0 0 0 0 1707:00 0 15 3 2 0 0 0 0 0 0 0 0 0 2008:00 0 22 4 1 1 1 1 2 0 1 0 0 0 3309:00 0 13 6 2 1 0 1 0 0 0 0 0 0 2310:00 0 9 5 1 0 0 0 0 0 0 0 0 0 1511:00 0 18 6 3 0 3 0 0 0 0 0 0 0 30
12 PM 0 26 3 3 1 0 0 1 1 0 0 0 0 3513:00 0 32 11 3 4 2 0 0 0 1 0 0 0 5314:00 0 28 11 4 2 3 1 0 0 0 0 0 0 4915:00 0 37 16 2 1 3 0 0 0 1 0 0 0 6016:00 0 55 16 13 2 0 1 1 0 0 0 0 0 8817:00 0 69 22 6 7 4 0 0 1 2 0 0 0 11118:00 0 50 16 4 4 2 0 1 0 0 0 0 0 7719:00 0 51 11 3 2 0 1 0 0 1 0 0 0 6920:00 0 45 17 11 2 0 2 0 0 1 0 0 0 7821:00 0 47 13 6 3 3 3 1 1 0 0 0 0 7722:00 0 33 12 3 1 4 0 0 0 0 0 0 0 5323:00 0 22 8 2 2 0 0 0 0 0 0 0 0 34
DayTotal
0 605 185 74 34 25 11 6 3 7 0 0 0 950
Percent 0.0% 63.7% 19.5% 7.8% 3.6% 2.6% 1.2% 0.6% 0.3% 0.7% 0.0% 0.0% 0.0% AM Peak 08:00 09:00 11:00 03:00 11:00 06:00 08:00 08:00 08:00
Vol. 22 6 3 1 3 1 2 1 33PM Peak 17:00 17:00 16:00 17:00 17:00 21:00 12:00 12:00 17:00 17:00
Vol. 69 22 13 7 4 3 1 1 2 111

Page 3
Site Code: 1Station ID: D9
Huron Church Rdbtw Wyandotte St - The Plaza
Date Start: 07-Feb-12Date End: 09-Feb-12
Your Company NameStreet Address
Location, Zip or Postal CodePhone or Tag Line
NBStart Cars & 2 Axle 2 Axle 3 Axle 4 Axle <5 Axl 5 Axle >6 Axl <6 Axl 6 Axle >6 Axl Time Bikes Trailers Long Buses 6 Tire Single Single Double Double Double Multi Multi Multi Total
09/02/12 0 5 2 0 1 0 0 0 0 0 0 0 0 801:00 0 1 1 0 0 1 0 0 0 0 0 0 0 302:00 0 1 1 0 0 0 0 0 0 0 0 0 0 203:00 0 1 0 1 0 0 0 0 0 0 0 0 0 204:00 0 1 2 1 0 0 0 0 0 1 0 0 0 505:00 0 6 3 2 0 0 0 0 0 0 0 0 0 1106:00 0 18 1 2 1 0 0 0 0 1 0 0 0 2307:00 0 17 4 1 1 0 1 0 0 1 0 0 0 2508:00 0 17 9 1 2 0 3 1 0 0 0 0 0 3309:00 0 19 6 1 2 0 1 0 0 0 0 0 0 2910:00 0 17 4 0 1 1 0 0 0 0 0 0 0 2311:00 0 20 5 2 0 1 1 0 0 0 0 0 0 29
12 PM 0 31 4 2 0 0 1 0 1 0 0 0 0 3913:00 0 29 7 6 2 1 0 0 1 0 0 0 0 4614:00 0 38 7 2 2 2 0 1 0 1 0 0 0 5315:00 0 39 12 4 2 2 0 0 1 0 0 0 0 6016:00 0 58 18 2 5 3 0 0 1 0 0 0 0 8717:00 0 76 20 4 4 6 2 0 0 0 0 0 0 11218:00 0 62 13 5 3 1 3 0 0 2 0 0 0 8919:00 0 49 13 10 1 0 2 0 0 0 0 0 0 7520:00 0 65 9 6 5 0 1 0 2 1 0 0 0 8921:00 0 58 16 6 3 3 0 0 0 0 0 0 0 8622:00 0 38 10 7 4 1 0 0 0 0 0 0 0 6023:00 0 35 6 2 1 2 1 0 0 0 0 0 0 47
DayTotal
0 701 173 67 40 24 16 2 6 7 0 0 0 1036
Percent 0.0% 67.7% 16.7% 6.5% 3.9% 2.3% 1.5% 0.2% 0.6% 0.7% 0.0% 0.0% 0.0% AM Peak 11:00 08:00 05:00 08:00 01:00 08:00 08:00 04:00 08:00
Vol. 20 9 2 2 1 3 1 1 33PM Peak 17:00 17:00 19:00 16:00 17:00 18:00 14:00 20:00 18:00 17:00
Vol. 76 20 10 5 6 3 1 2 2 112
GrandTotal
0 2048 558 220 117 75 45 13 13 19 0 0 0 3108
Percent 0.0% 65.9% 18.0% 7.1% 3.8% 2.4% 1.4% 0.4% 0.4% 0.6% 0.0% 0.0% 0.0%

Page 4
Site Code: 1Station ID: D9
Huron Church Rdbtw Wyandotte St - The Plaza
Date Start: 07-Feb-12Date End: 09-Feb-12
Your Company NameStreet Address
Location, Zip or Postal CodePhone or Tag Line
SBStart Cars & 2 Axle 2 Axle 3 Axle 4 Axle <5 Axl 5 Axle >6 Axl <6 Axl 6 Axle >6 Axl Time Bikes Trailers Long Buses 6 Tire Single Single Double Double Double Multi Multi Multi Total
07/02/12 0 24 4 0 0 2 1 0 0 1 0 0 0 3201:00 0 15 3 0 0 0 1 0 0 0 0 0 0 1902:00 0 9 2 1 0 0 1 0 0 0 0 0 0 1303:00 0 9 2 0 0 0 0 0 0 0 0 0 0 1104:00 0 5 1 1 1 0 0 0 0 0 0 0 0 805:00 0 34 10 1 0 1 0 0 0 1 0 0 0 4706:00 0 78 19 5 3 4 0 0 1 0 0 0 0 11007:00 0 139 30 14 4 9 3 0 1 0 0 0 0 20008:00 0 245 67 17 10 4 3 1 2 1 0 2 0 35209:00 0 246 68 21 9 13 2 1 4 1 0 0 0 36510:00 0 236 74 24 4 7 2 1 2 0 0 2 0 35211:00 0 232 62 13 4 6 4 1 1 1 0 0 0 324
12 PM 0 248 75 21 8 7 2 2 1 2 0 0 0 36613:00 0 240 68 17 7 9 3 3 2 2 0 0 0 35114:00 0 266 82 22 11 9 5 1 1 1 0 2 0 40015:00 0 355 80 21 20 8 5 3 3 2 0 0 0 49716:00 0 376 111 30 25 7 11 4 3 6 0 1 0 57417:00 0 455 106 34 14 12 4 0 4 0 0 0 0 62918:00 0 263 78 16 11 5 4 0 0 1 0 0 0 37819:00 0 235 79 20 12 5 5 1 1 0 0 1 0 35920:00 0 173 62 15 10 1 2 0 0 0 0 0 0 26321:00 0 124 25 11 5 3 3 0 0 0 0 0 0 17122:00 0 69 24 11 1 1 3 1 1 1 0 0 0 11223:00 0 57 16 3 3 2 0 0 0 0 0 0 0 81
DayTotal
0 4133 1148 318 162 115 64 19 27 20 0 8 0 6014
Percent 0.0% 68.7% 19.1% 5.3% 2.7% 1.9% 1.1% 0.3% 0.4% 0.3% 0.0% 0.1% 0.0% AM Peak 09:00 10:00 10:00 08:00 09:00 11:00 08:00 09:00 00:00 08:00 09:00
Vol. 246 74 24 10 13 4 1 4 1 2 365PM Peak 17:00 16:00 17:00 16:00 17:00 16:00 16:00 17:00 16:00 14:00 17:00
Vol. 455 111 34 25 12 11 4 4 6 2 629

Page 5
Site Code: 1Station ID: D9
Huron Church Rdbtw Wyandotte St - The Plaza
Date Start: 07-Feb-12Date End: 09-Feb-12
Your Company NameStreet Address
Location, Zip or Postal CodePhone or Tag Line
SBStart Cars & 2 Axle 2 Axle 3 Axle 4 Axle <5 Axl 5 Axle >6 Axl <6 Axl 6 Axle >6 Axl Time Bikes Trailers Long Buses 6 Tire Single Single Double Double Double Multi Multi Multi Total
08/02/12 0 19 1 2 1 1 0 1 0 0 0 0 0 2501:00 0 9 4 0 0 0 0 0 0 0 0 0 0 1302:00 0 9 2 1 0 0 0 0 1 0 0 0 0 1303:00 0 4 1 1 2 0 0 2 0 0 0 0 0 1004:00 0 9 2 2 0 0 0 0 0 0 0 0 0 1305:00 0 22 6 1 2 2 1 1 0 0 0 0 0 3506:00 0 69 12 2 2 0 3 0 0 0 0 0 0 8807:00 0 124 35 13 5 5 1 0 1 2 0 0 0 18608:00 0 258 68 14 11 3 4 0 1 2 0 0 0 36109:00 0 214 48 22 14 3 2 2 3 2 0 1 0 31110:00 0 238 66 13 13 2 1 1 0 2 0 0 0 33611:00 0 260 61 23 11 8 3 1 1 0 0 0 0 368
12 PM 0 263 58 18 13 8 2 2 2 0 0 1 0 36713:00 0 253 68 21 9 8 3 0 1 0 0 0 0 36314:00 0 242 77 18 14 7 3 0 2 1 0 0 0 36415:00 0 361 87 19 16 13 6 3 4 3 0 2 0 51416:00 0 388 106 31 25 7 7 0 2 0 0 0 0 56617:00 0 467 111 40 17 13 5 2 3 2 0 1 0 66118:00 0 265 62 17 15 11 6 1 4 1 0 0 0 38219:00 0 258 68 23 9 5 7 1 1 3 0 1 0 37620:00 0 175 55 8 12 5 8 0 4 1 0 1 0 26921:00 0 105 23 13 2 2 3 0 0 1 0 0 0 14922:00 0 79 22 10 3 1 1 0 2 0 0 1 0 11923:00 0 50 15 3 2 3 0 1 0 1 0 0 0 75
DayTotal
0 4141 1058 315 198 107 66 18 32 21 0 8 0 5964
Percent 0.0% 69.4% 17.7% 5.3% 3.3% 1.8% 1.1% 0.3% 0.5% 0.4% 0.0% 0.1% 0.0% AM Peak 11:00 08:00 11:00 09:00 11:00 08:00 03:00 09:00 07:00 09:00 11:00
Vol. 260 68 23 14 8 4 2 3 2 1 368PM Peak 17:00 17:00 17:00 16:00 15:00 20:00 15:00 15:00 15:00 15:00 17:00
Vol. 467 111 40 25 13 8 3 4 3 2 661

Page 6
Site Code: 1Station ID: D9
Huron Church Rdbtw Wyandotte St - The Plaza
Date Start: 07-Feb-12Date End: 09-Feb-12
Your Company NameStreet Address
Location, Zip or Postal CodePhone or Tag Line
SBStart Cars & 2 Axle 2 Axle 3 Axle 4 Axle <5 Axl 5 Axle >6 Axl <6 Axl 6 Axle >6 Axl Time Bikes Trailers Long Buses 6 Tire Single Single Double Double Double Multi Multi Multi Total
09/02/12 0 16 4 1 1 1 0 0 1 0 0 0 0 2401:00 0 8 5 2 0 1 0 0 1 0 0 0 0 1702:00 0 6 3 1 0 0 1 0 0 0 0 0 0 1103:00 0 8 1 0 0 0 0 0 0 0 0 0 0 904:00 0 4 3 0 1 0 0 0 0 0 0 0 0 805:00 0 33 9 1 2 1 0 0 0 0 0 1 0 4706:00 0 69 24 5 1 1 1 0 1 1 0 1 0 10407:00 0 137 44 11 2 3 3 0 0 0 0 1 0 20108:00 0 237 64 19 12 8 7 0 5 1 0 2 0 35509:00 0 231 63 14 17 7 2 1 2 1 0 0 0 33810:00 0 235 60 11 7 9 3 1 3 1 0 0 0 33011:00 0 231 65 17 7 7 5 0 4 1 0 2 0 339
12 PM 0 264 71 17 13 7 1 0 2 2 0 0 0 37713:00 0 244 77 16 8 9 1 1 3 0 0 0 0 35914:00 0 257 81 18 7 4 7 0 3 1 0 0 0 37815:00 0 346 95 21 19 6 5 1 2 1 0 0 0 49616:00 0 405 116 28 13 11 7 0 3 1 0 0 0 58417:00 0 460 129 46 16 16 8 1 1 1 0 0 0 67818:00 0 292 75 11 16 4 3 3 1 1 0 0 0 40619:00 0 271 73 14 12 6 5 1 4 1 0 1 0 38820:00 0 165 52 6 6 8 1 1 2 3 0 0 0 24421:00 0 103 32 2 8 1 2 0 0 1 0 1 0 15022:00 0 84 21 3 3 1 1 0 0 1 0 0 0 11423:00 0 57 14 3 0 1 1 0 1 1 0 0 0 78
DayTotal
0 4163 1181 267 171 112 64 10 39 19 0 9 0 6035
Percent 0.0% 69.0% 19.6% 4.4% 2.8% 1.9% 1.1% 0.2% 0.6% 0.3% 0.0% 0.1% 0.0% AM Peak 08:00 11:00 08:00 09:00 10:00 08:00 09:00 08:00 06:00 08:00 08:00
Vol. 237 65 19 17 9 7 1 5 1 2 355PM Peak 17:00 17:00 17:00 15:00 17:00 17:00 18:00 19:00 20:00 19:00 17:00
Vol. 460 129 46 19 16 8 3 4 3 1 678
GrandTotal
0 12437 3387 900 531 334 194 47 98 60 0 25 0 18013
Percent 0.0% 69.0% 18.8% 5.0% 2.9% 1.9% 1.1% 0.3% 0.5% 0.3% 0.0% 0.1% 0.0%

Page 7
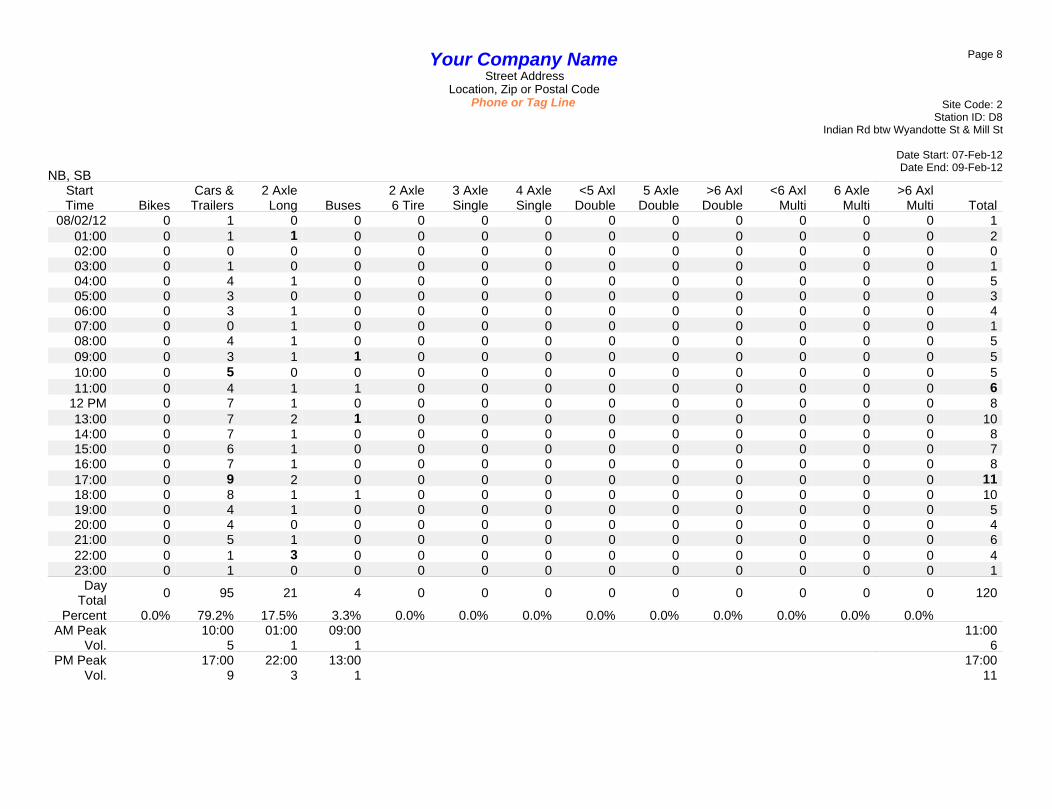
Site Code: 1Station ID: D9
Huron Church Rdbtw Wyandotte St - The Plaza
Date Start: 07-Feb-12Date End: 09-Feb-12
Your Company NameStreet Address
Location, Zip or Postal CodePhone or Tag Line
NB, SBStart Cars & 2 Axle 2 Axle 3 Axle 4 Axle <5 Axl 5 Axle >6 Axl <6 Axl 6 Axle >6 Axl Time Bikes Trailers Long Buses 6 Tire Single Single Double Double Double Multi Multi Multi Total
07/02/12 0 32 5 1 0 3 1 0 0 1 0 0 0 4301:00 0 18 5 0 0 0 1 0 0 0 0 0 0 2402:00 0 10 2 1 0 0 1 1 0 0 0 0 0 1503:00 0 10 2 1 0 0 0 0 0 0 0 0 0 1304:00 0 8 4 1 1 0 0 0 0 0 0 0 0 1405:00 0 42 11 1 1 2 0 0 0 1 0 0 0 5806:00 0 94 21 7 4 4 0 1 1 0 0 0 0 13207:00 0 159 35 15 8 9 3 0 1 0 0 0 0 23008:00 0 274 73 22 13 4 3 1 2 1 0 2 0 39509:00 0 265 74 23 9 13 3 1 4 1 0 0 0 39310:00 0 253 81 26 8 7 2 1 2 0 0 2 0 38211:00 0 261 64 16 7 7 4 1 1 1 0 0 0 362
12 PM 0 276 87 22 9 7 2 2 1 2 0 0 0 40813:00 0 268 73 23 8 11 5 3 2 3 0 0 0 39614:00 0 301 92 25 15 10 7 1 1 1 0 2 0 45515:00 0 385 95 27 25 9 7 4 3 4 0 0 0 55916:00 0 438 128 33 26 12 13 4 5 6 0 1 0 66617:00 0 527 123 38 17 17 5 1 5 0 0 0 0 73318:00 0 320 95 22 12 8 5 0 0 1 0 0 0 46319:00 0 282 94 27 14 7 8 1 2 1 0 1 0 43720:00 0 241 77 26 14 1 3 0 0 1 0 0 0 36321:00 0 188 39 16 7 7 4 0 0 0 0 0 0 26122:00 0 115 43 17 4 1 3 1 1 1 0 0 0 18623:00 0 108 25 7 3 2 2 1 0 0 0 0 0 148
DayTotal
0 4875 1348 397 205 141 82 24 31 25 0 8 0 7136
Percent 0.0% 68.3% 18.9% 5.6% 2.9% 2.0% 1.1% 0.3% 0.4% 0.4% 0.0% 0.1% 0.0% AM Peak 08:00 10:00 10:00 08:00 09:00 11:00 02:00 09:00 00:00 08:00 08:00
Vol. 274 81 26 13 13 4 1 4 1 2 395PM Peak 17:00 16:00 17:00 16:00 17:00 16:00 15:00 16:00 16:00 14:00 17:00
Vol. 527 128 38 26 17 13 4 5 6 2 733

Page 8
Site Code: 1Station ID: D9
Huron Church Rdbtw Wyandotte St - The Plaza
Date Start: 07-Feb-12Date End: 09-Feb-12
Your Company NameStreet Address
Location, Zip or Postal CodePhone or Tag Line
NB, SBStart Cars & 2 Axle 2 Axle 3 Axle 4 Axle <5 Axl 5 Axle >6 Axl <6 Axl 6 Axle >6 Axl Time Bikes Trailers Long Buses 6 Tire Single Single Double Double Double Multi Multi Multi Total
08/02/12 0 21 1 2 1 1 0 1 0 0 0 0 0 2701:00 0 13 4 0 0 0 0 0 0 0 0 0 0 1702:00 0 10 3 1 0 0 0 0 1 0 0 0 0 1503:00 0 8 1 3 3 0 0 2 0 0 0 0 0 1704:00 0 12 2 3 0 0 0 0 0 0 0 0 0 1705:00 0 27 8 3 2 2 1 1 0 0 0 0 0 4406:00 0 83 14 2 2 0 4 0 0 0 0 0 0 10507:00 0 139 38 15 5 5 1 0 1 2 0 0 0 20608:00 0 280 72 15 12 4 5 2 1 3 0 0 0 39409:00 0 227 54 24 15 3 3 2 3 2 0 1 0 33410:00 0 247 71 14 13 2 1 1 0 2 0 0 0 35111:00 0 278 67 26 11 11 3 1 1 0 0 0 0 398
12 PM 0 289 61 21 14 8 2 3 3 0 0 1 0 40213:00 0 285 79 24 13 10 3 0 1 1 0 0 0 41614:00 0 270 88 22 16 10 4 0 2 1 0 0 0 41315:00 0 398 103 21 17 16 6 3 4 4 0 2 0 57416:00 0 443 122 44 27 7 8 1 2 0 0 0 0 65417:00 0 536 133 46 24 17 5 2 4 4 0 1 0 77218:00 0 315 78 21 19 13 6 2 4 1 0 0 0 45919:00 0 309 79 26 11 5 8 1 1 4 0 1 0 44520:00 0 220 72 19 14 5 10 0 4 2 0 1 0 34721:00 0 152 36 19 5 5 6 1 1 1 0 0 0 22622:00 0 112 34 13 4 5 1 0 2 0 0 1 0 17223:00 0 72 23 5 4 3 0 1 0 1 0 0 0 109
DayTotal
0 4746 1243 389 232 132 77 24 35 28 0 8 0 6914
Percent 0.0% 68.6% 18.0% 5.6% 3.4% 1.9% 1.1% 0.3% 0.5% 0.4% 0.0% 0.1% 0.0% AM Peak 08:00 08:00 11:00 09:00 11:00 08:00 03:00 09:00 08:00 09:00 11:00
Vol. 280 72 26 15 11 5 2 3 3 1 398PM Peak 17:00 17:00 17:00 16:00 17:00 20:00 12:00 15:00 15:00 15:00 17:00
Vol. 536 133 46 27 17 10 3 4 4 2 772

Page 9
Site Code: 1Station ID: D9
Huron Church Rdbtw Wyandotte St - The Plaza
Date Start: 07-Feb-12Date End: 09-Feb-12
Your Company NameStreet Address
Location, Zip or Postal CodePhone or Tag Line
NB, SBStart Cars & 2 Axle 2 Axle 3 Axle 4 Axle <5 Axl 5 Axle >6 Axl <6 Axl 6 Axle >6 Axl Time Bikes Trailers Long Buses 6 Tire Single Single Double Double Double Multi Multi Multi Total
09/02/12 0 21 6 1 2 1 0 0 1 0 0 0 0 3201:00 0 9 6 2 0 2 0 0 1 0 0 0 0 2002:00 0 7 4 1 0 0 1 0 0 0 0 0 0 1303:00 0 9 1 1 0 0 0 0 0 0 0 0 0 1104:00 0 5 5 1 1 0 0 0 0 1 0 0 0 1305:00 0 39 12 3 2 1 0 0 0 0 0 1 0 5806:00 0 87 25 7 2 1 1 0 1 2 0 1 0 12707:00 0 154 48 12 3 3 4 0 0 1 0 1 0 22608:00 0 254 73 20 14 8 10 1 5 1 0 2 0 38809:00 0 250 69 15 19 7 3 1 2 1 0 0 0 36710:00 0 252 64 11 8 10 3 1 3 1 0 0 0 35311:00 0 251 70 19 7 8 6 0 4 1 0 2 0 368
12 PM 0 295 75 19 13 7 2 0 3 2 0 0 0 41613:00 0 273 84 22 10 10 1 1 4 0 0 0 0 40514:00 0 295 88 20 9 6 7 1 3 2 0 0 0 43115:00 0 385 107 25 21 8 5 1 3 1 0 0 0 55616:00 0 463 134 30 18 14 7 0 4 1 0 0 0 67117:00 0 536 149 50 20 22 10 1 1 1 0 0 0 79018:00 0 354 88 16 19 5 6 3 1 3 0 0 0 49519:00 0 320 86 24 13 6 7 1 4 1 0 1 0 46320:00 0 230 61 12 11 8 2 1 4 4 0 0 0 33321:00 0 161 48 8 11 4 2 0 0 1 0 1 0 23622:00 0 122 31 10 7 2 1 0 0 1 0 0 0 17423:00 0 92 20 5 1 3 2 0 1 1 0 0 0 125
DayTotal
0 4864 1354 334 211 136 80 12 45 26 0 9 0 7071
Percent 0.0% 68.8% 19.1% 4.7% 3.0% 1.9% 1.1% 0.2% 0.6% 0.4% 0.0% 0.1% 0.0% AM Peak 08:00 08:00 08:00 09:00 10:00 08:00 08:00 08:00 06:00 08:00 08:00
Vol. 254 73 20 19 10 10 1 5 2 2 388PM Peak 17:00 17:00 17:00 15:00 17:00 17:00 18:00 13:00 20:00 19:00 17:00
Vol. 536 149 50 21 22 10 3 4 4 1 790
GrandTotal
0 14485 3945 1120 648 409 239 60 111 79 0 25 0 21121
Percent 0.0% 68.6% 18.7% 5.3% 3.1% 1.9% 1.1% 0.3% 0.5% 0.4% 0.0% 0.1% 0.0%

Page 1
Site Code: 4Station ID: D6Wyandotte St
btw Indian Rd & Huron Church RdDate Start: 07-Feb-12Date End: 09-Feb-12
Your Company NameStreet Address
Location, Zip or Postal CodePhone or Tag Line
EBStart Cars & 2 Axle 2 Axle 3 Axle 4 Axle <5 Axl 5 Axle >6 Axl <6 Axl 6 Axle >6 Axl Time Bikes Trailers Long Buses 6 Tire Single Single Double Double Double Multi Multi Multi Total
07/02/12 0 18 6 1 0 1 0 0 0 0 0 0 0 2601:00 0 4 3 0 0 0 0 0 0 0 0 0 0 702:00 0 10 2 0 0 0 0 1 0 0 0 0 0 1303:00 0 10 0 0 0 0 0 0 0 0 0 0 0 1004:00 0 19 4 4 1 0 0 0 0 0 0 0 0 2805:00 0 40 7 2 4 3 0 0 0 0 0 1 0 5706:00 0 52 22 3 3 1 5 2 1 0 0 0 0 8907:00 0 63 15 9 4 0 2 0 0 0 0 0 0 9308:00 0 102 27 8 8 0 4 3 2 0 1 0 0 15509:00 0 74 27 10 5 0 5 0 0 0 1 1 0 12310:00 0 75 21 7 8 1 1 0 0 0 0 0 0 11311:00 0 61 16 4 4 1 2 0 0 0 1 0 0 89
12 PM 0 70 18 6 6 2 3 1 1 0 0 0 0 10713:00 0 84 21 9 5 1 4 0 1 0 0 0 0 12514:00 0 106 45 15 6 3 2 4 0 1 1 0 0 18315:00 0 94 27 7 6 1 1 1 0 0 0 0 0 13716:00 0 92 35 11 2 0 4 2 1 0 0 0 0 14717:00 0 71 35 6 7 1 4 0 3 0 0 0 0 12718:00 0 75 25 6 2 1 3 0 1 0 1 0 0 11419:00 0 67 22 9 5 2 1 2 0 0 0 0 0 10820:00 0 66 19 4 5 0 2 2 1 0 0 0 0 9921:00 0 64 14 4 6 0 1 1 0 0 0 0 0 9022:00 0 28 7 1 1 0 1 0 0 0 0 0 0 3823:00 0 34 7 5 0 0 2 0 0 0 0 0 0 48
DayTotal
0 1379 425 131 88 18 47 19 11 1 5 2 0 2126
Percent 0.0% 64.9% 20.0% 6.2% 4.1% 0.8% 2.2% 0.9% 0.5% 0.0% 0.2% 0.1% 0.0% AM Peak 08:00 08:00 09:00 08:00 05:00 06:00 08:00 08:00 08:00 05:00 08:00
Vol. 102 27 10 8 3 5 3 2 1 1 155PM Peak 14:00 14:00 14:00 17:00 14:00 13:00 14:00 17:00 14:00 14:00 14:00
Vol. 106 45 15 7 3 4 4 3 1 1 183

Page 2
Site Code: 4Station ID: D6Wyandotte St
btw Indian Rd & Huron Church RdDate Start: 07-Feb-12Date End: 09-Feb-12
Your Company NameStreet Address
Location, Zip or Postal CodePhone or Tag Line
EBStart Cars & 2 Axle 2 Axle 3 Axle 4 Axle <5 Axl 5 Axle >6 Axl <6 Axl 6 Axle >6 Axl Time Bikes Trailers Long Buses 6 Tire Single Single Double Double Double Multi Multi Multi Total
08/02/12 0 14 4 1 0 0 2 0 0 0 0 0 0 2101:00 0 1 2 0 1 0 1 0 0 0 0 0 0 502:00 0 10 3 2 0 0 0 1 0 0 0 0 0 1603:00 0 5 0 0 0 0 0 0 0 0 0 0 0 504:00 0 15 2 2 1 0 1 0 0 0 0 0 0 2105:00 0 32 14 3 1 0 0 0 0 0 0 0 0 5006:00 0 51 13 4 3 2 2 0 1 0 0 0 0 7607:00 0 64 21 10 1 2 2 0 0 0 0 0 0 10008:00 0 83 32 10 12 1 3 1 0 0 1 0 0 14309:00 0 66 17 7 5 3 2 1 1 0 1 0 0 10310:00 0 63 20 12 7 1 0 0 1 0 0 0 0 10411:00 0 70 15 8 3 1 1 1 1 0 1 0 0 101
12 PM 0 66 15 12 3 1 7 1 0 1 0 0 0 10613:00 0 58 19 15 5 1 2 0 0 0 1 0 0 10114:00 0 94 47 17 4 2 5 2 0 0 0 0 0 17115:00 0 91 31 13 3 3 7 1 0 0 0 0 0 14916:00 0 86 33 13 4 4 3 1 0 0 0 0 0 14417:00 0 81 22 9 4 1 2 4 1 0 0 0 0 12418:00 0 69 22 6 5 0 2 0 0 0 1 0 0 10519:00 0 56 19 9 1 3 2 3 1 0 0 0 0 9420:00 0 48 17 7 3 1 0 0 0 0 0 0 0 7621:00 0 44 15 5 1 2 2 1 0 0 0 0 0 7022:00 0 33 5 3 0 0 2 0 0 0 1 0 0 4423:00 0 24 16 0 1 1 0 0 0 1 0 0 0 43
DayTotal
0 1224 404 168 68 29 48 17 6 2 6 0 0 1972
Percent 0.0% 62.1% 20.5% 8.5% 3.4% 1.5% 2.4% 0.9% 0.3% 0.1% 0.3% 0.0% 0.0% AM Peak 08:00 08:00 10:00 08:00 09:00 08:00 02:00 06:00 08:00 08:00
Vol. 83 32 12 12 3 3 1 1 1 143PM Peak 14:00 14:00 14:00 13:00 16:00 12:00 17:00 17:00 12:00 13:00 14:00
Vol. 94 47 17 5 4 7 4 1 1 1 171

Page 3
Site Code: 4Station ID: D6Wyandotte St
btw Indian Rd & Huron Church RdDate Start: 07-Feb-12Date End: 09-Feb-12
Your Company NameStreet Address
Location, Zip or Postal CodePhone or Tag Line
EBStart Cars & 2 Axle 2 Axle 3 Axle 4 Axle <5 Axl 5 Axle >6 Axl <6 Axl 6 Axle >6 Axl Time Bikes Trailers Long Buses 6 Tire Single Single Double Double Double Multi Multi Multi Total
09/02/12 0 14 6 1 1 0 0 0 0 0 0 0 0 2201:00 0 6 1 0 0 1 0 0 0 0 0 0 0 802:00 0 13 0 2 1 0 0 0 0 0 0 0 0 1603:00 0 6 2 2 0 1 0 0 0 0 0 0 0 1104:00 0 24 5 2 1 0 1 0 0 0 0 0 0 3305:00 0 50 15 5 5 0 3 0 1 0 0 0 0 7906:00 0 64 14 6 2 0 2 0 0 0 0 0 0 8807:00 0 57 16 6 5 1 3 0 0 0 0 0 0 8808:00 0 106 27 11 8 2 1 1 1 0 0 0 0 15709:00 0 74 26 9 4 2 3 1 1 0 1 1 0 12210:00 0 78 23 9 5 3 2 0 1 0 1 0 0 12211:00 0 51 18 4 7 1 1 0 1 0 0 0 0 83
12 PM 0 60 12 8 5 1 2 1 1 0 1 0 0 9113:00 0 88 20 12 6 3 1 0 1 0 0 0 0 13114:00 0 108 37 15 7 3 4 2 1 2 0 0 0 17915:00 0 94 31 12 6 5 1 2 0 0 0 0 0 15116:00 0 96 28 3 6 2 3 1 1 0 0 0 0 14017:00 0 78 19 7 6 0 2 1 0 0 2 0 0 11518:00 0 65 20 7 6 2 2 3 0 0 0 0 0 10519:00 0 82 20 8 6 0 1 2 0 0 0 0 0 11920:00 0 59 27 6 5 2 5 1 1 0 0 0 0 10621:00 0 58 20 8 2 1 1 0 0 0 0 1 0 9122:00 0 31 7 5 0 1 1 1 0 0 0 0 0 4623:00 0 23 11 5 2 1 1 1 0 0 0 0 0 44
DayTotal
0 1385 405 153 96 32 40 17 10 2 5 2 0 2147
Percent 0.0% 64.5% 18.9% 7.1% 4.5% 1.5% 1.9% 0.8% 0.5% 0.1% 0.2% 0.1% 0.0% AM Peak 08:00 08:00 08:00 08:00 10:00 05:00 08:00 05:00 09:00 09:00 08:00
Vol. 106 27 11 8 3 3 1 1 1 1 157PM Peak 14:00 14:00 14:00 14:00 15:00 20:00 18:00 12:00 14:00 17:00 21:00 14:00
Vol. 108 37 15 7 5 5 3 1 2 2 1 179
GrandTotal
0 3988 1234 452 252 79 135 53 27 5 16 4 0 6245
Percent 0.0% 63.9% 19.8% 7.2% 4.0% 1.3% 2.2% 0.8% 0.4% 0.1% 0.3% 0.1% 0.0%

Page 4
Site Code: 4Station ID: D6Wyandotte St
btw Indian Rd & Huron Church RdDate Start: 07-Feb-12Date End: 09-Feb-12
Your Company NameStreet Address
Location, Zip or Postal CodePhone or Tag Line
WBStart Cars & 2 Axle 2 Axle 3 Axle 4 Axle <5 Axl 5 Axle >6 Axl <6 Axl 6 Axle >6 Axl Time Bikes Trailers Long Buses 6 Tire Single Single Double Double Double Multi Multi Multi Total
07/02/12 0 13 4 0 0 0 0 0 1 0 0 0 0 1801:00 0 3 0 0 1 0 1 0 0 0 0 0 0 502:00 0 6 1 0 2 0 0 0 0 0 0 0 0 903:00 0 6 3 1 0 0 0 1 0 0 0 0 0 1104:00 0 8 5 0 0 0 1 0 0 0 0 0 0 1405:00 0 3 5 2 0 0 0 0 0 0 0 0 0 1006:00 0 36 6 1 4 1 0 0 1 0 0 0 0 4907:00 0 32 9 2 3 0 0 3 1 1 0 0 0 5108:00 0 92 23 9 0 1 1 3 1 0 0 0 0 13009:00 0 77 29 3 4 3 2 2 1 1 0 0 0 12210:00 0 83 23 6 6 2 3 0 1 0 0 0 0 12411:00 0 61 19 4 2 3 0 1 0 0 0 1 0 91
12 PM 0 88 23 4 5 1 1 1 1 0 0 0 0 12413:00 0 89 19 8 3 2 0 1 0 1 0 0 0 12314:00 0 148 52 11 2 2 2 2 0 0 0 0 0 21915:00 0 127 43 15 7 3 2 6 3 1 0 1 0 20816:00 0 109 22 7 1 3 0 8 0 0 0 0 0 15017:00 0 105 29 9 2 2 1 4 1 0 0 0 0 15318:00 0 75 21 6 6 0 0 3 3 0 1 0 0 11519:00 0 89 21 4 5 4 0 3 0 0 0 0 0 12620:00 0 71 24 3 3 2 0 2 0 0 0 0 0 10521:00 0 46 15 3 1 0 0 2 1 0 1 0 0 6922:00 0 37 11 3 2 0 0 1 0 0 0 0 0 5423:00 0 19 6 2 1 1 1 1 0 0 0 0 0 31
DayTotal
0 1423 413 103 60 30 15 44 15 4 2 2 0 2111
Percent 0.0% 67.4% 19.6% 4.9% 2.8% 1.4% 0.7% 2.1% 0.7% 0.2% 0.1% 0.1% 0.0% AM Peak 08:00 09:00 08:00 10:00 09:00 10:00 07:00 00:00 07:00 11:00 08:00
Vol. 92 29 9 6 3 3 3 1 1 1 130PM Peak 14:00 14:00 15:00 15:00 19:00 14:00 16:00 15:00 13:00 18:00 15:00 14:00
Vol. 148 52 15 7 4 2 8 3 1 1 1 219

Page 5
Site Code: 4Station ID: D6Wyandotte St
btw Indian Rd & Huron Church RdDate Start: 07-Feb-12Date End: 09-Feb-12
Your Company NameStreet Address
Location, Zip or Postal CodePhone or Tag Line
WBStart Cars & 2 Axle 2 Axle 3 Axle 4 Axle <5 Axl 5 Axle >6 Axl <6 Axl 6 Axle >6 Axl Time Bikes Trailers Long Buses 6 Tire Single Single Double Double Double Multi Multi Multi Total
08/02/12 0 17 3 0 0 1 1 1 0 0 0 0 0 2301:00 0 5 0 0 0 0 0 1 0 0 0 0 0 602:00 0 2 1 0 0 0 0 0 1 0 0 0 0 403:00 0 4 2 1 0 0 0 0 0 0 0 0 0 704:00 0 5 1 0 0 0 0 1 0 0 0 0 0 705:00 0 8 0 0 0 1 0 0 0 0 0 0 0 906:00 0 27 8 0 1 1 0 2 0 0 0 0 0 3907:00 0 29 9 2 1 2 1 0 0 0 0 0 0 4408:00 0 64 24 6 5 2 1 2 2 1 0 0 0 10709:00 0 69 20 6 1 4 2 0 0 0 0 0 0 10210:00 0 87 28 4 1 1 1 2 0 0 0 0 0 12411:00 0 65 14 7 3 2 0 1 0 0 0 0 0 92
12 PM 0 75 15 3 3 5 0 0 1 0 0 0 0 10213:00 0 84 23 7 1 3 2 4 3 0 0 0 0 12714:00 0 146 35 14 5 3 2 4 1 0 1 0 0 21115:00 0 152 33 12 4 4 2 5 1 0 0 0 0 21316:00 0 103 24 6 1 2 2 3 3 0 0 1 0 14517:00 0 101 30 8 6 4 3 2 0 0 0 0 0 15418:00 0 79 24 4 4 2 1 3 1 1 0 0 0 11919:00 0 85 26 7 4 2 2 2 1 0 0 0 0 12920:00 0 75 20 1 2 0 0 2 1 0 1 0 0 10221:00 0 40 11 4 1 0 0 1 0 0 0 0 0 5722:00 0 32 4 2 1 1 1 1 0 0 0 0 0 4223:00 0 19 9 1 3 1 0 0 0 0 0 0 0 33
DayTotal
0 1373 364 95 47 41 21 37 15 2 2 1 0 1998
Percent 0.0% 68.7% 18.2% 4.8% 2.4% 2.1% 1.1% 1.9% 0.8% 0.1% 0.1% 0.1% 0.0% AM Peak 10:00 10:00 11:00 08:00 09:00 09:00 06:00 08:00 08:00 10:00
Vol. 87 28 7 5 4 2 2 2 1 124PM Peak 15:00 14:00 14:00 17:00 12:00 17:00 15:00 13:00 18:00 14:00 16:00 15:00
Vol. 152 35 14 6 5 3 5 3 1 1 1 213

Page 6
Site Code: 4Station ID: D6Wyandotte St
btw Indian Rd & Huron Church RdDate Start: 07-Feb-12Date End: 09-Feb-12
Your Company NameStreet Address
Location, Zip or Postal CodePhone or Tag Line
WBStart Cars & 2 Axle 2 Axle 3 Axle 4 Axle <5 Axl 5 Axle >6 Axl <6 Axl 6 Axle >6 Axl Time Bikes Trailers Long Buses 6 Tire Single Single Double Double Double Multi Multi Multi Total
09/02/12 0 10 7 0 0 1 0 1 0 0 0 0 0 1901:00 0 5 1 0 1 0 0 0 0 0 0 0 0 702:00 0 5 3 1 0 0 0 0 0 0 0 0 0 903:00 0 5 3 0 1 1 1 0 0 0 0 0 0 1104:00 0 8 2 1 0 0 0 0 0 0 0 0 0 1105:00 0 7 1 2 1 0 0 1 0 0 0 0 0 1206:00 0 41 8 3 2 0 0 3 0 0 0 1 0 5807:00 0 47 9 1 2 1 2 0 0 0 0 0 0 6208:00 0 77 31 10 4 4 1 1 0 1 0 0 0 12909:00 0 66 32 12 5 0 1 3 3 0 0 0 0 12210:00 0 81 26 8 6 3 1 2 0 0 0 0 0 12711:00 0 51 24 4 4 4 0 1 2 0 0 1 0 91
12 PM 0 87 25 9 3 1 4 2 0 0 0 0 0 13113:00 0 87 19 11 3 1 1 1 0 1 0 1 0 12514:00 0 138 44 18 8 6 5 3 2 0 0 0 0 22415:00 0 111 38 7 3 6 1 6 0 2 0 1 0 17516:00 0 84 34 7 4 5 0 2 1 0 0 0 0 13717:00 0 105 29 4 7 3 3 0 2 1 0 0 0 15418:00 0 78 18 8 2 3 0 1 1 1 0 0 0 11219:00 0 88 23 11 5 5 0 1 1 0 0 1 0 13520:00 0 64 23 3 5 1 0 0 0 0 1 0 0 9721:00 0 35 12 4 3 3 0 1 1 0 0 0 0 5922:00 0 47 13 6 2 3 0 1 0 0 0 0 0 7223:00 0 27 12 4 1 1 0 2 0 0 0 0 0 47
DayTotal
0 1354 437 134 72 52 20 32 13 6 1 5 0 2126
Percent 0.0% 63.7% 20.6% 6.3% 3.4% 2.4% 0.9% 1.5% 0.6% 0.3% 0.0% 0.2% 0.0% AM Peak 10:00 09:00 09:00 10:00 08:00 07:00 06:00 09:00 08:00 06:00 08:00
Vol. 81 32 12 6 4 2 3 3 1 1 129PM Peak 14:00 14:00 14:00 14:00 14:00 14:00 15:00 14:00 15:00 20:00 13:00 14:00
Vol. 138 44 18 8 6 5 6 2 2 1 1 224
GrandTotal
0 4150 1214 332 179 123 56 113 43 12 5 8 0 6235
Percent 0.0% 66.6% 19.5% 5.3% 2.9% 2.0% 0.9% 1.8% 0.7% 0.2% 0.1% 0.1% 0.0%

Page 7
Site Code: 4Station ID: D6Wyandotte St
btw Indian Rd & Huron Church RdDate Start: 07-Feb-12Date End: 09-Feb-12
Your Company NameStreet Address
Location, Zip or Postal CodePhone or Tag Line
EB, WBStart Cars & 2 Axle 2 Axle 3 Axle 4 Axle <5 Axl 5 Axle >6 Axl <6 Axl 6 Axle >6 Axl Time Bikes Trailers Long Buses 6 Tire Single Single Double Double Double Multi Multi Multi Total
07/02/12 0 31 10 1 0 1 0 0 1 0 0 0 0 4401:00 0 7 3 0 1 0 1 0 0 0 0 0 0 1202:00 0 16 3 0 2 0 0 1 0 0 0 0 0 2203:00 0 16 3 1 0 0 0 1 0 0 0 0 0 2104:00 0 27 9 4 1 0 1 0 0 0 0 0 0 4205:00 0 43 12 4 4 3 0 0 0 0 0 1 0 6706:00 0 88 28 4 7 2 5 2 2 0 0 0 0 13807:00 0 95 24 11 7 0 2 3 1 1 0 0 0 14408:00 0 194 50 17 8 1 5 6 3 0 1 0 0 28509:00 0 151 56 13 9 3 7 2 1 1 1 1 0 24510:00 0 158 44 13 14 3 4 0 1 0 0 0 0 23711:00 0 122 35 8 6 4 2 1 0 0 1 1 0 180
12 PM 0 158 41 10 11 3 4 2 2 0 0 0 0 23113:00 0 173 40 17 8 3 4 1 1 1 0 0 0 24814:00 0 254 97 26 8 5 4 6 0 1 1 0 0 40215:00 0 221 70 22 13 4 3 7 3 1 0 1 0 34516:00 0 201 57 18 3 3 4 10 1 0 0 0 0 29717:00 0 176 64 15 9 3 5 4 4 0 0 0 0 28018:00 0 150 46 12 8 1 3 3 4 0 2 0 0 22919:00 0 156 43 13 10 6 1 5 0 0 0 0 0 23420:00 0 137 43 7 8 2 2 4 1 0 0 0 0 20421:00 0 110 29 7 7 0 1 3 1 0 1 0 0 15922:00 0 65 18 4 3 0 1 1 0 0 0 0 0 9223:00 0 53 13 7 1 1 3 1 0 0 0 0 0 79
DayTotal
0 2802 838 234 148 48 62 63 26 5 7 4 0 4237
Percent 0.0% 66.1% 19.8% 5.5% 3.5% 1.1% 1.5% 1.5% 0.6% 0.1% 0.2% 0.1% 0.0% AM Peak 08:00 09:00 08:00 10:00 11:00 09:00 08:00 08:00 07:00 08:00 05:00 08:00
Vol. 194 56 17 14 4 7 6 3 1 1 1 285PM Peak 14:00 14:00 14:00 15:00 19:00 17:00 16:00 17:00 13:00 18:00 15:00 14:00
Vol. 254 97 26 13 6 5 10 4 1 2 1 402

Page 8
Site Code: 4Station ID: D6Wyandotte St
btw Indian Rd & Huron Church RdDate Start: 07-Feb-12Date End: 09-Feb-12
Your Company NameStreet Address
Location, Zip or Postal CodePhone or Tag Line
EB, WBStart Cars & 2 Axle 2 Axle 3 Axle 4 Axle <5 Axl 5 Axle >6 Axl <6 Axl 6 Axle >6 Axl Time Bikes Trailers Long Buses 6 Tire Single Single Double Double Double Multi Multi Multi Total
08/02/12 0 31 7 1 0 1 3 1 0 0 0 0 0 4401:00 0 6 2 0 1 0 1 1 0 0 0 0 0 1102:00 0 12 4 2 0 0 0 1 1 0 0 0 0 2003:00 0 9 2 1 0 0 0 0 0 0 0 0 0 1204:00 0 20 3 2 1 0 1 1 0 0 0 0 0 2805:00 0 40 14 3 1 1 0 0 0 0 0 0 0 5906:00 0 78 21 4 4 3 2 2 1 0 0 0 0 11507:00 0 93 30 12 2 4 3 0 0 0 0 0 0 14408:00 0 147 56 16 17 3 4 3 2 1 1 0 0 25009:00 0 135 37 13 6 7 4 1 1 0 1 0 0 20510:00 0 150 48 16 8 2 1 2 1 0 0 0 0 22811:00 0 135 29 15 6 3 1 2 1 0 1 0 0 193
12 PM 0 141 30 15 6 6 7 1 1 1 0 0 0 20813:00 0 142 42 22 6 4 4 4 3 0 1 0 0 22814:00 0 240 82 31 9 5 7 6 1 0 1 0 0 38215:00 0 243 64 25 7 7 9 6 1 0 0 0 0 36216:00 0 189 57 19 5 6 5 4 3 0 0 1 0 28917:00 0 182 52 17 10 5 5 6 1 0 0 0 0 27818:00 0 148 46 10 9 2 3 3 1 1 1 0 0 22419:00 0 141 45 16 5 5 4 5 2 0 0 0 0 22320:00 0 123 37 8 5 1 0 2 1 0 1 0 0 17821:00 0 84 26 9 2 2 2 2 0 0 0 0 0 12722:00 0 65 9 5 1 1 3 1 0 0 1 0 0 8623:00 0 43 25 1 4 2 0 0 0 1 0 0 0 76
DayTotal
0 2597 768 263 115 70 69 54 21 4 8 1 0 3970
Percent 0.0% 65.4% 19.3% 6.6% 2.9% 1.8% 1.7% 1.4% 0.5% 0.1% 0.2% 0.0% 0.0% AM Peak 10:00 08:00 08:00 08:00 09:00 08:00 08:00 08:00 08:00 08:00 08:00
Vol. 150 56 16 17 7 4 3 2 1 1 250PM Peak 15:00 14:00 14:00 17:00 15:00 15:00 14:00 13:00 12:00 13:00 16:00 14:00
Vol. 243 82 31 10 7 9 6 3 1 1 1 382
Page 9
Site Code: 4Station ID: D6Wyandotte St
btw Indian Rd & Huron Church RdDate Start: 07-Feb-12Date End: 09-Feb-12
Your Company NameStreet Address
Location, Zip or Postal CodePhone or Tag Line
EB, WBStart Cars & 2 Axle 2 Axle 3 Axle 4 Axle <5 Axl 5 Axle >6 Axl <6 Axl 6 Axle >6 Axl Time Bikes Trailers Long Buses 6 Tire Single Single Double Double Double Multi Multi Multi Total
09/02/12 0 24 13 1 1 1 0 1 0 0 0 0 0 4101:00 0 11 2 0 1 1 0 0 0 0 0 0 0 1502:00 0 18 3 3 1 0 0 0 0 0 0 0 0 2503:00 0 11 5 2 1 2 1 0 0 0 0 0 0 2204:00 0 32 7 3 1 0 1 0 0 0 0 0 0 4405:00 0 57 16 7 6 0 3 1 1 0 0 0 0 9106:00 0 105 22 9 4 0 2 3 0 0 0 1 0 14607:00 0 104 25 7 7 2 5 0 0 0 0 0 0 15008:00 0 183 58 21 12 6 2 2 1 1 0 0 0 28609:00 0 140 58 21 9 2 4 4 4 0 1 1 0 24410:00 0 159 49 17 11 6 3 2 1 0 1 0 0 24911:00 0 102 42 8 11 5 1 1 3 0 0 1 0 174
12 PM 0 147 37 17 8 2 6 3 1 0 1 0 0 22213:00 0 175 39 23 9 4 2 1 1 1 0 1 0 25614:00 0 246 81 33 15 9 9 5 3 2 0 0 0 40315:00 0 205 69 19 9 11 2 8 0 2 0 1 0 32616:00 0 180 62 10 10 7 3 3 2 0 0 0 0 27717:00 0 183 48 11 13 3 5 1 2 1 2 0 0 26918:00 0 143 38 15 8 5 2 4 1 1 0 0 0 21719:00 0 170 43 19 11 5 1 3 1 0 0 1 0 25420:00 0 123 50 9 10 3 5 1 1 0 1 0 0 20321:00 0 93 32 12 5 4 1 1 1 0 0 1 0 15022:00 0 78 20 11 2 4 1 2 0 0 0 0 0 11823:00 0 50 23 9 3 2 1 3 0 0 0 0 0 91
DayTotal
0 2739 842 287 168 84 60 49 23 8 6 7 0 4273
Percent 0.0% 64.1% 19.7% 6.7% 3.9% 2.0% 1.4% 1.1% 0.5% 0.2% 0.1% 0.2% 0.0% AM Peak 08:00 08:00 08:00 08:00 08:00 07:00 09:00 09:00 08:00 09:00 06:00 08:00
Vol. 183 58 21 12 6 5 4 4 1 1 1 286PM Peak 14:00 14:00 14:00 14:00 15:00 14:00 15:00 14:00 14:00 17:00 13:00 14:00
Vol. 246 81 33 15 11 9 8 3 2 2 1 403
GrandTotal
0 8138 2448 784 431 202 191 166 70 17 21 12 0 12480
Percent 0.0% 65.2% 19.6% 6.3% 3.5% 1.6% 1.5% 1.3% 0.6% 0.1% 0.2% 0.1% 0.0%

Page 1
Site Code: 2Station ID: D8
Indian Rd btw Wyandotte St & Mill St
Date Start: 07-Feb-12Date End: 09-Feb-12
Your Company NameStreet Address
Location, Zip or Postal CodePhone or Tag Line
NBStart Cars & 2 Axle 2 Axle 3 Axle 4 Axle <5 Axl 5 Axle >6 Axl <6 Axl 6 Axle >6 Axl Time Bikes Trailers Long Buses 6 Tire Single Single Double Double Double Multi Multi Multi Total
07/02/12 0 1 0 0 0 0 0 0 0 0 0 0 0 101:00 0 0 0 0 0 0 0 0 0 0 0 0 0 002:00 0 1 0 0 0 0 0 0 0 0 0 0 0 103:00 0 0 0 0 0 0 0 0 0 0 0 0 0 004:00 0 2 0 0 0 0 0 0 0 0 0 0 0 205:00 0 4 1 0 0 0 0 0 0 0 0 0 0 506:00 0 1 0 0 0 0 0 0 0 0 0 0 0 107:00 0 2 0 0 0 0 0 0 0 0 0 0 0 208:00 0 1 0 0 0 0 0 0 0 0 0 0 0 109:00 0 1 0 0 0 0 0 0 0 0 0 0 0 110:00 0 2 0 0 0 0 0 0 0 0 0 0 0 211:00 0 2 1 0 0 0 0 0 0 0 0 0 0 3
12 PM 0 3 0 0 0 0 0 0 0 0 0 0 0 313:00 0 0 2 0 0 0 0 0 0 0 0 0 0 214:00 0 3 0 0 0 0 0 0 0 0 0 0 0 315:00 0 2 0 0 0 0 0 0 0 0 0 0 0 216:00 0 4 0 0 1 0 0 0 0 0 0 0 0 517:00 0 3 0 0 0 0 0 0 0 0 0 0 0 318:00 0 3 2 0 1 0 0 0 0 0 0 0 0 619:00 0 2 0 0 0 0 0 0 0 0 0 0 0 220:00 0 0 1 0 0 0 0 0 0 0 0 0 0 121:00 0 2 1 0 0 0 0 0 0 0 0 0 0 322:00 0 3 0 0 0 0 0 0 0 0 0 0 0 323:00 0 2 0 0 0 0 0 0 0 0 0 0 0 2
DayTotal
0 44 8 0 2 0 0 0 0 0 0 0 0 54
Percent 0.0% 81.5% 14.8% 0.0% 3.7% 0.0% 0.0% 0.0% 0.0% 0.0% 0.0% 0.0% 0.0% AM Peak 05:00 05:00 05:00
Vol. 4 1 5PM Peak 16:00 13:00 16:00 18:00
Vol. 4 2 1 6

Page 2
Site Code: 2Station ID: D8
Indian Rd btw Wyandotte St & Mill St
Date Start: 07-Feb-12Date End: 09-Feb-12
Your Company NameStreet Address
Location, Zip or Postal CodePhone or Tag Line
NBStart Cars & 2 Axle 2 Axle 3 Axle 4 Axle <5 Axl 5 Axle >6 Axl <6 Axl 6 Axle >6 Axl Time Bikes Trailers Long Buses 6 Tire Single Single Double Double Double Multi Multi Multi Total
08/02/12 0 1 0 0 0 0 0 0 0 0 0 0 0 101:00 0 1 0 0 0 0 0 0 0 0 0 0 0 102:00 0 0 0 0 0 0 0 0 0 0 0 0 0 003:00 0 1 0 0 0 0 0 0 0 0 0 0 0 104:00 0 2 0 0 0 0 0 0 0 0 0 0 0 205:00 0 2 0 0 0 0 0 0 0 0 0 0 0 206:00 0 2 1 0 0 0 0 0 0 0 0 0 0 307:00 0 0 1 0 0 0 0 0 0 0 0 0 0 108:00 0 3 0 0 0 0 0 0 0 0 0 0 0 309:00 0 1 0 1 0 0 0 0 0 0 0 0 0 210:00 0 2 0 0 0 0 0 0 0 0 0 0 0 211:00 0 2 1 0 0 0 0 0 0 0 0 0 0 3
12 PM 0 4 1 0 0 0 0 0 0 0 0 0 0 513:00 0 4 1 1 0 0 0 0 0 0 0 0 0 614:00 0 4 1 0 0 0 0 0 0 0 0 0 0 515:00 0 3 1 0 0 0 0 0 0 0 0 0 0 416:00 0 4 0 0 0 0 0 0 0 0 0 0 0 417:00 0 5 2 0 0 0 0 0 0 0 0 0 0 718:00 0 4 1 1 0 0 0 0 0 0 0 0 0 619:00 0 2 0 0 0 0 0 0 0 0 0 0 0 220:00 0 2 0 0 0 0 0 0 0 0 0 0 0 221:00 0 1 0 0 0 0 0 0 0 0 0 0 0 122:00 0 1 2 0 0 0 0 0 0 0 0 0 0 323:00 0 1 0 0 0 0 0 0 0 0 0 0 0 1
DayTotal
0 52 12 3 0 0 0 0 0 0 0 0 0 67
Percent 0.0% 77.6% 17.9% 4.5% 0.0% 0.0% 0.0% 0.0% 0.0% 0.0% 0.0% 0.0% 0.0% AM Peak 08:00 06:00 09:00 06:00
Vol. 3 1 1 3PM Peak 17:00 17:00 13:00 17:00
Vol. 5 2 1 7
Page 3
Site Code: 2Station ID: D8
Indian Rd btw Wyandotte St & Mill St
Date Start: 07-Feb-12Date End: 09-Feb-12
Your Company NameStreet Address
Location, Zip or Postal CodePhone or Tag Line
NBStart Cars & 2 Axle 2 Axle 3 Axle 4 Axle <5 Axl 5 Axle >6 Axl <6 Axl 6 Axle >6 Axl Time Bikes Trailers Long Buses 6 Tire Single Single Double Double Double Multi Multi Multi Total
09/02/12 0 2 1 0 0 0 0 0 0 0 0 0 0 301:00 0 0 0 0 0 0 0 0 0 0 0 0 0 002:00 0 0 2 0 0 0 0 0 0 0 0 0 0 203:00 0 1 0 0 0 0 0 0 0 0 0 0 0 104:00 0 1 0 0 0 0 0 0 0 0 0 0 0 105:00 0 0 1 0 0 0 0 0 0 0 0 0 0 106:00 0 2 0 0 0 0 0 0 0 0 0 0 0 207:00 0 1 1 0 0 0 0 0 0 0 0 0 0 208:00 0 3 0 0 0 0 0 0 0 0 0 0 0 309:00 0 3 0 0 1 0 0 0 0 0 0 0 0 410:00 0 1 0 0 1 0 0 0 0 0 0 0 0 211:00 0 2 1 0 0 0 0 0 0 0 0 0 0 3
12 PM 0 2 1 0 1 0 0 0 0 0 0 0 0 413:00 0 3 1 0 0 0 0 0 0 0 0 0 0 414:00 0 2 1 0 0 0 0 0 0 0 0 0 0 315:00 0 6 1 0 0 0 0 0 0 0 0 0 0 716:00 0 3 1 0 0 0 0 0 0 0 0 0 0 417:00 0 6 2 0 0 0 0 0 0 0 0 0 0 818:00 0 3 0 0 0 0 0 0 0 0 0 0 0 319:00 0 2 0 0 1 0 0 0 0 0 0 0 0 320:00 0 2 0 0 1 0 0 0 0 0 0 0 0 321:00 0 0 1 1 0 0 0 0 0 0 0 0 0 222:00 0 1 0 0 0 0 0 0 0 0 0 0 0 123:00 0 2 1 0 0 0 0 0 0 0 0 0 0 3
DayTotal
0 48 15 1 5 0 0 0 0 0 0 0 0 69
Percent 0.0% 69.6% 21.7% 1.4% 7.2% 0.0% 0.0% 0.0% 0.0% 0.0% 0.0% 0.0% 0.0% AM Peak 08:00 02:00 09:00 09:00
Vol. 3 2 1 4PM Peak 15:00 17:00 21:00 12:00 17:00
Vol. 6 2 1 1 8
GrandTotal
0 144 35 4 7 0 0 0 0 0 0 0 0 190
Percent 0.0% 75.8% 18.4% 2.1% 3.7% 0.0% 0.0% 0.0% 0.0% 0.0% 0.0% 0.0% 0.0%

Page 4
Site Code: 2Station ID: D8
Indian Rd btw Wyandotte St & Mill St
Date Start: 07-Feb-12Date End: 09-Feb-12
Your Company NameStreet Address
Location, Zip or Postal CodePhone or Tag Line
SBStart Cars & 2 Axle 2 Axle 3 Axle 4 Axle <5 Axl 5 Axle >6 Axl <6 Axl 6 Axle >6 Axl Time Bikes Trailers Long Buses 6 Tire Single Single Double Double Double Multi Multi Multi Total
07/02/12 0 0 0 0 0 0 0 0 0 0 0 0 0 001:00 0 0 0 0 0 0 0 0 0 0 0 0 0 002:00 0 1 0 0 0 0 0 0 0 0 0 0 0 103:00 0 1 0 0 0 0 0 0 0 0 0 0 0 104:00 0 0 0 0 0 0 0 0 0 0 0 0 0 005:00 0 2 1 0 0 0 0 0 0 0 0 0 0 306:00 0 1 2 0 0 0 0 0 0 0 0 0 0 307:00 0 3 1 0 0 0 0 0 0 0 0 0 0 408:00 0 0 1 0 0 0 0 0 0 0 0 0 0 109:00 0 1 1 0 1 0 0 0 0 0 0 0 0 310:00 0 1 0 0 0 0 0 0 0 0 0 0 0 111:00 0 1 0 1 0 0 0 0 0 0 0 0 0 2
12 PM 0 2 1 0 0 0 0 0 0 0 0 0 0 313:00 0 2 1 0 0 0 0 0 0 0 0 0 0 314:00 0 2 0 0 0 0 0 0 0 0 0 0 0 215:00 0 3 0 0 0 0 0 0 0 0 0 0 0 316:00 0 3 1 0 0 0 0 0 0 0 0 0 0 417:00 0 4 1 0 0 0 0 0 0 0 0 0 0 518:00 0 3 1 0 1 0 0 0 0 0 0 0 0 519:00 0 2 2 0 0 0 0 0 0 0 0 0 0 420:00 0 2 0 0 0 0 0 0 0 0 0 0 0 221:00 0 1 0 0 1 0 0 0 0 0 0 0 0 222:00 0 1 1 0 0 0 0 0 0 0 0 0 0 223:00 0 0 1 0 0 0 0 0 0 0 0 0 0 1
DayTotal
0 36 15 1 3 0 0 0 0 0 0 0 0 55
Percent 0.0% 65.5% 27.3% 1.8% 5.5% 0.0% 0.0% 0.0% 0.0% 0.0% 0.0% 0.0% 0.0% AM Peak 07:00 06:00 11:00 09:00 07:00
Vol. 3 2 1 1 4PM Peak 17:00 19:00 18:00 17:00
Vol. 4 2 1 5

Page 5
Site Code: 2Station ID: D8
Indian Rd btw Wyandotte St & Mill St
Date Start: 07-Feb-12Date End: 09-Feb-12
Your Company NameStreet Address
Location, Zip or Postal CodePhone or Tag Line
SBStart Cars & 2 Axle 2 Axle 3 Axle 4 Axle <5 Axl 5 Axle >6 Axl <6 Axl 6 Axle >6 Axl Time Bikes Trailers Long Buses 6 Tire Single Single Double Double Double Multi Multi Multi Total
08/02/12 0 0 0 0 0 0 0 0 0 0 0 0 0 001:00 0 0 1 0 0 0 0 0 0 0 0 0 0 102:00 0 0 0 0 0 0 0 0 0 0 0 0 0 003:00 0 0 0 0 0 0 0 0 0 0 0 0 0 004:00 0 2 1 0 0 0 0 0 0 0 0 0 0 305:00 0 1 0 0 0 0 0 0 0 0 0 0 0 106:00 0 1 0 0 0 0 0 0 0 0 0 0 0 107:00 0 0 0 0 0 0 0 0 0 0 0 0 0 008:00 0 1 1 0 0 0 0 0 0 0 0 0 0 209:00 0 2 1 0 0 0 0 0 0 0 0 0 0 310:00 0 3 0 0 0 0 0 0 0 0 0 0 0 311:00 0 2 0 1 0 0 0 0 0 0 0 0 0 3
12 PM 0 3 0 0 0 0 0 0 0 0 0 0 0 313:00 0 3 1 0 0 0 0 0 0 0 0 0 0 414:00 0 3 0 0 0 0 0 0 0 0 0 0 0 315:00 0 3 0 0 0 0 0 0 0 0 0 0 0 316:00 0 3 1 0 0 0 0 0 0 0 0 0 0 417:00 0 4 0 0 0 0 0 0 0 0 0 0 0 418:00 0 4 0 0 0 0 0 0 0 0 0 0 0 419:00 0 2 1 0 0 0 0 0 0 0 0 0 0 320:00 0 2 0 0 0 0 0 0 0 0 0 0 0 221:00 0 4 1 0 0 0 0 0 0 0 0 0 0 522:00 0 0 1 0 0 0 0 0 0 0 0 0 0 123:00 0 0 0 0 0 0 0 0 0 0 0 0 0 0
DayTotal
0 43 9 1 0 0 0 0 0 0 0 0 0 53
Percent 0.0% 81.1% 17.0% 1.9% 0.0% 0.0% 0.0% 0.0% 0.0% 0.0% 0.0% 0.0% 0.0% AM Peak 10:00 01:00 11:00 04:00
Vol. 3 1 1 3PM Peak 17:00 13:00 21:00
Vol. 4 1 5

Page 6
Site Code: 2Station ID: D8
Indian Rd btw Wyandotte St & Mill St
Date Start: 07-Feb-12Date End: 09-Feb-12
Your Company NameStreet Address
Location, Zip or Postal CodePhone or Tag Line
SBStart Cars & 2 Axle 2 Axle 3 Axle 4 Axle <5 Axl 5 Axle >6 Axl <6 Axl 6 Axle >6 Axl Time Bikes Trailers Long Buses 6 Tire Single Single Double Double Double Multi Multi Multi Total
09/02/12 0 1 2 0 0 0 0 0 0 0 0 0 0 301:00 0 1 0 0 0 0 0 0 0 0 0 0 0 102:00 0 1 0 0 0 0 0 0 0 0 0 0 0 103:00 0 0 0 0 0 0 0 0 0 0 0 0 0 004:00 0 1 0 0 0 0 0 0 0 0 0 0 0 105:00 0 1 1 0 0 0 0 0 0 0 0 0 0 206:00 0 3 0 0 0 0 0 0 0 0 0 0 0 307:00 0 4 0 0 0 0 0 0 0 0 0 0 0 408:00 0 1 0 0 0 0 0 0 0 0 0 0 0 109:00 0 2 0 0 0 0 0 0 0 0 0 0 0 210:00 0 1 0 0 0 0 0 0 0 0 0 0 0 111:00 0 3 0 0 0 0 0 0 0 0 0 0 0 3
12 PM 0 1 0 0 0 0 0 0 0 0 0 0 0 113:00 0 1 1 0 0 0 0 0 0 0 0 0 0 214:00 0 0 1 0 0 0 0 0 0 0 0 0 0 115:00 0 1 0 0 0 0 0 0 0 0 0 0 0 116:00 0 2 1 0 0 0 0 0 0 0 0 0 0 317:00 0 1 0 0 0 0 0 0 0 0 0 0 0 118:00 0 0 0 0 0 0 0 0 0 0 0 0 0 019:00 0 3 0 0 0 0 0 0 0 0 0 0 0 320:00 0 0 0 0 0 0 0 0 0 0 0 0 0 021:00 0 2 1 0 0 0 0 0 0 0 0 0 0 322:00 0 1 0 0 0 0 0 0 0 0 0 0 0 123:00 0 1 0 0 0 0 0 0 0 0 0 0 0 1
DayTotal
0 32 7 0 0 0 0 0 0 0 0 0 0 39
Percent 0.0% 82.1% 17.9% 0.0% 0.0% 0.0% 0.0% 0.0% 0.0% 0.0% 0.0% 0.0% 0.0% AM Peak 07:00 00:00 07:00
Vol. 4 2 4PM Peak 19:00 13:00 16:00
Vol. 3 1 3
GrandTotal
0 111 31 2 3 0 0 0 0 0 0 0 0 147
Percent 0.0% 75.5% 21.1% 1.4% 2.0% 0.0% 0.0% 0.0% 0.0% 0.0% 0.0% 0.0% 0.0%

Page 7
Site Code: 2Station ID: D8
Indian Rd btw Wyandotte St & Mill St
Date Start: 07-Feb-12Date End: 09-Feb-12
Your Company NameStreet Address
Location, Zip or Postal CodePhone or Tag Line
NB, SBStart Cars & 2 Axle 2 Axle 3 Axle 4 Axle <5 Axl 5 Axle >6 Axl <6 Axl 6 Axle >6 Axl Time Bikes Trailers Long Buses 6 Tire Single Single Double Double Double Multi Multi Multi Total
07/02/12 0 1 0 0 0 0 0 0 0 0 0 0 0 101:00 0 0 0 0 0 0 0 0 0 0 0 0 0 002:00 0 2 0 0 0 0 0 0 0 0 0 0 0 203:00 0 1 0 0 0 0 0 0 0 0 0 0 0 104:00 0 2 0 0 0 0 0 0 0 0 0 0 0 205:00 0 6 2 0 0 0 0 0 0 0 0 0 0 806:00 0 2 2 0 0 0 0 0 0 0 0 0 0 407:00 0 5 1 0 0 0 0 0 0 0 0 0 0 608:00 0 1 1 0 0 0 0 0 0 0 0 0 0 209:00 0 2 1 0 1 0 0 0 0 0 0 0 0 410:00 0 3 0 0 0 0 0 0 0 0 0 0 0 311:00 0 3 1 1 0 0 0 0 0 0 0 0 0 5
12 PM 0 5 1 0 0 0 0 0 0 0 0 0 0 613:00 0 2 3 0 0 0 0 0 0 0 0 0 0 514:00 0 5 0 0 0 0 0 0 0 0 0 0 0 515:00 0 5 0 0 0 0 0 0 0 0 0 0 0 516:00 0 7 1 0 1 0 0 0 0 0 0 0 0 917:00 0 7 1 0 0 0 0 0 0 0 0 0 0 818:00 0 6 3 0 2 0 0 0 0 0 0 0 0 1119:00 0 4 2 0 0 0 0 0 0 0 0 0 0 620:00 0 2 1 0 0 0 0 0 0 0 0 0 0 321:00 0 3 1 0 1 0 0 0 0 0 0 0 0 522:00 0 4 1 0 0 0 0 0 0 0 0 0 0 523:00 0 2 1 0 0 0 0 0 0 0 0 0 0 3
DayTotal
0 80 23 1 5 0 0 0 0 0 0 0 0 109
Percent 0.0% 73.4% 21.1% 0.9% 4.6% 0.0% 0.0% 0.0% 0.0% 0.0% 0.0% 0.0% 0.0% AM Peak 05:00 05:00 11:00 09:00 05:00
Vol. 6 2 1 1 8PM Peak 16:00 13:00 18:00 18:00
Vol. 7 3 2 11
Page 8
Site Code: 2Station ID: D8
Indian Rd btw Wyandotte St & Mill St
Date Start: 07-Feb-12Date End: 09-Feb-12
Your Company NameStreet Address
Location, Zip or Postal CodePhone or Tag Line
NB, SBStart Cars & 2 Axle 2 Axle 3 Axle 4 Axle <5 Axl 5 Axle >6 Axl <6 Axl 6 Axle >6 Axl Time Bikes Trailers Long Buses 6 Tire Single Single Double Double Double Multi Multi Multi Total
08/02/12 0 1 0 0 0 0 0 0 0 0 0 0 0 101:00 0 1 1 0 0 0 0 0 0 0 0 0 0 202:00 0 0 0 0 0 0 0 0 0 0 0 0 0 003:00 0 1 0 0 0 0 0 0 0 0 0 0 0 104:00 0 4 1 0 0 0 0 0 0 0 0 0 0 505:00 0 3 0 0 0 0 0 0 0 0 0 0 0 306:00 0 3 1 0 0 0 0 0 0 0 0 0 0 407:00 0 0 1 0 0 0 0 0 0 0 0 0 0 108:00 0 4 1 0 0 0 0 0 0 0 0 0 0 509:00 0 3 1 1 0 0 0 0 0 0 0 0 0 510:00 0 5 0 0 0 0 0 0 0 0 0 0 0 511:00 0 4 1 1 0 0 0 0 0 0 0 0 0 6
12 PM 0 7 1 0 0 0 0 0 0 0 0 0 0 813:00 0 7 2 1 0 0 0 0 0 0 0 0 0 1014:00 0 7 1 0 0 0 0 0 0 0 0 0 0 815:00 0 6 1 0 0 0 0 0 0 0 0 0 0 716:00 0 7 1 0 0 0 0 0 0 0 0 0 0 817:00 0 9 2 0 0 0 0 0 0 0 0 0 0 1118:00 0 8 1 1 0 0 0 0 0 0 0 0 0 1019:00 0 4 1 0 0 0 0 0 0 0 0 0 0 520:00 0 4 0 0 0 0 0 0 0 0 0 0 0 421:00 0 5 1 0 0 0 0 0 0 0 0 0 0 622:00 0 1 3 0 0 0 0 0 0 0 0 0 0 423:00 0 1 0 0 0 0 0 0 0 0 0 0 0 1
DayTotal
0 95 21 4 0 0 0 0 0 0 0 0 0 120
Percent 0.0% 79.2% 17.5% 3.3% 0.0% 0.0% 0.0% 0.0% 0.0% 0.0% 0.0% 0.0% 0.0% AM Peak 10:00 01:00 09:00 11:00
Vol. 5 1 1 6PM Peak 17:00 22:00 13:00 17:00
Vol. 9 3 1 11

Page 9
Site Code: 2Station ID: D8
Indian Rd btw Wyandotte St & Mill St
Date Start: 07-Feb-12Date End: 09-Feb-12
Your Company NameStreet Address
Location, Zip or Postal CodePhone or Tag Line
NB, SBStart Cars & 2 Axle 2 Axle 3 Axle 4 Axle <5 Axl 5 Axle >6 Axl <6 Axl 6 Axle >6 Axl Time Bikes Trailers Long Buses 6 Tire Single Single Double Double Double Multi Multi Multi Total
09/02/12 0 3 3 0 0 0 0 0 0 0 0 0 0 601:00 0 1 0 0 0 0 0 0 0 0 0 0 0 102:00 0 1 2 0 0 0 0 0 0 0 0 0 0 303:00 0 1 0 0 0 0 0 0 0 0 0 0 0 104:00 0 2 0 0 0 0 0 0 0 0 0 0 0 205:00 0 1 2 0 0 0 0 0 0 0 0 0 0 306:00 0 5 0 0 0 0 0 0 0 0 0 0 0 507:00 0 5 1 0 0 0 0 0 0 0 0 0 0 608:00 0 4 0 0 0 0 0 0 0 0 0 0 0 409:00 0 5 0 0 1 0 0 0 0 0 0 0 0 610:00 0 2 0 0 1 0 0 0 0 0 0 0 0 311:00 0 5 1 0 0 0 0 0 0 0 0 0 0 6
12 PM 0 3 1 0 1 0 0 0 0 0 0 0 0 513:00 0 4 2 0 0 0 0 0 0 0 0 0 0 614:00 0 2 2 0 0 0 0 0 0 0 0 0 0 415:00 0 7 1 0 0 0 0 0 0 0 0 0 0 816:00 0 5 2 0 0 0 0 0 0 0 0 0 0 717:00 0 7 2 0 0 0 0 0 0 0 0 0 0 918:00 0 3 0 0 0 0 0 0 0 0 0 0 0 319:00 0 5 0 0 1 0 0 0 0 0 0 0 0 620:00 0 2 0 0 1 0 0 0 0 0 0 0 0 321:00 0 2 2 1 0 0 0 0 0 0 0 0 0 522:00 0 2 0 0 0 0 0 0 0 0 0 0 0 223:00 0 3 1 0 0 0 0 0 0 0 0 0 0 4
DayTotal
0 80 22 1 5 0 0 0 0 0 0 0 0 108
Percent 0.0% 74.1% 20.4% 0.9% 4.6% 0.0% 0.0% 0.0% 0.0% 0.0% 0.0% 0.0% 0.0% AM Peak 06:00 00:00 09:00 00:00
Vol. 5 3 1 6PM Peak 15:00 13:00 21:00 12:00 17:00
Vol. 7 2 1 1 9
GrandTotal
0 255 66 6 10 0 0 0 0 0 0 0 0 337
Percent 0.0% 75.7% 19.6% 1.8% 3.0% 0.0% 0.0% 0.0% 0.0% 0.0% 0.0% 0.0% 0.0%

Page 1
Site Code: 3Station ID: D7
College Ave just W of Huron Church Rd
Date Start: 07-Feb-12Date End: 09-Feb-12
Your Company NameStreet Address
Location, Zip or Postal CodePhone or Tag Line
EBStart Cars & 2 Axle 2 Axle 3 Axle 4 Axle <5 Axl 5 Axle >6 Axl <6 Axl 6 Axle >6 Axl Time Bikes Trailers Long Buses 6 Tire Single Single Double Double Double Multi Multi Multi Total
07/02/12 0 26 8 4 2 0 3 1 0 0 0 0 0 4401:00 0 13 3 0 0 0 0 0 0 0 0 0 0 1602:00 0 6 0 0 0 1 0 0 0 0 0 0 0 703:00 0 2 1 0 0 1 0 0 0 0 0 0 0 404:00 0 9 2 1 0 0 0 0 0 0 0 0 0 1205:00 0 11 2 2 0 2 1 0 0 0 0 0 0 1806:00 0 49 13 3 1 2 0 0 0 0 0 0 0 6807:00 0 86 28 11 3 2 5 2 2 0 0 0 0 13908:00 0 121 41 17 6 1 5 3 0 0 1 0 0 19509:00 0 73 26 7 2 2 4 1 0 0 0 0 0 11510:00 0 110 38 13 4 2 3 0 0 0 0 0 0 17011:00 0 112 31 9 4 2 3 0 0 0 0 0 0 161
12 PM 0 109 36 15 3 2 2 3 0 0 2 0 0 17213:00 0 100 29 17 4 1 1 1 0 0 1 1 0 15514:00 0 113 34 20 8 0 7 4 1 0 0 0 0 18715:00 0 111 49 19 5 1 7 2 1 1 1 0 0 19716:00 0 117 32 19 10 2 2 2 0 0 2 0 0 18617:00 0 130 49 9 6 2 3 4 1 0 0 1 0 20518:00 0 134 36 7 8 1 3 4 0 0 0 0 0 19319:00 0 83 27 13 3 0 3 2 0 0 0 0 0 13120:00 0 78 34 8 5 1 2 0 0 0 0 0 0 12821:00 0 81 21 19 3 0 2 1 1 0 0 0 0 12822:00 0 59 25 7 3 2 0 0 0 0 0 0 0 9623:00 0 61 15 4 2 1 1 1 1 0 1 0 0 87
DayTotal
0 1794 580 224 82 28 57 31 7 1 8 2 0 2814
Percent 0.0% 63.8% 20.6% 8.0% 2.9% 1.0% 2.0% 1.1% 0.2% 0.0% 0.3% 0.1% 0.0% AM Peak 08:00 08:00 08:00 08:00 05:00 07:00 08:00 07:00 08:00 08:00
Vol. 121 41 17 6 2 5 3 2 1 195PM Peak 18:00 15:00 14:00 16:00 12:00 14:00 14:00 14:00 15:00 12:00 13:00 17:00
Vol. 134 49 20 10 2 7 4 1 1 2 1 205

Page 2
Site Code: 3Station ID: D7
College Ave just W of Huron Church Rd
Date Start: 07-Feb-12Date End: 09-Feb-12
Your Company NameStreet Address
Location, Zip or Postal CodePhone or Tag Line
EBStart Cars & 2 Axle 2 Axle 3 Axle 4 Axle <5 Axl 5 Axle >6 Axl <6 Axl 6 Axle >6 Axl Time Bikes Trailers Long Buses 6 Tire Single Single Double Double Double Multi Multi Multi Total
08/02/12 0 18 6 1 3 0 1 2 0 0 0 0 0 3101:00 0 9 5 1 1 0 0 0 0 0 0 0 0 1602:00 0 3 3 0 0 0 0 0 0 0 0 0 0 603:00 0 2 0 0 1 0 0 0 0 0 0 0 0 304:00 0 2 1 0 0 0 0 0 0 0 0 0 0 305:00 0 15 0 2 1 1 0 0 0 0 0 0 0 1906:00 0 47 8 4 1 1 3 0 0 0 0 0 0 6407:00 0 70 27 10 11 1 2 2 2 0 0 0 0 12508:00 0 127 47 14 8 3 4 1 0 0 1 0 0 20509:00 0 66 18 5 4 3 1 1 1 0 0 0 0 9910:00 0 120 25 19 5 0 3 1 0 0 0 0 0 17311:00 0 112 30 14 3 1 0 1 0 0 0 0 0 161
12 PM 0 109 33 13 4 1 2 4 2 0 0 0 0 16813:00 0 111 29 18 6 3 5 2 0 0 0 0 0 17414:00 0 139 31 21 7 2 3 2 2 0 0 0 0 20715:00 0 141 36 14 2 0 0 2 1 0 0 0 0 19616:00 0 117 38 16 8 2 4 5 2 0 0 0 0 19217:00 0 138 41 14 10 1 4 1 0 1 1 1 0 21218:00 0 133 37 15 7 2 7 2 4 0 1 0 0 20819:00 0 78 18 11 1 2 3 2 0 0 0 0 0 11520:00 0 88 25 10 5 2 3 2 1 1 0 0 0 13721:00 0 82 19 12 2 0 5 2 2 1 1 0 0 12622:00 0 58 23 4 0 1 4 1 0 0 0 1 0 9223:00 0 43 18 7 6 1 1 1 0 0 0 0 0 77
DayTotal
0 1828 518 225 96 27 55 34 17 3 4 2 0 2809
Percent 0.0% 65.1% 18.4% 8.0% 3.4% 1.0% 2.0% 1.2% 0.6% 0.1% 0.1% 0.1% 0.0% AM Peak 08:00 08:00 10:00 07:00 08:00 08:00 00:00 07:00 08:00 08:00
Vol. 127 47 19 11 3 4 2 2 1 205PM Peak 15:00 17:00 14:00 17:00 13:00 18:00 16:00 18:00 17:00 17:00 17:00 17:00
Vol. 141 41 21 10 3 7 5 4 1 1 1 212

Page 3
Site Code: 3Station ID: D7
College Ave just W of Huron Church Rd
Date Start: 07-Feb-12Date End: 09-Feb-12
Your Company NameStreet Address
Location, Zip or Postal CodePhone or Tag Line
EBStart Cars & 2 Axle 2 Axle 3 Axle 4 Axle <5 Axl 5 Axle >6 Axl <6 Axl 6 Axle >6 Axl Time Bikes Trailers Long Buses 6 Tire Single Single Double Double Double Multi Multi Multi Total
09/02/12 0 31 9 3 3 0 0 0 0 0 0 0 0 4601:00 0 10 2 1 1 0 0 0 1 0 1 1 0 1702:00 0 3 2 0 1 0 0 0 0 0 0 0 0 603:00 0 3 1 0 0 0 0 0 0 0 0 0 0 404:00 0 9 2 1 2 0 0 0 0 0 0 0 0 1405:00 0 18 3 1 1 0 0 1 0 0 0 0 0 2406:00 0 52 13 3 3 1 1 0 0 0 0 0 0 7307:00 0 84 30 13 7 2 1 1 0 0 1 0 0 13908:00 0 146 40 11 10 3 3 2 2 0 0 1 0 21809:00 0 64 18 7 4 1 0 0 0 0 2 0 0 9610:00 0 99 36 19 5 3 3 1 0 0 1 0 0 16711:00 0 102 27 16 7 2 3 1 2 0 0 0 0 160
12 PM 0 105 34 19 6 2 10 1 1 0 0 0 0 17813:00 0 93 35 12 4 0 5 4 1 0 0 0 0 15414:00 0 137 31 14 5 1 3 2 3 1 0 0 0 19715:00 0 116 37 17 11 1 4 2 0 0 0 0 0 18816:00 0 114 42 7 9 0 5 0 1 0 1 0 0 17917:00 0 110 39 11 8 2 3 4 1 0 0 0 0 17818:00 0 121 41 13 8 0 3 2 2 1 1 0 0 19219:00 0 81 29 12 4 0 2 1 0 0 0 0 0 12920:00 0 90 18 8 6 0 1 2 0 0 0 0 0 12521:00 0 74 20 11 7 1 4 2 0 0 0 0 0 11922:00 0 63 27 6 3 1 0 0 0 2 0 0 0 10223:00 0 51 27 8 1 1 4 0 0 1 0 1 0 94
DayTotal
0 1776 563 213 116 21 55 26 14 5 7 3 0 2799
Percent 0.0% 63.5% 20.1% 7.6% 4.1% 0.8% 2.0% 0.9% 0.5% 0.2% 0.3% 0.1% 0.0% AM Peak 08:00 08:00 10:00 08:00 08:00 08:00 08:00 08:00 09:00 01:00 08:00
Vol. 146 40 19 10 3 3 2 2 2 1 218PM Peak 14:00 16:00 12:00 15:00 12:00 12:00 13:00 14:00 22:00 16:00 23:00 14:00
Vol. 137 42 19 11 2 10 4 3 2 1 1 197
GrandTotal
0 5398 1661 662 294 76 167 91 38 9 19 7 0 8422
Percent 0.0% 64.1% 19.7% 7.9% 3.5% 0.9% 2.0% 1.1% 0.5% 0.1% 0.2% 0.1% 0.0%
Page 4
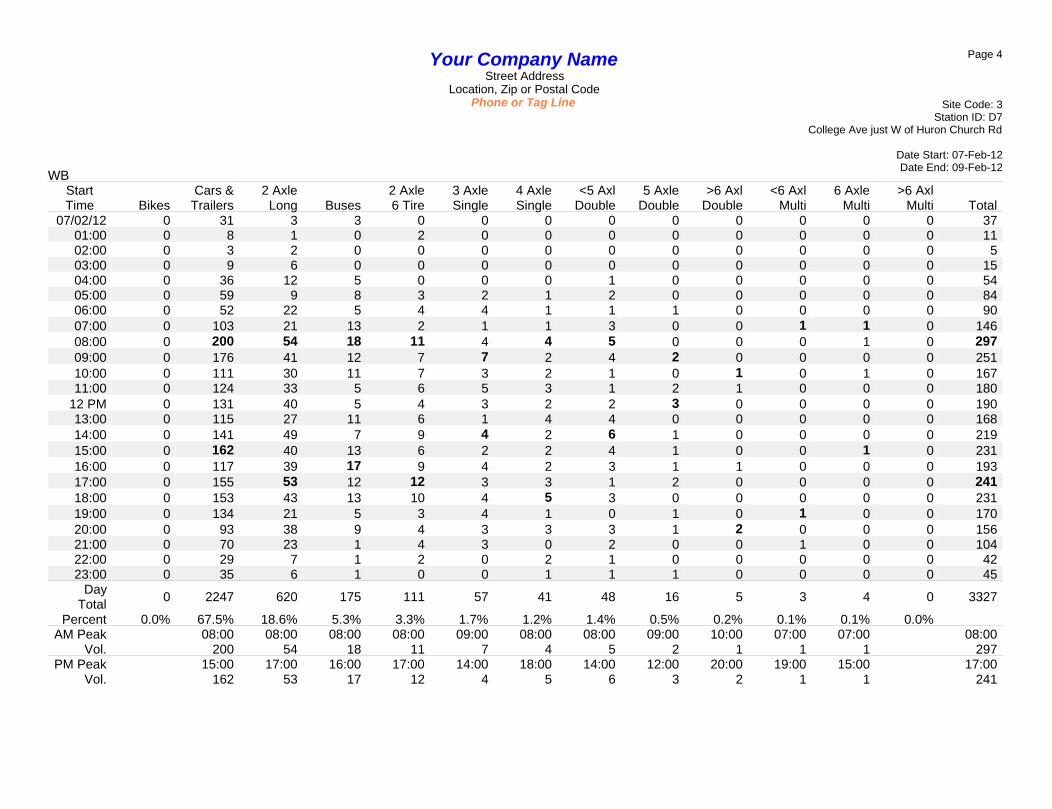
Site Code: 3Station ID: D7
College Ave just W of Huron Church Rd
Date Start: 07-Feb-12Date End: 09-Feb-12
Your Company NameStreet Address
Location, Zip or Postal CodePhone or Tag Line
WBStart Cars & 2 Axle 2 Axle 3 Axle 4 Axle <5 Axl 5 Axle >6 Axl <6 Axl 6 Axle >6 Axl Time Bikes Trailers Long Buses 6 Tire Single Single Double Double Double Multi Multi Multi Total
07/02/12 0 31 3 3 0 0 0 0 0 0 0 0 0 3701:00 0 8 1 0 2 0 0 0 0 0 0 0 0 1102:00 0 3 2 0 0 0 0 0 0 0 0 0 0 503:00 0 9 6 0 0 0 0 0 0 0 0 0 0 1504:00 0 36 12 5 0 0 0 1 0 0 0 0 0 5405:00 0 59 9 8 3 2 1 2 0 0 0 0 0 8406:00 0 52 22 5 4 4 1 1 1 0 0 0 0 9007:00 0 103 21 13 2 1 1 3 0 0 1 1 0 14608:00 0 200 54 18 11 4 4 5 0 0 0 1 0 29709:00 0 176 41 12 7 7 2 4 2 0 0 0 0 25110:00 0 111 30 11 7 3 2 1 0 1 0 1 0 16711:00 0 124 33 5 6 5 3 1 2 1 0 0 0 180
12 PM 0 131 40 5 4 3 2 2 3 0 0 0 0 19013:00 0 115 27 11 6 1 4 4 0 0 0 0 0 16814:00 0 141 49 7 9 4 2 6 1 0 0 0 0 21915:00 0 162 40 13 6 2 2 4 1 0 0 1 0 23116:00 0 117 39 17 9 4 2 3 1 1 0 0 0 19317:00 0 155 53 12 12 3 3 1 2 0 0 0 0 24118:00 0 153 43 13 10 4 5 3 0 0 0 0 0 23119:00 0 134 21 5 3 4 1 0 1 0 1 0 0 17020:00 0 93 38 9 4 3 3 3 1 2 0 0 0 15621:00 0 70 23 1 4 3 0 2 0 0 1 0 0 10422:00 0 29 7 1 2 0 2 1 0 0 0 0 0 4223:00 0 35 6 1 0 0 1 1 1 0 0 0 0 45
DayTotal
0 2247 620 175 111 57 41 48 16 5 3 4 0 3327
Percent 0.0% 67.5% 18.6% 5.3% 3.3% 1.7% 1.2% 1.4% 0.5% 0.2% 0.1% 0.1% 0.0% AM Peak 08:00 08:00 08:00 08:00 09:00 08:00 08:00 09:00 10:00 07:00 07:00 08:00
Vol. 200 54 18 11 7 4 5 2 1 1 1 297PM Peak 15:00 17:00 16:00 17:00 14:00 18:00 14:00 12:00 20:00 19:00 15:00 17:00
Vol. 162 53 17 12 4 5 6 3 2 1 1 241

Page 5
Site Code: 3Station ID: D7
College Ave just W of Huron Church Rd
Date Start: 07-Feb-12Date End: 09-Feb-12
Your Company NameStreet Address
Location, Zip or Postal CodePhone or Tag Line
WBStart Cars & 2 Axle 2 Axle 3 Axle 4 Axle <5 Axl 5 Axle >6 Axl <6 Axl 6 Axle >6 Axl Time Bikes Trailers Long Buses 6 Tire Single Single Double Double Double Multi Multi Multi Total
08/02/12 0 17 6 3 3 2 0 1 0 0 0 0 0 3201:00 0 5 4 0 0 0 0 0 0 0 0 0 0 902:00 0 3 1 0 0 0 0 0 1 0 0 0 0 503:00 0 7 1 0 0 0 0 1 0 0 0 0 0 904:00 0 33 8 4 2 0 1 1 0 0 0 0 0 4905:00 0 50 15 6 0 1 0 1 0 1 0 0 0 7406:00 0 61 20 5 2 1 0 2 1 0 0 0 0 9207:00 0 110 41 7 4 3 3 2 0 0 0 0 0 17008:00 0 183 65 15 13 4 1 3 2 2 0 1 0 28909:00 0 155 41 13 10 5 5 2 3 1 0 0 0 23510:00 0 120 32 9 8 4 3 6 0 1 0 0 0 18311:00 0 129 29 11 8 4 0 3 2 0 0 0 0 186
12 PM 0 129 35 21 11 5 0 0 0 0 0 0 0 20113:00 0 130 39 10 8 3 0 1 1 0 0 0 0 19214:00 0 144 43 6 6 2 4 3 2 0 0 0 0 21015:00 0 142 39 5 8 1 1 4 1 0 1 0 0 20216:00 0 122 41 13 5 7 0 5 1 0 1 0 0 19517:00 0 162 34 22 6 3 2 4 2 0 1 2 0 23818:00 0 153 39 10 6 5 3 5 4 1 0 0 0 22619:00 0 117 31 9 5 5 2 4 2 0 0 0 0 17520:00 0 120 26 3 9 1 0 1 0 0 0 0 0 16021:00 0 71 23 4 8 1 1 2 2 0 0 0 0 11222:00 0 35 9 3 1 0 1 1 0 0 0 0 0 5023:00 0 34 6 2 4 2 0 1 1 0 0 0 0 50
DayTotal
0 2232 628 181 127 59 27 53 25 6 3 3 0 3344
Percent 0.0% 66.7% 18.8% 5.4% 3.8% 1.8% 0.8% 1.6% 0.7% 0.2% 0.1% 0.1% 0.0% AM Peak 08:00 08:00 08:00 08:00 09:00 09:00 10:00 09:00 08:00 08:00 08:00
Vol. 183 65 15 13 5 5 6 3 2 1 289PM Peak 17:00 14:00 17:00 12:00 16:00 14:00 16:00 18:00 18:00 15:00 17:00 17:00
Vol. 162 43 22 11 7 4 5 4 1 1 2 238

Page 6
Site Code: 3Station ID: D7
College Ave just W of Huron Church Rd
Date Start: 07-Feb-12Date End: 09-Feb-12
Your Company NameStreet Address
Location, Zip or Postal CodePhone or Tag Line
WBStart Cars & 2 Axle 2 Axle 3 Axle 4 Axle <5 Axl 5 Axle >6 Axl <6 Axl 6 Axle >6 Axl Time Bikes Trailers Long Buses 6 Tire Single Single Double Double Double Multi Multi Multi Total
09/02/12 0 23 4 3 2 1 0 1 0 0 0 0 0 3401:00 0 6 1 1 1 0 0 0 0 0 0 0 0 902:00 0 3 2 1 0 0 0 0 0 0 0 0 0 603:00 0 14 4 0 1 0 0 0 0 0 0 0 0 1904:00 0 45 10 4 3 0 1 3 1 0 1 0 0 6805:00 0 52 13 2 4 2 2 1 0 0 0 0 0 7606:00 0 57 17 5 1 3 1 0 3 0 0 0 0 8707:00 0 91 28 7 6 2 0 1 1 1 0 0 0 13708:00 0 188 77 19 9 3 3 2 1 2 0 1 0 30509:00 0 191 56 12 3 2 1 6 1 1 0 0 0 27310:00 0 100 29 7 4 6 3 1 1 0 0 0 0 15111:00 0 134 40 6 9 2 1 3 1 1 0 0 0 197
12 PM 0 108 34 6 5 2 6 3 2 0 0 0 0 16613:00 0 119 32 6 4 1 0 4 0 0 0 0 0 16614:00 0 165 44 8 3 8 4 4 2 0 0 2 0 24015:00 0 169 38 9 2 6 2 2 0 0 0 0 0 22816:00 0 133 34 7 8 6 2 4 2 0 1 1 0 19817:00 0 170 68 8 11 3 1 4 2 1 1 0 0 26918:00 0 156 44 15 7 6 1 0 1 1 0 0 0 23119:00 0 125 30 11 3 6 2 1 2 0 1 0 0 18120:00 0 101 23 6 5 2 0 4 1 0 0 1 0 14321:00 0 66 30 5 2 3 0 5 1 0 0 0 0 11222:00 0 27 11 1 3 2 1 1 0 0 0 0 0 4623:00 0 39 13 2 2 1 0 0 0 0 0 0 0 57
DayTotal
0 2282 682 151 98 67 31 50 22 7 4 5 0 3399
Percent 0.0% 67.1% 20.1% 4.4% 2.9% 2.0% 0.9% 1.5% 0.6% 0.2% 0.1% 0.1% 0.0% AM Peak 09:00 08:00 08:00 08:00 10:00 08:00 09:00 06:00 08:00 04:00 08:00 08:00
Vol. 191 77 19 9 6 3 6 3 2 1 1 305PM Peak 17:00 17:00 18:00 17:00 14:00 12:00 21:00 12:00 17:00 16:00 14:00 17:00
Vol. 170 68 15 11 8 6 5 2 1 1 2 269
GrandTotal
0 6761 1930 507 336 183 99 151 63 18 10 12 0 10070
Percent 0.0% 67.1% 19.2% 5.0% 3.3% 1.8% 1.0% 1.5% 0.6% 0.2% 0.1% 0.1% 0.0%

Page 7
Site Code: 3Station ID: D7
College Ave just W of Huron Church Rd
Date Start: 07-Feb-12Date End: 09-Feb-12
Your Company NameStreet Address
Location, Zip or Postal CodePhone or Tag Line
EB, WBStart Cars & 2 Axle 2 Axle 3 Axle 4 Axle <5 Axl 5 Axle >6 Axl <6 Axl 6 Axle >6 Axl Time Bikes Trailers Long Buses 6 Tire Single Single Double Double Double Multi Multi Multi Total
07/02/12 0 57 11 7 2 0 3 1 0 0 0 0 0 8101:00 0 21 4 0 2 0 0 0 0 0 0 0 0 2702:00 0 9 2 0 0 1 0 0 0 0 0 0 0 1203:00 0 11 7 0 0 1 0 0 0 0 0 0 0 1904:00 0 45 14 6 0 0 0 1 0 0 0 0 0 6605:00 0 70 11 10 3 4 2 2 0 0 0 0 0 10206:00 0 101 35 8 5 6 1 1 1 0 0 0 0 15807:00 0 189 49 24 5 3 6 5 2 0 1 1 0 28508:00 0 321 95 35 17 5 9 8 0 0 1 1 0 49209:00 0 249 67 19 9 9 6 5 2 0 0 0 0 36610:00 0 221 68 24 11 5 5 1 0 1 0 1 0 33711:00 0 236 64 14 10 7 6 1 2 1 0 0 0 341
12 PM 0 240 76 20 7 5 4 5 3 0 2 0 0 36213:00 0 215 56 28 10 2 5 5 0 0 1 1 0 32314:00 0 254 83 27 17 4 9 10 2 0 0 0 0 40615:00 0 273 89 32 11 3 9 6 2 1 1 1 0 42816:00 0 234 71 36 19 6 4 5 1 1 2 0 0 37917:00 0 285 102 21 18 5 6 5 3 0 0 1 0 44618:00 0 287 79 20 18 5 8 7 0 0 0 0 0 42419:00 0 217 48 18 6 4 4 2 1 0 1 0 0 30120:00 0 171 72 17 9 4 5 3 1 2 0 0 0 28421:00 0 151 44 20 7 3 2 3 1 0 1 0 0 23222:00 0 88 32 8 5 2 2 1 0 0 0 0 0 13823:00 0 96 21 5 2 1 2 2 2 0 1 0 0 132
DayTotal
0 4041 1200 399 193 85 98 79 23 6 11 6 0 6141
Percent 0.0% 65.8% 19.5% 6.5% 3.1% 1.4% 1.6% 1.3% 0.4% 0.1% 0.2% 0.1% 0.0% AM Peak 08:00 08:00 08:00 08:00 09:00 08:00 08:00 07:00 10:00 07:00 07:00 08:00
Vol. 321 95 35 17 9 9 8 2 1 1 1 492PM Peak 18:00 17:00 16:00 16:00 16:00 14:00 14:00 12:00 20:00 12:00 13:00 17:00
Vol. 287 102 36 19 6 9 10 3 2 2 1 446

Page 8
Site Code: 3Station ID: D7
College Ave just W of Huron Church Rd
Date Start: 07-Feb-12Date End: 09-Feb-12
Your Company NameStreet Address
Location, Zip or Postal CodePhone or Tag Line
EB, WBStart Cars & 2 Axle 2 Axle 3 Axle 4 Axle <5 Axl 5 Axle >6 Axl <6 Axl 6 Axle >6 Axl Time Bikes Trailers Long Buses 6 Tire Single Single Double Double Double Multi Multi Multi Total
08/02/12 0 35 12 4 6 2 1 3 0 0 0 0 0 6301:00 0 14 9 1 1 0 0 0 0 0 0 0 0 2502:00 0 6 4 0 0 0 0 0 1 0 0 0 0 1103:00 0 9 1 0 1 0 0 1 0 0 0 0 0 1204:00 0 35 9 4 2 0 1 1 0 0 0 0 0 5205:00 0 65 15 8 1 2 0 1 0 1 0 0 0 9306:00 0 108 28 9 3 2 3 2 1 0 0 0 0 15607:00 0 180 68 17 15 4 5 4 2 0 0 0 0 29508:00 0 310 112 29 21 7 5 4 2 2 1 1 0 49409:00 0 221 59 18 14 8 6 3 4 1 0 0 0 33410:00 0 240 57 28 13 4 6 7 0 1 0 0 0 35611:00 0 241 59 25 11 5 0 4 2 0 0 0 0 347
12 PM 0 238 68 34 15 6 2 4 2 0 0 0 0 36913:00 0 241 68 28 14 6 5 3 1 0 0 0 0 36614:00 0 283 74 27 13 4 7 5 4 0 0 0 0 41715:00 0 283 75 19 10 1 1 6 2 0 1 0 0 39816:00 0 239 79 29 13 9 4 10 3 0 1 0 0 38717:00 0 300 75 36 16 4 6 5 2 1 2 3 0 45018:00 0 286 76 25 13 7 10 7 8 1 1 0 0 43419:00 0 195 49 20 6 7 5 6 2 0 0 0 0 29020:00 0 208 51 13 14 3 3 3 1 1 0 0 0 29721:00 0 153 42 16 10 1 6 4 4 1 1 0 0 23822:00 0 93 32 7 1 1 5 2 0 0 0 1 0 14223:00 0 77 24 9 10 3 1 2 1 0 0 0 0 127
DayTotal
0 4060 1146 406 223 86 82 87 42 9 7 5 0 6153
Percent 0.0% 66.0% 18.6% 6.6% 3.6% 1.4% 1.3% 1.4% 0.7% 0.1% 0.1% 0.1% 0.0% AM Peak 08:00 08:00 08:00 08:00 09:00 09:00 10:00 09:00 08:00 08:00 08:00 08:00
Vol. 310 112 29 21 8 6 7 4 2 1 1 494PM Peak 17:00 16:00 17:00 17:00 16:00 18:00 16:00 18:00 17:00 17:00 17:00 17:00
Vol. 300 79 36 16 9 10 10 8 1 2 3 450

Page 9
Site Code: 3Station ID: D7
College Ave just W of Huron Church Rd
Date Start: 07-Feb-12Date End: 09-Feb-12
Your Company NameStreet Address
Location, Zip or Postal CodePhone or Tag Line
EB, WBStart Cars & 2 Axle 2 Axle 3 Axle 4 Axle <5 Axl 5 Axle >6 Axl <6 Axl 6 Axle >6 Axl Time Bikes Trailers Long Buses 6 Tire Single Single Double Double Double Multi Multi Multi Total
09/02/12 0 54 13 6 5 1 0 1 0 0 0 0 0 8001:00 0 16 3 2 2 0 0 0 1 0 1 1 0 2602:00 0 6 4 1 1 0 0 0 0 0 0 0 0 1203:00 0 17 5 0 1 0 0 0 0 0 0 0 0 2304:00 0 54 12 5 5 0 1 3 1 0 1 0 0 8205:00 0 70 16 3 5 2 2 2 0 0 0 0 0 10006:00 0 109 30 8 4 4 2 0 3 0 0 0 0 16007:00 0 175 58 20 13 4 1 2 1 1 1 0 0 27608:00 0 334 117 30 19 6 6 4 3 2 0 2 0 52309:00 0 255 74 19 7 3 1 6 1 1 2 0 0 36910:00 0 199 65 26 9 9 6 2 1 0 1 0 0 31811:00 0 236 67 22 16 4 4 4 3 1 0 0 0 357
12 PM 0 213 68 25 11 4 16 4 3 0 0 0 0 34413:00 0 212 67 18 8 1 5 8 1 0 0 0 0 32014:00 0 302 75 22 8 9 7 6 5 1 0 2 0 43715:00 0 285 75 26 13 7 6 4 0 0 0 0 0 41616:00 0 247 76 14 17 6 7 4 3 0 2 1 0 37717:00 0 280 107 19 19 5 4 8 3 1 1 0 0 44718:00 0 277 85 28 15 6 4 2 3 2 1 0 0 42319:00 0 206 59 23 7 6 4 2 2 0 1 0 0 31020:00 0 191 41 14 11 2 1 6 1 0 0 1 0 26821:00 0 140 50 16 9 4 4 7 1 0 0 0 0 23122:00 0 90 38 7 6 3 1 1 0 2 0 0 0 14823:00 0 90 40 10 3 2 4 0 0 1 0 1 0 151
DayTotal
0 4058 1245 364 214 88 86 76 36 12 11 8 0 6198
Percent 0.0% 65.5% 20.1% 5.9% 3.5% 1.4% 1.4% 1.2% 0.6% 0.2% 0.2% 0.1% 0.0% AM Peak 08:00 08:00 08:00 08:00 10:00 08:00 09:00 06:00 08:00 09:00 08:00 08:00
Vol. 334 117 30 19 9 6 6 3 2 2 2 523PM Peak 14:00 17:00 18:00 17:00 14:00 12:00 13:00 14:00 18:00 16:00 14:00 17:00
Vol. 302 107 28 19 9 16 8 5 2 2 2 447
GrandTotal
0 12159 3591 1169 630 259 266 242 101 27 29 19 0 18492
Percent 0.0% 65.8% 19.4% 6.3% 3.4% 1.4% 1.4% 1.3% 0.5% 0.1% 0.2% 0.1% 0.0%

Ontario Traffic Inc.Morning Peak Diagram Specified Period
From:To:
7:00:00
9:00:00
One Hour PeakFrom:To:
7:45:00
8:45:00
Municipality:Site #:Intersection:TFR File #:Count date:
Windsor
1201700001
HURON CHURCH RD & COLLEGE
13
8-Feb-12
Weather conditions:
Person(s) who counted:
** Signalized Intersection ** Major Road: HURON CHURCH RD runs N/S
North Leg Total:
North Entering:
North Peds:
Peds Cross:
2193
632
34
Cyclists
Trucks
Cars
Totals
0
0
35
35
0
205
377
582
0
3
12
15
0
208
424
Cyclists
Trucks
Cars
Totals
0
253
1308
1561
Cyclists Trucks Cars Totals
0 9 201 210
Cyclists Trucks Cars Totals
0 2 77 79
0 6 116 122
0 3 86 89
0 11 279
Peds Cross:
West Peds:
West Entering:
West Leg Total:
15
290
500
HURON CHURCH RD
COLLEGE AVEW
N
E
S
COLLEGE AVE
HURON CHURCH RD
East Leg Total:
East Entering:
East Peds:
Peds Cross:
510
182
7
Cars Trucks Cyclists Totals
21 5 0 26
69 5 0 74
73 9 0 82
163 19 0
Cars Trucks Cyclists Totals
313 15 0 328
Cars
Trucks
Cyclists
Totals
536
217
0
753
Cars
Trucks
Cyclists
Totals
97
4
0
101
1210
246
0
1456
185
6
0
191
1492
256
0
Peds Cross:
South Peds:
South Entering:
South Leg Total:
17
1748
2501
Comments

Ontario Traffic Inc.Mid-day Peak Diagram Specified Period
From:To:
11:00:00
13:00:00
One Hour PeakFrom:To:
11:00:00
12:00:00
Municipality:Site #:Intersection:TFR File #:Count date:
Windsor
1201700001
HURON CHURCH RD & COLLEGE
13
8-Feb-12
Weather conditions:
Person(s) who counted:
** Signalized Intersection ** Major Road: HURON CHURCH RD runs N/S
North Leg Total:
North Entering:
North Peds:
Peds Cross:
1787
802
46
Cyclists
Trucks
Cars
Totals
0
0
26
26
0
270
485
755
0
1
20
21
0
271
531
Cyclists
Trucks
Cars
Totals
0
273
712
985
Cyclists Trucks Cars Totals
0 4 157 161
Cyclists Trucks Cars Totals
0 1 42 43
0 3 77 80
0 2 61 63
0 6 180
Peds Cross:
West Peds:
West Entering:
West Leg Total:
25
186
347
HURON CHURCH RD
COLLEGE AVEW
N
E
S
COLLEGE AVE
HURON CHURCH RD
East Leg Total:
East Entering:
East Peds:
Peds Cross:
399
196
11
Cars Trucks Cyclists Totals
21 2 0 23
74 2 0 76
91 6 0 97
186 10 0
Cars Trucks Cyclists Totals
188 15 0 203
Cars
Trucks
Cyclists
Totals
637
278
0
915
Cars
Trucks
Cyclists
Totals
57
2
0
59
649
270
0
919
91
11
0
102
797
283
0
Peds Cross:
South Peds:
South Entering:
South Leg Total:
22
1080
1995
Comments

Ontario Traffic Inc.Afternoon Peak Diagram Specified Period
From:To:
16:00:00
18:00:00
One Hour PeakFrom:To:
17:00:00
18:00:00
Municipality:Site #:Intersection:TFR File #:Count date:
Windsor
1201700001
HURON CHURCH RD & COLLEGE
13
8-Feb-12
Weather conditions:
Person(s) who counted:
** Signalized Intersection ** Major Road: HURON CHURCH RD runs N/S
North Leg Total:
North Entering:
North Peds:
Peds Cross:
2417
1498
33
Cyclists
Trucks
Cars
Totals
0
0
39
39
0
316
1112
1428
0
2
29
31
0
318
1180
Cyclists
Trucks
Cars
Totals
0
345
574
919
Cyclists Trucks Cars Totals
0 1 211 212
Cyclists Trucks Cars Totals
0 0 35 35
0 0 118 118
0 0 86 86
0 0 239
Peds Cross:
West Peds:
West Entering:
West Leg Total:
2
239
451
HURON CHURCH RD
COLLEGE AVEW
N
E
S
COLLEGE AVE
HURON CHURCH RD
East Leg Total:
East Entering:
East Peds:
Peds Cross:
601
303
8
Cars Trucks Cyclists Totals
18 1 0 19
110 1 0 111
169 4 0 173
297 6 0
Cars Trucks Cyclists Totals
288 10 0 298
Cars
Trucks
Cyclists
Totals
1367
320
0
1687
Cars
Trucks
Cyclists
Totals
62
0
0
62
521
344
0
865
141
8
0
149
724
352
0
Peds Cross:
South Peds:
South Entering:
South Leg Total:
22
1076
2763
Comments

Ontario Traffic Inc.Total Count Diagram
Municipality:Site #:Intersection:TFR File #:Count date:
Windsor
1201700001
HURON CHURCH RD & COLLEGE
13
8-Feb-12
Weather conditions:
Person(s) who counted:
** Signalized Intersection ** Major Road: HURON CHURCH RD runs N/S
North Leg Total:
North Entering:
North Peds:
Peds Cross:
12197
5776
203
Cyclists
Trucks
Cars
Totals
0
1
195
196
0
1618
3834
5452
0
16
112
128
0
1635
4141
Cyclists
Trucks
Cars
Totals
0
1628
4793
6421
Cyclists Trucks Cars Totals
0 33 1039 1072
Cyclists Trucks Cars Totals
0 8 310 318
0 12 537 549
0 8 426 434
0 28 1273
Peds Cross:
West Peds:
West Entering:
West Leg Total:
61
1301
2373
HURON CHURCH RD
COLLEGE AVEW
N
E
S
COLLEGE AVE
HURON CHURCH RD
East Leg Total:
East Entering:
East Peds:
Peds Cross:
2691
1268
41
Cars Trucks Cyclists Totals
109 14 0 123
443 17 0 460
658 27 0 685
1210 58 0
Cars Trucks Cyclists Totals
1353 70 0 1423
Cars
Trucks
Cyclists
Totals
4918
1653
0
6571
Cars
Trucks
Cyclists
Totals
401
15
0
416
4374
1606
0
5980
704
42
0
746
5479
1663
0
Peds Cross:
South Peds:
South Entering:
South Leg Total:
96
7142
13713
Comments

Ontario Traffic Inc.Traffic Count Summary
Intersection: HURON CHURCH RD & COLLEGECount Date: 8-Feb-12 Municipality: Windsor
North Approach Totals South Approach Totals
East Approach Totals West Approach Totals
Includes Cars, Trucks, & Cyclists Includes Cars, Trucks, & Cyclists
Includes Cars, Trucks, & Cyclists Includes Cars, Trucks, & Cyclists
Hour Hour
Hour Hour
Ending Ending
Ending Ending
Left Left
Left Left
Thru Thru
Thru Thru
Right Right
Right Right
Grand Grand
Grand Grand
Total Total
Total Total
Total Total
Total Total
Peds Peds
Peds Peds
North/South
East/West
Total
Total
Approaches
Approaches
Calculated Values for Traffic Crossing Major StreetHours Ending:Crossing Values:
Totals:
Totals:
7:00:00 0 0 0 0 0 0 7:00:00 0 0 0 0 08:00:00 5 405 18 428 9 1759 8:00:00 71 1175 85 1331 69:00:00 16 603 37 656 42 2376 9:00:00 86 1446 188 1720 16
11:00:00 0 0 0 0 0 0 11:00:00 0 0 0 0 012:00:00 21 755 26 802 46 1882 12:00:00 59 919 102 1080 2213:00:00 20 793 34 847 36 1890 13:00:00 85 843 115 1043 716:00:00 2 46 3 51 6 121 16:00:00 2 58 10 70 017:00:00 33 1422 39 1494 31 2316 17:00:00 51 674 97 822 2318:00:00 31 1428 39 1498 33 2574 18:00:00 62 865 149 1076 22
7:00:00 0 0 0 0 0 1 7:00:00 0 1 0 1 08:00:00 54 36 19 109 2 279 8:00:00 65 56 49 170 79:00:00 67 82 30 179 8 468 9:00:00 84 122 83 289 14
11:00:00 0 0 0 0 0 5 11:00:00 0 5 0 5 012:00:00 97 76 23 196 11 382 12:00:00 43 80 63 186 2513:00:00 98 49 15 162 3 363 13:00:00 43 88 70 201 416:00:00 8 4 1 13 2 28 16:00:00 4 7 4 15 017:00:00 188 102 16 306 7 501 17:00:00 44 72 79 195 918:00:00 173 111 19 303 8 541 18:00:00 35 117 86 238 2
8:00 9:00 11:00 12:00 13:00 16:00 17:00 18:00190 331 5 288 272 25 388 380
128 5452 196 5776 203 12918 416 5980 746 7142 96
685 460 123 1268 41 2568 318 548 434 1300 61

Ontario Traffic Inc.Count Date: 8-Feb-12 Site #: 1201700001
IntervalTime
Passenger Cars - North Approach Trucks - North Approach Cyclists - North Approach Pedestrians
Left Left LeftThru Thru ThruRight Right Right North Cross
Cum Cum Cum Cum Cum Cum Cum Cum Cum CumIncr Incr Incr Incr Incr Incr Incr Incr Incr Incr7:00:00 0 0 0 0 0 0 0 0 0 0 0 0 0 0 0 0 0 0 0 07:15:00 0 0 51 51 2 2 0 0 44 44 0 0 0 0 0 0 0 0 2 27:30:00 0 0 99 48 4 2 3 3 86 42 0 0 0 0 0 0 0 0 2 07:45:00 1 1 175 76 13 9 3 0 116 30 0 0 0 0 0 0 0 0 9 78:00:00 2 1 256 81 18 5 3 0 149 33 0 0 0 0 0 0 0 0 9 08:15:00 4 2 358 102 27 9 3 0 194 45 0 0 0 0 0 0 0 0 19 108:30:00 9 5 465 107 38 11 4 1 261 67 0 0 0 0 0 0 0 0 34 158:45:00 13 4 552 87 48 10 6 2 321 60 0 0 0 0 0 0 0 0 43 99:00:00 15 2 624 72 55 7 6 0 384 63 0 0 0 0 0 0 0 0 51 89:00:14 15 0 624 0 55 0 6 0 384 0 0 0 0 0 0 0 0 0 51 0
11:00:00 15 0 624 0 55 0 6 0 384 0 0 0 0 0 0 0 0 0 51 011:15:00 16 1 723 99 60 5 6 0 437 53 0 0 0 0 0 0 0 0 61 1011:30:00 24 8 856 133 66 6 6 0 508 71 0 0 0 0 0 0 0 0 82 2111:45:00 28 4 986 130 72 6 7 1 587 79 0 0 0 0 0 0 0 0 90 812:00:00 35 7 1109 123 81 9 7 0 654 67 0 0 0 0 0 0 0 0 97 712:15:00 39 4 1223 114 87 6 7 0 707 53 1 1 0 0 0 0 0 0 107 1012:30:00 44 5 1330 107 92 5 8 1 785 78 1 0 0 0 0 0 0 0 112 512:45:00 45 1 1460 130 106 14 8 0 873 88 1 0 0 0 0 0 0 0 128 1613:00:00 53 8 1582 122 114 8 9 1 974 101 1 0 0 0 0 0 0 0 133 513:03:38 54 1 1626 44 117 3 10 1 976 2 1 0 0 0 0 0 0 0 139 616:00:00 54 0 1626 0 117 0 10 0 976 0 1 0 0 0 0 0 0 0 139 016:15:00 59 5 1915 289 128 11 11 1 1048 72 1 0 0 0 0 0 0 0 144 516:30:00 66 7 2160 245 136 8 11 0 1147 99 1 0 0 0 0 0 0 0 156 1216:45:00 77 11 2453 293 147 11 13 2 1228 81 1 0 0 0 0 0 0 0 161 517:00:00 83 6 2722 269 156 9 14 1 1302 74 1 0 0 0 0 0 0 0 170 917:15:00 89 6 3013 291 163 7 14 0 1367 65 1 0 0 0 0 0 0 0 178 817:30:00 93 4 3283 270 176 13 15 1 1463 96 1 0 0 0 0 0 0 0 184 617:45:00 105 12 3590 307 186 10 16 1 1544 81 1 0 0 0 0 0 0 0 195 1118:00:00 112 7 3834 244 195 9 16 0 1618 74 1 0 0 0 0 0 0 0 203 818:00:13 112 0 3834 0 195 0 16 0 1618 0 1 0 0 0 0 0 0 0 203 0

Ontario Traffic Inc.Count Date: 8-Feb-12 Site #: 1201700001
IntervalTime
Passenger Cars - East Approach Trucks - East Approach Cyclists - East Approach Pedestrians
Left Left LeftThru Thru ThruRight Right Right East Cross
Cum Cum Cum Cum Cum Cum Cum Cum Cum CumIncr Incr Incr Incr Incr Incr Incr Incr Incr Incr7:00:00 0 0 0 0 0 0 0 0 0 0 0 0 0 0 0 0 0 0 0 07:15:00 7 7 6 6 6 6 1 1 0 0 0 0 0 0 0 0 0 0 0 07:30:00 15 8 15 9 10 4 1 0 0 0 0 0 0 0 0 0 0 0 2 27:45:00 29 14 24 9 13 3 1 0 2 2 1 1 0 0 0 0 0 0 2 08:00:00 48 19 33 9 18 5 6 5 3 1 1 0 0 0 0 0 0 0 2 08:15:00 72 24 45 12 29 11 8 2 4 1 1 0 0 0 0 0 0 0 7 58:30:00 90 18 66 21 32 3 9 1 5 1 3 2 0 0 0 0 0 0 8 18:45:00 102 12 93 27 34 2 10 1 7 2 6 3 0 0 0 0 0 0 9 19:00:00 109 7 109 16 42 8 12 2 9 2 7 1 0 0 0 0 0 0 10 19:00:14 109 0 109 0 42 0 12 0 9 0 7 0 0 0 0 0 0 0 10 0
11:00:00 109 0 109 0 42 0 12 0 9 0 7 0 0 0 0 0 0 0 10 011:15:00 123 14 119 10 47 5 12 0 10 1 7 0 0 0 0 0 0 0 14 411:30:00 158 35 144 25 54 7 14 2 10 0 8 1 0 0 0 0 0 0 20 611:45:00 188 30 164 20 59 5 17 3 11 1 8 0 0 0 0 0 0 0 21 112:00:00 200 12 183 19 63 4 18 1 11 0 9 1 0 0 0 0 0 0 21 012:15:00 208 8 195 12 64 1 18 0 12 1 10 1 0 0 0 0 0 0 22 112:30:00 228 20 208 13 65 1 21 3 12 0 10 0 0 0 0 0 0 0 23 112:45:00 240 12 215 7 72 7 22 1 13 1 10 0 0 0 0 0 0 0 24 113:00:00 294 54 230 15 75 3 22 0 13 0 12 2 0 0 0 0 0 0 24 013:03:38 302 8 234 4 76 1 22 0 13 0 12 0 0 0 0 0 0 0 26 216:00:00 302 0 234 0 76 0 22 0 13 0 12 0 0 0 0 0 0 0 26 016:15:00 362 60 260 26 78 2 22 0 15 2 12 0 0 0 0 0 0 0 29 316:30:00 395 33 286 26 80 2 22 0 15 0 12 0 0 0 0 0 0 0 31 216:45:00 449 54 310 24 86 6 23 1 15 0 13 1 0 0 0 0 0 0 31 017:00:00 489 40 333 23 91 5 23 0 16 1 13 0 0 0 0 0 0 0 33 217:15:00 538 49 360 27 95 4 23 0 16 0 13 0 0 0 0 0 0 0 36 317:30:00 581 43 384 24 99 4 25 2 16 0 14 1 0 0 0 0 0 0 38 217:45:00 622 41 408 24 104 5 26 1 17 1 14 0 0 0 0 0 0 0 40 218:00:00 658 36 443 35 109 5 27 1 17 0 14 0 0 0 0 0 0 0 41 118:00:13 658 0 443 0 109 0 27 0 17 0 14 0 0 0 0 0 0 0 41 0

Ontario Traffic Inc.Count Date: 8-Feb-12 Site #: 1201700001
IntervalTime
Passenger Cars - South Approach Trucks - South Approach Cyclists - South Approach Pedestrians
Left Left LeftThru Thru ThruRight Right Right South Cross
Cum Cum Cum Cum Cum Cum Cum Cum Cum CumIncr Incr Incr Incr Incr Incr Incr Incr Incr Incr7:00:00 0 0 0 0 0 0 0 0 0 0 0 0 0 0 0 0 0 0 0 07:15:00 7 7 218 218 16 16 1 1 62 62 1 1 0 0 0 0 0 0 1 17:30:00 18 11 445 227 31 15 2 1 128 66 3 2 0 0 0 0 0 0 3 27:45:00 42 24 674 229 47 16 4 2 183 55 6 3 0 0 0 0 0 0 3 08:00:00 66 24 927 253 78 31 5 1 248 65 7 1 0 0 0 0 0 0 6 38:15:00 95 29 1250 323 136 58 6 1 298 50 8 1 0 0 0 0 0 0 7 18:30:00 111 16 1609 359 196 60 7 1 361 63 11 3 0 0 0 0 0 0 13 68:45:00 139 28 1884 275 232 36 8 1 429 68 12 1 0 0 0 0 0 0 20 79:00:00 147 8 2112 228 260 28 10 2 509 80 13 1 0 0 0 0 0 0 22 29:00:14 147 0 2112 0 260 0 10 0 509 0 13 0 0 0 0 0 0 0 22 0
11:00:00 147 0 2112 0 260 0 10 0 509 0 13 0 0 0 0 0 0 0 22 011:15:00 156 9 2296 184 289 29 11 1 576 67 13 0 0 0 0 0 0 0 26 411:30:00 179 23 2503 207 320 31 11 0 641 65 16 3 0 0 0 0 0 0 35 911:45:00 193 14 2658 155 331 11 11 0 711 70 19 3 0 0 0 0 0 0 41 612:00:00 204 11 2761 103 351 20 12 1 779 68 24 5 0 0 0 0 0 0 44 312:15:00 228 24 2893 132 370 19 12 0 837 58 24 0 0 0 0 0 0 0 47 312:30:00 243 15 3025 132 393 23 13 1 908 71 26 2 0 0 0 0 0 0 47 012:45:00 264 21 3168 143 428 35 15 2 971 63 28 2 0 0 0 0 0 0 49 213:00:00 286 22 3337 169 460 32 15 0 1046 75 30 2 0 0 0 0 0 0 51 213:03:38 288 2 3369 32 468 8 15 0 1072 26 32 2 0 0 0 0 0 0 51 016:00:00 288 0 3369 0 468 0 15 0 1072 0 32 0 0 0 0 0 0 0 51 016:15:00 304 16 3486 117 497 29 15 0 1110 38 33 1 0 0 0 0 0 0 68 1716:30:00 315 11 3602 116 527 30 15 0 1156 46 34 1 0 0 0 0 0 0 71 316:45:00 330 15 3717 115 542 15 15 0 1206 50 34 0 0 0 0 0 0 0 74 317:00:00 339 9 3853 136 563 21 15 0 1262 56 34 0 0 0 0 0 0 0 74 017:15:00 357 18 3987 134 590 27 15 0 1352 90 36 2 0 0 0 0 0 0 91 1717:30:00 367 10 4123 136 628 38 15 0 1439 87 40 4 0 0 0 0 0 0 92 117:45:00 383 16 4243 120 663 35 15 0 1518 79 41 1 0 0 0 0 0 0 96 418:00:00 401 18 4374 131 704 41 15 0 1606 88 42 1 0 0 0 0 0 0 96 018:00:13 401 0 4374 0 704 0 15 0 1606 0 42 0 0 0 0 0 0 0 96 0

Ontario Traffic Inc.Count Date: 8-Feb-12 Site #: 1201700001
IntervalTime
Passenger Cars - West Approach Trucks - West Approach Cyclists - West Approach Pedestrians
Left Left LeftThru Thru ThruRight Right Right West Cross
Cum Cum Cum Cum Cum Cum Cum Cum Cum CumIncr Incr Incr Incr Incr Incr Incr Incr Incr Incr7:00:00 0 0 1 1 0 0 0 0 0 0 0 0 0 0 0 0 0 0 0 07:15:00 19 19 9 8 12 12 0 0 0 0 0 0 0 0 0 0 0 0 1 17:30:00 35 16 21 12 22 10 1 1 1 1 0 0 0 0 0 0 0 0 1 07:45:00 51 16 32 11 34 12 1 0 2 1 0 0 0 0 0 0 0 0 4 38:00:00 63 12 52 20 49 15 2 1 5 3 0 0 0 0 0 0 0 0 7 38:15:00 90 27 77 25 76 27 3 1 5 0 1 1 0 0 0 0 0 0 8 18:30:00 110 20 112 35 94 18 3 0 6 1 1 0 0 0 0 0 0 0 16 88:45:00 128 18 148 36 120 26 3 0 8 2 3 2 0 0 0 0 0 0 19 39:00:00 143 15 170 22 128 8 6 3 9 1 4 1 0 0 0 0 0 0 21 29:00:14 143 0 174 4 128 0 6 0 9 0 4 0 0 0 0 0 0 0 21 0
11:00:00 143 0 175 1 128 0 6 0 9 0 4 0 0 0 0 0 0 0 21 011:15:00 153 10 192 17 142 14 6 0 9 0 4 0 0 0 0 0 0 0 21 011:30:00 169 16 211 19 156 14 6 0 9 0 5 1 0 0 0 0 0 0 39 1811:45:00 171 2 236 25 168 12 7 1 10 1 6 1 0 0 0 0 0 0 42 312:00:00 185 14 252 16 189 21 7 0 12 2 6 0 0 0 0 0 0 0 46 412:15:00 195 10 268 16 206 17 7 0 12 0 6 0 0 0 0 0 0 0 47 112:30:00 203 8 293 25 224 18 7 0 12 0 6 0 0 0 0 0 0 0 50 312:45:00 217 14 318 25 246 22 7 0 12 0 6 0 0 0 0 0 0 0 50 013:00:00 228 11 340 22 259 13 7 0 12 0 6 0 0 0 0 0 0 0 50 013:03:38 232 4 346 6 261 2 7 0 12 0 8 2 0 0 0 0 0 0 50 016:00:00 232 0 347 1 261 0 7 0 12 0 8 0 0 0 0 0 0 0 50 016:15:00 243 11 366 19 288 27 7 0 12 0 8 0 0 0 0 0 0 0 51 116:30:00 256 13 383 17 309 21 7 0 12 0 8 0 0 0 0 0 0 0 51 016:45:00 264 8 398 15 326 17 8 1 12 0 8 0 0 0 0 0 0 0 54 317:00:00 275 11 419 21 340 14 8 0 12 0 8 0 0 0 0 0 0 0 59 517:15:00 283 8 437 18 366 26 8 0 12 0 8 0 0 0 0 0 0 0 59 017:30:00 289 6 461 24 385 19 8 0 12 0 8 0 0 0 0 0 0 0 60 117:45:00 298 9 490 29 404 19 8 0 12 0 8 0 0 0 0 0 0 0 61 118:00:00 310 12 536 46 426 22 8 0 12 0 8 0 0 0 0 0 0 0 61 018:00:13 310 0 537 1 426 0 8 0 12 0 8 0 0 0 0 0 0 0 61 0

Ontario Traffic Inc.Morning Peak Diagram Specified Period
From:To:
7:00:00
9:00:00
One Hour PeakFrom:To:
7:45:00
8:45:00
Municipality:Site #:Intersection:TFR File #:Count date:
Windsor
1201700002
MILL ST & INDIAN RD
12
8-Feb-12
Weather conditions:
Person(s) who counted:
** Non-Signalized Intersection ** Major Road: MILL ST runs N/S
North Leg Total:
North Entering:
North Peds:
Peds Cross:
11
5
5
Cyclists
Trucks
Cars
Totals
0
0
1
1
0
0
4
4
0
0
5
Cyclists
Trucks
Cars
Totals
0
1
5
6
Cyclists Trucks Cars Totals
0 0 1 1
Cyclists Trucks Cars Totals
0 1 3 4
0 0 3 3
0 1 6
Peds Cross:
West Peds:
West Entering:
West Leg Total:
1
7
8
MILL ST
INDIAN RDW
N
E
S
INDIAN RD
East Leg Total:
East Entering:
East Peds:
Peds Cross:
9
2
3
Cars Trucks Cyclists Totals
2 0 0 2
0 0 0 0
2 0 0
Cars Trucks Cyclists Totals
7 0 0 7
Comments

Ontario Traffic Inc.Mid-day Peak Diagram Specified Period
From:To:
11:00:00
13:00:00
One Hour PeakFrom:To:
11:15:00
12:15:00
Municipality:Site #:Intersection:TFR File #:Count date:
Windsor
1201700002
MILL ST & INDIAN RD
12
8-Feb-12
Weather conditions:
Person(s) who counted:
** Non-Signalized Intersection ** Major Road: MILL ST runs N/S
North Leg Total:
North Entering:
North Peds:
Peds Cross:
9
4
8
Cyclists
Trucks
Cars
Totals
0
0
4
4
0
0
0
0
0
0
4
Cyclists
Trucks
Cars
Totals
0
0
5
5
Cyclists Trucks Cars Totals
0 0 5 5
Cyclists Trucks Cars Totals
0 0 3 3
0 0 2 2
0 0 5
Peds Cross:
West Peds:
West Entering:
West Leg Total:
1
5
10
MILL ST
INDIAN RDW
N
E
S
INDIAN RD
East Leg Total:
East Entering:
East Peds:
Peds Cross:
5
3
1
Cars Trucks Cyclists Totals
2 0 0 2
1 0 0 1
3 0 0
Cars Trucks Cyclists Totals
2 0 0 2
Comments

Ontario Traffic Inc.Afternoon Peak Diagram Specified Period
From:To:
16:00:00
18:00:00
One Hour PeakFrom:To:
17:00:00
18:00:00
Municipality:Site #:Intersection:TFR File #:Count date:
Windsor
1201700002
MILL ST & INDIAN RD
12
8-Feb-12
Weather conditions:
Person(s) who counted:
** Non-Signalized Intersection ** Major Road: MILL ST runs N/S
North Leg Total:
North Entering:
North Peds:
Peds Cross:
11
4
4
Cyclists
Trucks
Cars
Totals
0
0
4
4
0
0
0
0
0
0
4
Cyclists
Trucks
Cars
Totals
0
0
7
7
Cyclists Trucks Cars Totals
0 0 6 6
Cyclists Trucks Cars Totals
0 0 2 2
0 0 4 4
0 0 6
Peds Cross:
West Peds:
West Entering:
West Leg Total:
1
6
12
MILL ST
INDIAN RDW
N
E
S
INDIAN RD
East Leg Total:
East Entering:
East Peds:
Peds Cross:
11
7
1
Cars Trucks Cyclists Totals
5 0 0 5
2 0 0 2
7 0 0
Cars Trucks Cyclists Totals
4 0 0 4
Comments

Ontario Traffic Inc.Total Count Diagram
Municipality:Site #:Intersection:TFR File #:Count date:
Windsor
1201700002
MILL ST & INDIAN RD
12
8-Feb-12
Weather conditions:
Person(s) who counted:
** Non-Signalized Intersection ** Major Road: MILL ST runs N/S
North Leg Total:
North Entering:
North Peds:
Peds Cross:
46
19
41
Cyclists
Trucks
Cars
Totals
0
0
14
14
0
0
5
5
0
0
19
Cyclists
Trucks
Cars
Totals
0
1
26
27
Cyclists Trucks Cars Totals
0 0 22 22
Cyclists Trucks Cars Totals
0 1 15 16
0 0 20 20
0 1 35
Peds Cross:
West Peds:
West Entering:
West Leg Total:
5
36
58
MILL ST
INDIAN RDW
N
E
S
INDIAN RD
East Leg Total:
East Entering:
East Peds:
Peds Cross:
44
19
9
Cars Trucks Cyclists Totals
11 0 0 11
8 0 0 8
19 0 0
Cars Trucks Cyclists Totals
25 0 0 25
Comments

Ontario Traffic Inc.Traffic Count Summary
Intersection: MILL ST & INDIAN RD Count Date: 8-Feb-12 Municipality: Windsor
North Approach Totals South Approach Totals
East Approach Totals West Approach Totals
Includes Cars, Trucks, & Cyclists Includes Cars, Trucks, & Cyclists
Includes Cars, Trucks, & Cyclists Includes Cars, Trucks, & Cyclists
Hour Hour
Hour Hour
Ending Ending
Ending Ending
Left Left
Left Left
Thru Thru
Thru Thru
Right Right
Right Right
Grand Grand
Grand Grand
Total Total
Total Total
Total Total
Total Total
Peds Peds
Peds Peds
North/South
East/West
Total
Total
Approaches
Approaches
Calculated Values for Traffic Crossing Major StreetHours Ending:Crossing Values:
Totals:
Totals:
7:00:00 0 0 0 0 0 0 7:00:00 0 0 0 0 08:00:00 0 0 1 1 5 1 8:00:00 0 0 0 0 09:00:00 4 0 0 4 6 4 9:00:00 0 0 0 0 0
11:00:00 0 0 0 0 0 0 11:00:00 0 0 0 0 012:00:00 0 0 3 3 10 3 12:00:00 0 0 0 0 013:00:00 1 0 2 3 8 3 13:00:00 0 0 0 0 016:00:00 0 0 0 0 0 0 16:00:00 0 0 0 0 017:00:00 0 0 4 4 8 4 17:00:00 0 0 0 0 018:00:00 0 0 4 4 4 4 18:00:00 0 0 0 0 0
7:00:00 0 0 0 0 0 1 7:00:00 0 1 0 1 08:00:00 0 1 0 1 0 5 8:00:00 2 2 0 4 09:00:00 0 0 2 2 3 7 9:00:00 2 3 0 5 1
11:00:00 0 0 0 0 0 2 11:00:00 0 2 0 2 012:00:00 0 1 2 3 0 7 12:00:00 3 1 0 4 213:00:00 0 0 1 1 2 8 13:00:00 4 3 0 7 016:00:00 0 0 0 0 0 2 16:00:00 0 2 0 2 017:00:00 0 4 1 5 3 10 17:00:00 3 2 0 5 118:00:00 0 0 5 5 1 11 18:00:00 2 4 0 6 1
8:00 9:00 11:00 12:00 13:00 16:00 17:00 18:009 11 2 14 15 2 15 10
5 0 14 19 41 19 0 0 0 0 0
0 6 11 17 9 53 16 20 0 36 5
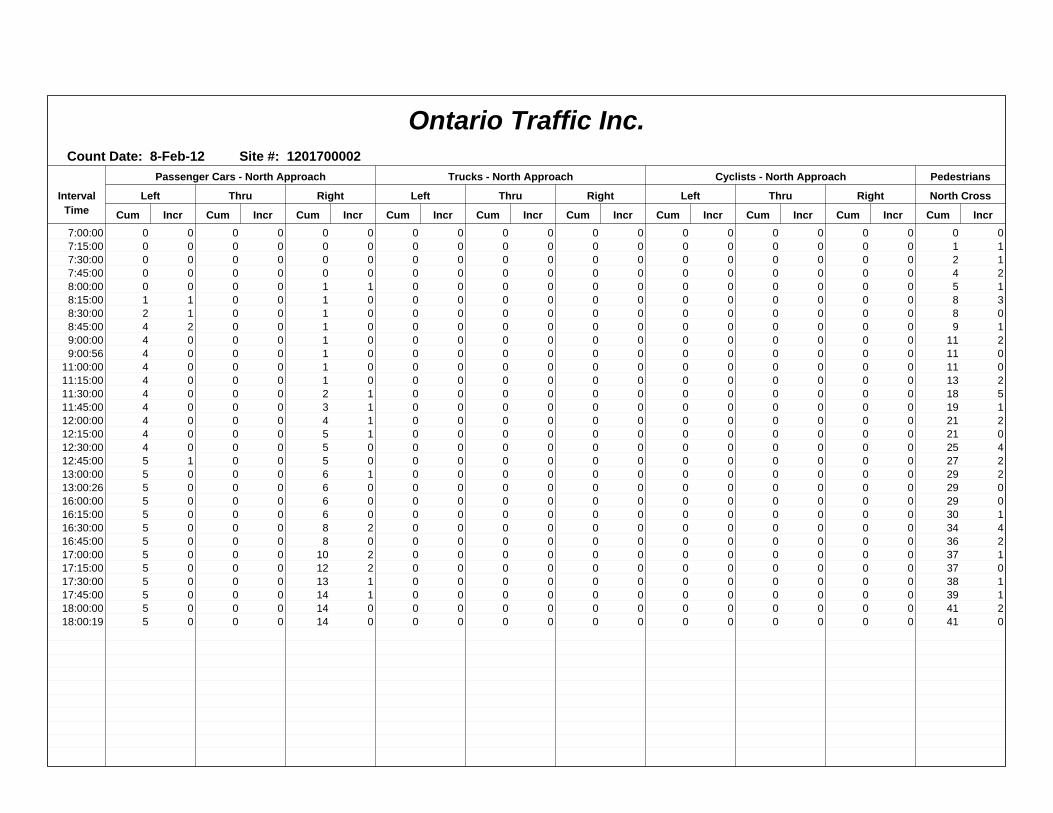
Ontario Traffic Inc.Count Date: 8-Feb-12 Site #: 1201700002
IntervalTime
Passenger Cars - North Approach Trucks - North Approach Cyclists - North Approach Pedestrians
Left Left LeftThru Thru ThruRight Right Right North Cross
Cum Cum Cum Cum Cum Cum Cum Cum Cum CumIncr Incr Incr Incr Incr Incr Incr Incr Incr Incr7:00:00 0 0 0 0 0 0 0 0 0 0 0 0 0 0 0 0 0 0 0 07:15:00 0 0 0 0 0 0 0 0 0 0 0 0 0 0 0 0 0 0 1 17:30:00 0 0 0 0 0 0 0 0 0 0 0 0 0 0 0 0 0 0 2 17:45:00 0 0 0 0 0 0 0 0 0 0 0 0 0 0 0 0 0 0 4 28:00:00 0 0 0 0 1 1 0 0 0 0 0 0 0 0 0 0 0 0 5 18:15:00 1 1 0 0 1 0 0 0 0 0 0 0 0 0 0 0 0 0 8 38:30:00 2 1 0 0 1 0 0 0 0 0 0 0 0 0 0 0 0 0 8 08:45:00 4 2 0 0 1 0 0 0 0 0 0 0 0 0 0 0 0 0 9 19:00:00 4 0 0 0 1 0 0 0 0 0 0 0 0 0 0 0 0 0 11 29:00:56 4 0 0 0 1 0 0 0 0 0 0 0 0 0 0 0 0 0 11 0
11:00:00 4 0 0 0 1 0 0 0 0 0 0 0 0 0 0 0 0 0 11 011:15:00 4 0 0 0 1 0 0 0 0 0 0 0 0 0 0 0 0 0 13 211:30:00 4 0 0 0 2 1 0 0 0 0 0 0 0 0 0 0 0 0 18 511:45:00 4 0 0 0 3 1 0 0 0 0 0 0 0 0 0 0 0 0 19 112:00:00 4 0 0 0 4 1 0 0 0 0 0 0 0 0 0 0 0 0 21 212:15:00 4 0 0 0 5 1 0 0 0 0 0 0 0 0 0 0 0 0 21 012:30:00 4 0 0 0 5 0 0 0 0 0 0 0 0 0 0 0 0 0 25 412:45:00 5 1 0 0 5 0 0 0 0 0 0 0 0 0 0 0 0 0 27 213:00:00 5 0 0 0 6 1 0 0 0 0 0 0 0 0 0 0 0 0 29 213:00:26 5 0 0 0 6 0 0 0 0 0 0 0 0 0 0 0 0 0 29 016:00:00 5 0 0 0 6 0 0 0 0 0 0 0 0 0 0 0 0 0 29 016:15:00 5 0 0 0 6 0 0 0 0 0 0 0 0 0 0 0 0 0 30 116:30:00 5 0 0 0 8 2 0 0 0 0 0 0 0 0 0 0 0 0 34 416:45:00 5 0 0 0 8 0 0 0 0 0 0 0 0 0 0 0 0 0 36 217:00:00 5 0 0 0 10 2 0 0 0 0 0 0 0 0 0 0 0 0 37 117:15:00 5 0 0 0 12 2 0 0 0 0 0 0 0 0 0 0 0 0 37 017:30:00 5 0 0 0 13 1 0 0 0 0 0 0 0 0 0 0 0 0 38 117:45:00 5 0 0 0 14 1 0 0 0 0 0 0 0 0 0 0 0 0 39 118:00:00 5 0 0 0 14 0 0 0 0 0 0 0 0 0 0 0 0 0 41 218:00:19 5 0 0 0 14 0 0 0 0 0 0 0 0 0 0 0 0 0 41 0

Ontario Traffic Inc.Count Date: 8-Feb-12 Site #: 1201700002
IntervalTime
Passenger Cars - East Approach Trucks - East Approach Cyclists - East Approach Pedestrians
Left Left LeftThru Thru ThruRight Right Right East Cross
Cum Cum Cum Cum Cum Cum Cum Cum Cum CumIncr Incr Incr Incr Incr Incr Incr Incr Incr Incr7:00:00 0 0 0 0 0 0 0 0 0 0 0 0 0 0 0 0 0 0 0 07:15:00 0 0 0 0 0 0 0 0 0 0 0 0 0 0 0 0 0 0 0 07:30:00 0 0 0 0 0 0 0 0 0 0 0 0 0 0 0 0 0 0 0 07:45:00 0 0 1 1 0 0 0 0 0 0 0 0 0 0 0 0 0 0 0 08:00:00 0 0 1 0 0 0 0 0 0 0 0 0 0 0 0 0 0 0 0 08:15:00 0 0 1 0 0 0 0 0 0 0 0 0 0 0 0 0 0 0 2 28:30:00 0 0 1 0 1 1 0 0 0 0 0 0 0 0 0 0 0 0 2 08:45:00 0 0 1 0 2 1 0 0 0 0 0 0 0 0 0 0 0 0 3 19:00:00 0 0 1 0 2 0 0 0 0 0 0 0 0 0 0 0 0 0 3 09:00:56 0 0 1 0 2 0 0 0 0 0 0 0 0 0 0 0 0 0 3 0
11:00:00 0 0 1 0 2 0 0 0 0 0 0 0 0 0 0 0 0 0 3 011:15:00 0 0 1 0 2 0 0 0 0 0 0 0 0 0 0 0 0 0 3 011:30:00 0 0 1 0 3 1 0 0 0 0 0 0 0 0 0 0 0 0 3 011:45:00 0 0 2 1 4 1 0 0 0 0 0 0 0 0 0 0 0 0 3 012:00:00 0 0 2 0 4 0 0 0 0 0 0 0 0 0 0 0 0 0 3 012:15:00 0 0 2 0 4 0 0 0 0 0 0 0 0 0 0 0 0 0 4 112:30:00 0 0 2 0 5 1 0 0 0 0 0 0 0 0 0 0 0 0 4 012:45:00 0 0 2 0 5 0 0 0 0 0 0 0 0 0 0 0 0 0 5 113:00:00 0 0 2 0 5 0 0 0 0 0 0 0 0 0 0 0 0 0 5 013:00:26 0 0 2 0 5 0 0 0 0 0 0 0 0 0 0 0 0 0 5 016:00:00 0 0 2 0 5 0 0 0 0 0 0 0 0 0 0 0 0 0 5 016:15:00 0 0 3 1 5 0 0 0 0 0 0 0 0 0 0 0 0 0 7 216:30:00 0 0 4 1 5 0 0 0 0 0 0 0 0 0 0 0 0 0 8 116:45:00 0 0 6 2 6 1 0 0 0 0 0 0 0 0 0 0 0 0 8 017:00:00 0 0 6 0 6 0 0 0 0 0 0 0 0 0 0 0 0 0 8 017:15:00 0 0 6 0 7 1 0 0 0 0 0 0 0 0 0 0 0 0 8 017:30:00 0 0 6 0 8 1 0 0 0 0 0 0 0 0 0 0 0 0 8 017:45:00 0 0 6 0 10 2 0 0 0 0 0 0 0 0 0 0 0 0 9 118:00:00 0 0 6 0 11 1 0 0 0 0 0 0 0 0 0 0 0 0 9 018:00:19 0 0 8 2 11 0 0 0 0 0 0 0 0 0 0 0 0 0 9 0
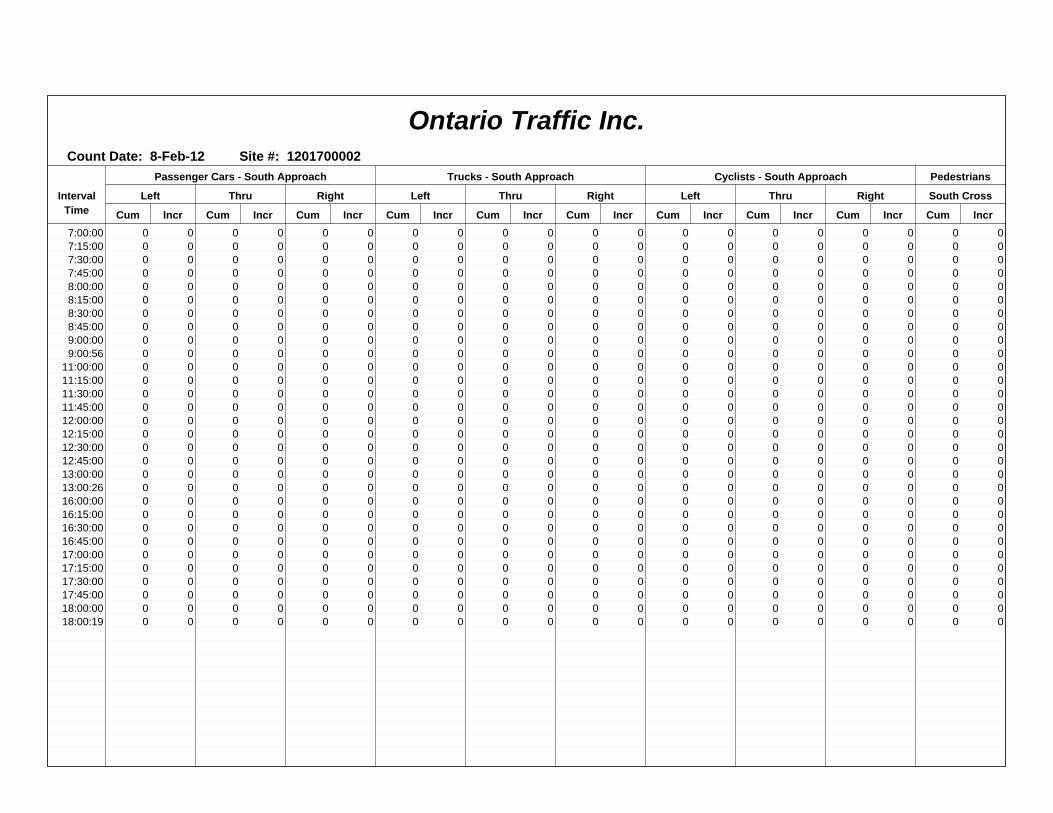
Ontario Traffic Inc.Count Date: 8-Feb-12 Site #: 1201700002
IntervalTime
Passenger Cars - South Approach Trucks - South Approach Cyclists - South Approach Pedestrians
Left Left LeftThru Thru ThruRight Right Right South Cross
Cum Cum Cum Cum Cum Cum Cum Cum Cum CumIncr Incr Incr Incr Incr Incr Incr Incr Incr Incr7:00:00 0 0 0 0 0 0 0 0 0 0 0 0 0 0 0 0 0 0 0 07:15:00 0 0 0 0 0 0 0 0 0 0 0 0 0 0 0 0 0 0 0 07:30:00 0 0 0 0 0 0 0 0 0 0 0 0 0 0 0 0 0 0 0 07:45:00 0 0 0 0 0 0 0 0 0 0 0 0 0 0 0 0 0 0 0 08:00:00 0 0 0 0 0 0 0 0 0 0 0 0 0 0 0 0 0 0 0 08:15:00 0 0 0 0 0 0 0 0 0 0 0 0 0 0 0 0 0 0 0 08:30:00 0 0 0 0 0 0 0 0 0 0 0 0 0 0 0 0 0 0 0 08:45:00 0 0 0 0 0 0 0 0 0 0 0 0 0 0 0 0 0 0 0 09:00:00 0 0 0 0 0 0 0 0 0 0 0 0 0 0 0 0 0 0 0 09:00:56 0 0 0 0 0 0 0 0 0 0 0 0 0 0 0 0 0 0 0 0
11:00:00 0 0 0 0 0 0 0 0 0 0 0 0 0 0 0 0 0 0 0 011:15:00 0 0 0 0 0 0 0 0 0 0 0 0 0 0 0 0 0 0 0 011:30:00 0 0 0 0 0 0 0 0 0 0 0 0 0 0 0 0 0 0 0 011:45:00 0 0 0 0 0 0 0 0 0 0 0 0 0 0 0 0 0 0 0 012:00:00 0 0 0 0 0 0 0 0 0 0 0 0 0 0 0 0 0 0 0 012:15:00 0 0 0 0 0 0 0 0 0 0 0 0 0 0 0 0 0 0 0 012:30:00 0 0 0 0 0 0 0 0 0 0 0 0 0 0 0 0 0 0 0 012:45:00 0 0 0 0 0 0 0 0 0 0 0 0 0 0 0 0 0 0 0 013:00:00 0 0 0 0 0 0 0 0 0 0 0 0 0 0 0 0 0 0 0 013:00:26 0 0 0 0 0 0 0 0 0 0 0 0 0 0 0 0 0 0 0 016:00:00 0 0 0 0 0 0 0 0 0 0 0 0 0 0 0 0 0 0 0 016:15:00 0 0 0 0 0 0 0 0 0 0 0 0 0 0 0 0 0 0 0 016:30:00 0 0 0 0 0 0 0 0 0 0 0 0 0 0 0 0 0 0 0 016:45:00 0 0 0 0 0 0 0 0 0 0 0 0 0 0 0 0 0 0 0 017:00:00 0 0 0 0 0 0 0 0 0 0 0 0 0 0 0 0 0 0 0 017:15:00 0 0 0 0 0 0 0 0 0 0 0 0 0 0 0 0 0 0 0 017:30:00 0 0 0 0 0 0 0 0 0 0 0 0 0 0 0 0 0 0 0 017:45:00 0 0 0 0 0 0 0 0 0 0 0 0 0 0 0 0 0 0 0 018:00:00 0 0 0 0 0 0 0 0 0 0 0 0 0 0 0 0 0 0 0 018:00:19 0 0 0 0 0 0 0 0 0 0 0 0 0 0 0 0 0 0 0 0

Ontario Traffic Inc.Count Date: 8-Feb-12 Site #: 1201700002
IntervalTime
Passenger Cars - West Approach Trucks - West Approach Cyclists - West Approach Pedestrians
Left Left LeftThru Thru ThruRight Right Right West Cross
Cum Cum Cum Cum Cum Cum Cum Cum Cum CumIncr Incr Incr Incr Incr Incr Incr Incr Incr Incr7:00:00 0 0 1 1 0 0 0 0 0 0 0 0 0 0 0 0 0 0 0 07:15:00 0 0 2 1 0 0 0 0 0 0 0 0 0 0 0 0 0 0 0 07:30:00 0 0 2 0 0 0 0 0 0 0 0 0 0 0 0 0 0 0 0 07:45:00 0 0 3 1 0 0 0 0 0 0 0 0 0 0 0 0 0 0 0 08:00:00 2 2 3 0 0 0 0 0 0 0 0 0 0 0 0 0 0 0 0 08:15:00 2 0 4 1 0 0 1 1 0 0 0 0 0 0 0 0 0 0 0 08:30:00 3 1 4 0 0 0 1 0 0 0 0 0 0 0 0 0 0 0 0 08:45:00 3 0 6 2 0 0 1 0 0 0 0 0 0 0 0 0 0 0 1 19:00:00 3 0 6 0 0 0 1 0 0 0 0 0 0 0 0 0 0 0 1 09:00:56 3 0 7 1 0 0 1 0 0 0 0 0 0 0 0 0 0 0 1 0
11:00:00 3 0 8 1 0 0 1 0 0 0 0 0 0 0 0 0 0 0 1 011:15:00 3 0 8 0 0 0 1 0 0 0 0 0 0 0 0 0 0 0 2 111:30:00 3 0 8 0 0 0 1 0 0 0 0 0 0 0 0 0 0 0 2 011:45:00 6 3 9 1 0 0 1 0 0 0 0 0 0 0 0 0 0 0 3 112:00:00 6 0 9 0 0 0 1 0 0 0 0 0 0 0 0 0 0 0 3 012:15:00 6 0 10 1 0 0 1 0 0 0 0 0 0 0 0 0 0 0 3 012:30:00 6 0 11 1 0 0 1 0 0 0 0 0 0 0 0 0 0 0 3 012:45:00 8 2 12 1 0 0 1 0 0 0 0 0 0 0 0 0 0 0 3 013:00:00 10 2 12 0 0 0 1 0 0 0 0 0 0 0 0 0 0 0 3 013:00:26 10 0 13 1 0 0 1 0 0 0 0 0 0 0 0 0 0 0 3 016:00:00 10 0 14 1 0 0 1 0 0 0 0 0 0 0 0 0 0 0 3 016:15:00 13 3 14 0 0 0 1 0 0 0 0 0 0 0 0 0 0 0 3 016:30:00 13 0 15 1 0 0 1 0 0 0 0 0 0 0 0 0 0 0 3 016:45:00 13 0 16 1 0 0 1 0 0 0 0 0 0 0 0 0 0 0 4 117:00:00 13 0 16 0 0 0 1 0 0 0 0 0 0 0 0 0 0 0 4 017:15:00 14 1 16 0 0 0 1 0 0 0 0 0 0 0 0 0 0 0 4 017:30:00 14 0 17 1 0 0 1 0 0 0 0 0 0 0 0 0 0 0 4 017:45:00 15 1 18 1 0 0 1 0 0 0 0 0 0 0 0 0 0 0 4 018:00:00 15 0 20 2 0 0 1 0 0 0 0 0 0 0 0 0 0 0 5 118:00:19 15 0 20 0 0 0 1 0 0 0 0 0 0 0 0 0 0 0 5 0

Ontario Traffic Inc.Morning Peak Diagram Specified Period
From:To:
7:00:00
9:00:00
One Hour PeakFrom:To:
8:00:00
9:00:00
Municipality:Site #:Intersection:TFR File #:Count date:
Windsor
1201700003
WYANDOTTE ST & INDIAN RD
11
8-Feb-12
Weather conditions:
Person(s) who counted:
** Non-Signalized Intersection ** Major Road: WYANDOTTE ST runs W/E
North Leg Total:
North Entering:
North Peds:
Peds Cross:
20
8
48
Cyclists
Trucks
Cars
Totals
0
0
2
2
0
0
0
0
0
0
6
6
0
0
8
Cyclists
Trucks
Cars
Totals
0
0
12
12
Cyclists Trucks Cars Totals
0 12 93 105
Cyclists Trucks Cars Totals
0 0 11 11
0 8 127 135
0 0 0 0
0 8 138
Peds Cross:
West Peds:
West Entering:
West Leg Total:
10
146
251
INDIAN RD
WYANDOTTE STW
N
E
S
WYANDOTTE ST
INDIAN RD
East Leg Total:
East Entering:
East Peds:
Peds Cross:
250
107
1
Cars Trucks Cyclists Totals
1 0 0 1
91 12 0 103
3 0 0 3
95 12 0
Cars Trucks Cyclists Totals
135 8 0 143
Cars
Trucks
Cyclists
Totals
3
0
0
3
Cars
Trucks
Cyclists
Totals
0
0
0
0
0
0
0
0
2
0
0
2
2
0
0
Peds Cross:
South Peds:
South Entering:
South Leg Total:
25
2
5
Comments

Ontario Traffic Inc.Mid-day Peak Diagram Specified Period
From:To:
11:00:00
13:00:00
One Hour PeakFrom:To:
12:00:00
13:00:00
Municipality:Site #:Intersection:TFR File #:Count date:
Windsor
1201700003
WYANDOTTE ST & INDIAN RD
11
8-Feb-12
Weather conditions:
Person(s) who counted:
** Non-Signalized Intersection ** Major Road: WYANDOTTE ST runs W/E
North Leg Total:
North Entering:
North Peds:
Peds Cross:
18
10
54
Cyclists
Trucks
Cars
Totals
0
0
4
4
0
0
2
2
0
0
4
4
0
0
10
Cyclists
Trucks
Cars
Totals
0
0
8
8
Cyclists Trucks Cars Totals
0 5 100 105
Cyclists Trucks Cars Totals
0 0 6 6
0 7 90 97
0 0 2 2
0 7 98
Peds Cross:
West Peds:
West Entering:
West Leg Total:
12
105
210
INDIAN RD
WYANDOTTE STW
N
E
S
WYANDOTTE ST
INDIAN RD
East Leg Total:
East Entering:
East Peds:
Peds Cross:
209
103
8
Cars Trucks Cyclists Totals
1 0 0 1
95 5 0 100
2 0 0 2
98 5 0
Cars Trucks Cyclists Totals
99 7 0 106
Cars
Trucks
Cyclists
Totals
6
0
0
6
Cars
Trucks
Cyclists
Totals
1
0
0
1
1
0
0
1
5
0
0
5
7
0
0
Peds Cross:
South Peds:
South Entering:
South Leg Total:
34
7
13
Comments

Ontario Traffic Inc.Afternoon Peak Diagram Specified Period
From:To:
16:00:00
18:00:00
One Hour PeakFrom:To:
16:30:00
17:30:00
Municipality:Site #:Intersection:TFR File #:Count date:
Windsor
1201700003
WYANDOTTE ST & INDIAN RD
11
8-Feb-12
Weather conditions:
Person(s) who counted:
** Non-Signalized Intersection ** Major Road: WYANDOTTE ST runs W/E
North Leg Total:
North Entering:
North Peds:
Peds Cross:
18
13
29
Cyclists
Trucks
Cars
Totals
0
0
3
3
0
0
3
3
0
0
7
7
0
0
13
Cyclists
Trucks
Cars
Totals
0
0
5
5
Cyclists Trucks Cars Totals
0 4 157 161
Cyclists Trucks Cars Totals
0 0 1 1
0 5 129 134
0 0 0 0
0 5 130
Peds Cross:
West Peds:
West Entering:
West Leg Total:
4
135
296
INDIAN RD
WYANDOTTE STW
N
E
S
WYANDOTTE ST
INDIAN RD
East Leg Total:
East Entering:
East Peds:
Peds Cross:
317
165
5
Cars Trucks Cyclists Totals
3 0 0 3
154 4 0 158
4 0 0 4
161 4 0
Cars Trucks Cyclists Totals
147 5 0 152
Cars
Trucks
Cyclists
Totals
7
0
0
7
Cars
Trucks
Cyclists
Totals
0
0
0
0
1
0
0
1
11
0
0
11
12
0
0
Peds Cross:
South Peds:
South Entering:
South Leg Total:
14
12
19
Comments

Ontario Traffic Inc.Total Count Diagram
Municipality:Site #:Intersection:TFR File #:Count date:
Windsor
1201700003
WYANDOTTE ST & INDIAN RD
11
8-Feb-12
Weather conditions:
Person(s) who counted:
** Non-Signalized Intersection ** Major Road: WYANDOTTE ST runs W/E
North Leg Total:
North Entering:
North Peds:
Peds Cross:
83
46
223
Cyclists
Trucks
Cars
Totals
0
0
12
12
0
0
6
6
0
0
28
28
0
0
46
Cyclists
Trucks
Cars
Totals
0
0
37
37
Cyclists Trucks Cars Totals
0 43 588 631
Cyclists Trucks Cars Totals
0 0 18 18
0 44 632 676
0 0 6 6
0 44 656
Peds Cross:
West Peds:
West Entering:
West Leg Total:
36
700
1331
INDIAN RD
WYANDOTTE STW
N
E
S
WYANDOTTE ST
INDIAN RD
East Leg Total:
East Entering:
East Peds:
Peds Cross:
1376
648
27
Cars Trucks Cyclists Totals
16 0 0 16
575 43 0 618
14 0 0 14
605 43 0
Cars Trucks Cyclists Totals
684 44 0 728
Cars
Trucks
Cyclists
Totals
26
0
0
26
Cars
Trucks
Cyclists
Totals
1
0
0
1
3
0
0
3
24
0
0
24
28
0
0
Peds Cross:
South Peds:
South Entering:
South Leg Total:
110
28
54
Comments

Ontario Traffic Inc.Traffic Count Summary
Intersection: WYANDOTTE ST & INDIAN RD Count Date: 8-Feb-12 Municipality: Windsor
North Approach Totals South Approach Totals
East Approach Totals West Approach Totals
Includes Cars, Trucks, & Cyclists Includes Cars, Trucks, & Cyclists
Includes Cars, Trucks, & Cyclists Includes Cars, Trucks, & Cyclists
Hour Hour
Hour Hour
Ending Ending
Ending Ending
Left Left
Left Left
Thru Thru
Thru Thru
Right Right
Right Right
Grand Grand
Grand Grand
Total Total
Total Total
Total Total
Total Total
Peds Peds
Peds Peds
North/South
East/West
Total
Total
Approaches
Approaches
Calculated Values for Traffic Crossing Major StreetHours Ending:Crossing Values:
Totals:
Totals:
7:00:00 0 0 0 0 0 0 7:00:00 0 0 0 0 08:00:00 2 0 0 2 3 2 8:00:00 0 0 0 0 19:00:00 6 0 2 8 48 10 9:00:00 0 0 2 2 25
11:00:00 0 0 0 0 0 0 11:00:00 0 0 0 0 012:00:00 1 0 2 3 56 8 12:00:00 0 0 5 5 1513:00:00 4 2 4 10 54 17 13:00:00 1 1 5 7 3416:00:00 0 0 0 0 0 0 16:00:00 0 0 0 0 017:00:00 6 3 1 10 36 17 17:00:00 0 0 7 7 1718:00:00 9 1 3 13 26 20 18:00:00 0 2 5 7 18
7:00:00 0 0 0 0 0 1 7:00:00 0 1 0 1 08:00:00 1 41 2 44 0 144 8:00:00 0 100 0 100 09:00:00 3 103 1 107 1 253 9:00:00 11 135 0 146 10
11:00:00 0 0 0 0 0 2 11:00:00 0 2 0 2 012:00:00 0 88 4 92 4 191 12:00:00 0 96 3 99 413:00:00 2 100 1 103 8 208 13:00:00 6 97 2 105 1216:00:00 0 1 0 1 0 3 16:00:00 0 2 0 2 017:00:00 2 141 2 145 4 277 17:00:00 1 131 0 132 518:00:00 6 144 5 155 10 267 18:00:00 0 111 1 112 5
8:00 9:00 11:00 12:00 13:00 16:00 17:00 18:002 17 0 9 27 0 18 26
28 6 12 46 223 74 1 3 24 28 110
14 618 15 647 27 1346 18 675 6 699 36

Ontario Traffic Inc.Count Date: 8-Feb-12 Site #: 1201700003
IntervalTime
Passenger Cars - North Approach Trucks - North Approach Cyclists - North Approach Pedestrians
Left Left LeftThru Thru ThruRight Right Right North Cross
Cum Cum Cum Cum Cum Cum Cum Cum Cum CumIncr Incr Incr Incr Incr Incr Incr Incr Incr Incr7:00:00 0 0 0 0 0 0 0 0 0 0 0 0 0 0 0 0 0 0 0 07:15:00 0 0 0 0 0 0 0 0 0 0 0 0 0 0 0 0 0 0 0 07:30:00 0 0 0 0 0 0 0 0 0 0 0 0 0 0 0 0 0 0 0 07:45:00 2 2 0 0 0 0 0 0 0 0 0 0 0 0 0 0 0 0 0 08:00:00 2 0 0 0 0 0 0 0 0 0 0 0 0 0 0 0 0 0 3 38:15:00 5 3 0 0 1 1 0 0 0 0 0 0 0 0 0 0 0 0 16 138:30:00 5 0 0 0 2 1 0 0 0 0 0 0 0 0 0 0 0 0 38 228:45:00 8 3 0 0 2 0 0 0 0 0 0 0 0 0 0 0 0 0 41 39:00:00 8 0 0 0 2 0 0 0 0 0 0 0 0 0 0 0 0 0 51 109:00:07 8 0 0 0 2 0 0 0 0 0 0 0 0 0 0 0 0 0 51 0
11:00:00 8 0 0 0 2 0 0 0 0 0 0 0 0 0 0 0 0 0 51 011:15:00 8 0 0 0 2 0 0 0 0 0 0 0 0 0 0 0 0 0 64 1311:30:00 9 1 0 0 3 1 0 0 0 0 0 0 0 0 0 0 0 0 92 2811:45:00 9 0 0 0 4 1 0 0 0 0 0 0 0 0 0 0 0 0 102 1012:00:00 9 0 0 0 4 0 0 0 0 0 0 0 0 0 0 0 0 0 107 512:15:00 11 2 1 1 4 0 0 0 0 0 0 0 0 0 0 0 0 0 112 512:30:00 13 2 1 0 5 1 0 0 0 0 0 0 0 0 0 0 0 0 118 612:45:00 13 0 1 0 7 2 0 0 0 0 0 0 0 0 0 0 0 0 132 1413:00:00 13 0 2 1 8 1 0 0 0 0 0 0 0 0 0 0 0 0 161 2913:00:19 13 0 2 0 8 0 0 0 0 0 0 0 0 0 0 0 0 0 161 016:00:00 13 0 2 0 8 0 0 0 0 0 0 0 0 0 0 0 0 0 161 016:15:00 14 1 2 0 8 0 0 0 0 0 0 0 0 0 0 0 0 0 173 1216:30:00 18 4 3 1 8 0 0 0 0 0 0 0 0 0 0 0 0 0 183 1016:45:00 19 1 5 2 9 1 0 0 0 0 0 0 0 0 0 0 0 0 190 717:00:00 19 0 5 0 9 0 0 0 0 0 0 0 0 0 0 0 0 0 197 717:15:00 22 3 6 1 9 0 0 0 0 0 0 0 0 0 0 0 0 0 202 517:30:00 25 3 6 0 11 2 0 0 0 0 0 0 0 0 0 0 0 0 212 1017:45:00 25 0 6 0 11 0 0 0 0 0 0 0 0 0 0 0 0 0 216 418:00:00 28 3 6 0 12 1 0 0 0 0 0 0 0 0 0 0 0 0 223 718:00:17 28 0 6 0 12 0 0 0 0 0 0 0 0 0 0 0 0 0 223 0

Ontario Traffic Inc.Count Date: 8-Feb-12 Site #: 1201700003
IntervalTime
Passenger Cars - East Approach Trucks - East Approach Cyclists - East Approach Pedestrians
Left Left LeftThru Thru ThruRight Right Right East Cross
Cum Cum Cum Cum Cum Cum Cum Cum Cum CumIncr Incr Incr Incr Incr Incr Incr Incr Incr Incr7:00:00 0 0 0 0 0 0 0 0 0 0 0 0 0 0 0 0 0 0 0 07:15:00 0 0 7 7 0 0 0 0 1 1 0 0 0 0 0 0 0 0 0 07:30:00 0 0 15 8 0 0 0 0 3 2 0 0 0 0 0 0 0 0 0 07:45:00 1 1 20 5 2 2 0 0 7 4 0 0 0 0 0 0 0 0 0 08:00:00 1 0 31 11 2 0 0 0 10 3 0 0 0 0 0 0 0 0 0 08:15:00 2 1 49 18 2 0 0 0 12 2 0 0 0 0 0 0 0 0 0 08:30:00 4 2 80 31 3 1 0 0 15 3 0 0 0 0 0 0 0 0 0 08:45:00 4 0 103 23 3 0 0 0 21 6 0 0 0 0 0 0 0 0 0 09:00:00 4 0 122 19 3 0 0 0 22 1 0 0 0 0 0 0 0 0 1 19:00:07 4 0 122 0 3 0 0 0 22 0 0 0 0 0 0 0 0 0 1 0
11:00:00 4 0 122 0 3 0 0 0 22 0 0 0 0 0 0 0 0 0 1 011:15:00 4 0 138 16 4 1 0 0 24 2 0 0 0 0 0 0 0 0 3 211:30:00 4 0 164 26 5 1 0 0 25 1 0 0 0 0 0 0 0 0 4 111:45:00 4 0 182 18 6 1 0 0 26 1 0 0 0 0 0 0 0 0 5 112:00:00 4 0 204 22 7 1 0 0 28 2 0 0 0 0 0 0 0 0 5 012:15:00 5 1 224 20 7 0 0 0 29 1 0 0 0 0 0 0 0 0 7 212:30:00 5 0 247 23 7 0 0 0 30 1 0 0 0 0 0 0 0 0 7 012:45:00 6 1 272 25 8 1 0 0 31 1 0 0 0 0 0 0 0 0 7 013:00:00 6 0 299 27 8 0 0 0 33 2 0 0 0 0 0 0 0 0 13 613:00:19 6 0 300 1 8 0 0 0 33 0 0 0 0 0 0 0 0 0 13 016:00:00 6 0 300 0 8 0 0 0 33 0 0 0 0 0 0 0 0 0 13 016:15:00 7 1 329 29 9 1 0 0 35 2 0 0 0 0 0 0 0 0 13 016:30:00 8 1 360 31 10 1 0 0 37 2 0 0 0 0 0 0 0 0 15 216:45:00 8 0 400 40 10 0 0 0 38 1 0 0 0 0 0 0 0 0 16 117:00:00 8 0 435 35 10 0 0 0 39 1 0 0 0 0 0 0 0 0 17 117:15:00 11 3 473 38 12 2 0 0 40 1 0 0 0 0 0 0 0 0 19 217:30:00 12 1 514 41 13 1 0 0 41 1 0 0 0 0 0 0 0 0 20 117:45:00 12 0 546 32 13 0 0 0 42 1 0 0 0 0 0 0 0 0 20 018:00:00 14 2 575 29 15 2 0 0 43 1 0 0 0 0 0 0 0 0 27 718:00:17 14 0 575 0 16 1 0 0 43 0 0 0 0 0 0 0 0 0 27 0

Ontario Traffic Inc.Count Date: 8-Feb-12 Site #: 1201700003
IntervalTime
Passenger Cars - South Approach Trucks - South Approach Cyclists - South Approach Pedestrians
Left Left LeftThru Thru ThruRight Right Right South Cross
Cum Cum Cum Cum Cum Cum Cum Cum Cum CumIncr Incr Incr Incr Incr Incr Incr Incr Incr Incr7:00:00 0 0 0 0 0 0 0 0 0 0 0 0 0 0 0 0 0 0 0 07:15:00 0 0 0 0 0 0 0 0 0 0 0 0 0 0 0 0 0 0 1 17:30:00 0 0 0 0 0 0 0 0 0 0 0 0 0 0 0 0 0 0 1 07:45:00 0 0 0 0 0 0 0 0 0 0 0 0 0 0 0 0 0 0 1 08:00:00 0 0 0 0 0 0 0 0 0 0 0 0 0 0 0 0 0 0 1 08:15:00 0 0 0 0 0 0 0 0 0 0 0 0 0 0 0 0 0 0 5 48:30:00 0 0 0 0 1 1 0 0 0 0 0 0 0 0 0 0 0 0 19 148:45:00 0 0 0 0 2 1 0 0 0 0 0 0 0 0 0 0 0 0 24 59:00:00 0 0 0 0 2 0 0 0 0 0 0 0 0 0 0 0 0 0 26 29:00:07 0 0 0 0 2 0 0 0 0 0 0 0 0 0 0 0 0 0 26 0
11:00:00 0 0 0 0 2 0 0 0 0 0 0 0 0 0 0 0 0 0 26 011:15:00 0 0 0 0 5 3 0 0 0 0 0 0 0 0 0 0 0 0 29 311:30:00 0 0 0 0 5 0 0 0 0 0 0 0 0 0 0 0 0 0 32 311:45:00 0 0 0 0 6 1 0 0 0 0 0 0 0 0 0 0 0 0 34 212:00:00 0 0 0 0 7 1 0 0 0 0 0 0 0 0 0 0 0 0 41 712:15:00 0 0 0 0 7 0 0 0 0 0 0 0 0 0 0 0 0 0 47 612:30:00 0 0 0 0 10 3 0 0 0 0 0 0 0 0 0 0 0 0 48 112:45:00 0 0 1 1 11 1 0 0 0 0 0 0 0 0 0 0 0 0 58 1013:00:00 1 1 1 0 12 1 0 0 0 0 0 0 0 0 0 0 0 0 75 1713:00:19 1 0 1 0 12 0 0 0 0 0 0 0 0 0 0 0 0 0 75 016:00:00 1 0 1 0 12 0 0 0 0 0 0 0 0 0 0 0 0 0 75 016:15:00 1 0 1 0 12 0 0 0 0 0 0 0 0 0 0 0 0 0 83 816:30:00 1 0 1 0 13 1 0 0 0 0 0 0 0 0 0 0 0 0 87 416:45:00 1 0 1 0 16 3 0 0 0 0 0 0 0 0 0 0 0 0 88 117:00:00 1 0 1 0 19 3 0 0 0 0 0 0 0 0 0 0 0 0 92 417:15:00 1 0 1 0 21 2 0 0 0 0 0 0 0 0 0 0 0 0 95 317:30:00 1 0 2 1 24 3 0 0 0 0 0 0 0 0 0 0 0 0 101 617:45:00 1 0 2 0 24 0 0 0 0 0 0 0 0 0 0 0 0 0 107 618:00:00 1 0 3 1 24 0 0 0 0 0 0 0 0 0 0 0 0 0 110 318:00:17 1 0 3 0 24 0 0 0 0 0 0 0 0 0 0 0 0 0 110 0

Ontario Traffic Inc.Count Date: 8-Feb-12 Site #: 1201700003
IntervalTime
Passenger Cars - West Approach Trucks - West Approach Cyclists - West Approach Pedestrians
Left Left LeftThru Thru ThruRight Right Right West Cross
Cum Cum Cum Cum Cum Cum Cum Cum Cum CumIncr Incr Incr Incr Incr Incr Incr Incr Incr Incr7:00:00 0 0 1 1 0 0 0 0 0 0 0 0 0 0 0 0 0 0 0 07:15:00 0 0 19 18 0 0 0 0 3 3 0 0 0 0 0 0 0 0 0 07:30:00 0 0 39 20 0 0 0 0 5 2 0 0 0 0 0 0 0 0 0 07:45:00 0 0 60 21 0 0 0 0 10 5 0 0 0 0 0 0 0 0 0 08:00:00 0 0 89 29 0 0 0 0 12 2 0 0 0 0 0 0 0 0 0 08:15:00 3 3 121 32 0 0 0 0 13 1 0 0 0 0 0 0 0 0 3 38:30:00 9 6 155 34 0 0 0 0 15 2 0 0 0 0 0 0 0 0 8 58:45:00 10 1 193 38 0 0 0 0 18 3 0 0 0 0 0 0 0 0 9 19:00:00 11 1 216 23 0 0 0 0 20 2 0 0 0 0 0 0 0 0 10 19:00:07 11 0 217 1 0 0 0 0 20 0 0 0 0 0 0 0 0 0 10 0
11:00:00 11 0 218 1 0 0 0 0 20 0 0 0 0 0 0 0 0 0 10 011:15:00 11 0 244 26 2 2 0 0 22 2 0 0 0 0 0 0 0 0 13 311:30:00 11 0 270 26 2 0 0 0 23 1 0 0 0 0 0 0 0 0 13 011:45:00 11 0 292 22 2 0 0 0 24 1 0 0 0 0 0 0 0 0 14 112:00:00 11 0 308 16 3 1 0 0 26 2 0 0 0 0 0 0 0 0 14 012:15:00 11 0 323 15 3 0 0 0 27 1 0 0 0 0 0 0 0 0 16 212:30:00 12 1 342 19 3 0 0 0 31 4 0 0 0 0 0 0 0 0 17 112:45:00 14 2 363 21 4 1 0 0 32 1 0 0 0 0 0 0 0 0 18 113:00:00 17 3 398 35 5 1 0 0 33 1 0 0 0 0 0 0 0 0 26 813:00:19 17 0 399 1 5 0 0 0 33 0 0 0 0 0 0 0 0 0 26 016:00:00 17 0 400 1 5 0 0 0 33 0 0 0 0 0 0 0 0 0 26 016:15:00 17 0 434 34 5 0 0 0 34 1 0 0 0 0 0 0 0 0 26 016:30:00 17 0 458 24 5 0 0 0 36 2 0 0 0 0 0 0 0 0 28 216:45:00 18 1 496 38 5 0 0 0 36 0 0 0 0 0 0 0 0 0 29 117:00:00 18 0 526 30 5 0 0 0 38 2 0 0 0 0 0 0 0 0 31 217:15:00 18 0 551 25 5 0 0 0 39 1 0 0 0 0 0 0 0 0 31 017:30:00 18 0 587 36 5 0 0 0 41 2 0 0 0 0 0 0 0 0 32 117:45:00 18 0 612 25 6 1 0 0 42 1 0 0 0 0 0 0 0 0 35 318:00:00 18 0 631 19 6 0 0 0 44 2 0 0 0 0 0 0 0 0 36 118:00:17 18 0 632 1 6 0 0 0 44 0 0 0 0 0 0 0 0 0 36 0

Ontario Traffic Inc.Morning Peak Diagram Specified Period
From:To:
7:00:00
9:00:00
One Hour PeakFrom:To:
7:45:00
8:45:00
Municipality:Site #:Intersection:TFR File #:Count date:
Windsor
1201700004
HURON CHURCH RD & WYANDOT
10
8-Feb-12
Weather conditions:
Person(s) who counted:
** Signalized Intersection ** Major Road: HURON CHURCH RD runs N/S
North Leg Total:
North Entering:
North Peds:
Peds Cross:
578
320
37
Cyclists
Trucks
Cars
Totals
0
4
13
17
0
5
225
230
0
2
71
73
0
11
309
Cyclists
Trucks
Cars
Totals
0
9
249
258
Cyclists Trucks Cars Totals
0 15 89 104
Cyclists Trucks Cars Totals
0 2 17 19
0 6 103 109
0 0 21 21
0 8 141
Peds Cross:
West Peds:
West Entering:
West Leg Total:
4
149
253
HURON CHURCH RD
WYANDOTTE STW
N
E
S
WYANDOTTE ST
HURON CHURCH RD
East Leg Total:
East Entering:
East Peds:
Peds Cross:
607
407
2
Cars Trucks Cyclists Totals
215 7 0 222
76 11 0 87
95 3 0 98
386 21 0
Cars Trucks Cyclists Totals
191 9 0 200
Cars
Trucks
Cyclists
Totals
341
8
0
349
Cars
Trucks
Cyclists
Totals
0
0
0
0
17
0
0
17
17
1
0
18
34
1
0
Peds Cross:
South Peds:
South Entering:
South Leg Total:
4
35
384
Comments

Ontario Traffic Inc.Mid-day Peak Diagram Specified Period
From:To:
11:00:00
13:00:00
One Hour PeakFrom:To:
12:00:00
13:00:00
Municipality:Site #:Intersection:TFR File #:Count date:
Windsor
1201700004
HURON CHURCH RD & WYANDOT
10
8-Feb-12
Weather conditions:
Person(s) who counted:
** Signalized Intersection ** Major Road: HURON CHURCH RD runs N/S
North Leg Total:
North Entering:
North Peds:
Peds Cross:
521
328
65
Cyclists
Trucks
Cars
Totals
0
0
7
7
0
4
210
214
0
3
104
107
0
7
321
Cyclists
Trucks
Cars
Totals
0
4
189
193
Cyclists Trucks Cars Totals
0 5 98 103
Cyclists Trucks Cars Totals
0 1 10 11
0 5 77 82
0 1 12 13
0 7 99
Peds Cross:
West Peds:
West Entering:
West Leg Total:
3
106
209
HURON CHURCH RD
WYANDOTTE STW
N
E
S
WYANDOTTE ST
HURON CHURCH RD
East Leg Total:
East Entering:
East Peds:
Peds Cross:
604
399
4
Cars Trucks Cyclists Totals
165 3 0 168
86 5 0 91
138 2 0 140
389 10 0
Cars Trucks Cyclists Totals
194 11 0 205
Cars
Trucks
Cyclists
Totals
360
7
0
367
Cars
Trucks
Cyclists
Totals
5
0
0
5
14
0
0
14
13
3
0
16
32
3
0
Peds Cross:
South Peds:
South Entering:
South Leg Total:
25
35
402
Comments

Ontario Traffic Inc.Afternoon Peak Diagram Specified Period
From:To:
16:00:00
18:00:00
One Hour PeakFrom:To:
16:30:00
17:30:00
Municipality:Site #:Intersection:TFR File #:Count date:
Windsor
1201700004
HURON CHURCH RD & WYANDOT
10
8-Feb-12
Weather conditions:
Person(s) who counted:
** Signalized Intersection ** Major Road: HURON CHURCH RD runs N/S
North Leg Total:
North Entering:
North Peds:
Peds Cross:
718
448
74
Cyclists
Trucks
Cars
Totals
0
0
14
14
0
1
338
339
0
0
95
95
0
1
447
Cyclists
Trucks
Cars
Totals
0
3
267
270
Cyclists Trucks Cars Totals
0 4 162 166
Cyclists Trucks Cars Totals
0 1 9 10
0 3 106 109
0 1 31 32
0 5 146
Peds Cross:
West Peds:
West Entering:
West Leg Total:
4
151
317
HURON CHURCH RD
WYANDOTTE STW
N
E
S
WYANDOTTE ST
HURON CHURCH RD
East Leg Total:
East Entering:
East Peds:
Peds Cross:
862
611
5
Cars Trucks Cyclists Totals
207 1 0 208
128 4 0 132
269 2 0 271
604 7 0
Cars Trucks Cyclists Totals
243 8 0 251
Cars
Trucks
Cyclists
Totals
638
4
0
642
Cars
Trucks
Cyclists
Totals
20
0
0
20
51
1
0
52
42
5
0
47
113
6
0
Peds Cross:
South Peds:
South Entering:
South Leg Total:
26
119
761
Comments

Ontario Traffic Inc.Total Count Diagram
Municipality:Site #:Intersection:TFR File #:Count date:
Windsor
1201700004
HURON CHURCH RD & WYANDOT
10
8-Feb-12
Weather conditions:
Person(s) who counted:
** Signalized Intersection ** Major Road: HURON CHURCH RD runs N/S
North Leg Total:
North Entering:
North Peds:
Peds Cross:
3264
1997
303
Cyclists
Trucks
Cars
Totals
0
5
57
62
0
17
1401
1418
0
16
501
517
0
38
1959
Cyclists
Trucks
Cars
Totals
0
35
1232
1267
Cyclists Trucks Cars Totals
0 44 607 651
Cyclists Trucks Cars Totals
0 10 53 63
0 31 497 528
0 3 134 137
0 44 684
Peds Cross:
West Peds:
West Entering:
West Leg Total:
24
728
1379
HURON CHURCH RD
WYANDOTTE STW
N
E
S
WYANDOTTE ST
HURON CHURCH RD
East Leg Total:
East Entering:
East Peds:
Peds Cross:
3726
2556
26
Cars Trucks Cyclists Totals
1028 22 0 1050
510 39 0 549
943 14 0 957
2481 75 0
Cars Trucks Cyclists Totals
1114 56 0 1170
Cars
Trucks
Cyclists
Totals
2478
34
0
2512
Cars
Trucks
Cyclists
Totals
40
0
0
40
151
3
0
154
116
9
0
125
307
12
0
Peds Cross:
South Peds:
South Entering:
South Leg Total:
88
319
2831
Comments

Ontario Traffic Inc.Traffic Count Summary
Intersection: HURON CHURCH RD & WYANDOCount Date: 8-Feb-12 Municipality: Windsor
North Approach Totals South Approach Totals
East Approach Totals West Approach Totals
Includes Cars, Trucks, & Cyclists Includes Cars, Trucks, & Cyclists
Includes Cars, Trucks, & Cyclists Includes Cars, Trucks, & Cyclists
Hour Hour
Hour Hour
Ending Ending
Ending Ending
Left Left
Left Left
Thru Thru
Thru Thru
Right Right
Right Right
Grand Grand
Grand Grand
Total Total
Total Total
Total Total
Total Total
Peds Peds
Peds Peds
North/South
East/West
Total
Total
Approaches
Approaches
Calculated Values for Traffic Crossing Major StreetHours Ending:Crossing Values:
Totals:
Totals:
7:00:00 0 0 0 0 0 0 7:00:00 0 0 0 0 08:00:00 66 106 3 175 7 195 8:00:00 1 11 8 20 39:00:00 77 245 18 340 34 373 9:00:00 0 14 19 33 5
11:00:00 0 1 2 3 0 3 11:00:00 0 0 0 0 012:00:00 93 200 9 302 75 332 12:00:00 1 17 12 30 1713:00:00 107 214 7 328 65 363 13:00:00 5 14 16 35 2516:00:00 0 0 0 0 0 1 16:00:00 0 1 0 1 017:00:00 82 282 15 379 57 467 17:00:00 14 45 29 88 1218:00:00 92 370 8 470 65 581 18:00:00 19 52 40 111 26
7:00:00 0 0 0 0 0 1 7:00:00 0 1 0 1 08:00:00 67 41 78 186 2 286 8:00:00 7 80 13 100 29:00:00 92 90 208 390 2 533 9:00:00 21 98 24 143 3
11:00:00 0 0 0 0 0 3 11:00:00 0 2 1 3 012:00:00 148 82 197 427 7 529 12:00:00 7 75 20 102 713:00:00 140 91 168 399 4 505 13:00:00 11 82 13 106 316:00:00 0 1 0 1 0 4 16:00:00 0 3 0 3 017:00:00 246 116 214 576 4 720 17:00:00 9 97 38 144 318:00:00 263 128 185 576 7 701 18:00:00 8 89 28 125 6
8:00 9:00 11:00 12:00 13:00 16:00 17:00 18:00164 250 2 329 332 3 440 490
517 1418 62 1997 303 2315 40 154 124 318 88
956 549 1050 2555 26 3282 63 527 137 727 24

Ontario Traffic Inc.Count Date: 8-Feb-12 Site #: 1201700004
IntervalTime
Passenger Cars - North Approach Trucks - North Approach Cyclists - North Approach Pedestrians
Left Left LeftThru Thru ThruRight Right Right North Cross
Cum Cum Cum Cum Cum Cum Cum Cum Cum CumIncr Incr Incr Incr Incr Incr Incr Incr Incr Incr7:00:00 0 0 0 0 0 0 0 0 0 0 0 0 0 0 0 0 0 0 0 07:15:00 6 6 12 12 1 1 0 0 1 1 0 0 0 0 0 0 0 0 0 07:30:00 19 13 34 22 1 0 1 1 1 0 0 0 0 0 0 0 0 0 1 17:45:00 41 22 69 35 2 1 4 3 1 0 0 0 0 0 0 0 0 0 2 18:00:00 61 20 105 36 3 1 5 1 1 0 0 0 0 0 0 0 0 0 7 58:15:00 77 16 157 52 3 0 5 0 1 0 0 0 0 0 0 0 0 0 12 58:30:00 95 18 211 54 9 6 6 1 3 2 0 0 0 0 0 0 0 0 33 218:45:00 112 17 294 83 15 6 6 0 6 3 4 4 0 0 0 0 0 0 39 69:00:00 136 24 343 49 17 2 7 1 8 2 4 0 0 0 0 0 0 0 41 29:00:50 136 0 344 1 19 2 7 0 8 0 4 0 0 0 0 0 0 0 41 0
11:00:00 136 0 344 0 19 0 7 0 8 0 4 0 0 0 0 0 0 0 41 011:15:00 160 24 388 44 20 1 7 0 10 2 4 0 0 0 0 0 0 0 59 1811:30:00 181 21 460 72 26 6 10 3 11 1 4 0 0 0 0 0 0 0 90 3111:45:00 198 17 497 37 26 0 11 1 11 0 4 0 0 0 0 0 0 0 107 1712:00:00 225 27 540 43 27 1 11 0 12 1 5 1 0 0 0 0 0 0 116 912:15:00 246 21 589 49 28 1 13 2 12 0 5 0 0 0 0 0 0 0 127 1112:30:00 279 33 642 53 30 2 13 0 14 2 5 0 0 0 0 0 0 0 144 1712:45:00 297 18 695 53 31 1 13 0 15 1 5 0 0 0 0 0 0 0 161 1713:00:00 329 32 750 55 34 3 14 1 16 1 5 0 0 0 0 0 0 0 181 2013:00:19 329 0 750 0 34 0 14 0 16 0 5 0 0 0 0 0 0 0 181 016:00:00 329 0 750 0 34 0 14 0 16 0 5 0 0 0 0 0 0 0 181 016:15:00 352 23 831 81 39 5 16 2 16 0 5 0 0 0 0 0 0 0 191 1016:30:00 368 16 887 56 43 4 16 0 16 0 5 0 0 0 0 0 0 0 204 1316:45:00 388 20 966 79 46 3 16 0 16 0 5 0 0 0 0 0 0 0 223 1917:00:00 409 21 1031 65 49 3 16 0 17 1 5 0 0 0 0 0 0 0 238 1517:15:00 431 22 1118 87 53 4 16 0 17 0 5 0 0 0 0 0 0 0 252 1417:30:00 463 32 1225 107 57 4 16 0 17 0 5 0 0 0 0 0 0 0 278 2617:45:00 487 24 1319 94 57 0 16 0 17 0 5 0 0 0 0 0 0 0 292 1418:00:00 501 14 1401 82 57 0 16 0 17 0 5 0 0 0 0 0 0 0 303 1118:00:11 501 0 1401 0 57 0 16 0 17 0 5 0 0 0 0 0 0 0 303 0
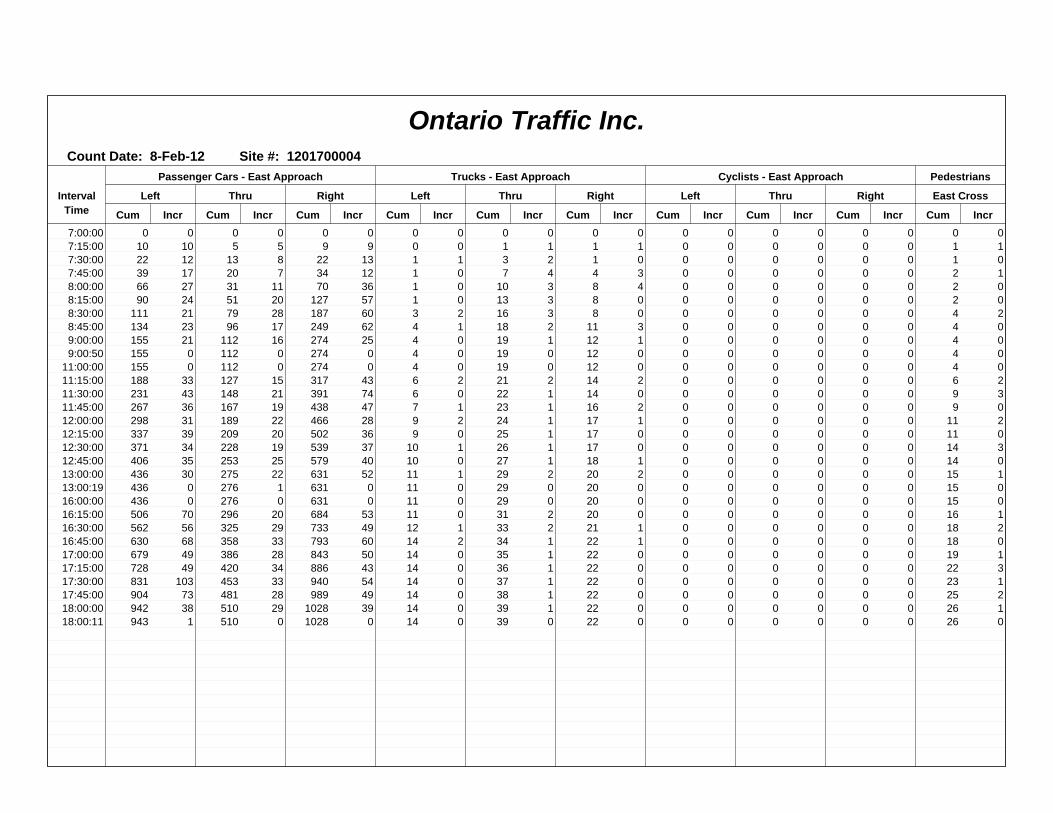
Ontario Traffic Inc.Count Date: 8-Feb-12 Site #: 1201700004
IntervalTime
Passenger Cars - East Approach Trucks - East Approach Cyclists - East Approach Pedestrians
Left Left LeftThru Thru ThruRight Right Right East Cross
Cum Cum Cum Cum Cum Cum Cum Cum Cum CumIncr Incr Incr Incr Incr Incr Incr Incr Incr Incr7:00:00 0 0 0 0 0 0 0 0 0 0 0 0 0 0 0 0 0 0 0 07:15:00 10 10 5 5 9 9 0 0 1 1 1 1 0 0 0 0 0 0 1 17:30:00 22 12 13 8 22 13 1 1 3 2 1 0 0 0 0 0 0 0 1 07:45:00 39 17 20 7 34 12 1 0 7 4 4 3 0 0 0 0 0 0 2 18:00:00 66 27 31 11 70 36 1 0 10 3 8 4 0 0 0 0 0 0 2 08:15:00 90 24 51 20 127 57 1 0 13 3 8 0 0 0 0 0 0 0 2 08:30:00 111 21 79 28 187 60 3 2 16 3 8 0 0 0 0 0 0 0 4 28:45:00 134 23 96 17 249 62 4 1 18 2 11 3 0 0 0 0 0 0 4 09:00:00 155 21 112 16 274 25 4 0 19 1 12 1 0 0 0 0 0 0 4 09:00:50 155 0 112 0 274 0 4 0 19 0 12 0 0 0 0 0 0 0 4 0
11:00:00 155 0 112 0 274 0 4 0 19 0 12 0 0 0 0 0 0 0 4 011:15:00 188 33 127 15 317 43 6 2 21 2 14 2 0 0 0 0 0 0 6 211:30:00 231 43 148 21 391 74 6 0 22 1 14 0 0 0 0 0 0 0 9 311:45:00 267 36 167 19 438 47 7 1 23 1 16 2 0 0 0 0 0 0 9 012:00:00 298 31 189 22 466 28 9 2 24 1 17 1 0 0 0 0 0 0 11 212:15:00 337 39 209 20 502 36 9 0 25 1 17 0 0 0 0 0 0 0 11 012:30:00 371 34 228 19 539 37 10 1 26 1 17 0 0 0 0 0 0 0 14 312:45:00 406 35 253 25 579 40 10 0 27 1 18 1 0 0 0 0 0 0 14 013:00:00 436 30 275 22 631 52 11 1 29 2 20 2 0 0 0 0 0 0 15 113:00:19 436 0 276 1 631 0 11 0 29 0 20 0 0 0 0 0 0 0 15 016:00:00 436 0 276 0 631 0 11 0 29 0 20 0 0 0 0 0 0 0 15 016:15:00 506 70 296 20 684 53 11 0 31 2 20 0 0 0 0 0 0 0 16 116:30:00 562 56 325 29 733 49 12 1 33 2 21 1 0 0 0 0 0 0 18 216:45:00 630 68 358 33 793 60 14 2 34 1 22 1 0 0 0 0 0 0 18 017:00:00 679 49 386 28 843 50 14 0 35 1 22 0 0 0 0 0 0 0 19 117:15:00 728 49 420 34 886 43 14 0 36 1 22 0 0 0 0 0 0 0 22 317:30:00 831 103 453 33 940 54 14 0 37 1 22 0 0 0 0 0 0 0 23 117:45:00 904 73 481 28 989 49 14 0 38 1 22 0 0 0 0 0 0 0 25 218:00:00 942 38 510 29 1028 39 14 0 39 1 22 0 0 0 0 0 0 0 26 118:00:11 943 1 510 0 1028 0 14 0 39 0 22 0 0 0 0 0 0 0 26 0

Ontario Traffic Inc.Count Date: 8-Feb-12 Site #: 1201700004
IntervalTime
Passenger Cars - South Approach Trucks - South Approach Cyclists - South Approach Pedestrians
Left Left LeftThru Thru ThruRight Right Right South Cross
Cum Cum Cum Cum Cum Cum Cum Cum Cum CumIncr Incr Incr Incr Incr Incr Incr Incr Incr Incr7:00:00 0 0 0 0 0 0 0 0 0 0 0 0 0 0 0 0 0 0 0 07:15:00 1 1 2 2 0 0 0 0 1 1 0 0 0 0 0 0 0 0 1 17:30:00 1 0 2 0 4 4 0 0 1 0 0 0 0 0 0 0 0 0 2 17:45:00 1 0 4 2 6 2 0 0 1 0 0 0 0 0 0 0 0 0 3 18:00:00 1 0 10 6 8 2 0 0 1 0 0 0 0 0 0 0 0 0 3 08:15:00 1 0 11 1 12 4 0 0 1 0 0 0 0 0 0 0 0 0 3 08:30:00 1 0 13 2 18 6 0 0 1 0 1 1 0 0 0 0 0 0 6 38:45:00 1 0 21 8 23 5 0 0 1 0 1 0 0 0 0 0 0 0 7 19:00:00 1 0 24 3 26 3 0 0 1 0 1 0 0 0 0 0 0 0 8 19:00:50 1 0 24 0 26 0 0 0 1 0 1 0 0 0 0 0 0 0 8 0
11:00:00 1 0 24 0 26 0 0 0 1 0 1 0 0 0 0 0 0 0 8 011:15:00 2 1 27 3 27 1 0 0 1 0 1 0 0 0 0 0 0 0 14 611:30:00 2 0 33 6 31 4 0 0 2 1 1 0 0 0 0 0 0 0 18 411:45:00 2 0 34 1 33 2 0 0 2 0 1 0 0 0 0 0 0 0 21 312:00:00 2 0 40 6 38 5 0 0 2 0 1 0 0 0 0 0 0 0 25 412:15:00 2 0 41 1 41 3 0 0 2 0 2 1 0 0 0 0 0 0 28 312:30:00 4 2 47 6 44 3 0 0 2 0 2 0 0 0 0 0 0 0 35 712:45:00 4 0 50 3 49 5 0 0 2 0 2 0 0 0 0 0 0 0 41 613:00:00 7 3 54 4 51 2 0 0 2 0 4 2 0 0 0 0 0 0 50 913:00:19 7 0 54 0 51 0 0 0 2 0 4 0 0 0 0 0 0 0 50 016:00:00 7 0 55 1 51 0 0 0 2 0 4 0 0 0 0 0 0 0 50 016:15:00 13 6 63 8 54 3 0 0 2 0 4 0 0 0 0 0 0 0 50 016:30:00 13 0 72 9 60 6 0 0 2 0 4 0 0 0 0 0 0 0 51 116:45:00 17 4 84 12 70 10 0 0 2 0 5 1 0 0 0 0 0 0 56 517:00:00 21 4 100 16 79 9 0 0 2 0 5 0 0 0 0 0 0 0 62 617:15:00 27 6 109 9 91 12 0 0 3 1 5 0 0 0 0 0 0 0 68 617:30:00 33 6 123 14 102 11 0 0 3 0 9 4 0 0 0 0 0 0 77 917:45:00 37 4 135 12 107 5 0 0 3 0 9 0 0 0 0 0 0 0 86 918:00:00 40 3 151 16 115 8 0 0 3 0 9 0 0 0 0 0 0 0 88 218:00:11 40 0 151 0 116 1 0 0 3 0 9 0 0 0 0 0 0 0 88 0

Ontario Traffic Inc.Count Date: 8-Feb-12 Site #: 1201700004
IntervalTime
Passenger Cars - West Approach Trucks - West Approach Cyclists - West Approach Pedestrians
Left Left LeftThru Thru ThruRight Right Right West Cross
Cum Cum Cum Cum Cum Cum Cum Cum Cum CumIncr Incr Incr Incr Incr Incr Incr Incr Incr Incr7:00:00 0 0 1 1 0 0 0 0 0 0 0 0 0 0 0 0 0 0 0 07:15:00 0 0 18 17 0 0 1 1 2 2 0 0 0 0 0 0 0 0 0 07:30:00 1 1 32 14 5 5 2 1 3 1 0 0 0 0 0 0 0 0 0 07:45:00 3 2 47 15 10 5 3 1 7 4 0 0 0 0 0 0 0 0 0 08:00:00 4 1 72 25 13 3 3 0 9 2 0 0 0 0 0 0 0 0 2 28:15:00 7 3 101 29 16 3 3 0 10 1 0 0 0 0 0 0 0 0 2 08:30:00 14 7 121 20 24 8 4 1 11 1 0 0 0 0 0 0 0 0 4 28:45:00 20 6 150 29 31 7 5 1 13 2 0 0 0 0 0 0 0 0 4 09:00:00 23 3 165 15 36 5 5 0 14 1 1 1 0 0 0 0 0 0 5 19:00:50 23 0 166 1 37 1 5 0 14 0 1 0 0 0 0 0 0 0 5 0
11:00:00 23 0 167 1 37 0 5 0 14 0 1 0 0 0 0 0 0 0 5 011:15:00 26 3 187 20 43 6 6 1 15 1 1 0 0 0 0 0 0 0 7 211:30:00 28 2 205 18 49 6 6 0 16 1 1 0 0 0 0 0 0 0 8 111:45:00 28 0 224 19 54 5 7 1 16 0 1 0 0 0 0 0 0 0 11 312:00:00 28 0 238 14 57 3 7 0 18 2 1 0 0 0 0 0 0 0 12 112:15:00 30 2 249 11 61 4 7 0 18 0 2 1 0 0 0 0 0 0 14 212:30:00 31 1 270 21 63 2 8 1 21 3 2 0 0 0 0 0 0 0 14 012:45:00 35 4 285 15 66 3 8 0 22 1 2 0 0 0 0 0 0 0 14 013:00:00 38 3 315 30 69 3 8 0 23 1 2 0 0 0 0 0 0 0 15 113:00:19 38 0 318 3 69 0 8 0 23 0 2 0 0 0 0 0 0 0 15 016:00:00 38 0 318 0 69 0 8 0 23 0 2 0 0 0 0 0 0 0 15 016:15:00 38 0 342 24 80 11 8 0 24 1 2 0 0 0 0 0 0 0 15 016:30:00 40 2 360 18 89 9 9 1 25 1 2 0 0 0 0 0 0 0 17 216:45:00 42 2 390 30 99 10 9 0 25 0 2 0 0 0 0 0 0 0 18 117:00:00 46 4 412 22 106 7 9 0 26 1 3 1 0 0 0 0 0 0 18 017:15:00 46 0 434 22 114 8 10 1 26 0 3 0 0 0 0 0 0 0 18 017:30:00 49 3 466 32 120 6 10 0 28 2 3 0 0 0 0 0 0 0 21 317:45:00 50 1 481 15 129 9 10 0 29 1 3 0 0 0 0 0 0 0 24 318:00:00 53 3 496 15 134 5 10 0 31 2 3 0 0 0 0 0 0 0 24 018:00:11 53 0 497 1 134 0 10 0 31 0 3 0 0 0 0 0 0 0 24 0

APPENDIX B
TRAFFIC REDISTRIBUTION

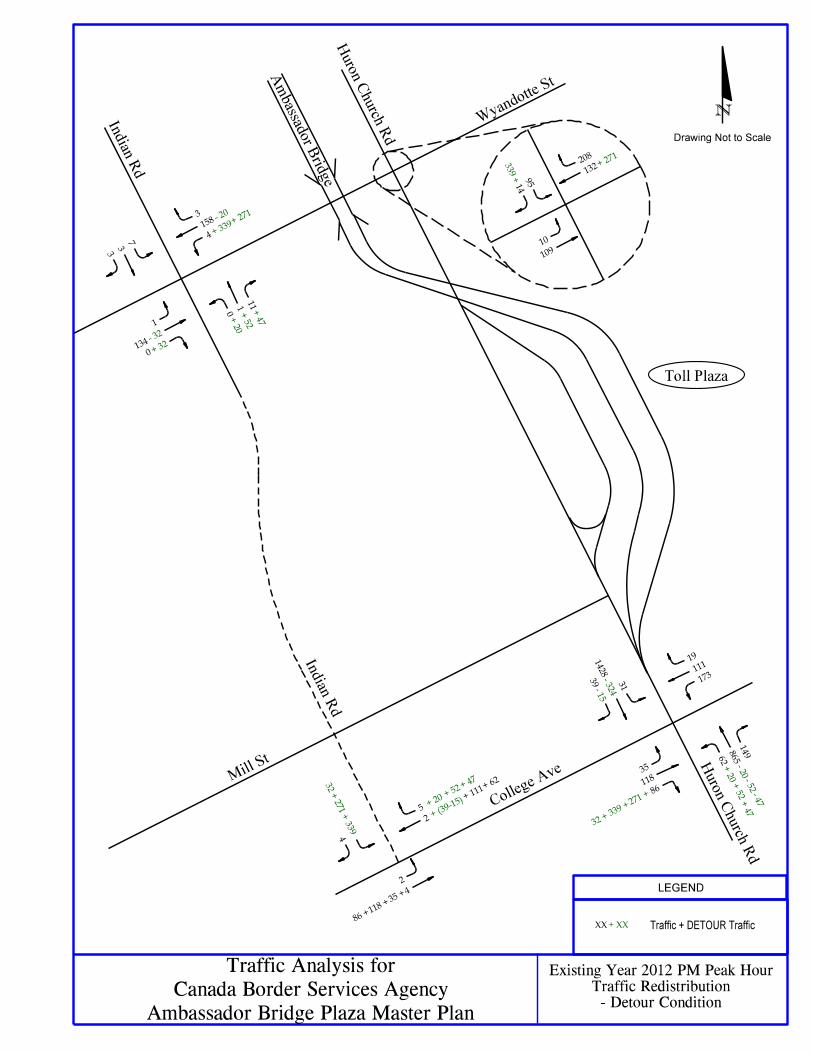

APPENDIX C
TRAFFIC ANALYSIS

APPENDIX C1
2012 EXISTING ANALYSIS

HCS+: Unsignalized Intersections Release 5.6 _______________________TWO-WAY STOP CONTROL SUMMARY___________________________ Analyst: AG Agency/Co.: American Date Performed: 3/2/2012 Analysis Time Period: AM Peak Intersection: Indian Road @ Mill Street Jurisdiction: Units: U. S. Customary Analysis Year: Existing Year 2012 Project ID: East/West Street: Mill Street North/South Street: Indian Road Intersection Orientation: EW Study period (hrs): 0.25 ______________________Vehicle Volumes and Adjustments_________________________ Major Street: Approach Eastbound Westbound Movement 1 2 3 | 4 5 6 L T R | L T R ______________________________________________________________________________ Volume 4 3 0 2 Peak-Hour Factor, PHF 0.95 0.95 0.95 0.95 Hourly Flow Rate, HFR 4 3 0 2 Percent Heavy Vehicles 14 -- -- -- -- Median Type/Storage Undivided / RT Channelized? Lanes 0 1 1 0 Configuration LT TR Upstream Signal? No No ______________________________________________________________________________ Minor Street: Approach Northbound Southbound Movement 7 8 9 | 10 11 12 L T R | L T R ______________________________________________________________________________ Volume 4 1 Peak Hour Factor, PHF 0.95 0.95 Hourly Flow Rate, HFR 4 1 Percent Heavy Vehicles 0 0 Percent Grade (%) 0 0 Flared Approach: Exists?/Storage / No / Lanes 0 0 Configuration LR ______________________________________________________________________________ __________________Delay, Queue Length, and Level of Service___________________ Approach EB WB Northbound Southbound Movement 1 4 | 7 8 9 | 10 11 12 Lane Config LT | | LR ______________________________________________________________________________ v (vph) 4 5 C(m) (vph) 1545 1025 v/c 0.00 0.00 95% queue length 0.01 0.01 Control Delay 7.3 8.5 LOS A A Approach Delay 8.5 Approach LOS A ______________________________________________________________________________

HCS+: Unsignalized Intersections Release 5.6 _______________________TWO-WAY STOP CONTROL SUMMARY___________________________ Analyst: AG Agency/Co.: American Date Performed: 3/2/2012 Analysis Time Period: PM Peak Intersection: Indian Road @ Mill Street Jurisdiction: Units: U. S. Customary Analysis Year: Existing Year 2012 Project ID: East/West Street: Mill Street North/South Street: Indian Road Intersection Orientation: EW Study period (hrs): 0.25 ______________________Vehicle Volumes and Adjustments_________________________ Major Street: Approach Eastbound Westbound Movement 1 2 3 | 4 5 6 L T R | L T R ______________________________________________________________________________ Volume 2 4 2 5 Peak-Hour Factor, PHF 0.95 0.95 0.95 0.95 Hourly Flow Rate, HFR 2 4 2 5 Percent Heavy Vehicles 0 -- -- -- -- Median Type/Storage Undivided / RT Channelized? Lanes 0 1 1 0 Configuration LT TR Upstream Signal? No No ______________________________________________________________________________ Minor Street: Approach Northbound Southbound Movement 7 8 9 | 10 11 12 L T R | L T R ______________________________________________________________________________ Volume 0 4 Peak Hour Factor, PHF 0.95 0.95 Hourly Flow Rate, HFR 0 4 Percent Heavy Vehicles 0 0 Percent Grade (%) 0 0 Flared Approach: Exists?/Storage / No / Lanes 0 0 Configuration LR ______________________________________________________________________________ __________________Delay, Queue Length, and Level of Service___________________ Approach EB WB Northbound Southbound Movement 1 4 | 7 8 9 | 10 11 12 Lane Config LT | | LR ______________________________________________________________________________ v (vph) 2 4 C(m) (vph) 1627 1085 v/c 0.00 0.00 95% queue length 0.00 0.01 Control Delay 7.2 8.3 LOS A A Approach Delay 8.3 Approach LOS A ______________________________________________________________________________
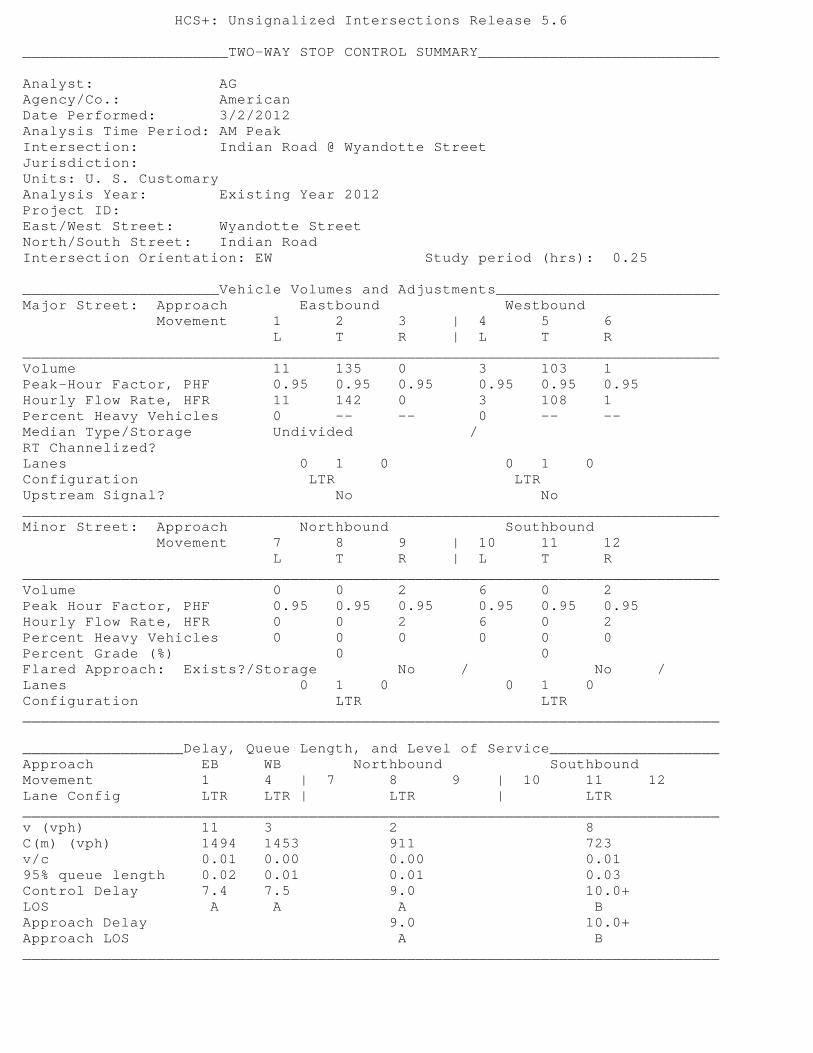
HCS+: Unsignalized Intersections Release 5.6 _______________________TWO-WAY STOP CONTROL SUMMARY___________________________ Analyst: AG Agency/Co.: American Date Performed: 3/2/2012 Analysis Time Period: AM Peak Intersection: Indian Road @ Wyandotte Street Jurisdiction: Units: U. S. Customary Analysis Year: Existing Year 2012 Project ID: East/West Street: Wyandotte Street North/South Street: Indian Road Intersection Orientation: EW Study period (hrs): 0.25 ______________________Vehicle Volumes and Adjustments_________________________ Major Street: Approach Eastbound Westbound Movement 1 2 3 | 4 5 6 L T R | L T R ______________________________________________________________________________ Volume 11 135 0 3 103 1 Peak-Hour Factor, PHF 0.95 0.95 0.95 0.95 0.95 0.95 Hourly Flow Rate, HFR 11 142 0 3 108 1 Percent Heavy Vehicles 0 -- -- 0 -- -- Median Type/Storage Undivided / RT Channelized? Lanes 0 1 0 0 1 0 Configuration LTR LTR Upstream Signal? No No ______________________________________________________________________________ Minor Street: Approach Northbound Southbound Movement 7 8 9 | 10 11 12 L T R | L T R ______________________________________________________________________________ Volume 0 0 2 6 0 2 Peak Hour Factor, PHF 0.95 0.95 0.95 0.95 0.95 0.95 Hourly Flow Rate, HFR 0 0 2 6 0 2 Percent Heavy Vehicles 0 0 0 0 0 0 Percent Grade (%) 0 0 Flared Approach: Exists?/Storage No / No / Lanes 0 1 0 0 1 0 Configuration LTR LTR ______________________________________________________________________________ __________________Delay, Queue Length, and Level of Service___________________ Approach EB WB Northbound Southbound Movement 1 4 | 7 8 9 | 10 11 12 Lane Config LTR LTR | LTR | LTR ______________________________________________________________________________ v (vph) 11 3 2 8 C(m) (vph) 1494 1453 911 723 v/c 0.01 0.00 0.00 0.01 95% queue length 0.02 0.01 0.01 0.03 Control Delay 7.4 7.5 9.0 10.0+ LOS A A A B Approach Delay 9.0 10.0+ Approach LOS A B ______________________________________________________________________________

HCS+: Unsignalized Intersections Release 5.6 _______________________TWO-WAY STOP CONTROL SUMMARY___________________________ Analyst: AG Agency/Co.: American Date Performed: 3/2/2012 Analysis Time Period: PM Peak Intersection: Indian Road @ Wyandotte Street Jurisdiction: Units: U. S. Customary Analysis Year: Existing Year 2012 Project ID: East/West Street: Wyandotte Street North/South Street: Indian Road Intersection Orientation: EW Study period (hrs): 0.25 ______________________Vehicle Volumes and Adjustments_________________________ Major Street: Approach Eastbound Westbound Movement 1 2 3 | 4 5 6 L T R | L T R ______________________________________________________________________________ Volume 1 134 0 4 158 3 Peak-Hour Factor, PHF 0.95 0.95 0.95 0.95 0.95 0.95 Hourly Flow Rate, HFR 1 141 0 4 166 3 Percent Heavy Vehicles 0 -- -- 0 -- -- Median Type/Storage Undivided / RT Channelized? Lanes 0 1 0 0 1 0 Configuration LTR LTR Upstream Signal? No No ______________________________________________________________________________ Minor Street: Approach Northbound Southbound Movement 7 8 9 | 10 11 12 L T R | L T R ______________________________________________________________________________ Volume 0 1 11 7 3 3 Peak Hour Factor, PHF 0.95 0.95 0.95 0.95 0.95 0.95 Hourly Flow Rate, HFR 0 1 11 7 3 3 Percent Heavy Vehicles 0 0 0 0 0 0 Percent Grade (%) 0 0 Flared Approach: Exists?/Storage No / No / Lanes 0 1 0 0 1 0 Configuration LTR LTR ______________________________________________________________________________ __________________Delay, Queue Length, and Level of Service___________________ Approach EB WB Northbound Southbound Movement 1 4 | 7 8 9 | 10 11 12 Lane Config LTR LTR | LTR | LTR ______________________________________________________________________________ v (vph) 1 4 12 13 C(m) (vph) 1421 1455 874 661 v/c 0.00 0.00 0.01 0.02 95% queue length 0.00 0.01 0.04 0.06 Control Delay 7.5 7.5 9.2 10.6 LOS A A A B Approach Delay 9.2 10.6 Approach LOS A B ______________________________________________________________________________

HCS+: Signalized Intersections Release 5.4 Analyst: AG Inter.: Huron Church Rd @ College Ave Agency: American Area Type: All other areas Date: 3/2/2012 Jurisd: Period: AM Peak Year : 2012 Existing Project ID: E/W St: College Avenue N/S St: Huron Church Road _________________________SIGNALIZED INTERSECTION SUMMARY_______________________ | Eastbound | Westbound | Northbound | Southbound | | L T R | L T R | L T R | L T R | |_______________|_______________|_______________|_______________| No. Lanes | 1 2 0 | 1 1 1 | 1 4 0 | 1 4 0 | LGConfig | L TR | L T R | L TR | L TR | Volume |79 122 89 |82 74 26 |101 1456 191 |15 582 35 | Lane Width |12.0 12.0 |12.0 12.0 12.0 |12.0 12.0 |12.0 12.0 | RTOR Vol | 0 | 0 | 0 | 0 | _______________________________________________________________________________Duration 0.25 Area Type: All other areas ______________________________Signal Operations________________________________Phase Combination 1 2 3 4 | 5 6 7 8 EB Left A | NB Left A A Thru A | Thru A A Right A | Right A A Peds | Peds WB Left A | SB Left A Thru A | Thru A Right A | Right A Peds | Peds NB Right | EB Right SB Right | WB Right Green 21.0 10.0 5.0 32.0 Yellow 4.0 4.0 4.0 4.0 All Red 2.0 0.0 2.0 2.0 Cycle Length: 90.0 secs ____________________Intersection Performance Summary___________________________Appr/ Lane Adj Sat Ratios Lane Group Approach Lane Group Flow Rate __________ __________ ___________ Grp Capacity (s) v/c g/C Delay LOS Delay LOS _______________________________________________________________________________Eastbound L 304 1303 0.27 0.23 28.7 C TR 759 3253 0.29 0.23 28.6 C 28.6 C Westbound L 245 1050 0.35 0.23 29.7 C T 414 1776 0.19 0.23 27.9 C 28.6 C R 317 1357 0.09 0.23 27.1 C Northbound L 366 1736 0.29 0.21 30.3 C TR 2808 5877 0.62 0.48 17.8 B 18.5 B Southbound L 167 1504 0.10 0.11 36.2 D TR 1829 5144 0.36 0.36 21.5 C 21.9 C Intersection Delay = 20.9 (sec/veh) Intersection LOS = C _______________________________________________________________________________

HCS+: Signalized Intersections Release 5.4 Analyst: AG Inter.: Huron Church Rd @ College Ave Agency: American Area Type: All other areas Date: 3/2/2012 Jurisd: Period: PM Peak Year : 2012 Existing Project ID: E/W St: College Avenue N/S St: Huron Church Road _________________________SIGNALIZED INTERSECTION SUMMARY_______________________ | Eastbound | Westbound | Northbound | Southbound | | L T R | L T R | L T R | L T R | |_______________|_______________|_______________|_______________| No. Lanes | 1 2 0 | 1 1 1 | 1 4 0 | 1 4 0 | LGConfig | L TR | L T R | L TR | L TR | Volume |35 118 86 |173 111 19 |62 865 149 |31 1428 39 | Lane Width |12.0 12.0 |12.0 12.0 12.0 |12.0 12.0 |12.0 12.0 | RTOR Vol | 0 | 0 | 0 | 0 | _______________________________________________________________________________Duration 0.25 Area Type: All other areas ______________________________Signal Operations________________________________Phase Combination 1 2 3 4 | 5 6 7 8 EB Left A | NB Left A Thru A | Thru A Right A | Right A Peds | Peds WB Left A | SB Left A A Thru A | Thru A A Right A | Right A A Peds | Peds NB Right | EB Right SB Right | WB Right Green 21.0 10.0 5.0 32.0 Yellow 4.0 4.0 4.0 4.0 All Red 2.0 0.0 2.0 2.0 Cycle Length: 90.0 secs ____________________Intersection Performance Summary___________________________Appr/ Lane Adj Sat Ratios Lane Group Approach Lane Group Flow Rate __________ __________ ___________ Grp Capacity (s) v/c g/C Delay LOS Delay LOS _______________________________________________________________________________Eastbound L 302 1295 0.12 0.23 27.4 C TR 791 3388 0.27 0.23 28.4 C 28.3 C Westbound L 268 1150 0.68 0.23 38.2 D T 439 1881 0.27 0.23 28.5 C 33.9 C R 359 1538 0.06 0.23 26.9 C Northbound L 201 1805 0.32 0.11 37.8 D TR 1779 5004 0.60 0.36 24.3 C 25.1 C Southbound L 360 1703 0.09 0.21 28.7 C TR 2705 5661 0.57 0.48 17.2 B 17.4 B Intersection Delay = 22.5 (sec/veh) Intersection LOS = C _______________________________________________________________________________

HCS+: Signalized Intersections Release 5.4 Analyst: AG Inter.: Wyandotte St @ Huron Church Rd Agency: American Area Type: All other areas Date: 3/2/2012 Jurisd: Period: AM Peak Year : 2012 Existing Project ID: E/W St: Wyandotte Street N/S St: Huron Church Road _________________________SIGNALIZED INTERSECTION SUMMARY_______________________ | Eastbound | Westbound | Northbound | Southbound | | L T R | L T R | L T R | L T R | |_______________|_______________|_______________|_______________| No. Lanes | 0 1 0 | 0 2 0 | 0 2 0 | 1 1 0 | LGConfig | LTR | LTR | LTR | L TR | Volume |19 109 21 |98 87 222 |0 17 18 |73 230 17 | Lane Width | 12.0 | 12.0 | 12.0 |12.0 12.0 | RTOR Vol | 0 | 0 | 0 | 0 | _______________________________________________________________________________Duration 0.25 Area Type: All other areas ______________________________Signal Operations________________________________Phase Combination 1 2 3 4 | 5 6 7 8 EB Left A | NB Left A Thru A | Thru A Right A | Right A Peds | Peds WB Left A | SB Left A Thru A | Thru A Right A | Right A Peds | Peds NB Right | EB Right SB Right | WB Right Green 25.0 43.0 Yellow 4.0 4.0 All Red 2.0 2.0 Cycle Length: 80.0 secs ____________________Intersection Performance Summary___________________________Appr/ Lane Adj Sat Ratios Lane Group Approach Lane Group Flow Rate __________ __________ ___________ Grp Capacity (s) v/c g/C Delay LOS Delay LOS _______________________________________________________________________________Eastbound LTR 505 1616 0.31 0.31 21.3 C 21.3 C Westbound LTR 882 2822 0.49 0.31 22.7 C 22.7 C Northbound LTR 1741 3239 0.02 0.54 8.7 A 8.7 A Southbound L 726 1350 0.11 0.54 9.1 A TR 976 1816 0.27 0.54 10.1 B 9.9 A Intersection Delay = 17.4 (sec/veh) Intersection LOS = B _______________________________________________________________________________

HCS+: Signalized Intersections Release 5.4 Analyst: AG Inter.: Wyandotte St @ Huron Church Rd Agency: American Area Type: All other areas Date: 3/2/2012 Jurisd: Period: PM Peak Year : 2012 Existing Project ID: E/W St: Wyandotte Street N/S St: Huron Church Road _________________________SIGNALIZED INTERSECTION SUMMARY_______________________ | Eastbound | Westbound | Northbound | Southbound | | L T R | L T R | L T R | L T R | |_______________|_______________|_______________|_______________| No. Lanes | 0 1 0 | 0 2 0 | 0 2 0 | 1 1 0 | LGConfig | LTR | DefL TR | LTR | L TR | Volume |10 109 32 |271 132 208 |20 52 47 |95 339 14 | Lane Width | 12.0 |12.0 12.0 | 12.0 |12.0 12.0 | RTOR Vol | 0 | 0 | 0 | 0 | _______________________________________________________________________________Duration 0.25 Area Type: All other areas ______________________________Signal Operations________________________________Phase Combination 1 2 3 4 | 5 6 7 8 EB Left A | NB Left A Thru A | Thru A Right A | Right A Peds | Peds WB Left A | SB Left A Thru A | Thru A Right A | Right A Peds | Peds NB Right | EB Right SB Right | WB Right Green 25.0 43.0 Yellow 4.0 4.0 All Red 2.0 2.0 Cycle Length: 80.0 secs ____________________Intersection Performance Summary___________________________Appr/ Lane Adj Sat Ratios Lane Group Approach Lane Group Flow Rate __________ __________ ___________ Grp Capacity (s) v/c g/C Delay LOS Delay LOS _______________________________________________________________________________Eastbound LTR 539 1725 0.30 0.31 21.1 C 21.1 C Westbound DefL 391 1251 0.73 0.31 31.3 C TR 530 1696 0.68 0.31 27.4 C 29.1 C Northbound LTR 1532 2851 0.08 0.54 9.0 A 9.0 A Southbound L 687 1279 0.15 0.54 9.4 A TR 1015 1889 0.37 0.54 10.9 B 10.6 B Intersection Delay = 20.1 (sec/veh) Intersection LOS = C _______________________________________________________________________________

APPENDIX C2
2012 DETOUR ANALYSIS WITH
NO IMPROVEMENTS

HCS+: Unsignalized Intersections Release 5.6 _______________________TWO-WAY STOP CONTROL SUMMARY___________________________ Analyst: AG Agency/Co.: American Date Performed: 3/2/2012 Analysis Time Period: AM Peak Intersection: Indian Road @ College Ave Jurisdiction: Units: U. S. Customary Analysis Year: 2012 Detour Analysis No Imprv Project ID: East/West Street: College Avenue North/South Street: Indian Road Intersection Orientation: EW Study period (hrs): 0.25 ______________________Vehicle Volumes and Adjustments_________________________ Major Street: Approach Eastbound Westbound Movement 1 2 3 | 4 5 6 L T R | L T R ______________________________________________________________________________ Volume 4 293 200 37 Peak-Hour Factor, PHF 0.95 0.95 0.95 0.95 Hourly Flow Rate, HFR 4 308 210 38 Percent Heavy Vehicles 5 -- -- -- -- Median Type/Storage Undivided / RT Channelized? Lanes 0 1 1 0 Configuration LT TR Upstream Signal? No No ______________________________________________________________________________ Minor Street: Approach Northbound Southbound Movement 7 8 9 | 10 11 12 L T R | L T R ______________________________________________________________________________ Volume 353 1 Peak Hour Factor, PHF 0.95 0.95 Hourly Flow Rate, HFR 371 1 Percent Heavy Vehicles 5 5 Percent Grade (%) 0 0 Flared Approach: Exists?/Storage / No / Lanes 0 0 Configuration LR ______________________________________________________________________________ __________________Delay, Queue Length, and Level of Service___________________ Approach EB WB Northbound Southbound Movement 1 4 | 7 8 9 | 10 11 12 Lane Config LT | | LR ______________________________________________________________________________ v (vph) 4 372 C(m) (vph) 1300 493 v/c 0.00 0.75 95% queue length 0.01 6.46 Control Delay 7.8 31.4 LOS A D Approach Delay 31.4 Approach LOS D ______________________________________________________________________________

HCS+: Unsignalized Intersections Release 5.6 _______________________TWO-WAY STOP CONTROL SUMMARY___________________________ Analyst: AG Agency/Co.: American Date Performed: 3/2/2012 Analysis Time Period: PM Peak Intersection: Indian Road @ College Ave Jurisdiction: Units: U. S. Customary Analysis Year: 2012 Detour Analysis No Imprv Project ID: East/West Street: College Avenue North/South Street: Indian Road Intersection Orientation: EW Study period (hrs): 0.25 ______________________Vehicle Volumes and Adjustments_________________________ Major Street: Approach Eastbound Westbound Movement 1 2 3 | 4 5 6 L T R | L T R ______________________________________________________________________________ Volume 2 243 199 124 Peak-Hour Factor, PHF 0.95 0.95 0.95 0.95 Hourly Flow Rate, HFR 2 255 209 130 Percent Heavy Vehicles 5 -- -- -- -- Median Type/Storage Undivided / RT Channelized? Lanes 0 1 1 0 Configuration LT TR Upstream Signal? No No ______________________________________________________________________________ Minor Street: Approach Northbound Southbound Movement 7 8 9 | 10 11 12 L T R | L T R ______________________________________________________________________________ Volume 642 4 Peak Hour Factor, PHF 0.95 0.95 Hourly Flow Rate, HFR 675 4 Percent Heavy Vehicles 5 5 Percent Grade (%) 0 0 Flared Approach: Exists?/Storage / No / Lanes 0 0 Configuration LR ______________________________________________________________________________ __________________Delay, Queue Length, and Level of Service___________________ Approach EB WB Northbound Southbound Movement 1 4 | 7 8 9 | 10 11 12 Lane Config LT | | LR ______________________________________________________________________________ v (vph) 2 679 C(m) (vph) 1204 502 v/c 0.00 1.35 95% queue length 0.00 30.48 Control Delay 8.0 194.7 LOS A F Approach Delay 194.7 Approach LOS F ______________________________________________________________________________
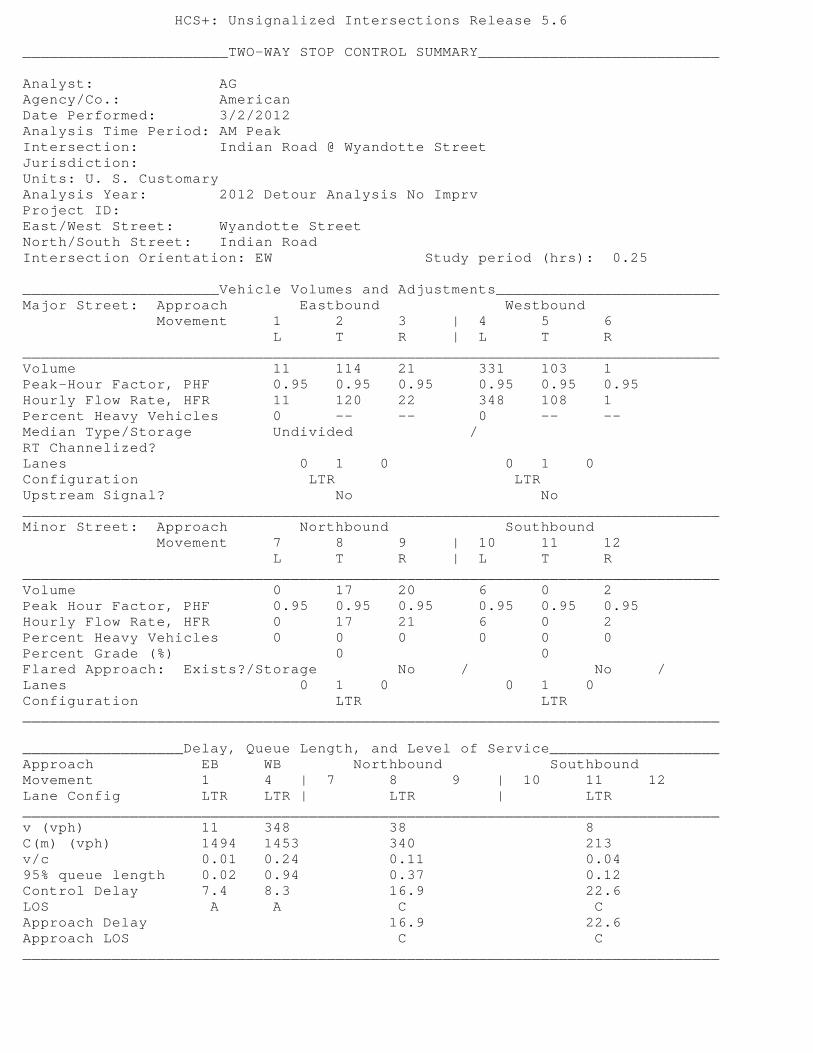
HCS+: Unsignalized Intersections Release 5.6 _______________________TWO-WAY STOP CONTROL SUMMARY___________________________ Analyst: AG Agency/Co.: American Date Performed: 3/2/2012 Analysis Time Period: AM Peak Intersection: Indian Road @ Wyandotte Street Jurisdiction: Units: U. S. Customary Analysis Year: 2012 Detour Analysis No Imprv Project ID: East/West Street: Wyandotte Street North/South Street: Indian Road Intersection Orientation: EW Study period (hrs): 0.25 ______________________Vehicle Volumes and Adjustments_________________________ Major Street: Approach Eastbound Westbound Movement 1 2 3 | 4 5 6 L T R | L T R ______________________________________________________________________________ Volume 11 114 21 331 103 1 Peak-Hour Factor, PHF 0.95 0.95 0.95 0.95 0.95 0.95 Hourly Flow Rate, HFR 11 120 22 348 108 1 Percent Heavy Vehicles 0 -- -- 0 -- -- Median Type/Storage Undivided / RT Channelized? Lanes 0 1 0 0 1 0 Configuration LTR LTR Upstream Signal? No No ______________________________________________________________________________ Minor Street: Approach Northbound Southbound Movement 7 8 9 | 10 11 12 L T R | L T R ______________________________________________________________________________ Volume 0 17 20 6 0 2 Peak Hour Factor, PHF 0.95 0.95 0.95 0.95 0.95 0.95 Hourly Flow Rate, HFR 0 17 21 6 0 2 Percent Heavy Vehicles 0 0 0 0 0 0 Percent Grade (%) 0 0 Flared Approach: Exists?/Storage No / No / Lanes 0 1 0 0 1 0 Configuration LTR LTR ______________________________________________________________________________ __________________Delay, Queue Length, and Level of Service___________________ Approach EB WB Northbound Southbound Movement 1 4 | 7 8 9 | 10 11 12 Lane Config LTR LTR | LTR | LTR ______________________________________________________________________________ v (vph) 11 348 38 8 C(m) (vph) 1494 1453 340 213 v/c 0.01 0.24 0.11 0.04 95% queue length 0.02 0.94 0.37 0.12 Control Delay 7.4 8.3 16.9 22.6 LOS A A C C Approach Delay 16.9 22.6 Approach LOS C C ______________________________________________________________________________

HCS+: Unsignalized Intersections Release 5.6 _______________________TWO-WAY STOP CONTROL SUMMARY___________________________ Analyst: AG Agency/Co.: American Date Performed: 3/2/2012 Analysis Time Period: PM Peak Intersection: Indian Road @ Wyandotte Street Jurisdiction: Units: U. S. Customary Analysis Year: 2012 Detour Analysis No Imprv Project ID: East/West Street: Wyandotte Street North/South Street: Indian Road Intersection Orientation: EW Study period (hrs): 0.25 ______________________Vehicle Volumes and Adjustments_________________________ Major Street: Approach Eastbound Westbound Movement 1 2 3 | 4 5 6 L T R | L T R ______________________________________________________________________________ Volume 1 102 32 614 138 3 Peak-Hour Factor, PHF 0.95 0.95 0.95 0.95 0.95 0.95 Hourly Flow Rate, HFR 1 107 33 646 145 3 Percent Heavy Vehicles 0 -- -- 0 -- -- Median Type/Storage Undivided / RT Channelized? Lanes 0 1 0 0 1 0 Configuration LTR LTR Upstream Signal? No No ______________________________________________________________________________ Minor Street: Approach Northbound Southbound Movement 7 8 9 | 10 11 12 L T R | L T R ______________________________________________________________________________ Volume 20 53 58 7 3 3 Peak Hour Factor, PHF 0.95 0.95 0.95 0.95 0.95 0.95 Hourly Flow Rate, HFR 21 55 61 7 3 3 Percent Heavy Vehicles 0 0 0 0 0 0 Percent Grade (%) 0 0 Flared Approach: Exists?/Storage No / No / Lanes 0 1 0 0 1 0 Configuration LTR LTR ______________________________________________________________________________ __________________Delay, Queue Length, and Level of Service___________________ Approach EB WB Northbound Southbound Movement 1 4 | 7 8 9 | 10 11 12 Lane Config LTR LTR | LTR | LTR ______________________________________________________________________________ v (vph) 1 646 137 13 C(m) (vph) 1446 1456 98 14 v/c 0.00 0.44 1.40 0.93 95% queue length 0.00 2.34 10.01 2.15 Control Delay 7.5 9.4 307.7 574.3 LOS A A F F Approach Delay 307.7 574.3 Approach LOS F F ______________________________________________________________________________

HCS+: Signalized Intersections Release 5.4 Analyst: AG Inter.: Huron Church Rd @ College Ave Agency: American Area Type: All other areas Date: 3/2/2012 Jurisd: Period: AM Peak Year : 2012 Detour Analysis No Imprv Project ID: E/W St: College Avenue N/S St: Huron Church Road _________________________SIGNALIZED INTERSECTION SUMMARY_______________________ | Eastbound | Westbound | Northbound | Southbound | | L T R | L T R | L T R | L T R | |_______________|_______________|_______________|_______________| No. Lanes | 1 2 0 | 1 1 1 | 1 4 0 | 1 4 0 | LGConfig | L TR | L T R | L TR | L TR | Volume |79 122 438 |82 74 26 |136 1421 191 |15 362 25 | Lane Width |12.0 12.0 |12.0 12.0 12.0 |12.0 12.0 |12.0 12.0 | RTOR Vol | 0 | 0 | 0 | 0 | _______________________________________________________________________________Duration 0.25 Area Type: All other areas ______________________________Signal Operations________________________________Phase Combination 1 2 3 4 | 5 6 7 8 EB Left A | NB Left A A Thru A | Thru A A Right A | Right A A Peds | Peds WB Left A | SB Left A Thru A | Thru A Right A | Right A Peds | Peds NB Right | EB Right SB Right | WB Right Green 26.0 10.0 5.0 32.0 Yellow 4.0 4.0 4.0 4.0 All Red 2.0 0.0 2.0 2.0 Cycle Length: 95.0 secs ____________________Intersection Performance Summary___________________________Appr/ Lane Adj Sat Ratios Lane Group Approach Lane Group Flow Rate __________ __________ ___________ Grp Capacity (s) v/c g/C Delay LOS Delay LOS _______________________________________________________________________________Eastbound L 357 1303 0.23 0.27 27.1 C TR 845 3087 0.70 0.27 33.5 C 32.7 C Westbound L 137 501 0.63 0.27 39.1 D T 486 1776 0.16 0.27 26.4 C 32.0 C R 371 1357 0.07 0.27 25.7 C Northbound L 347 1736 0.41 0.20 33.9 C TR 2660 5877 0.64 0.45 20.5 C 21.6 C Southbound L 158 1504 0.10 0.11 38.7 D TR 1734 5148 0.23 0.34 22.8 C 23.4 C Intersection Delay = 24.8 (sec/veh) Intersection LOS = C _______________________________________________________________________________

HCS+: Signalized Intersections Release 5.4 Analyst: AG Inter.: Huron Church Rd @ College Ave Agency: American Area Type: All other areas Date: 3/2/2012 Jurisd: Period: PM Peak Year : 2012 Detour Analysis No Imprv Project ID: E/W St: College Avenue N/S St: Huron Church Road _________________________SIGNALIZED INTERSECTION SUMMARY_______________________ | Eastbound | Westbound | Northbound | Southbound | | L T R | L T R | L T R | L T R | |_______________|_______________|_______________|_______________| No. Lanes | 1 2 0 | 1 1 1 | 1 4 0 | 1 4 0 | LGConfig | L TR | L T R | L TR | L TR | Volume |35 118 728 |173 111 19 |181 746 149 |31 1104 24 | Lane Width |12.0 12.0 |12.0 12.0 12.0 |12.0 12.0 |12.0 12.0 | RTOR Vol | 0 | 0 | 0 | 0 | _______________________________________________________________________________Duration 0.25 Area Type: All other areas ______________________________Signal Operations________________________________Phase Combination 1 2 3 4 | 5 6 7 8 EB Left A | NB Left A Thru A | Thru A Right A | Right A Peds | Peds WB Left A | SB Left A A Thru A | Thru A A Right A | Right A A Peds | Peds NB Right | EB Right SB Right | WB Right Green 41.3 10.7 5.0 21.0 Yellow 4.0 4.0 4.0 4.0 All Red 2.0 0.0 2.0 2.0 Cycle Length: 100.0 secs ____________________Intersection Performance Summary___________________________Appr/ Lane Adj Sat Ratios Lane Group Approach Lane Group Flow Rate __________ __________ ___________ Grp Capacity (s) v/c g/C Delay LOS Delay LOS _______________________________________________________________________________Eastbound L 535 1295 0.07 0.41 17.8 B TR 1301 3151 0.68 0.41 25.5 C 25.2 C Westbound L 159 386 1.14 0.41 144.9 F T 777 1881 0.15 0.41 18.5 B 90.5 F R 635 1538 0.03 0.41 17.5 B Northbound L 193 1805 0.99 0.11 106.2 F TR 1053 5015 0.89 0.21 48.4 D 58.2 E Southbound L 335 1703 0.10 0.20 33.0 C TR 1811 5660 0.66 0.32 30.1 C 30.2 C Intersection Delay = 43.1 (sec/veh) Intersection LOS = D _______________________________________________________________________________

HCS+: Signalized Intersections Release 5.4 Analyst: AG Inter.: Wyandotte St @ Huron Church Rd Agency: American Area Type: All other areas Date: 3/2/2012 Jurisd: Period: AM Peak Year : 2012 Detour Analysis Project ID: E/W St: Wyandotte Street N/S St: Huron Church Road _________________________SIGNALIZED INTERSECTION SUMMARY_______________________ | Eastbound | Westbound | Northbound | Southbound | | L T R | L T R | L T R | L T R | |_______________|_______________|_______________|_______________| No. Lanes | 0 1 0 | 0 2 0 | 0 0 0 | 1 0 1 | LGConfig | LT | TR | | L R | Volume |19 109 | 185 222 | |73 247 | Lane Width | 12.0 | 12.0 | |12.0 12.0 | RTOR Vol | | 0 | | 0 | _______________________________________________________________________________Duration 0.25 Area Type: All other areas ______________________________Signal Operations________________________________Phase Combination 1 2 3 4 | 5 6 7 8 EB Left A | NB Left Thru A | Thru Right | Right Peds | Peds WB Left | SB Left A Thru A | Thru Right A | Right A Peds | Peds NB Right | EB Right SB Right | WB Right Green 25.0 43.0 Yellow 4.0 4.0 All Red 2.0 2.0 Cycle Length: 80.0 secs ____________________Intersection Performance Summary___________________________Appr/ Lane Adj Sat Ratios Lane Group Approach Lane Group Flow Rate __________ __________ ___________ Grp Capacity (s) v/c g/C Delay LOS Delay LOS _______________________________________________________________________________Eastbound LT 504 1612 0.27 0.31 20.9 C 20.9 C Westbound TR 965 3089 0.44 0.31 22.3 C 22.3 C Northbound Southbound L 942 1752 0.08 0.54 9.0 A 10.6 B R 700 1302 0.37 0.54 11.0 B Intersection Delay = 17.7 (sec/veh) Intersection LOS = B _______________________________________________________________________________

HCS+: Signalized Intersections Release 5.4 Analyst: AG Inter.: Wyandotte St @ Huron Church Rd Agency: American Area Type: All other areas Date: 3/2/2012 Jurisd: Period: PM Peak Year : 2012 Detour Analysis Project ID: E/W St: Wyandotte Street N/S St: Huron Church Road _________________________SIGNALIZED INTERSECTION SUMMARY_______________________ | Eastbound | Westbound | Northbound | Southbound | | L T R | L T R | L T R | L T R | |_______________|_______________|_______________|_______________| No. Lanes | 0 1 0 | 0 2 0 | 0 0 0 | 1 0 1 | LGConfig | LT | TR | | L R | Volume |10 109 | 403 208 | |95 353 | Lane Width | 12.0 | 12.0 | |12.0 12.0 | RTOR Vol | | 0 | | 0 | _______________________________________________________________________________Duration 0.25 Area Type: All other areas ______________________________Signal Operations________________________________Phase Combination 1 2 3 4 | 5 6 7 8 EB Left A | NB Left Thru A | Thru Right | Right Peds | Peds WB Left | SB Left A Thru A | Thru Right A | Right A Peds | Peds NB Right | EB Right SB Right | WB Right Green 25.0 43.0 Yellow 4.0 4.0 All Red 2.0 2.0 Cycle Length: 80.0 secs ____________________Intersection Performance Summary___________________________Appr/ Lane Adj Sat Ratios Lane Group Approach Lane Group Flow Rate __________ __________ ___________ Grp Capacity (s) v/c g/C Delay LOS Delay LOS _______________________________________________________________________________Eastbound LT 534 1710 0.24 0.31 20.6 C 20.6 C Westbound TR 1048 3355 0.61 0.31 24.5 C 24.5 C Northbound Southbound L 970 1805 0.10 0.54 9.1 A 11.0 B R 868 1615 0.43 0.54 11.5 B Intersection Delay = 18.9 (sec/veh) Intersection LOS = B _______________________________________________________________________________

APPENDIX C3
2012 DETOUR ANALYSIS WITH
IMPROVEMENTS

HCS+: Signalized Intersections Release 5.4 Analyst: AG Inter.: Indian Rd @ College Ave Agency: American Area Type: All other areas Date: 3/5/2012 Jurisd: Period: AM Peak Year : 2012 Detour Analysis - Imprv Project ID: E/W St: College Avenue N/S St: Indian Road _________________________SIGNALIZED INTERSECTION SUMMARY_______________________ | Eastbound | Westbound | Northbound | Southbound | | L T R | L T R | L T R | L T R | |_______________|_______________|_______________|_______________| No. Lanes | 0 1 0 | 0 1 0 | 0 0 0 | 0 0 0 | LGConfig | LT | TR | | LR | Volume |4 293 | 200 37 | |353 1 | Lane Width | 12.0 | 12.0 | | 12.0 | RTOR Vol | | 0 | | 0 | _______________________________________________________________________________Duration 0.25 Area Type: All other areas ______________________________Signal Operations________________________________Phase Combination 1 2 3 4 | 5 6 7 8 EB Left A | NB Left Thru A | Thru Right | Right Peds | Peds WB Left | SB Left A Thru A | Thru Right A | Right A Peds | Peds NB Right | EB Right SB Right | WB Right Green 23.0 35.0 Yellow 4.0 4.0 All Red 2.0 2.0 Cycle Length: 70.0 secs ____________________Intersection Performance Summary___________________________Appr/ Lane Adj Sat Ratios Lane Group Approach Lane Group Flow Rate __________ __________ ___________ Grp Capacity (s) v/c g/C Delay LOS Delay LOS _______________________________________________________________________________Eastbound LT 592 1802 0.53 0.33 20.0- B 20.0- B Westbound TR 582 1771 0.43 0.33 18.9 B 18.9 B Northbound Southbound LR 862 1723 0.43 0.50 11.5 B 11.5 B Intersection Delay = 16.3 (sec/veh) Intersection LOS = B _______________________________________________________________________________

HCS+: Signalized Intersections Release 5.4 Analyst: AG Inter.: Indian Rd @ College Ave Agency: American Area Type: All other areas Date: 3/5/2012 Jurisd: Period: PM Peak Year : 2012 Detour Analysis - Imprv Project ID: E/W St: College Avenue N/S St: Indian Road _________________________SIGNALIZED INTERSECTION SUMMARY_______________________ | Eastbound | Westbound | Northbound | Southbound | | L T R | L T R | L T R | L T R | |_______________|_______________|_______________|_______________| No. Lanes | 0 1 0 | 0 1 0 | 0 0 0 | 0 0 0 | LGConfig | LT | TR | | LR | Volume |2 243 | 199 124 | |642 4 | Lane Width | 12.0 | 12.0 | | 12.0 | RTOR Vol | | 0 | | 0 | _______________________________________________________________________________Duration 0.25 Area Type: All other areas ______________________________Signal Operations________________________________Phase Combination 1 2 3 4 | 5 6 7 8 EB Left A | NB Left Thru A | Thru Right | Right Peds | Peds WB Left | SB Left A Thru A | Thru Right A | Right A Peds | Peds NB Right | EB Right SB Right | WB Right Green 23.0 35.0 Yellow 4.0 4.0 All Red 2.0 2.0 Cycle Length: 70.0 secs ____________________Intersection Performance Summary___________________________Appr/ Lane Adj Sat Ratios Lane Group Approach Lane Group Flow Rate __________ __________ ___________ Grp Capacity (s) v/c g/C Delay LOS Delay LOS _______________________________________________________________________________Eastbound LT 593 1805 0.44 0.33 18.9 B 18.9 B Westbound TR 564 1715 0.60 0.33 21.5 C 21.5 C Northbound Southbound LR 861 1722 0.79 0.50 19.5 B 19.5 B Intersection Delay = 19.9 (sec/veh) Intersection LOS = B _______________________________________________________________________________

HCS+: Signalized Intersections Release 5.4 Analyst: AG Inter.: Indian Rd @ Wyandotte St Agency: American Area Type: All other areas Date: 3/5/2012 Jurisd: Period: AM Peak Year : 2012 Detour Analysis - Imprv Project ID: E/W St: Wyandotte St N/S St: Indian Road _________________________SIGNALIZED INTERSECTION SUMMARY_______________________ | Eastbound | Westbound | Northbound | Southbound | | L T R | L T R | L T R | L T R | |_______________|_______________|_______________|_______________| No. Lanes | 0 1 0 | 0 1 0 | 0 1 0 | 0 1 0 | LGConfig | LTR | LTR | LTR | LTR | Volume |11 114 21 |331 103 1 |0 17 20 |6 0 2 | Lane Width | 12.0 | 12.0 | 12.0 | 12.0 | RTOR Vol | 0 | 0 | 0 | 0 | _______________________________________________________________________________Duration 0.25 Area Type: All other areas ______________________________Signal Operations________________________________Phase Combination 1 2 3 4 | 5 6 7 8 EB Left A | NB Left A Thru A | Thru A Right A | Right A Peds | Peds WB Left A A | SB Left A Thru A A | Thru A Right A A | Right A Peds | Peds NB Right | EB Right SB Right | WB Right Green 27.0 27.0 10.0 Yellow 4.0 4.0 4.0 All Red 0.0 2.0 2.0 Cycle Length: 80.0 secs ____________________Intersection Performance Summary___________________________Appr/ Lane Adj Sat Ratios Lane Group Approach Lane Group Flow Rate __________ __________ ___________ Grp Capacity (s) v/c g/C Delay LOS Delay LOS _______________________________________________________________________________Eastbound LTR 571 1693 0.27 0.34 19.6 B 19.6 B Westbound LTR 988 1743 0.46 0.73 4.9 A 4.9 A Northbound LTR 210 1678 0.19 0.13 31.8 C 31.8 C Southbound LTR 175 1399 0.05 0.13 30.9 C 30.9 C Intersection Delay = 10.2 (sec/veh) Intersection LOS = B _______________________________________________________________________________

HCS+: Signalized Intersections Release 5.4 Analyst: AG Inter.: Indian Rd @ Wyandotte St Agency: American Area Type: All other areas Date: 3/5/2012 Jurisd: Period: PM Peak Year : 2012 Detour Analysis - Imprv Project ID: E/W St: Wyandotte St N/S St: Indian Road _________________________SIGNALIZED INTERSECTION SUMMARY_______________________ | Eastbound | Westbound | Northbound | Southbound | | L T R | L T R | L T R | L T R | |_______________|_______________|_______________|_______________| No. Lanes | 0 1 0 | 0 1 0 | 0 1 0 | 0 1 0 | LGConfig | LTR | LTR | LTR | LTR | Volume |1 102 32 |614 138 3 |20 53 58 |7 3 3 | Lane Width | 12.0 | 12.0 | 12.0 | 12.0 | RTOR Vol | 0 | 0 | 0 | 0 | _______________________________________________________________________________Duration 0.25 Area Type: All other areas ______________________________Signal Operations________________________________Phase Combination 1 2 3 4 | 5 6 7 8 EB Left A | NB Left A Thru A | Thru A Right A | Right A Peds | Peds WB Left A A | SB Left A Thru A A | Thru A Right A A | Right A Peds | Peds NB Right | EB Right SB Right | WB Right Green 26.0 25.0 13.0 Yellow 4.0 4.0 4.0 All Red 0.0 2.0 2.0 Cycle Length: 80.0 secs ____________________Intersection Performance Summary___________________________Appr/ Lane Adj Sat Ratios Lane Group Approach Lane Group Flow Rate __________ __________ ___________ Grp Capacity (s) v/c g/C Delay LOS Delay LOS _______________________________________________________________________________Eastbound LTR 545 1743 0.26 0.31 20.8 C 20.8 C Westbound LTR 924 1738 0.86 0.69 17.8 B 17.8 B Northbound LTR 263 1617 0.52 0.16 32.6 C 32.6 C Southbound LTR 237 1458 0.05 0.16 28.4 C 28.4 C Intersection Delay = 20.2 (sec/veh) Intersection LOS = C _______________________________________________________________________________

HCS+: Signalized Intersections Release 5.4 Analyst: AG Inter.: Huron Church Rd @ College Ave Agency: American Area Type: All other areas Date: 3/2/2012 Jurisd: Period: AM Peak Year : 2012 Detour Analysis - Imprv Project ID: E/W St: College Avenue N/S St: Huron Church Road _________________________SIGNALIZED INTERSECTION SUMMARY_______________________ | Eastbound | Westbound | Northbound | Southbound | | L T R | L T R | L T R | L T R | |_______________|_______________|_______________|_______________| No. Lanes | 1 1 1 | 1 1 1 | 1 4 0 | 1 4 0 | LGConfig | L T R | L T R | L TR | L TR | Volume |79 122 438 |82 74 26 |136 1421 191 |15 362 25 | Lane Width |12.0 12.0 12.0 |12.0 12.0 12.0 |12.0 12.0 |12.0 12.0 | RTOR Vol | 0 | 0 | 0 | 0 | _______________________________________________________________________________Duration 0.25 Area Type: All other areas ______________________________Signal Operations________________________________Phase Combination 1 2 3 4 | 5 6 7 8 EB Left A | NB Left A A Thru A | Thru A A Right A | Right A A Peds | Peds WB Left A | SB Left A Thru A | Thru A Right A | Right A Peds | Peds NB Right | EB Right A SB Right | WB Right Green 26.0 10.0 5.0 32.0 Yellow 4.0 4.0 4.0 4.0 All Red 2.0 0.0 2.0 2.0 Cycle Length: 95.0 secs ____________________Intersection Performance Summary___________________________Appr/ Lane Adj Sat Ratios Lane Group Approach Lane Group Flow Rate __________ __________ ___________ Grp Capacity (s) v/c g/C Delay LOS Delay LOS _______________________________________________________________________________Eastbound L 357 1303 0.23 0.27 27.1 C T 495 1810 0.26 0.27 27.2 C 24.6 C R 693 1568 0.67 0.44 23.4 C Westbound L 316 1155 0.27 0.27 27.5 C T 486 1776 0.16 0.27 26.4 C 26.8 C R 371 1357 0.07 0.27 25.7 C Northbound L 347 1736 0.41 0.20 33.9 C TR 2660 5877 0.64 0.45 20.5 C 21.6 C Southbound L 158 1504 0.10 0.11 38.7 D TR 1734 5148 0.23 0.34 22.8 C 23.4 C Intersection Delay = 22.8 (sec/veh) Intersection LOS = C _______________________________________________________________________________

HCS+: Signalized Intersections Release 5.4 Analyst: AG Inter.: Huron Church Rd @ College Ave Agency: American Area Type: All other areas Date: 3/2/2012 Jurisd: Period: PM Peak Year : 2012 Detour Analysis - Imprv Project ID: E/W St: College Avenue N/S St: Huron Church Road _________________________SIGNALIZED INTERSECTION SUMMARY_______________________ | Eastbound | Westbound | Northbound | Southbound | | L T R | L T R | L T R | L T R | |_______________|_______________|_______________|_______________| No. Lanes | 1 1 1 | 1 1 1 | 1 4 0 | 1 4 0 | LGConfig | L T R | L T R | L TR | L TR | Volume |35 118 728 |173 111 19 |181 746 149 |31 1104 24 | Lane Width |12.0 12.0 12.0 |12.0 12.0 12.0 |12.0 12.0 |12.0 12.0 | RTOR Vol | 0 | 0 | 0 | 0 | _______________________________________________________________________________Duration 0.25 Area Type: All other areas ______________________________Signal Operations________________________________Phase Combination 1 2 3 4 | 5 6 7 8 EB Left A | NB Left A Thru A | Thru A Right A | Right A Peds | Peds WB Left A | SB Left A A Thru A | Thru A A Right A | Right A A Peds | Peds NB Right | EB Right A SB Right | WB Right Green 33.0 17.0 5.0 28.0 Yellow 4.0 4.0 4.0 4.0 All Red 2.0 0.0 2.0 2.0 Cycle Length: 105.0 secs ____________________Intersection Performance Summary___________________________Appr/ Lane Adj Sat Ratios Lane Group Approach Lane Group Flow Rate __________ __________ ___________ Grp Capacity (s) v/c g/C Delay LOS Delay LOS _______________________________________________________________________________Eastbound L 407 1295 0.09 0.31 25.5 C T 597 1900 0.21 0.31 26.6 C 31.9 C R 861 1615 0.89 0.53 33.1 C Westbound L 397 1262 0.46 0.31 29.7 C T 591 1881 0.20 0.31 26.5 C 28.2 C R 483 1538 0.04 0.31 25.0 C Northbound L 292 1805 0.65 0.16 46.4 D TR 1337 5015 0.70 0.27 36.5 D 38.2 D Southbound L 422 1703 0.08 0.25 30.4 C TR 2102 5660 0.56 0.37 26.6 C 26.7 C Intersection Delay = 31.8 (sec/veh) Intersection LOS = C _______________________________________________________________________________

HCS+: Signalized Intersections Release 5.4 Analyst: AG Inter.: Wyandotte St @ Huron Church Rd Agency: American Area Type: All other areas Date: 3/2/2012 Jurisd: Period: AM Peak Year : 2012 Detour Analysis Project ID: E/W St: Wyandotte Street N/S St: Huron Church Road _________________________SIGNALIZED INTERSECTION SUMMARY_______________________ | Eastbound | Westbound | Northbound | Southbound | | L T R | L T R | L T R | L T R | |_______________|_______________|_______________|_______________| No. Lanes | 0 1 0 | 0 2 0 | 0 0 0 | 1 0 1 | LGConfig | LT | TR | | L R | Volume |19 109 | 185 222 | |73 247 | Lane Width | 12.0 | 12.0 | |12.0 12.0 | RTOR Vol | | 0 | | 0 | _______________________________________________________________________________Duration 0.25 Area Type: All other areas ______________________________Signal Operations________________________________Phase Combination 1 2 3 4 | 5 6 7 8 EB Left A | NB Left Thru A | Thru Right | Right Peds | Peds WB Left | SB Left A Thru A | Thru Right A | Right A Peds | Peds NB Right | EB Right SB Right | WB Right Green 25.0 43.0 Yellow 4.0 4.0 All Red 2.0 2.0 Cycle Length: 80.0 secs ____________________Intersection Performance Summary___________________________Appr/ Lane Adj Sat Ratios Lane Group Approach Lane Group Flow Rate __________ __________ ___________ Grp Capacity (s) v/c g/C Delay LOS Delay LOS _______________________________________________________________________________Eastbound LT 504 1612 0.27 0.31 20.9 C 20.9 C Westbound TR 965 3089 0.44 0.31 22.3 C 22.3 C Northbound Southbound L 942 1752 0.08 0.54 9.0 A 10.6 B R 700 1302 0.37 0.54 11.0 B Intersection Delay = 17.7 (sec/veh) Intersection LOS = B _______________________________________________________________________________

HCS+: Signalized Intersections Release 5.4 Analyst: AG Inter.: Wyandotte St @ Huron Church Rd Agency: American Area Type: All other areas Date: 3/2/2012 Jurisd: Period: PM Peak Year : 2012 Detour Analysis Project ID: E/W St: Wyandotte Street N/S St: Huron Church Road _________________________SIGNALIZED INTERSECTION SUMMARY_______________________ | Eastbound | Westbound | Northbound | Southbound | | L T R | L T R | L T R | L T R | |_______________|_______________|_______________|_______________| No. Lanes | 0 1 0 | 0 2 0 | 0 0 0 | 1 0 1 | LGConfig | LT | TR | | L R | Volume |10 109 | 403 208 | |95 353 | Lane Width | 12.0 | 12.0 | |12.0 12.0 | RTOR Vol | | 0 | | 0 | _______________________________________________________________________________Duration 0.25 Area Type: All other areas ______________________________Signal Operations________________________________Phase Combination 1 2 3 4 | 5 6 7 8 EB Left A | NB Left Thru A | Thru Right | Right Peds | Peds WB Left | SB Left A Thru A | Thru Right A | Right A Peds | Peds NB Right | EB Right SB Right | WB Right Green 25.0 43.0 Yellow 4.0 4.0 All Red 2.0 2.0 Cycle Length: 80.0 secs ____________________Intersection Performance Summary___________________________Appr/ Lane Adj Sat Ratios Lane Group Approach Lane Group Flow Rate __________ __________ ___________ Grp Capacity (s) v/c g/C Delay LOS Delay LOS _______________________________________________________________________________Eastbound LT 534 1710 0.24 0.31 20.6 C 20.6 C Westbound TR 1048 3355 0.61 0.31 24.5 C 24.5 C Northbound Southbound L 970 1805 0.10 0.54 9.1 A 11.0 B R 868 1615 0.43 0.54 11.5 B Intersection Delay = 18.9 (sec/veh) Intersection LOS = B _______________________________________________________________________________