trading with equivolume - armsinsider.com with equivolume 5 armsinsider.com. they always fit the...
TRANSCRIPT

TRADINGWITH
EQUIVOLUME
ByRICHARD W. ARMS, JR.
www.ArmsInsider.com
copyright 2001, Richard W. Arms, Jr.

Table of Contents
Introduction .........................................................................................3
Technical Analysis...............................................................................7
Equivolume Charting.........................................................................9
Turning Points ...................................................................................14
Buying the Breakouts .......................................................................19
Buying Continuation Patterns........................................................22
When to Sell .......................................................................................26
Selling Short .......................................................................................29
Support and Resistance ...................................................................32
Trendlines and Channels.................................................................35
Gaps.....................................................................................................37
Conclusions........................................................................................39
2 TRADING WITH EQUIVOLUME
ArmsInsider.com

INTRODUCTION
YES!
I just sold a stock for $23 that I bought last week for $18. What a high! That is thepleasure of being a trader, being right. Taking a profit is great, but the money is not asimportant as the success. I think the best trader is the one who only uses the money tokeep score. He treats trading as a challenge.
In the pages that follow we are going to be looking at some unique methods of analysisthat can help to make trading more successful and therefore more fun. When I saytraders I am thinking primarily of those who buy individual stocks and hold them for aperiod of days, or at most a few weeks. All the examples we look at will be concernedwith that time frame. That is not to say the methodology is not applicable to other timeframes, it is. But our emphasis will be on short term trading. If we can think of the mar-ket movements as consisting of tides, waves and ripples, we are going to be looking atthe waves. Day traders may want to apply the ideas to the ripples. Long-terminvestors can look at the larger picture and use the methods to take advantage of thelarge tidal movements. In addition, we will not be looking at options trading, just theunderlying stocks. But anyone wanting to trade options must be able to understandwhere the underlying stock appears to be headed. Every principle in the pages that fol-low is a tool for the options trader as well.
When I first became a retail stockbroker, forty years ago, one of the first admonitionsfrom the firm was that we were never to equate investing in stock with gambling. Evenwhen a client was trading on a short-term basis, it was a no-no to suggest that it was aform of wagering. We were well above acting as though we were operating a Las Vegascasino. Moreover, it was pointed out, when you put your money on a roulette table or ahorse, it either won and made money or it lost and you lost all your money. Withstocks, there was residual value. You might sell at a lower price than where youbought, but you would get back some of your money. Therefore, it was investing, notgambling. Of course, if you were in a margin account, it might take a lot of it in a hurry.And if you did not act quickly enough and the market acted unusually, you could getwiped out just about as quickly as at a blackjack table. On the other hand, the rightstock in the right market was not very different than the right horse in the KentuckyDerby. But still, it was not to be thought of as gambling.
TRADING WITH EQUIVOLUME 3
ArmsInsider.com
In the pages that follow we are going to put that admonition aside, and realize that ouronly aim in the market is to buy at a lower price than we sell. The desire is to makemoney. The vehicle we will use in trying to make money is stock. Any stock that goesup when we are long, or down when we are short, is a good stock. I often say, when Iam making a speech, that it would be a lot better if stocks did not have names, justnumbers. Then we would not become emotionally attached to them. If it was juststock 175 instead of Compaq Computer, we would be less likely to make bad decisionsbecause we “liked” the company. It is that sort of detached objectivity that we will bestriving for in the pages that follow. True, it is not gambling, in that you are buyingsomething of value; ownership in a corporation. But if one is adopting a short-term andaggressive attitude, that objective is far overshadowed by the fact that it is only a vehi-cle used to try to make money. Moreover, we are going to want to be as willing to sellshort as we are to buy. Selling short is certainly not designed to participate in“Corporate America”.
Understand, we are not talking about the building of a long-term portfolio of stocks.That is an entirely different approach, and has been the basis of several of my earlierbooks. We are, in the pages that follow, going to be talking about the aggressive buyingand selling of stocks. We are going to look at the short side as well as the long side ofthe market. We are not going to be talking about “owning a piece of CorporateAmerica”, we are going to be talking about buying and selling stocks because we thinkthe price is going to change in our favor.
But there is another factor that makes it far different than a trip to Vegas. When we pullthe lever on a slot machine or place a bet on red at the roulette wheel the result is entire-ly a function of chance. We have absolutely no control over the outcome. Intelligenceplays no part beyond that point. Perhaps we can know the odds well enough to placeour bets where we have the best chance of winning, but we cannot play any part inwhere the ball drops in the slot or how the wheels turn in the machine. In the stockmarket we can be rewarded for being smart. We can make good decisions and swingthe odds in our favor.
In addition, at the casino the house always wins. The odds are such that in the long runthe gamblers are always the losers. It is not even a zero-sum situation. It is an automat-ic losing position, on average. In the market, if stocks are in a long-term advance, thebuyers can all be winners, on average. In bear markets all the short sellers can be win-ners. Of course, there is still a cost of buying and selling, which puts a part of every
4 TRADING WITH EQUIVOLUME
ArmsInsider.com

investment in the pocket of a broker. But it is not the handicap it once was.Commissions are now so low as to be of little concern. In a sideways market it is notquite a zero-sum game, but it is close to it.
As we go along we will be looking at a methodology that is designed to swing the oddsin our favor. We will be combining price and volume into usable information. It is amethodology that helps to shield us from irrational emotional decisions. We will beconcerned with the emotionalism of others, and attempting to recognize times when aswing in emotions is presenting an opportunity to make money. The interplay of priceand volume will help to tell us what others are doing, and allow us to take advantageof that knowledge.
Interestingly, all of the methodology we will consider in the pages that follow havetheir place in conservative long-term investing also. In fact, my prior books have con-centrated on that aspect of the market. We are going to be talking about the delicate bal-ance between fear and greed that moves prices, and those forces are in control on thelong term as well as the short term. For the purposes of this write-up our time framewill be days and weeks, but the same methods are effective as we move up or down thetime scale. An Equivolume chart that is posted minute by minute during a trading daycontains all the same characteristics as a chart posted on a daily or a weekly basis. Wewill be studying moves that develop over a few days, because that is also the focus ofmy website, ArmsInsider.com, which offers stock recommendations and is an adjunct tothis book. A trader who wants to follow and use our recommendations needs to befamiliar with the reasoning that leads to those suggestions.
We are living in a wonderful era for investors. Technology has made it possible, asnever before, for a diligent trader to be successful. With the speed of computers and ofcommunications, everyone has an opportunity to participate on equal footing. When Ifirst invented the Arms Index (some people still call it TRIN) in 1967, I had to calculateit on a slide rule. Now it is calculated for me second by second and appears on almostevery quotation device. It crosses the tape every few minutes on CNBC. When I firstdeveloped Equivolume charting, every chart had to be drawn by hand. Now there arecomputer programs that do it all, and do it well. I am able to follow thousands ofstocks on a daily basis, searching for opportunities. Thirty years ago I hand-drewcharts of a few dozen stocks, and when they went off the top or bottom of the page Ihad to start over. When the volume characteristics changed I had to rescale them andthrow the old charts away. Today the computer recalculates and rescales the charts so
TRADING WITH EQUIVOLUME 5
ArmsInsider.com

they always fit the page. Facts, rumors, advice and opinions flash across the screen onthe Internet. Geography has become meaningless to the trader. Moreover, the intensecompetition of the marketplace has brought commission rates down so low that theyare close to negligible. The trader no longer needs to be concerned with the transactioncosts. If a stock is not acting right it can be sold and replaced instantly and almost with-out cost. What used to take a number of phone calls to a broker, wires to New York,calls back with confirmations and waiting days for balances, are all now activated bythe click of a mouse button. The trading mechanics have become so efficient that noone need be disadvantaged because of geography or cost.
Now, with decimalization, spreads have contracted even further. There are now 100possible steps in single point of range, instead of just eight a few years ago.
All this is good, in that the small trader is on an even footing with the big trader. It isalso a curse, though. There is so much information, and so many rumors, and so manyopinions, that it can lead to confusion and indecision. Modern communications haveled to an overload of data. We will, in the pages that follow, try to cut through thatmorass, and concentrate on the few factors that can lead to extraordinary profits.
6 TRADING WITH EQUIVOLUME
ArmsInsider.com

TECHNICAL ANALYSIS
This book is about technical analysis. Moreover, it is about one particular type of tech-nical analysis. You will not see anything about earnings, or dividends or cash flows.Nowhere will we mention management or products or competition or sales. Search allyou want but you won’t find another mention of price to earnings ratios. All we aregoing to be concerned with is price and volume. We are going to look at the past, andtry to anticipate the future, and we are going to do so without ever looking at a singlefundamental factor.
This is not because of laziness; it is because of our need to be realistic and objective.The stock market determines the price of a stock, and the volume of the trading repre-sents the amount of interest in that determination. That determination is based uponall the factors mentioned above; the fundamental factors I will not repeat because I saidyou would not ever see them again in this book. But the fundamentals do not directlydetermine price. First they have to be passed through a very critical filter, which is theemotionalism of the marketplace. The fundamentals are only as important or unimpor-tant as the emphasis placed on them by the millions of minds studying them. We haveall seen a stock go down on a good piece of news or up on news that looks terrible, andwe have shaken our heads in disbelief. That was because we were trying to predictwhat other people would think of that news. But the market is never wrong. It isreflecting exactly what the consensus really is. The market is a very efficient and accu-rate reflection of the facts, but only after they have been analyzed and then reacted to inan emotional manner. In the final analysis, the price of a stock and its volume are areflection of a delicate balance between fear and greed. That balance is influenced bythe underlying fundamentals, but is not a direct representation of those fundamentals.
In using technical analysis we are deciding to study the output of those emotionalresponses, rather than try to second-guess what they may be, based on our limitedknowledge of the “facts”. When we look at price and volume, we are looking at all thefacts; they have been interpreted for us, and translated into fear or greed. It is not lazi-ness that keeps a technician from looking at the fundamental data, is the knowledgethat everything that is known about a stock has been already taken into account, and itis publicly available in the form or the price of the stock and the amount of stock that ischanging hands.
TRADING WITH EQUIVOLUME 7
ArmsInsider.com

The way in which the methods that follow are different than other technical analysismethods is the great dependence upon, and emphasis of, volume. It is, I believe, ofparamount importance, yet it is often ignored. Many traders do not even follow thenumber of shares being traded, relying wholly upon price movement to make theirdecisions. Yet, without knowing the volume one has no idea of how much conviction isinvolved in a move. It is like buying a car without looking under the hood. One needsto know if that car has enough power to get over the hills. It can have a beautiful paintjob, wonderful upholstery, great tires, but it is useless if it doesn’t have an adequatemotor. Volume is the motor of the marketplace. We are going to be looking under thehood of each stock we trade, and seeing whether the power is there or not. To do thatwe are going to use my unique charting method called Equivolume.
8 TRADING WITH EQUIVOLUME
ArmsInsider.com

EQUIVOLUME CHARTING
Shown below is the type of chart we are all familiar with; a bar chart. In this case eachvertical line represents one day of trading. The top of the line represents the high of theday and the bottom of the line represents the low of the day. The little horizontal line isthe level at which the stock closed on that day.
Across the bottom of the chart is a histogram that represents the volume. By tracingupward we can equate the volume for each day with the price action on the same day,but it is difficult to know precisely which volume applies to which price in every case.
When I first thought of Equivolume as an alternative to bar charts I had already becomeaware of the importance of volume. I knew that it was necessary to see whether vol-ume was heavy or light as a stock moved through an old level of resistance or support.I knew that volume tended to become heavy, and price spread tended to shrink, atimportant tops. I had become aware that large price swings on heavy volume weretypical of climactic bottoms. I was intensely aware of volume, because it was volumethat was at the foundation of my, by then already popular, Arms Index. It bothered methat volume tended to be relegated to a secondary significance, or even completelyignored at times. I felt that volume needed to be made a full partner with price if onewas to understand the underlying dynamics of price movement.
TRADING WITH EQUIVOLUME 9
ArmsInsider.com
27 3November
10 17 24 1December
8 15 22 29 51998
12 20 26 2February
95000
10000
15000
20000
25000
71
72
73
74
75
76
77
78
79
80
81
82
83
84
85
86
87
88
89
90
91
92
93American Express (80.44, 80.75, 78.38, 79.06)
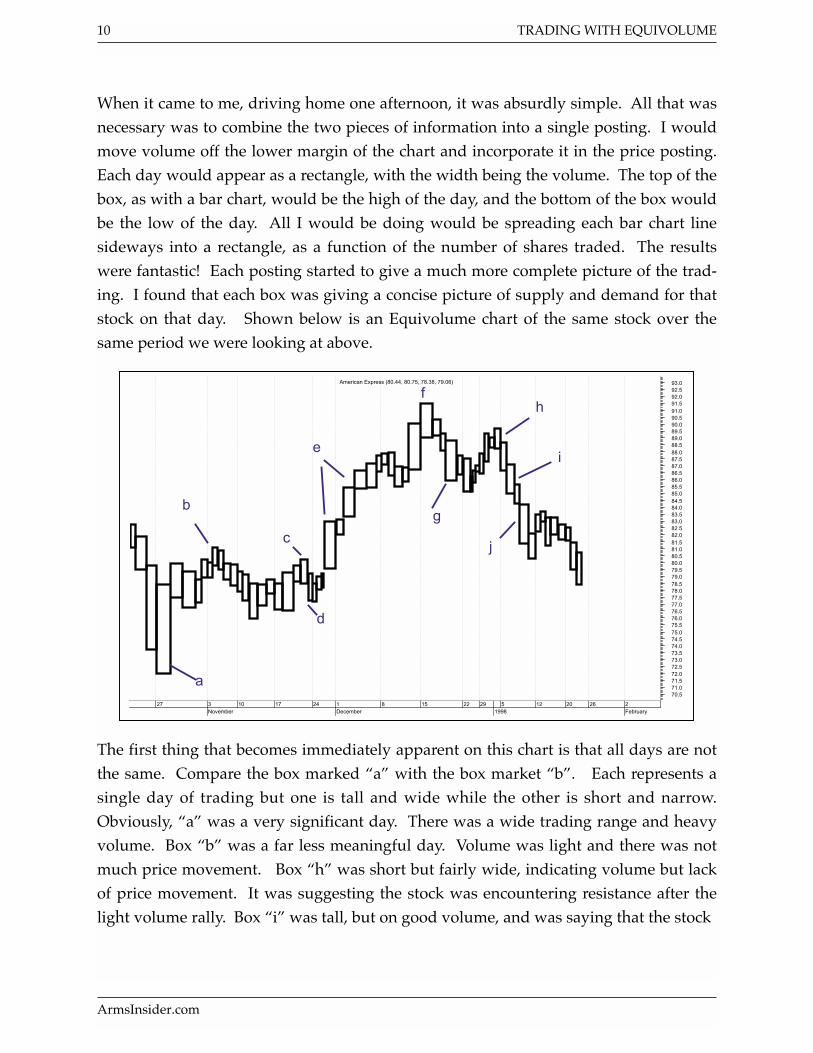
When it came to me, driving home one afternoon, it was absurdly simple. All that wasnecessary was to combine the two pieces of information into a single posting. I wouldmove volume off the lower margin of the chart and incorporate it in the price posting.Each day would appear as a rectangle, with the width being the volume. The top of thebox, as with a bar chart, would be the high of the day, and the bottom of the box wouldbe the low of the day. All I would be doing would be spreading each bar chart linesideways into a rectangle, as a function of the number of shares traded. The resultswere fantastic! Each posting started to give a much more complete picture of the trad-ing. I found that each box was giving a concise picture of supply and demand for thatstock on that day. Shown below is an Equivolume chart of the same stock over thesame period we were looking at above.
The first thing that becomes immediately apparent on this chart is that all days are notthe same. Compare the box marked “a” with the box market “b”. Each represents asingle day of trading but one is tall and wide while the other is short and narrow.Obviously, “a” was a very significant day. There was a wide trading range and heavyvolume. Box “b” was a far less meaningful day. Volume was light and there was notmuch price movement. Box “h” was short but fairly wide, indicating volume but lackof price movement. It was suggesting the stock was encountering resistance after thelight volume rally. Box “i” was tall, but on good volume, and was saying that the stock
10 TRADING WITH EQUIVOLUME
ArmsInsider.com
27 3November
10 17 24 1December
8 15 22 29 51998
12 20 26 2February
70.571.071.572.072.573.073.574.074.575.075.576.076.577.077.578.078.579.079.580.080.581.081.582.082.583.083.584.084.585.085.586.086.587.087.588.088.589.089.590.090.591.091.592.092.593.0
a
b
d
c
e
f
g
h
i
j
American Express (80.44, 80.75, 78.38, 79.06)

was moving downward with vigor. The shape and size of each box has a story to tell.Let us go through all the indicated boxes on this chart, and see what they were tellingus.
a. A heavy volume reversal day. This looked like the culmination of the decline.Heavy volume and a wide spread are typical of the final washout of a drop.
b. A light volume rally off the low. The lack of volume makes it far from convincing.c. Here we are seeing a rally with better volume. It suggests that the low was tested,
and that the rally might carry further. d. Notice the very light volume on this pullback. It now looks as though volume is
coming in on the upside and drying up on the downside. That is a very bullishsign.
e. On the next day volume explodes to the upside, penetrating the resistance we sawat “b” and saying the stock is headed higher.
f. After a big advance over the prior two weeks volume remains heavy but the rangecontracts. Perhaps the stock is encountering resistance after such a sudden rise.
g. This is ominous. Heavy volume to the downside and a wide trading range. If wewere to insert a trendline along the bottoms of the rise, this drop would penetrateit. But the narrowness of the top suggests it is not likely to go lower until someattempt to rally is made.
h. The stock rallies, but the move lacks volume. It looks like a lighter volume test ofthe heavy volume top at “f”.
i. The decline resumes, on heavier volume, and support is penetrated decisively.j. The decline continues.
This is a fairly typical Equivolume chart, posted on a daily basis. By going to weeklypostings or three-day postings a longer-term outlook can be achieved. Very aggressiveintraday traders might go to hourly charts or even five-minute charts. On our website,all of the Equivolume charts are daily, with the aim of taking advantage of price moveslasting a few days or, at most, weeks. But in any time frame, the signals given by theprice to volume relationship are similar. On longer-term charts they tend to be moremuted and on very short-term postings they tend to be more erratic. But the rules arethe same. The shape of each box and its size tells us how easy or hard it is for price tomove in a given direction.
There are other tools that are used as well. The chart below has the appearance of thetypical chart published on our website. On it you will see a number of other lines thatneed some explanation. But first look at the boxes on this stock, as we did on the prior
TRADING WITH EQUIVOLUME 11
ArmsInsider.com

example. Notice particularly the two boxes at the low. They are very wide and short.They denote extremely heavy volume in a narrow trading range, and indicate a stronglevel of support.
Followed by the two up boxes that are tall for their width, but still are on fairly heavyvolume, we have a signal the stock is turning up, and it is time to buy. Notice also thelast posting on the chart. The stock has moved through an old area of resistance withincreasing volume and a widening range. That is a very bullish signal. As we will see alittle later, a light volume pullback is likely before going higher. Often we will look forthat pullback before buying.
Superimposed on the Equivolume postings are two lines, one red and the other blue.They are moving average lines, but not the usual moving average lines of Wall Street.Instead of being based on time they are based on volume. That is, heavier volume dayscontribute more to the moving average than do light volume days. A complete discus-sion of Volume Adjusted moving averages is beyond the scope of this presentation. Iwould suggest anyone interested in the derivation of these lines read my book entitled“Trading Without Fear”. For the purposes of understanding the information on thecharts, notice that the two lines tend to cross at or near important buy and sell points.Because they are volume adjusted they tend to be more sensitive to the heavy volumeof tops and bottoms, and give earlier signals than do the usual time-based moving aver-ages. The hand calculation of these lines is an immense job, but with today’s computers
12 TRADING WITH EQUIVOLUME
ArmsInsider.com
25 2October
9 16 23 30 6November
13 20 27 4December
11 18 26 22001
8 16 22 29Febr
3.0
3.5
4.0
4.5
5.0
5.5
6.0
6.5
7.0
7.5
8.0
ADV TISSUE SCI (5.500, 4.375, 5.125)
-0.8-0.7-0.6-0.5-0.4-0.3-0.2-0.10.00.10.20.30.40.50.6Ease of Movement (0.5472), Ease of Movement (0.2019)

and sophisticated programs, we can easily use them without worrying too much abouthow they are derived.
Across the top of the chart are seen another pair of lines. They too involve a difficult setof calculations, but are nothing to a computer. They represent two values for the Easeof Movement. Ease of Movement is a method of valuing each of the Equivolume boxesnumerically, taking into consideration the size and shape of each box and the directionand extent of the daily price change. It is an attempt to ascertain whether it is easier forthe stock to move up or down at any given time. As with the Volume Adjusted movingaverages, we look at the crossover of the two lines as a clue to future price direction. Acomplete discussion of Ease of Movement is available in my book entitled “VolumeCycles in the Stock Market”. These, and my book entitled “The Arms Index”, are avail-able for purchase at our website bookstore, or through most book dealers.
Obviously, these charts represent a sophisticated set of computer programs. In the earlydays I drew charts by hand, and did the complex calculations of Ease of Movement andVolume Adjusted moving averages with a hand calculator. Today there is no need for that.All the charts in this book were produced using the Metastock program marketed by EquisInternational. (http://www.equis.com/metastock/windows95nt/) Tell them you areinterested as a result of talking to Dick Arms and you get a discount. As an ArmsInsidersubscriber, you may want to have this program in order to follow up on suggestions afterthe original recommendation has been made.
TRADING WITH EQUIVOLUME 13
ArmsInsider.com

TURNING POINTS
Tops and bottoms are not for buying or selling, they are for covering long or short posi-tions. A possible top is an unconfirmed move, and trying to short a stock on that basisis too risky. But it is a time to take a profit. Similarly, something that looks like a bot-tom is a good time to get out of a short position, but the risks are far too high to use it asa buy point. We will look first at Equivolume signals that suggest tops and bottomsbecause they are the most obvious boxes on an Equivolume chart, usually. Later wewill look at the signals that are going to be our buying or shorting points.
When a stock gets to a top, it usually tells us so. Volume becomes heavy, and the pricerefuses to move. That produces an Equivolume box, or a series of Equivolume boxes,that are very wide for their height. You will often see them referred to as “oversquare”boxes.
On the chart above we see a number of instances in which the trading range becamevery tight while the volume became heavy. That produced the square and oversquareboxes. The reason for this happening is simple. After an advance, there are still buyerstrying to push the price higher. But they are encountering well-entrenched sellers whoare willing to give them all the stock they want at a given price. As the buyers pushupward and the sellers resist, heavy volume is created, but the price acts as though ithas encountered a brick wall. It is usually a clear sign of a top, and a warning that
14 TRADING WITH EQUIVOLUME
ArmsInsider.com
13 20 27 4December
11 18 26 22001
8 16 22 29Februa
33.0
33.5
34.0
34.5
35.0
35.5
36.0
36.5
37.0
37.5
38.0
38.5
39.0
39.5
40.0
40.5
41.0
41.5
42.0
42.5
43.0
43.5
44.0
oversquare
squareALBERTO CULVER (39.00, 39.00, 37.75, 38.50)
-5-4
-3
-2-1
0
12
3
45
6
7Ease of Movement (-0.1338), Ease of Movement (-0.3632)

prices are likely to head lower. In trading stocks we will usually believe such a sign,and be willing to take the profit. Obviously, there are exceptions, but it holds true oftenenough for us to heed the warning.
Often a stock will make a double or a triple top before heading lower. For a longer-term investor that is a signal to get out, but as traders, we are not likely to wait thatlong. Typically a triple top shows up as a big square entry on the first top, and thendiminishing volume on the subsequent tests of that top. A trader is well advised to getout on the first big square, and take the profit. If it goes higher later, instead of forminga double or triple top, who cares.
On the chart above, we might have been buyers when the stock broke out above resist-ance. Just a few days later, at much higher prices, we started to see signs of resistance.That was the time to take the profit. Later it did go back up to that level, and formed awide double top. That then led to a very big decline. But, as traders, we would nothave waited around for all of that. The stock told us very early that it was running intoresistance and should be sold.
Unfortunately they do not always act exactly as we expect. Sometimes the toppingaction will be far less obvious.
TRADING WITH EQUIVOLUME 15
ArmsInsider.com
30 6November
13 20 27 4December
11 18 26 22001
8 16 22 29Februa
33.0
33.534.0
34.5
35.0
35.5
36.036.5
37.037.5
38.0
38.5
39.0
39.540.0
40.541.0
41.5
42.0
42.5
43.0
43.5
44.0
44.5
45.0
45.5double top
breakout buy signal
ALLSTATE (34.88, 35.13, 33.88, 34.75)
-0.7
-0.6
-0.5
-0.4
-0.3
-0.2
-0.1
0.0
0.1
0.2
0.3
0.4Ease of Movement (-0.2311), Ease of Movement (-0.2714)

The breakout was obvious in the stock above, and the subsequent move was very grati-fying. But, when it reached the top it did not tell us so. The range did contract, but thevolume was not excessive. Only a couple of days later did it become apparent thatthere was trouble. The clue was the heavy downside volume with a wide tradingrange. The ascending trend was broken, and it looked as though the stock was headedlower. On tops that are not typical, we need to watch for other clues.
Lows tend to be different than highs. They are more emotional. Fearful selling oftenresults in climactic action, in which volume becomes very heavy and the trading range,unlike a top, is wide. Therefore we are more likely to see very large Equivolume boxeson bottoms, but they are less likely to be square or oversquare. The typical bottom con-sists of a big box that washes out the sellers, followed by an immediate rally, and then alighter volume pullback that tests the old support.
16 TRADING WITH EQUIVOLUME
ArmsInsider.com
30November
6 13 20 27 4December
11 18 26 22001
8 16 22 29Februa
57
58
59
60
61
62
63
64
65
66
67
68
69
70
71
72
73
74
75
76
77
downside volume
not an obvious top
breakout levels
AMERADA HESS (67.13, 67.38, 66.25, 66.94)
-2.0
-1.5-1.0
-0.5
0.00.5
1.0
1.52.0
2.5
3.0
3.5
4.0Ease of Movement (0.4951), Ease of Movement (-1.841)
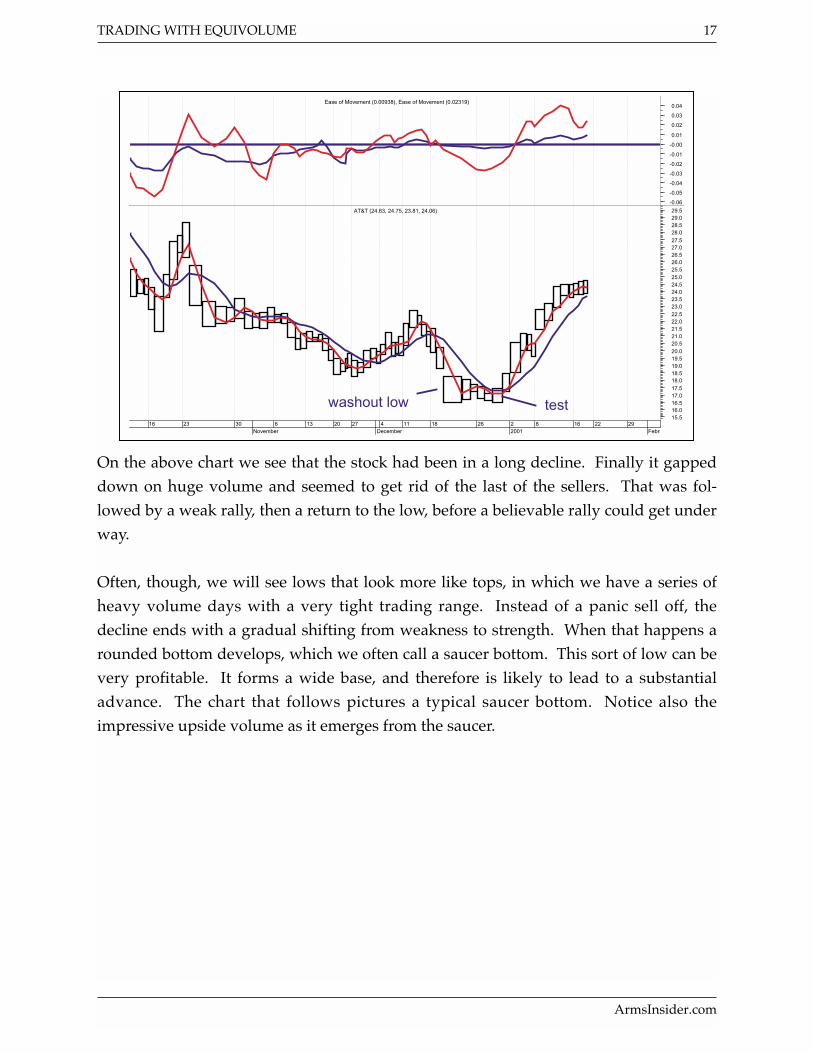
On the above chart we see that the stock had been in a long decline. Finally it gappeddown on huge volume and seemed to get rid of the last of the sellers. That was fol-lowed by a weak rally, then a return to the low, before a believable rally could get underway.
Often, though, we will see lows that look more like tops, in which we have a series ofheavy volume days with a very tight trading range. Instead of a panic sell off, thedecline ends with a gradual shifting from weakness to strength. When that happens arounded bottom develops, which we often call a saucer bottom. This sort of low can bevery profitable. It forms a wide base, and therefore is likely to lead to a substantialadvance. The chart that follows pictures a typical saucer bottom. Notice also theimpressive upside volume as it emerges from the saucer.
TRADING WITH EQUIVOLUME 17
ArmsInsider.com
16 23 30 6November
13 20 27 4 11December
18 26 22001
8 16 22 29Febru
15.516.016.517.017.5
18.018.519.019.520.020.521.021.522.022.523.023.524.024.525.025.526.026.527.027.5
28.028.529.029.5
washout low test
AT&T (24.63, 24.75, 23.81, 24.06)
-0.06
-0.05
-0.04
-0.03
-0.02
-0.01
-0.00
0.01
0.02
0.03
0.04Ease of Movement (0.00938), Ease of Movement (0.02319)

That upside volume out of the base would be a strong signal to cover short positions,and even to go long.
18 TRADING WITH EQUIVOLUME
ArmsInsider.com
16 23 30 6November
13 20 27 4December
11 18 26 2 82001
16 22 29Febru
1.0
1.5
2.0
2.5
3.0
3.5
4.0
4.5
5.0
5.5
6.0
6.5
saucer bottom
RAZORFISH (2.406, 2.125, 2.313)
-0.20
-0.15
-0.10
-0.05
-0.00
0.05Ease of Movement (0.00309), Ease of Movement (0.01360)

BUYING THE BREAKOUTS
The classic technical picture that I particularly like to use for trading, is a stock that hashad a long decline, given signs of a bottom, built a substantial base and has then sent asignal of strength. All of these earmarks are exhibited in both price movement and vol-ume characteristics. On the stock chart that follows we are looking at a quite typicalformation of this sort.
I have made a number of notations on the chart. The first is the square top that we sawas it tried to rally after a long decline. The heavy volume and lack of progress suggest-ed that it was encountering formidable overhead supply, and could not get through.Then it went down to a level where we saw the same sort of square entries, but now onthe downside. The next rally was more encouraging because, for the first time inmonths, volume was coming in as the stock went up instead of becoming heavier as thestock went down. But when it got back to the old resistance it again stalled, and madeanother series of square tops. The sellers were still there, and would not let it throughthe barrier. It pulled back again, but not so far, and the volume was lighter. We werestill in a base area, but it was becoming more encouraging. Then, on the next rally itbroke out! Notice the Equivolume box it made on the breakout: a tall box showing thatit was moving well, but heavy volume showing power. The stock appeared to be on itsway.
TRADING WITH EQUIVOLUME 19
ArmsInsider.com
23 30November
6 13 20 27 4December
11 18 26 22001
8 16 22 29Febru
8.5
9.0
9.5
10.0
10.5
11.0
11.5
12.0
12.5
13.0
13.5
14.0
14.5
15.0
15.5
16.0
16.5
17.0
resistance
breakoutsquare tops
square bottom
KULICKE & SOFFA (16.563, 16.625, 15.688, 16.000)
-0.3
-0.2
-0.1
0.0
0.1
0.2
0.3
0.4
Ease of Movement (0.2380), Ease of Movement (0.1668)
The breakout box is what I like to call a “power box”. A tall thin box that lacks volumeas the resistance is penetrated is suspect. There does not seem to be enough convictionbehind the move. A short and wide box through resistance is equally suspect, becauseit is obvious that there are many big sellers just above the old resistance level. But a tallbox that also has width indicates a very strong situation. There are many aggressivebuyers, and the sellers are toppling before them. That is the sort of breakout box wesaw in the stock above, and those are the situations we should be searching for.
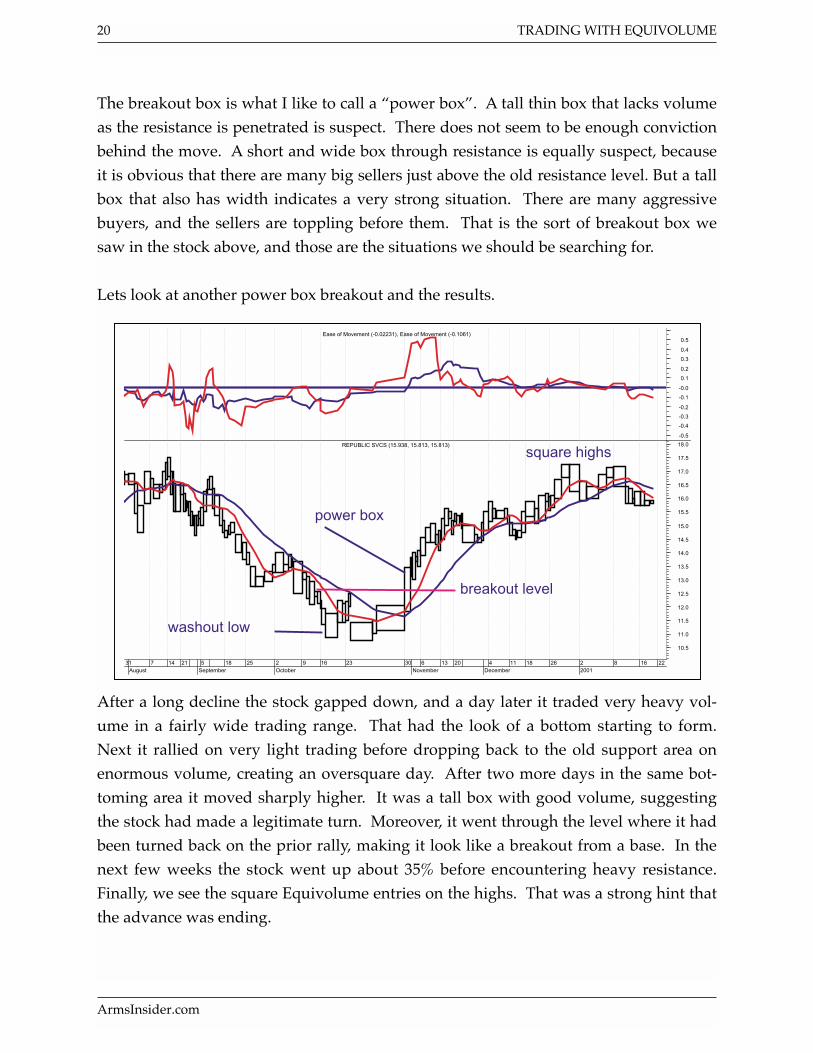
Lets look at another power box breakout and the results.
After a long decline the stock gapped down, and a day later it traded very heavy vol-ume in a fairly wide trading range. That had the look of a bottom starting to form.Next it rallied on very light trading before dropping back to the old support area onenormous volume, creating an oversquare day. After two more days in the same bot-toming area it moved sharply higher. It was a tall box with good volume, suggestingthe stock had made a legitimate turn. Moreover, it went through the level where it hadbeen turned back on the prior rally, making it look like a breakout from a base. In thenext few weeks the stock went up about 35% before encountering heavy resistance.Finally, we see the square Equivolume entries on the highs. That was a strong hint thatthe advance was ending.
20 TRADING WITH EQUIVOLUME
ArmsInsider.com
31August
7 14 21 5 18September
25 2October
9 16 23 30 6November
13 20 4 11December
18 26 22001
8 16 22
10.5
11.0
11.5
12.0
12.5
13.0
13.5
14.0
14.5
15.0
15.5
16.0
16.5
17.0
17.5
18.0
breakout level
power box
washout low
square highsREPUBLIC SVCS (15.938, 15.813, 15.813)
-0.5
-0.4
-0.3
-0.2
-0.1
-0.0
0.1
0.2
0.3
0.4
0.5Ease of Movement (-0.02231), Ease of Movement (-0.1061)

Below is a final example of power boxes to the upside. Also notice the typical squareentries on both the highs and the lows for each cycle.
TRADING WITH EQUIVOLUME 21
ArmsInsider.com
2October
9 16 23 30 6 13November
20 27 4December
11 18 26 22001
8 16 22 29Febr
16.0
16.5
17.0
17.5
18.0
18.5
19.0
19.5
20.0
20.5
21.0
21.5
22.0
22.5
23.0
23.5
24.0
24.5
25.0
25.5
power boxes
square tops
square lows
AMER WIRELESS (24.44, 23.38, 23.94)
-0.40-0.35-0.30-0.25-0.20-0.15-0.10-0.05-0.000.050.100.150.200.250.300.35Ease of Movement (0.02741), Ease of Movement (0.1444)

BUYING CONTINUATION PATTERNS
The other favorite signal for buying is a continuation of an earlier breakout. As withthe breakout, we want to see heavy upside volume through an old level of resistance.Moreover, we want to be sure that the stock has the right volume characteristics. Thatis, it needs to be receiving heavier volume on advances than on declines. Thirdly, itneeds to have the potential to move a good deal further. The stock must have enoughof a base to suggest the advance is not likely over yet and that the objective is at a high-er level. Determination of objectives, and the cyclical nature of stock that is implicit inthe volume-to-volume relationship is covered more fully in the book “Volume Cycles inthe Stock Market”. For this discussion, understand that the width of the base is usuallyvery nearly the same as the width of the ensuing advance. Similarly, the width of a topis about the same as the width of the decline that follows.
This stock built a very wide base lasting about three months. I have shown that base asthe distance between the two vertical lines. It gave a buy signal as it came out of thatbase. Volume was much heavier as it penetrated the resistance. After moving sidewaysand then higher, it again had an upside power box a month later. I show that as thecontinuation buy signal. The two vertical lines show the width of the base. Remember,since this is an Equivolume chart we are really measuring an amount of volume not an
22 TRADING WITH EQUIVOLUME
ArmsInsider.com
6 11September
18 25 2October
16 23 30 6November
13 20 27 4December
11 18 26 22001
8 16 22 29Feb
19.5
20.0
20.5
21.0
21.5
22.0
22.5
23.0
23.5
24.0
24.5
25.0
25.5
26.0
26.5
27.0
27.5
28.0
buy signal
resistance
continuation buy signal
base
!
objective
AMETEK (26.375, 27.063, 26.250, 26.938)
-2.0
-1.5
-1.0
-0.5
0.0
0.5
1.0
1.5
2.0
2.5
3.0
3.5Ease of Movement (1.597), Ease of Movement (0.7672)

amount of time. I have measured sideways a distance equal to the base, and marked itas the objective. Since the second indication to buy came well short of that objective, itwas a believable signal. Notice that the high came in just about where it had been fore-cast.
Here is another example of multiple opportunities to buy. Each time the stock ranthrough a resistance level volume expanded. Each time it pulled back volume contract-ed. The wide base justified a long advance. The stock finally encountered resistanceand went square, suggesting the move was over. Obviously, the examples shown arechosen to illustrate the principles. Not all stocks behave so well all of the time.Therefore it is important to always have a stop order, or at least an idea as to what sortof action would say that a bad decision had been made. We will be looking at stop lev-els a little later.
Every buy suggestion that appears on the website is derived by looking for either a newbreakout or a continuation pattern. Within the time frame we are using, they are theonly formations that carry big odds of being correct. For example, in a longer-termdecline there are often countertrend rallies, but they are usually on light volume andare short lived. Since the longer-term trend is down, the risks are too large to be buyingsuch a formation. As we said above, thinking a stock is through going down is not rea-son enough to buy, either. The stock could be through going down but not ready to goup, meaning money might remain idle while waiting for the move to develop. The rea-
TRADING WITH EQUIVOLUME 23
ArmsInsider.com
2October
9 16 23 30 6November
13 20 27 4December
11 18 26 22001
8 16 22 29Febr
18.0
18.5
19.0
19.5
20.0
20.5
21.0
21.5
22.0
22.5
23.0
23.5
24.0
24.5
25.0
25.5
26.0
26.5
27.0
27.5
28.0
buys
base runup
!
!
!
objective
GENUINE PARTS (25.63, 25.75, 24.88, 25.63)
0.0
0.5
1.0
Ease of Movement (0.3710), Ease of Movement (-0.09831)

son for buying a stock is to participate in an upward move. The best time to buy thestock is when others have just started to. Big buying evidences itself in heavy volumeand a wide trading range; a power box on the Equivolume chart. We don’t ever wantto be contrarians. We want to agree with others, but only very early in the move. Thebig volume move is usually caused by professional money coming in. Later in theadvance the amateurs are buying. We want to be on the side of the pros.
There is one variation on this strategy that we do use however. In some markets, and insome instances, a power box is followed by a light volume pullback. That pullback islikely to return the price to somewhere near the breakout level. In a fast running stock,or a greatly oversold market, we sometimes do not see many such pullbacks. At othertimes they are quite common. They can often give us the opportunity to buy at a some-what better level. Depending upon the stock and the way it is acting, we sometimeswill suggest waiting for a pullback to buy. At other times, where it is less clear, we sug-gest taking a partial position on the breakout, another partial on the pullback and athird piece when the rally resumes.
On the chart that follows we see a case in which the breakout, while dynamic, was wor-risome because it was so oversquare. It said that the move was already encounteringresistance. Therefore, one would be inclined to wait and see if it would pull back somebefore going higher. Particularly important is to be sure that volume dries up on thepullback. It says that the sellers are running out of energy. The resumption of theadvance should be accompanied by an increase in volume, as in the example. The bigbuyers are back in, and it looks as though they will run the stock higher.
24 TRADING WITH EQUIVOLUME
ArmsInsider.com

Here is another example, in which wee see a typical lighter volume pullback beforeresuming the advance.
TRADING WITH EQUIVOLUME 25
ArmsInsider.com
2 9October
16 23 30 6November
13 20 27 4 11December
18 26 22001
8 16 22 29Febr
0.5
1.0
1.5
2.0
2.5
3.0
3.5
4.0
4.5
5.0
5.5
6.0
6.5
7.0
7.5
8.0
8.5
9.0
9.5
10.0
10.5
resistance
oversquare breakout
light volume pullback
resumption
GEOWORKS (5.125, 4.500, 4.594)
-1.0
-0.5
0.0
0.5Ease of Movement (0.03092), Ease of Movement (0.2198)
23 30 6November
13 20 27 4December
11 18 26 22001
8 16 22 29Febru
2627282930313233343536373839404142434445464748495051525354
power box
pullback
resumption
INTL RECTIFIER (47.63, 42.63, 47.13)
-3.0
-2.5-2.0-1.5
-1.0-0.50.00.5
1.01.52.02.53.03.5Ease of Movement (1.349), Ease of Movement (3.249)

WHEN TO SELL
Before ever buying a stock it is desirable to decide where to get out. There should betwo events in mind, the selling to take a profit and the selling to correct a mistake.Then, as time goes by and the position starts to move, it is necessary to continuallyreevaluate those decisions, and adjust them. Each position should be revisited at leastdaily; to be sure the situation has not changed.
Lets first look at when to get out if we are wrong; and being wrong on many positionsis inevitable. The best looking situations sometimes don’t work out. But staying with abad position can be disastrous. As soon as it looks as though the stock is not going toact as expected the position should be closed out. That means either having a stoporder entered that will take out the position automatically, or having the discipline toadmit a mistake. On the website, buy recommendations are accompanied by a suggest-ed level for a stop order.
On the stock pictured above it looked as though it was a very promising buy. After along decline there was a heavy volume washout, with an oversquare entry. After somebase building there was a sign of strength at “A” that looked like a time to buy. Thepullback to “b” was on lighter volume, suggesting the position was valid. But then thenext rally was bothersome. It lacked volume, and could not penetrate the earlier high.At “C” volume became very large as it dropped. This was unexpected, and suggested
26 TRADING WITH EQUIVOLUME
ArmsInsider.com
3July
10 17 24 31August
7 14 21 5 11September
18 25 2October
9 1 6 23 30 6November
13 20 27
20
25
30
35
40
45
50
55
60
65
70
A
B
C
washout
ALTERA (28.88, 29.75, 26.88, 29.13)
-0.5
0.0
0.5
Ease of Movement (-0.1129), Ease of Movement (-0.00775)

the stock was not acting right. A nimble trader might have thrown in the towel there.If not, there should have been a stop order below the prior low at “B”. It would havebeen executed a few days later. Either way, the stock had told us that it was not actingas expected. That, rather than a percentage rule, should be the criterion for covering aposition. In fact, not just in taking a loss, but also in any covering of a position, itshould be based upon the observation that the move is no longer acting well. After astock has moved up, and is showing a profit, it is still suggested that a stop be used as adiscipline for getting out if the stock starts to do the unexpected. We saw in the sectionon tops that a clue to the end of a move is an oversquare day. That could be consideredto be another case of “not acting right”. Later we will look at some other technicalanalysis tools, such as gaps, support and resistance levels, flags, pennants, etc. Each ofthese tools is designed to help us to see what is likely and normal in a stock’s move-ment. They will help us to know when a stock is acting “wrong” and should be sold.Even the work on objectives is meant to alert us to the unexpected. If a stock acts as weexpect, we should stay with the position, but as soon as it acts wrong, it should be gone.
On the chart below we have a good example of the many features we have been talkingabout. Notice, though, how it acts after the strong advance out of the base. It looks asthough it has penetrated another resistance area and is likely to move higher. But thenit backs off with a somewhat square entry that is worrisome. The next day it tries toresume the advance, but is unable to, even though volume is immense. The result is avery square Equivolume entry. It is clear that something is changing. The unexpectedhas come to our attention. It appears to be time to get out. Besides, the width of theadvance is just about the same as the width of the base, so our objective has been satis-fied.
TRADING WITH EQUIVOLUME 27
ArmsInsider.com

Knowing when to sell is not an easy task. A buy can be unemotional, but once a deci-sion has been made to buy, there is a reluctance to admit being wrong, and a desire totake a profit to prove being right. That leads to less objective decisions. I have found,in my own trading, that I have to force myself to sell “too soon”. When I own a stockand it has moved with me, I get to like it. That allows me to make excuses for it.Abandoning a winner is like kissing off a friend. There is a tendency to give a winnermore leeway than a loser. But that is a mistake. Just because a stock has gone up tenpoints after you bought it should not serve as a reason for allowing it to back off five ofthose points without selling it. I have had to learn to grit my teeth and abandon myfriends as soon as they disappoint me.
28 TRADING WITH EQUIVOLUME
ArmsInsider.com
November6 13 20 27 4
December11 18 26 2 8
200116 22 29 5
February
13.0
13.5
14.0
14.5
15.0
15.5
16.0
16.5
17.0
17.5
18.0
18.5
19.0
19.5
20.0
20.5
21.0
21.5
22.0
22.5
23.0
23.5
24.0
24.5
resistance
breakout
pullback
continuationsquare
KENT ELECTRONICS (21.63, 21.06, 21.63)
-3
-2
-1
0
1
2
3
4
5Ease of Movement (0.8845), Ease of Movement (2.057)

SELLING SHORT
An aggressive trader should be as willing to go short as to go long. There are two sidesto the market, and they might as well both be used. It is often argued that the shortside is more dangerous than the long side because there is no limit to losses. True, but atrader should never stay around long enough to find that out. As soon as a positionstarts to act wrong, the short should be covered.
In a way the short side is safer than the long side for a trader. That is because most upmoves take twice as long as do down moves. Therefore, if you are long, the positiongoes with you slowly but against you rapidly. Conversely, if you are short, the positiongoes with you rapidly but against you slowly. You are likely to have more time to cor-rect mistakes.
In shorting a stock using the Equivolume methodology, the principles are similar butinverted. In buying a stock we wanted to see a decline, followed by a base buildingperiod, and then a sign of strength. If we are going to sell a stock short we want to seean advance, then a sideways consolidation, and then a sign of weakness. Just as wedid not want to buy just because a stock appeared to be through going down, we do notwant to be short sellers just because it appears to have stopped going up. Rememberthat every trend has a better chance of continuing than it does of reversing. If we sell itbecause it appears to be through going up we are statistically fighting the odds. It isabout a two to one chance that the consolidation will be followed by a resumption ofthe advance rather than a break to the downside. So, before selling we have to haveinformation that tells us the trend has reversed.
A sign of a top, such as a large oversquare box, is a very good reason to take a profit ona long position, but not a reason to sell short. The stock could languish for a long timein the sideways area, so the money would be inactive.
TRADING WITH EQUIVOLUME 29
ArmsInsider.com

On the chart above we are looking at a good example of a successful short position. Inthe early part of the chart we see the last part of an advance. The start of the top build-ing process is not easily noticed. But then it makes a second top at the same level andbacks off to the support zone. But there is still no reason to be selling this stock until weget the power box to the downside. That is a definite breakdown, and a strong sugges-tion the stock will go lower. We might wait for a light volume rally to the breakdownlevel, but in this case, it never occurs. The subsequent drop is rapid and large, and cul-minates with an oversquare Equivolume entry. That is definitely a signal to cover theshort position and take the profit. It is not a signal to go long. Perhaps you end up,later, buying at a higher price, but by then you have built a base and had a sign ofstrength.
The chart below gives us another good example of a short sale. This stock, Microsoft,had a fast advance in October, which then turned into a sideways consolidation. Thepullback in early November established a support level for us to keep an eye on. Thatsupport was broken with a big trading range, although the volume was not particularlyheavy. But the next day it gapped lower, and both volume and range expanded, pro-ducing a power box to the downside. It certainly confirmed the sign of weakness wehad seen the day before. After a further slump over the next week it rallied, but onpoor volume, suggesting the decline had further to go. The decline did resume, withanother gap down and another power box to the downside. The stock fell from firstsell signal to its low point, about 30%, in just about a month. Notice also the next
30 TRADING WITH EQUIVOLUME
ArmsInsider.com
6November
13 20 27 4December
11 18 26 22001
8 16 22 29 5February
9.0
9.5
10.0
10.5
11.0
11.5
12.0
12.5
13.0
13.5
14.0
14.5
15.0
15.5
support
breakdown
oversquare low
JLG INDUSTRIES (12.000, 11.813, 11.813)
-3.0
-2.5
-2.0
-1.5
-1.0
-0.5
0.0
0.5
1.0Ease of Movement (0.2208), Ease of Movement (0.1412)

power box to the upside. It penetrates resistance and takes the stock right up to thelevel it had been in prior to the short sale.
In the long-term scheme, the market has gone up more than it has gone down.Recently it went through a seventeen year long bull market. That means investors havebeen better off owning stocks than they would have been shorting them. But tradersare dealing with shorter-term moves. For them, a long-term bull market is of little con-sequence. There are waves within the tides that allow profits in both directions. Unlessone is trading a tax-sheltered account that does not allow it, a trader should be as will-ing to go short as to go long. To not do so is to ignore half the opportunities that pres-ent themselves.
TRADING WITH EQUIVOLUME 31
ArmsInsider.com
8 5 11September
18 25 2 9October
16 23 30 6November
13 20 27 4December
11 18 26 22001
8 16 22 29 5February
12
40
45
50
55
60
65
70
75
support
break of support
power down
light vol
resumption power up
MICROSOFT (63.56, 64.63, 63.13, 64.50)
-0.10
-0.05
0.00
0.05
0.10Ease of Movement (0.04509), Ease of Movement (0.04598)

SUPPORT AND RESISTANCE
A basic observation of all technical analysis, be it Equivolume or an older method, is thereoccurrence of price levels. As a stock moves higher it will encounter levels thatrepeatedly turn it back. Often, after that resistance level is surmounted, the same levelserves as support on declines. It happens enough so that we must pay attention tothose levels. If a long position moves higher, as expected, and reaches an old resistancelevel it has to be watched very carefully. Here Equivolume can often be extremely help-ful, since we want to know more than just where the price is; we want to know howmuch difficulty it is having in moving. The box shapes are often a clue. SquareEquivolume entries at the old level are enough of a warning to justify taking profits.
On the chart above we see quite typical action. Across the center of the chart I haveinserted a horizontal line. Early in the period shown it served as resistance to upsideprogress. Later the stock moved up through that level, and subsequent declinesstopped at the same level. So the old level of resistance had become a new level of sup-port. After the stock moved back down below that line, it again acted as resistance onthe right side of the chart. In addition, we see that there is a lower level of support thathas tended to hold the stock up repeatedly. It was penetrated at the right side of thechart, but briefly, and in a manner we should have recognized as being climactic.
32 TRADING WITH EQUIVOLUME
ArmsInsider.com
30April
6 13 20 27 4May
11 18 26 1June
8 15 22 29July
13 20 27 3 10August
17 24 31 8 14September
21 28 5October
12 19 26 2 9November
23
21.522.022.523.023.524.024.525.025.526.026.527.027.528.028.529.029.530.030.531.031.532.032.533.033.534.034.535.035.536.0
resistance
support
resistance
support
FORD MOTOR (28.02, 28.74, 27.63, 28.33)
-0.15
-0.10
-0.05
0.00
0.05
Ease of Movement (0.02282), Ease of Movement (0.04518)
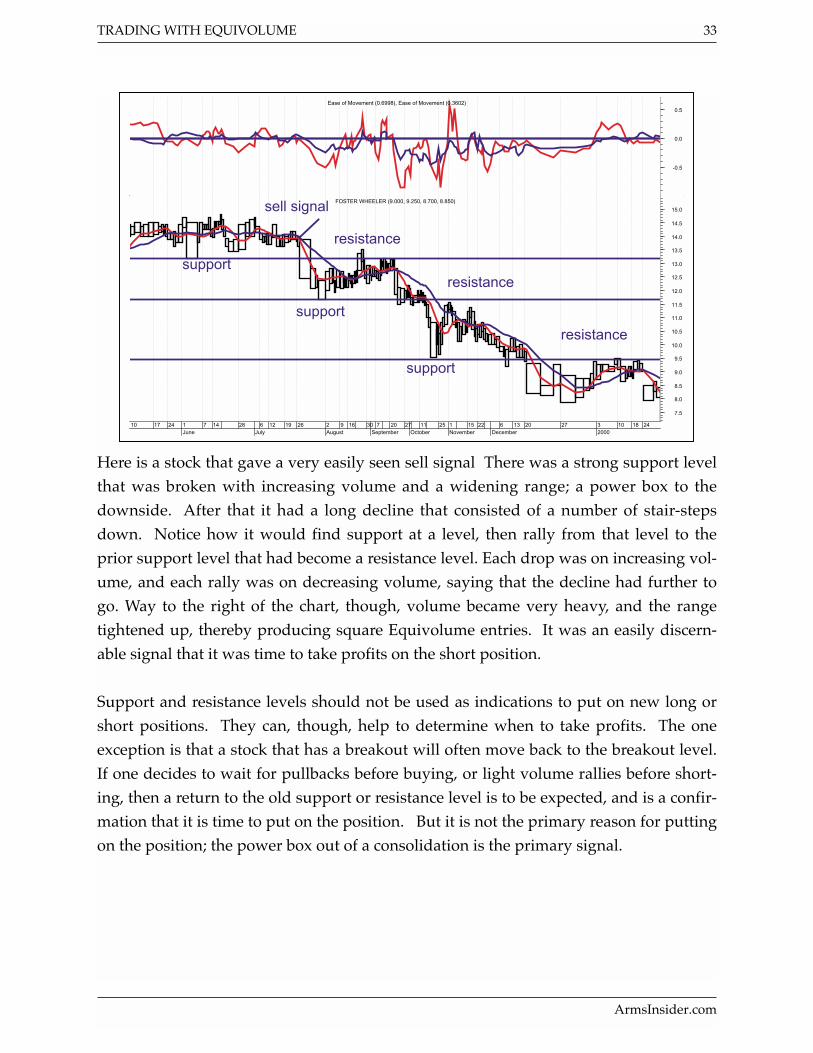
Here is a stock that gave a very easily seen sell signal There was a strong support levelthat was broken with increasing volume and a widening range; a power box to thedownside. After that it had a long decline that consisted of a number of stair-stepsdown. Notice how it would find support at a level, then rally from that level to theprior support level that had become a resistance level. Each drop was on increasing vol-ume, and each rally was on decreasing volume, saying that the decline had further togo. Way to the right of the chart, though, volume became very heavy, and the rangetightened up, thereby producing square Equivolume entries. It was an easily discern-able signal that it was time to take profits on the short position.
Support and resistance levels should not be used as indications to put on new long orshort positions. They can, though, help to determine when to take profits. The oneexception is that a stock that has a breakout will often move back to the breakout level.If one decides to wait for pullbacks before buying, or light volume rallies before short-ing, then a return to the old support or resistance level is to be expected, and is a confir-mation that it is time to put on the position. But it is not the primary reason for puttingon the position; the power box out of a consolidation is the primary signal.
TRADING WITH EQUIVOLUME 33
ArmsInsider.com
10 17 24 1June
7 14 28 6July
12 19 26 2 9August
16 30 7 20September
27 11October
25 1 15November
22 6 13December
20 27 32000
10 18 24
7.5
8.0
8.5
9.0
9.5
10.0
10.5
11.0
11.5
12.0
12.5
13.0
13.5
14.0
14.5
15.0
support
resistance
support
resistance
support
sell signal
resistance
FOSTER WHEELER (9.000, 9.250, 8.700, 8.850)
-0.5
0.0
0.5Ease of Movement (0.6998), Ease of Movement (0.3602)

Here is one more example, now on the upside. Notice how it came back down after thebreakout, and held right at the old resistance level, before going higher.
34 TRADING WITH EQUIVOLUME
ArmsInsider.com
9 26 3July
10 17 24 31 7August
14 21 28 5 11September
18 25 2October
9 16 23 30 6 13November
20 27 4 11December
18 26 22001
47
48
49
50
51
52
53
54
55
56
57
58
59
60
61
62
63
64
65
66
67
68
69
70
supportsupport
resistance
resistance
breakout
pullback
GANNETT (63.00, 63.98, 62.60, 63.98)
-1.5
-1.0
-0.5
0.0
0.5
1.0
1.5
2.0Ease of Movement (0.4104), Ease of Movement (0.2549)

TRENDLINES AND CHANNELS
So far we have been looking at horizontal lines that define the tops and bottoms of side-ways consolidation areas. But as prices move up and down they are also often con-tained within sloping lines. We tend to draw a pair of parallel lines, enclosing the pricetrend. However, the more important line is the line across tops in a decline and the lineacross bottoms in an advance. They show the levels where we have to become con-cerned. If we are short, we do not want to stay with the position if it moves out of itsdown channel to the upside. If we are long a stock, we want to cover the position if itbreaks the lower ascending trendline, indicating a loss of momentum. In addition, ofcourse, we will want to look at the type of Equivolume box involved in the reversal.Heavy volume and a big range is a much more bothersome signal than a light volumesmall penetration.
The above chart shows both a down channel and an up channel. In addition, we seehere another example of volume emphasis. All the way down, volume increases ondrops and decreases on rallies. All the way up, volume tends to pick up on rallies anddrop off on pullbacks. Particularly interesting is the Equivolume box at the transitionpoint. It is a typical power box to the upside. It penetrates the descending trendline,making it clear that it is time to cover short positions. But that box is not a signal to golong. It is only saying that the decline seems to have halted; it is not saying the stock isheaded higher.
TRADING WITH EQUIVOLUME 35
ArmsInsider.com
31August
7 14 21 28 5 11September
18 25 2 9October
16 23 30 6November
13 20 5 18December
26 22001
8 16 22 29 5February
12
17
18
19
20
21
22
23
24
25
26
27
28
29
30
31
32
33
34
35
36
37
38
39
40GAP (32.00, 32.90, 31.70, 32.64)
-0.35-0.30-0.25-0.20-0.15-0.10-0.05-0.000.050.100.150.200.250.300.35Ease of Movement (0.1701), Ease of Movement (0.07269)
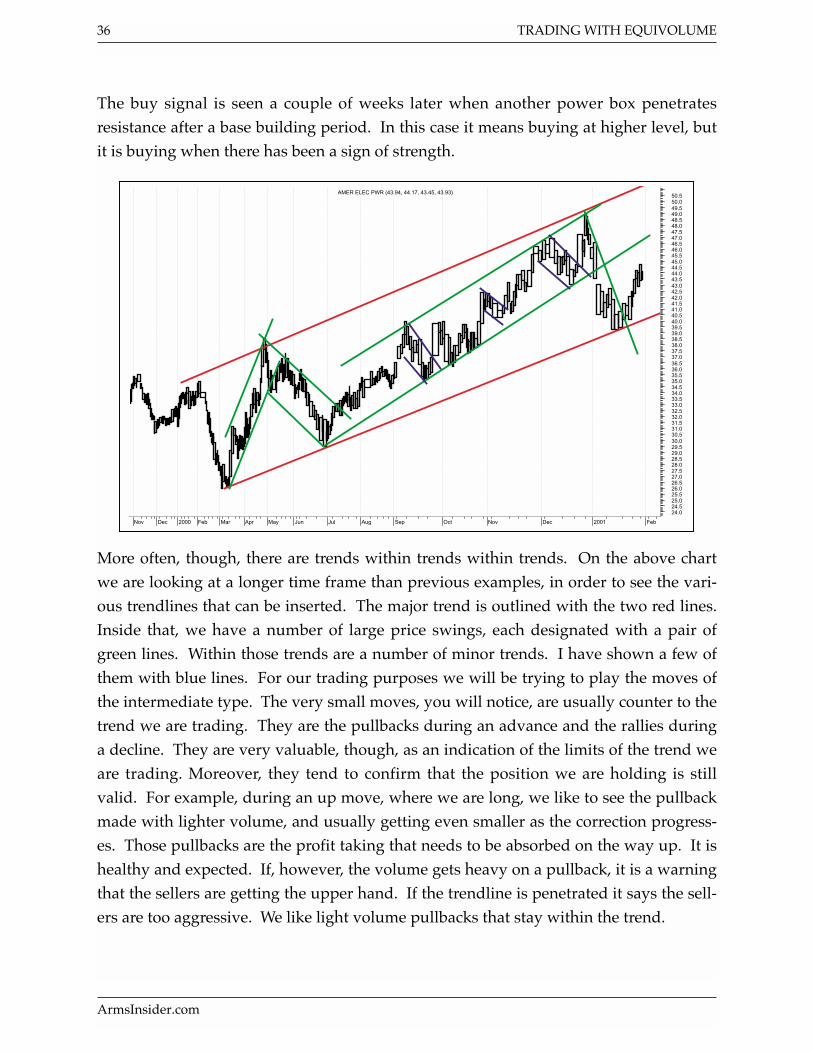
The buy signal is seen a couple of weeks later when another power box penetratesresistance after a base building period. In this case it means buying at higher level, butit is buying when there has been a sign of strength.
More often, though, there are trends within trends within trends. On the above chartwe are looking at a longer time frame than previous examples, in order to see the vari-ous trendlines that can be inserted. The major trend is outlined with the two red lines.Inside that, we have a number of large price swings, each designated with a pair ofgreen lines. Within those trends are a number of minor trends. I have shown a few ofthem with blue lines. For our trading purposes we will be trying to play the moves ofthe intermediate type. The very small moves, you will notice, are usually counter to thetrend we are trading. They are the pullbacks during an advance and the rallies duringa decline. They are very valuable, though, as an indication of the limits of the trend weare trading. Moreover, they tend to confirm that the position we are holding is stillvalid. For example, during an up move, where we are long, we like to see the pullbackmade with lighter volume, and usually getting even smaller as the correction progress-es. Those pullbacks are the profit taking that needs to be absorbed on the way up. It ishealthy and expected. If, however, the volume gets heavy on a pullback, it is a warningthat the sellers are getting the upper hand. If the trendline is penetrated it says the sell-ers are too aggressive. We like light volume pullbacks that stay within the trend.
36 TRADING WITH EQUIVOLUME
ArmsInsider.com
Nov Dec 2000 Feb Mar Apr May Jun Jul Aug Sep Oct Nov Dec 2001 Feb
24.024.525.025.526.026.527.027.528.028.529.029.530.030.531.031.532.032.533.033.534.034.535.035.536.036.537.037.538.038.539.039.540.040.541.041.542.042.543.043.544.044.545.045.546.046.547.047.548.048.549.049.550.050.5
AMER ELEC PWR (43.94, 44.17, 43.45, 43.93)

GAPS
Often a stock will have a gap in its trading pattern; an area of prices where no tradinghas occurred. It happens when a stock opens sharply higher or lower than the priorday’s trading range, and never moves back into that area. Classic technical analysisclassifies them as one of four types, depending upon where they occur. They can betrading range gaps, breakaway gaps, runaway gaps or exhaustion gaps. UsingEquivolume we find that the volume makes it far easier to see what kind of gap we aredealing with, and therefore, what we are likely to see for price movement after the gap.
A trading range gap usually consists of two boxes of about the same size and shape onboth sides of the gap, and usually is not accompanied by the penetration of an impor-tant support or resistance level. It is a gap of little meaning.
A Breakaway gap is usually quite dramatic. The stock moves up or down out of a side-ways area, with so much power that it leaves a gap behind. It is a power box, as wehave seen earlier, but even more so. In a breakaway gap we see both volume and pricerange expand across the gap. That means, a small Equivolume box followed by a largeEquivolume box, and one that is quite tall for its width. A breakaway gap is a strongsignal to buy or sell, depending upon its direction.
A Runaway gap is seen when a stock is rising or dropping so fast that it leaves holes inthe trading along the way. It is a sign of a very emotional move, and usually impliesthat the move has further to go. It is identified by two boxes, both large, and both tallfor their width. It is like two power boxes separated by a gap.
An exhaustion gap is a sign a move is ending. It is characterized by a tall thin box fol-lowed, after the gap, by a short wide box. It shows us that a very powerful move hassuddenly encountered a barricade to further movement. It is like the oversquare boxeswe were looking at earlier, but preceded by a gap. It is usually a strong sign to closeout a position.
TRADING WITH EQUIVOLUME 37
ArmsInsider.com

On the chart above we see a number of gaps. They have been labeled to show whatkind of gaps the box shapes say they are.
Some stocks form many gaps, and others form very few. But whenever a gap isencountered it should be considered and categorized. Gaps are a strong indication ofwhere the price is going to go.
38 TRADING WITH EQUIVOLUME
ArmsInsider.com
31 7Aug
14 21 28 5Sep
11 18 25 2Oct
9 16 23 30Nov
6 13 20 5Dec
11 26 82001
16 22 29 5Feb
12
2.5
3.0
3.5
4.0
4.5
5.0
5.5
6.0
6.5
7.0
7.5
8.0
8.5
9.0
9.5
10.0
10.5
11.0
11.5
12.0
12.5
13.0
runaway
exhaustion
breakaway
breakaway
trading range
exhaustion ?
READ RITE (10.19, 9.688, 10.00)

CONCLUSIONS
An aggressive trader needs to use every bit of information available, and must makeunemotional decisions based on that information. But the deluge of fundamental infor-mation in the marketplace is overwhelming. Moreover, there is no way that a tradercan see every piece of information that may influence the price of the stocks he is trad-ing. And even if he could see all the information, he would still be lacking the mostimportant ingredient, which is the psychological effect of that news. It is useless toknow the news and not know how it is going to influence the thinking of all the mil-lions of people who are reacting to that information. What is needed is a machine thatwill assimilate every known piece of information, ascertain the psychological responseto that information, and apply it to the price of a stock.
Luckily that machine exists. It is the market itself. Every tiny bit of information thatcould influence and engender an emotional response does so. People buy and sellstocks in answer to those emotional responses. Those responses are reflected in justtwo final pieces of information, the price and the volume. All a trader needs to do, isobserve the way in which price and volume are exhibiting themselves in the market-place in order to know exactly how the world is evaluating all of the informationknown, or even suspected, concerning that stock.
Equivolume charting does not look at any new information; it just looks at the sameinformation in a more easily interpreted format. It allows us to more easily ascertainhow prices are changing, rather than just seeing that they are changing. It shows theinternal dynamics of a stock. Volume is treated as an equal partner to price, rather thanan afterthought at the bottom of the page.
None of the methods we have covered are foolproof. There are always going to be loss-es as well as gains. The objective is to have more good trades, and larger profits on thegood trades, than losses on the bad ones. To do so calls for discipline and objectivity.That means not only reveling in the successes, but accepting the failures and movingon. It also means having the strength to quickly move out of a position as soon as theevidence says it is time to do so. It means no stock can be your friend or your enemy. Itis just a stranger who can take you where you need to go. When you get there you paythe fare and get off. The stranger who is doing the driving does not care where youwant to go. You have to know where he is headed.
TRADING WITH EQUIVOLUME 39
ArmsInsider.com

Successful trading is not based on luck. It is based on knowledge and ability. I like thewords of a song recorded by Kenny Rogers that say:
You’ve got to know when to hold them,Know when to fold them,Know when to walk away,
Know when to run.
You never count your moneyWhen you’re sitting at the table
There’ll be time enough for countingWhen the dealing’s done.
TRADING WITH EQUIVOLUME 40
ArmsInsider.com