trading across bordersmddb.apec.org/documents/2010/cti/wksp/10_cti_wksp1_005.pdf9/21/2010 3 what is...
TRANSCRIPT

___________________________________________________________________________
2010/SOM3/CTI/WKSP/005
Trading Across Borders
Submitted by: World Bank
Ease of Doing Business Workshop on Trading Across Borders
Sendai, Japan18-19 September 2010

9/21/2010
1
Trading across BordersgAPEC Ease of Doing Business Workshop
Mikiko Imai Ollison
Doing Business Team
1
18 September, 2010
Sendai, Japan
1. What is Doing Business and the Trading
across Borders indicator?
Presentation outline:
across Borders indicator?
2. How do we measure it and who are the best
performers?
3. Trade facilitation reforms3. Trade facilitation reforms

9/21/2010
2
1. What is Doing Business and the Trading
across Borders indicator?
Presentation outline:
across Borders indicator?
2. How do we measure it and who are the best
performers?
3. Trade facilitation reforms3. Trade facilitation reforms
What is the Doing Business project?
Initiated 8 years ago to provide an objective basis for understanding and i i th l t i t fimproving the regulatory environment for business
Measure and rank 183 economies
Focus on regulations relevant to the life cycle (starting, operating and closing a business) of a small to mediumoperating and closing a business) of a small to medium-sized domestic business based under standardized case.
DOES NOT measure all aspects of the business environment.

9/21/2010
3
What is the Trading Across Borders indicator?
One of the Doing Business indicators
Time and cost (excluding tariffs) associated to exportingand importing by ocean transport, and the number of documents necessary to complete the transaction
Rankings are based on these 3 sub-indicators
1. What is Doing Business and the Trading
B d i di t ?
Presentation outline:
across Borders indicator?
2. How do we measure it and who are the best
performers?
3 Trade facilitation reforms3. Trade facilitation reforms

9/21/2010
4
Case Study
• Exporting and importing from the largest business city in the country
• to/from the country’s largest overseas trade partner
• via ocean transport using the primary seaport used for that city
• in a dry cargo 20-ft full container load (FCL), weighs 10 tons and is valued at US$20,000.
• Product is one of the country’s leading export and import products, and is
o not hazardouso not include military itemso not require refrigeration or any other special environmento not require special phytosanitary or environmental safety standards
• Payment is through a Letter of Credit
• Company does not operate within an export processing zone or other special export/import privileges
Document preparation
Inland
transportation
Customs and other border
agency
Ports and terminal handling
EXPORTING
4 processes in trade to measure TIME and COST
• L/C
•Other documents (customs declaration forms, etc)
•Customs
•Inspections
•Technical/health
•Security
•Packing
•Arranging for transport
•Transport
•Loading and unloading
•Waiting for vessel
•Loading and unloading
•Terminal unloading
handling
Documentpreparation
Inland transportation
Customs andother border
agency
Ports andterminalhandling
IMPORTING

9/21/2010
5
All required trade-related DOCUMENTS are counted
• Examples of documents
Commercial: commercial invoice, packing list, bill of lading Customs: customs export/import declarations, export/import license Port authorities: terminal handling receipts Other agencies: certificate of origin inspection report technical certificate Other agencies: certificate of origin, inspection report, technical certificate
• Varies greatly across countries:
France 2 documents for importing: customs import declaration& bill of lading
Central African Republic17 documents for importing:bill of lading; border crossing authorization; cargo release order; collection order; commercial invoice; customs attestation; customs import declaration; l t i t ki i t (BESC) f S101
VS.
• NOTE: Letter of credit is assumed between parties and therefore not counted as a document, unless explicitly required by customs (ex: Nepal)
electronic cargo tracking receipt (BESC); form S101 (Transit document); import license; insurance certificate; packing list; pre-shipment inspection clean report of findings; tax certificate; technical standard / health certificate; terminal handling receipts; truck manifest (feuille de route)
How long does it take to trade?
11
5
5
4
Time to import (days)
7
6
6
5
Canada
Hong Kong, China
United States
Singapore
Time to export (days)
14
16
15.9
17
13
12
11
9
8
8
11
18
16
15.9
14
14
13
10
10
9
8
7
Malaysia
Philippines
APEC AVERAGE
Mexico
Thailand
Chinese Taipei
Japan
New Zealand
Australia
Korea
36
19
29
24
21
27
24
21
14
36
28
26
23
22
21
21
21
18
Russia
Brunei Darussalam
Papua New Guinea
Peru
Vietnam
Indonesia
China
Chile
y

9/21/2010
6
How much does it cost to trade?
545
439
450
500
456
450
China
Singapore
Malaysia
Cost to export (US$ per container)Cost to import (US$ per container)
938 9
819
940
795
742
732
660
722
708
583
795
816
756
745
742
720
704
664
630
625
625
APEC A
Philippines
Vietnam
Chile
Korea
Chinese Taipei
Indonesia
Papua New Guinea
Brunei Darussalam
Hong Kong, China
Thailand
1,850
1,660
2,050
1,119
1,315
1,047
895
850
938.9
1,8501,610
1,472
1,060
1,050
989
875
868
867.0
Russia
Canada
Mexico
Australia
United States
Japan
Peru
New Zealand
APEC Average
How many document is needed to trade?
4
3
4
3
Documents to import (number)
4
4
3
3
Hong Kong, China
Thailand
Canada
Korea
Documents to export (number)
8
7
6
5
6.0
6
5
55
4
6
6
6
6
5.62
5
5
4
4
4
4
Vietnam
Chile
Brunei Darussalam
Australia
APEC AVERAGE
Indonesia
Mexico
United States
Japan
Singapore
g g,
13
8
98
7
7
5
5
8
8
7
7
7
7
7
7
6
Russia
Philippines
Papua New Guinea
Peru
Malaysia
Chinese Taipei
New Zealand
China

9/21/2010
7
In which region is it easy to trade across borders?
Region
Importing Exporting
Time (days) Cost Documents Time (days) Cost Documents (per US$ container)
(number) (per US$ container)
(number)
Asia-Pacific Economic Cooperation
15.9 938.9 6.0 15.9 867.0 5.6
East Asia & Pacific (EAP) 24.3 952.8 7.1 23.1 909.3 6.7
European Union (EU) 12.7 1,102.7 5.3 11.8 1,038.8 4.5
Latin America and Caribbean
20.9 1,481.0 7.3 18.6 1,243.6 6.8
Organization for Economic Co-Operation andDevelopment (OECD)
11.5 1,136.5 4.9 10.8 1,082.4 4.4
Where is it easiest to trade? What do they have in common?
1. Singapore
2. Hong Kong, China
3 Estonia
Global good practice
Paper-free electronic data interchange (EDI) system.
3. Estonia
4. Finland
5. United Arab Emirates
6. Denmark
7. Sweden
8. Korea, Rep.
9. Norway
10 P
Pre-arrival submission of customs declaration and manifest.
Less than 10% of containers are physically controlled, using risk based inspection systems.
10. PanamaSingle Window for obtaining trade documents and approvals
Efficient ports and transportation infrastructure

9/21/2010
8
1 Wh t i D i B i d th T di
Presentation outline:
1. What is Doing Business and the Trading
across Borders indicator?
2. How do we measure it and who are the best
performers?performers?
3. Trade facilitation reforms
Trade facilitation reforms – why it matters?
Gains for firms:
Savings in cost and time
Opportunities to be part of global production networks
Gains for governments:
Increase in revenue
Savings in cost and timeg

9/21/2010
9
Korean firms benefit through the implementation Single Window
Trade facilitation enable Rwandan customs to clear more transactions
Average number of customs transaction cleared per custom
official increases 30%in 3 years In 2006, 203 customs
officials cleared 89,346 trading transactions. In 2009, the staff number grew to 246, but they cleared 150,263 transactions.
2006 2009

9/21/2010
10
The trade facilitation reforms impacted lower income countries the most
19
The most popular reforms include
Albania Angola Bangladesh Benin Colombia AlbaniaColombia GuyanaHaitiJordan Kuwait Mali Mauritius Paraguay Senegal Slovakia
Albania Azerbaijan Belarus Cameroon GeorgiaIran JordanKyrgyz Rep. LiberiaMalawi
Angola Armenia China G i
DR Congo Haiti
Angola Armenia Belarus BeninGeorgiaGrenada IranKuwait
20
St. Kitts & Nevis Sudan Tunisia Uganda Yemen
Mali Mozambique Paraguay Sudan Yemen
Georgia Kyrgyz RepMali Rwanda UAE
HaitiKuwait PeruSenegal UAE
MozambiquePortugal Rwanda Uganda Vietnam
EDI system implementation
Risk based inspections
Customs administrative
reforms
Document requirement
reduction
Terminal handling process
improvement
9/21/2010
11
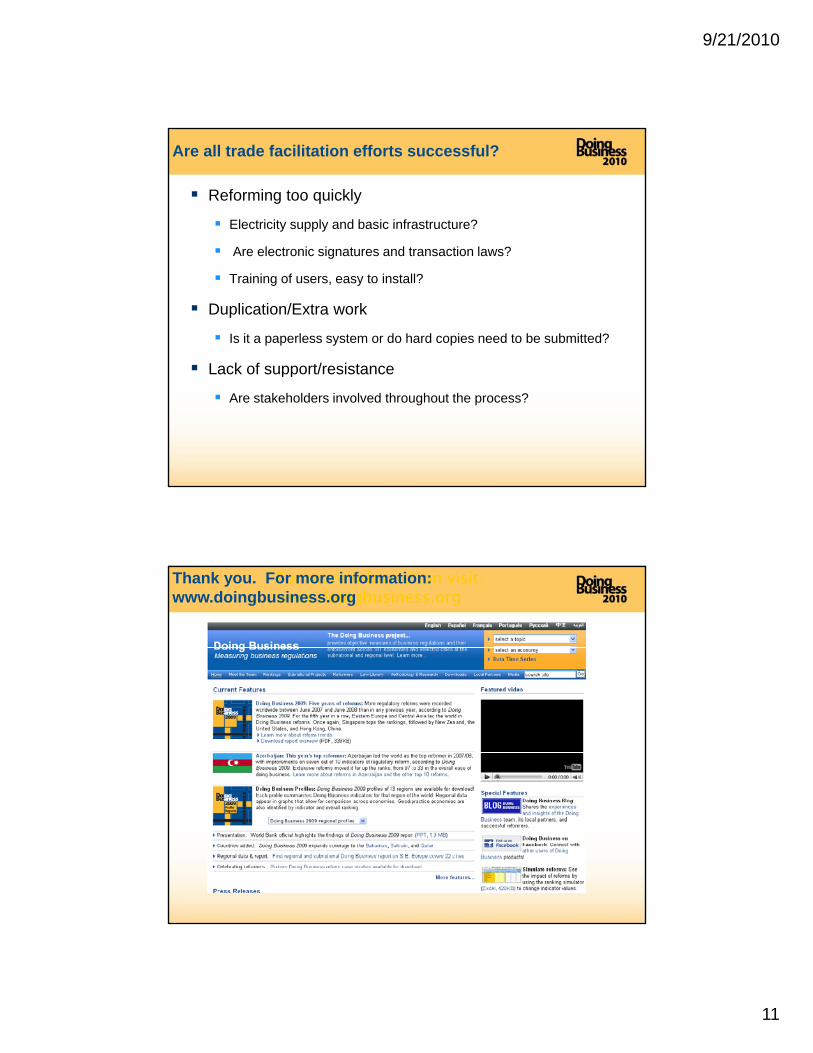
Reforming too quickly
Electricity supply and basic infrastructure?
A l t i i t d t ti l ?
Are all trade facilitation efforts successful?
Are electronic signatures and transaction laws?
Training of users, easy to install?
Duplication/Extra work
Is it a paperless system or do hard copies need to be submitted?
Lack of support/resistance Lack of support/resistance
Are stakeholders involved throughout the process?
For more information visit: www.doingbusiness.org
Thank you. For more information:www.doingbusiness.org