trade restrictiveness in the cemac region the case … · fee, ohada levy, and others), not allowed...
TRANSCRIPT
WP/08/15
Trade Restrictiveness in the CEMAC Region: The Case of Congo
Maria A. Oliva


© 2008 International Monetary Fund WP/08/15 IMF Working Paper Policy Development and Review
Trade Restrictiveness in the CEMAC Region: The Case of Congo
Prepared by Maria A. Oliva
Authorized for distribution by Thomas Dorsey
January 2008
Abstract
This Working Paper should not be reported as representing the views of the IMF. The views expressed in this Working Paper are those of the author(s) and do not necessarily represent those of the IMF or IMF policy. Working Papers describe research in progress by the author(s) and are published to elicit comments and to further debate.
Congo’s vital dependence on trade for development stands in contradiction with its trade policy. As a member of the CEMAC, Congo’s tariff scheme at least formally is guided by CEMAC’s 1994 trade regime agreement. This paper shows CEMAC’s customs code is restrictive relative to that of comparable regional integration groups. The paper also discusses a number of quantitative and qualitative barriers to trade applied by Congo that render its current regime complex, nontransparent, and relatively unpredictable, compromising efforts to develop the non-oil sector and the country’s export base. Moreover, Congo’s high tariffs and other taxes have not led to higher fiscal revenues, as the number of exemptions granted in recent years has surged and customs administration remains weak. JEL Classification Numbers: F13, F53 Keywords: Tariff barriers, nontariff barriers, exemptions, customs revenue, CEMAC Author’s E-Mail Address: [email protected]

2
Contents Page
I. Introduction ............................................................................................................................3
II. Congo and the CEMAC Zone: An Overview ......................................................................4
III. CEMAC Trade Regime........................................................................................................7
IV. Congo’s Trade Regime: Theory and Practice....................................................................13
V. Congo’s Trade Regime and Revenue Collection................................................................19
VI. Regional Integration and other Partnerships......................................................................22
VII. Policy Recommendations: Trade Reform and Growth ....................................................24
Reference .................................................................................................................................27 Tables 1. CEMAC’s Tariff Code: Summary of Main Instruments .......................................................8 2. The Common External Tariff by Regional Agreement .........................................................9 3. The Use of Non-Tariff Barriers ...........................................................................................12 4. Business–Related Non-Tariff Barriers, 2006.......................................................................13 5. Congolese Tariff Code. Summary of Main Instruments......................................................14 6. Revenue from Trade Taxation, by Instrument.....................................................................15 7. Congo’s Use of Nontariff Barriers.......................................................................................18 8. Revenue from Taxation of International Trade ...................................................................20 9. Congolese Exemptions to Trade ..........................................................................................21 10. U.S. and Congo Trade Relations: The AGOA Program....................................................22 Figures 1. Africa’s Spaghetti Bowl.........................................................................................................5 2. The Density Function of CEMAC and WAEMU’s MFN Tariff Schemes..........................10 3. Rep. Congo Customs Duties and Imports............................................................................19 4. The Fiscal Revenue Impact of Suppressing Exemptions.....................................................22 Boxes 1. The Case of Cement.............................................................................................................16 Appendix Tables 1. Average MFN Rates by Region and Sector.........................................................................28 2. CEMAC and WAEMU’s Tariff Rates.................................................................................29 3A. Business-Related Nontariff Barrierrs, 2006......................................................................31 3B. Trade Related Nontariff Barriers, 2006.............................................................................32

3
I. INTRODUCTION
External trade is vital to Congo’s economy. Oil exports are an essential source of government revenue, and Congolese consumers rely heavily on imports of food, machinery, transportation equipment, medicines, and other goods. In 2005, the ratio of merchandise trade to GDP amounted to 137 percent—a ratio that has remained quite stable over time (Oliva 2007). Yet, Congo’s trade system is plagued with trade barriers that strain the country’s capacity to rebuild from years of civil war and to progress toward the Millennium Development Goals (MDGs).
This paper examines Congo’s trade policy—which is, at least officially, mainly defined by its commitments under the Communauté Economique et Monétaire de l’Afrique Centrale1 (CEMAC), a customs union established in 1994, and its commitments as a member of the World Trade Organization (since 1995). In addition to identifying trade-related bottlenecks that keep Congo from fully integrating into the multilateral trading system, the paper compares Congolese trade policies with those of other customs unions within the region—West African and Monetary Union (WAEMU), East African Customs Union (EAC), and Southern African Customs Union (SACU)— and outside the region—Mercosur and the European Union. The paper also reviews Congo’s agreements with the European Union, the United States, and the WTO.
There is relatively little information on Congo’s trade policies. To date, papers examining CEMAC performance exclude Congo from the analysis due to the lack of recent information on trade flows and trade policies. The most recent data on imports and exports incorporated in the TRAINs database, published by UNCTAD, dates back to 1995. The exceptions include the World Trade Organization (WTO) trade policy report of September 2006 and the U.S. data on United States-Congo trade exchanges under the African Growth and Opportunity Act (AGOA). The 2006 WTO report is the first report on Congo during its 11 years of WTO membership and its over 30 years as a member of the GATT2. Trade flows data, however, rely on mirror statistics from trading partner countries. Congo joined the WTO in 1995, but did not subscribe to a number of agreements, exempting the country from reporting some types of data. This paper takes stock of the information available and identifies the main distortions derived from CEMAC’s framework and those stemming from Congolese current practices.
The CEMAC trade policy framework appears to be quite restrictive relative to that of other comparable regional integration groups. With an average common external tariff of about 19 percent, CEMAC’s average Most Favored Nation (MFN) tariff rate exceeds by at least 50 percent that of comparable customs unions included in the study. Moreover, the CEMAC duty regime also displays relatively high dispersion.
1 The CEMAC region comprises Cameroon, the Central African Republic, Chad, the Republic of Congo, Equatorial Guinea, and Gabon.
2 Republic of Congo became a member of GATT in May 3, 1963.
4
Congo’s trade regime appears to be less transparent, and more restrictive than that envisaged under the CEMAC framework, which is considered restrictive. Congo’s applied trade policy appears to be more complex than its official policy as it is complemented by a number of other taxes, not contemplated in the engagements taken under the WTO3 and its regional agreements, and by a number of non-tariff barriers that include quantitative measures like licensing procedures and price fixing and less transparent qualitative measures.
Congo’s trade-related revenue collection has declined as a share of fiscal revenues and of trade in goods and services. Higher tariffs and taxes have not translated into higher revenues. Part of the explanation can be found in the exceptionally high number of exemptions granted to certain imports, and the discriminatory application of these tariffs in practice. Overall, the regime is plagued by measures and practices that burden external trade with distortions and inefficiencies that jeopardize the diversification of the economy and do not generate additional revenues.
The paper is organized as follows. Section II presents an overview of the main economic traits of the Republic of Congo, in particular, and of CEMAC countries, in general. It identifies the challenges CEMAC countries face ahead and for which trade policy has an important role to play. Section III summarizes CEMAC’s trade regime. Sections IV and V examine Congo’s use of tariffs, para-tariffs and nontariff measures, and their revenue impact. Section VI summarizes Congo’s partnerships and preferential agreements. Finally, Section VII discusses the benefits of trade, provides some policy recommendations, and proposes the design of a medium term diversification strategy for Congo’s production structure.
II. CONGO AND THE CEMAC ZONE: AN OVERVIEW
Africa’s extended overlapping trade agreements coexist with de facto high levels of trade protectionism and uncertainty. (Figure 1 illustrates the spaghetti bowl of Africa’s overlapping trade agreements). Currently, Africa has 14 regional trade arrangements, 3 of which are in Central Africa: the Economic Community of Central African States (ECCAS), the Central African Economic and Monetary Community (CEMAC), and the Economic Community of Great Lakes Countries (CEPGL). Of the 53 African countries, only 6 belong to a single regional economic community; 26 belong to two regional economic communities; 20 belong to three such regional agreements; and one to four of them (UNECA 2006). Congo is not an exception, as officially it is a member of CEMAC and ECCAS. In practice, however, Congo’s trade policy is mainly defined by its engagements under CEMAC.4 By the end of 2006, ECCAS members5 agreed to establish a free trade 3 Some applied rates exceed WTO-agreed bindings, and a number of para-tariff instruments (i.e., automation fee, OHADA levy, and others), not allowed under CEMAC dispositions and bounded to zero under the WTO, are de facto non-zero (WTO 2006).
4 CEMAC succeeded the Customs and Economic Union of Central Africa (UDEAC) in 1994. Under CEMAC, member countries agreed to liberalize trade and establish a single market. As such, members agreed to abstain from (i) introducing new import and export duties, (ii) increasing established duties, or (iii) adopting any equivalent tax that could affect commercial exchanges among members. They also agreed not to introduce new quantitative restrictions on imports or exports (or introduce new measures with equivalent effects and not contemplated as exceptions to the rule). See Doe (2006a, b).

5
area, which would require Congo to adopt a zero-duty rate on intra-ECCAS imports. To date, however, Congolese law has yet to incorporate the terms of the new free-trade area agreement (WTO 2006). Overlapping membership is often associated with weak implementation of commitments, incompatibility of agreed trading schemes, the duplication of efforts, and lack of transparency, credibility, and predictability of the trade regime in place.
Figure 1: Africa’s Spaghetti Bowl
5 Economic Community of Central African States (ECCAS) was created in 1983 and it comprises 11 members—Angola, Burundi, Cameroon, Congo, Gabon, Equatorial Guinea, Central Africa, Democratic Republic of Congo, Rwanda, Sao Tomé and Principe and Chad. In July 2004, members approved the creation of a free trade area (FTA) to be in place by January 1, 2008. To date, there are no details on exemptions, rules of origin, and other measures to be put in place.

6
The signing of regional arrangements, however, has not translated into deeper economic integration in Central Africa. Back in 1994, the CEMAC customs union was seen as an important step towards the integration of Central Africa and the liberalization of the region’s trade policies. More than a decade later, however, the outcome is far from encouraging. Little progress has been made: intra-regional trade remains sluggish; the implementation of the agreement has been poor; numerous cumbersome, nontransparent and costly procedures continue to hamper trade flows and impeding the efficient allocation of resources; exemptions are rampant and often applied on a discretionary basis; and surveillance mechanisms (through the CEMAC secretariat) are limited (see Gulde-Wolf et al. 2006). Moreover, as it stands today, the 1994 framework is perceived as broadly outdated vis-à-vis comparable agreements such as the WAEMU.
What features distinguish CEMAC from other custom unions? The economies of the CEMAC region share a number of distinctive structural traits, including high dependence on oil and forestry, volatile economic growth, weak intra-regional linkages, lack of transportation infrastructure, political instability and security problems, juxtaposition of wealthy coastal and poorer landlocked economies. Besides, the zone is economically dominated by two countries—Cameroon and Gabon—whose economies account for more than two-thirds of the region’s GDP. Moreover, with an estimated 2005 population of 30 million, CEMAC’s six member countries depend on imported food, largely owing to the region’s low agriculture productivity and the large number of people moving from rural to urban areas. As also identified in Zafar and Kubota (2003), from a trade perspective, the CEMAC zone is characterized by:
High dependence on oil and forestry. Offshore oil extraction is particularly important in the
region, and especially in the Congolese economy. In Congo, oil exports account for about 90 percent of total exports, followed by wood exports, which account for about 8 percent of total exports. This high dependence on natural resource exports could lead to mistakenly conclude CEMAC countries lack economic complementarities. The development of the non-oil sector should, however, bring forward underlying complementarities that permit enhancing trade in the region.
Limited intraregional trade. CEMAC’s intra-regional trade is relatively low (an estimated
3 percent of total trade as opposed to about 9.4 percent for WAEMU), though it is close to the levels predicted by the standard gravity models other control for economic size and distance (Masson and Pattillo 2005). Trade between CEMAC and WAEMU is almost nonexistent, while trade between CEMAC and France is more than 10 times CEMAC’s intraregional trade.
Lack of economic complementarities. Most CEMAC economies share similar structural
characteristics and undiversified production structures. Exports tend to be dominated by a few primary products, mainly natural resources: Congo, Equatorial Guinea, and Gabon primarily export oil; the Central African Republic exports diamonds; and Chad exports oil and cotton. The lack of diversification stems from poor infrastructure, a weak banking system, nontransparent trade policies, social instability, and other factors.
7
High tariff and nontariff barriers. A broad gamut of policies in place is thwarting trade, especially with neighboring markets. Traditionally, the CEMAC markets have been sheltered from competition with high tariff and nontariff barriers in all sectors other than unprocessed raw materials (Hinkle et al 1997). Political and administrative obstacles, as well as poor transportation and telecommunications infrastructure, have reinforced market segmentation and further hindered regional trade integration. Moreover, CEMAC’s trade structure resembles a “hub and spoke” arrangement, in which France is the hub and the CEMAC economies are the spokes, with weak intra-regional linkages.
Factor mobility is de facto minimal. Despite wage differentials and absence of formal
migration barriers, labor factor mobility remains negligible. Lack of a common CEMAC passport and visa requirements, high unemployment levels, and other factors limit worker mobility.6 Moreover, regional financial integration remains low, despite the region having a common currency and a regional institutional framework with a shared central bank (BEAC) and bank supervisor (COBAC), a common legal framework, and regional decision-making bodies (IMF 2006).
CEMAC countries’ lack of complementarities and narrow export base are an endogenous outcome of current institutional and organizational constraints. Diversification of the economic structure and the creation of a business environment that promotes entrepreneurship are both endogenous outcomes that respond to appropriate policies on: (1) physical variables such as investment growth and human capital; (2) trade and industrial development; (3) macroeconomic variables including monetary policy, and fiscal policy, and exchange rate stability; (4) institutional variables such as governance and investment climate, and (5) structural policies that strengthen infrastructure, and market access improvements, among others (see, for example, Eifert et al 2005).
III. CEMAC TRADE REGIME
There are strong arguments for reforming CEMAC trade policies. Back in 1994, the CEMAC agreements were seen as a step forward towards trade liberalization. Today, the consensus is that the framework, while not having been fully implemented, lags well behind many other regional initiatives. In June 2005, at a summit in Malabo, Equatorial Guinea, CEMAC Heads of State seconded calls for progress in implementing and reforming the CEMAC trade regime. This message was reiterated in the April 2007 CEMAC Heads of State summit, which concluded with calls for removing the 30 percent tariff rate. Gulde-Wolf et al. (2006) propose a number of measures to improve policy implementation and reform CEMAC’s trade policy framework.
6 In the last CEMAC meeting held in Chad last August 2006, there were calls to adopt a regional passport, originally envisaged for 2003.

8
CEMAC’s 1994 Trade Regime CEMAC’s import regime is based on three pillars: the Common External Tariff (CET), a preferential duty rate, and legislation on franchises. The CET is the main component of CEMAC countries’ import taxation regime. It comprises: an import duty ranging from 5 to 30 percent, depending on the import in question, and a temporary surcharge that could not exceed 30 percent of the import’s customs value, which was supposed to be phased out by 1999. As of January 1998, the preferential tariff rate, applicable to CEMAC’s intra-regional trade, is officially 0 percent. Table 1 summarizes the main instruments that constitute the formal basis of CEMAC trade policy (and of Congo trade regime by default).
Term Base Rate Comments 1/
5% Basic goods10% Primary goods and equipment20% Intermediary goods and others30% Consumption goods
Statistical Tax Customs value 0-2%
Value Added Tax (VAT) Customs value + CET 18.0%Excise taxes Customs value + CET 0-25%
Source: CEMAC Code (2001) and IMF Staff.1/ The CEMAC code specifies the applicable rates by tariff line.
Applicable to Domestic Production and Imports
Table 1: CEMAC's Tariff Code: Summary of Main Instruments
Customs value
Customs value ([cif price + transporation costs+ assurances + other costs] * exchange rate * adjusting coefficient )
Common External Tariff (CET)
Applicable to Imports
CEMAC’s 1994 trade regime also contemplates levying a statistical tax and some taxes and duties on all external trade, including intra-CEMAC trade. Applied rate levels for these taxes and levies, which must fall within a predetermined range, are determined at the country level. CEMAC-compatible border measures include a statistical tax, with a rate on imports that cannot exceed 2 percent. The statistical tax is assumed to cover the costs of computerizing customs processes, data collection and administrative costs. In practice, however, the members earmarked a separate tax to cover computerization costs. Domestic taxes applied on a non-discriminatory basis include: an excise tax, with a basic rate of 0–25 percent of the customs value; and the value-added tax (VAT), with a basic rate of 15–18 percent. The excise and VAT taxes apply to domestic consumption spending.
Under the CEMAC trade code, all tariffs are ad-valorem and, at least officially, are applied to the imports’ customs transaction value. WTO rules require an item’s customs value to be based, under normal circumstances, on its transaction import value rather than on a reference value derived from a preexisting list of reference prices. Reference valuation has sometimes been linked to discretionary and corruption practices. CEMAC countries have had some difficulty in the application of transaction-based import valuation and have continued to rely, at least occasionally, on a reference-value’s approach (WTO 2006).

9
CEMAC’s Import Regime and the Common External Tariff CEMAC’s Common External Tariff (CET) framework is more restrictive than that of other similar arrangements. The CET is a key part of CEMAC countries’ import taxation regime. It is applied to imports’ customs value and it ranges from 5 to 30 percent. WAEMU’s maximum rate is 20 percent. In 2005, Congo’s average MFN rates remained well above the rates of other similar customs unions. Table 2 summarizes average MFN rates (the rate is the same for all CEMAC countries) for 2005 as reported by the TRAINs database.
CEMAC’s average MFN tariff, at about 19 percent, exceeds by at least 50 percent that of other comparable customs unions. Indeed, CEMAC unweighted average MFN rate is about 50 percent higher than that applied in Kenya under the East African Customs Union, 60 percent higher than that of WAEMU members, and about 140 percent higher than that being applied by South Africa under SACU. Mercosur’s average applied MFN rate is about half CEMAC’s MFN rate.
Custom UnionAverage
MFN RateStandard Deviation
Min MFN Rate
Max MFN Rate Likelihood 2/
CEMAC 19.1 9.6 0 30 -3.7WAEMU 12.1 6.8 0 20 -3.1
East African Customs Union 12.9 11.9 0 100 -3.5SACU 8.0 10.8 0 55 -3.3Mercosur 1/ 9.7 7.1 0 35 -3.0EU 1/ 5.3 5.3 0 75 -2.6
Source: TRAINS (2006) and IMF.
Table 2: The Common External Tariff by Regional Agreement
1/ Applied MFN rates.
2/ The Likelihood function permits measuring the mass function that lies above the mean. In this context, it can be interpreted as the higher the likelihood value (in absolute value), the larger the barriers to trade. To combine the information provided by the standard deviation and the mean we use the normal density function (so that results can be interpreted as a continuous histogram). We use as average value the average MFN for all regions, which equals 11%).
CEMAC’s MFN tariff regime is also significantly more dispersed than that of other customs unions like WAEMU and Mercosur, though not relative to the East African Customs Union’s regime. In 2005, the standard deviation of CEMAC’s unweighted MFN average rate was 9.6 percent, while WAEMU and Mercosur schedules showed a standard deviation of about 7 percent. Variability, or dispersion, of tariff rates is associated with inefficiencies and large deadweight losses. Uniform tariff schemes, by contrast, tend to be more transparent, simple to administer, and more immune to interest group pressures.

10
CEMAC’s and WAEMU’s tariff structures show a bipolar density function profile. Figure 2 illustrates the kernel density functions of CEMAC’s and WAEMU’s officially adopted MFN tariff schemes. WAEMU’s MFN tariff scheme has two peaks: rates of 12–13 percent and 19–20 percent. Similarly, CEMAC’s distribution has two clusters: rates of 12–14 percent and about 28 percent, both with similar prominence. Note also that CEMAC’s structure is overall more disperse and more restrictive than that of WAEMU.
Figure 2: The Distribution of CEMAC and WAEMU’s MFN Tariff Schemes
1/ The Kernel density provides an estimate of the smooth underlying density function of the data. Source: IMF staff As suggested by its high MFN tariff rates and relatively high levels of dispersion, CEMAC’s tariff scheme is more restrictive than other similar arrangements. The last column in Table 2 presents a combination of average MFN and dispersion levels, using the normally-distributed likelihood function. The higher the absolute value, the more restrictive is the regime. Of all the arrangements included in the sample, the CEMAC integration group is the most restrictive, followed by the East African Customs Union, whose tariff regime has a lower MFN average rate but with more dispersion.
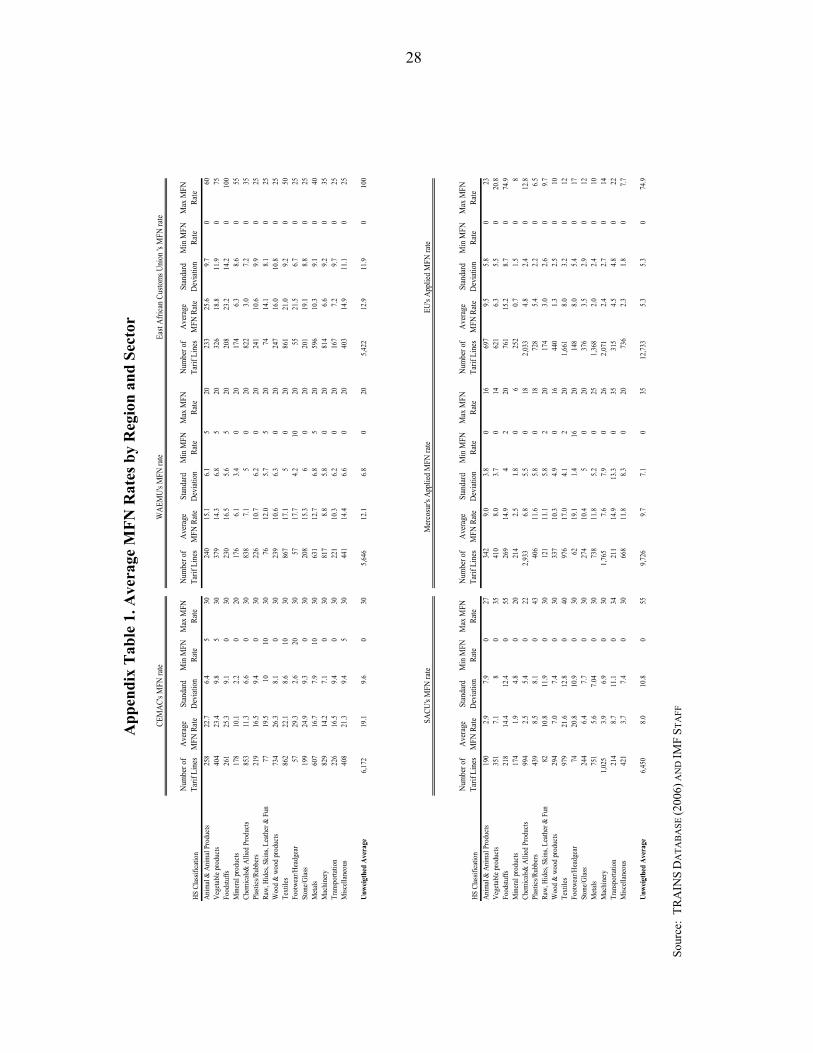
CEMAC’s tariff structure seems to embrace the infant industry argument by taxing manufactures and agricultural products the most. Appendix Table 1 summarizes the MFN tariff structures by sector and different regional integration groups. The CEMAC regime levies higher rates on footwear, wood products, and farm products (animal, vegetables and foodstuff), items for which average tariff rates exceed 23 percent.
0
.02
.04
.06
0 10 20 30 40
CEMACWAEMU
Kernel Density
Average MFN Rate (in percent)
11
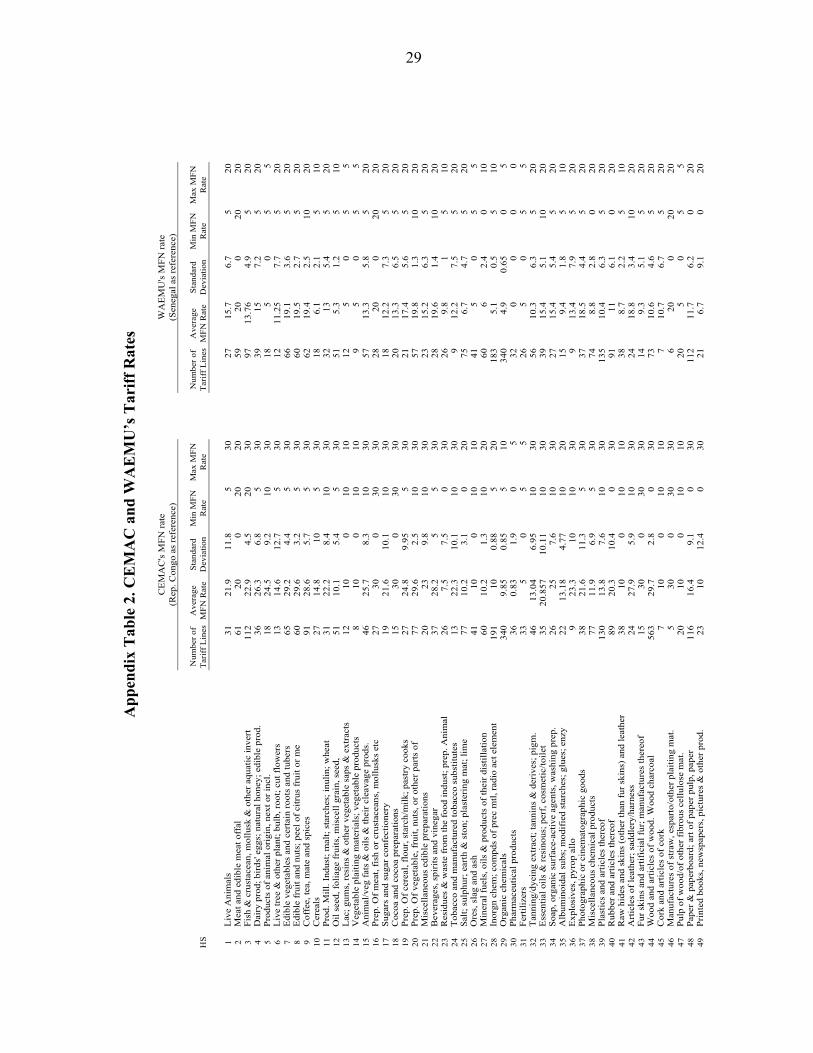
For almost all sectors, the CEMAC tariff scheme sets higher average MFN rates compared to other arrangements. On average, larger differences apply to CEMAC-SACU rates, followed by Mercosur and WAEMU. By product, the biggest disparities apply to wood and wood products. The gap between CEMAC average rates and those of the rest of regional agreements ranges in between 10 and 19 percent. That is, CEMAC rates on wood products are at least 10 percentage points higher on average than that of the rest of regions. Appendix Table 2 provides a more detailed summary of the rates applied within the CEMAC and WAEMU.
Initiatives to reduce CEMAC’s CET rates towards WAEMU levels have had thus far little success. In 2002 a team of experts—supported by the EU, France, and the World Bank—prepared the so-called Steenlandt report, an initiative to improve customs procedures. The report was followed by a workshop held in Brazzaville, Congo, in October 2003 to design a roadmap for further reform. Proposals envisaged: (i) reducing the number of CET rates from four (i.e., 5 percent, 10 percent, 20 percent, and 30 percent) to three (i.e., 5 percent, 10 percent, and 20 percent), including making a top rate comparable to the WAEMU’s top rate, and (ii) conducting a detailed review of both the nomenclature and the applied tariff rates. Little progress has been made since then. Instead, a number of regional taxes—the regional integration tax, (which has a base rate of 0.4 percent in Congo); a community integration contribution of 1 percent on non-CEMAC imports to finance CEMAC institutions, and a OHADA7 levy—not originally included in the original agreement have been added.
Departures from the CEMAC’s 1994 Trade Regime A number of other so-called para-tariffs and surcharges, not contemplated in CEMAC tariff regime, are often applied on CEMAC countries’ imports and exports. These additional charges increase the cost of imports in the same fashion as tariffs do, but render the regime non-transparent, complex, uncertain, and subject to discretionary practices. In the case of Congo, these surcharges are, on average, about 3.3 percent of the customs value applied on non-CEMAC imports. Examples of para-tariffs and other taxes not included in the original CEMAC Agreement are: a computer user fee, ranging from 1.5 percent of the c.i.f value of imports in Cameroon to 2 percent in Congo; and a timber levy. Except for those tied to services provided by public administrations (which rates can be selected by the member countries), these other taxes would not seem consistent with the 1994 CEMAC tariff code (Article 2.3).
Moreover, the CEMAC trade code does not regulate export taxation. CEMAC countries exports are subject to a number of duties and taxes intended to enhance government revenue. In practice, however, these measures erode export competitiveness without, in the case of Congo, enhancing government revenue collection (shown below). Common instruments used by CEMAC countries to tax exports are export duties, royalties on wood and diamonds, an exit tax, a road tax on timber for export or in transit, a tax for the computerization of the Ministry of Finance, and a reforestation tax. Earmarked taxes tend to be the main component of CEMAC countries’ export regime, though export duties, while reporting little revenue, tend to be quite common also.

12
CEMAC Countries and Non-Tariff Barriers In Africa, nontariff barriers8 are blamed for the little volume of intra-regional trade, highly concentrated production structures, and the vulnerability of the economy to terms of trade fluctuations. The removal of non-trade barriers therefore remains a challenge that CEMAC countries, and African countries more generally, must face in order to enlarge markets, diversify production, and successfully cushion shocks.
CEMAC countries, on average, impose more requirements on importers and exporters than do WAEMU country members. Table 3 summarizes major trade-related impediments as identified in the 2007 Doing Business survey conducted by the World Bank. CEMAC countries, on average, require more time to import and export than WAEMU and average Sub-Saharan economies. Overall, the cost of trade is well above that in other Sub-Saharan economies.
Documents for Export (number) 8 8.2 8Time for Export (days) 51 40.8 40Cost to Export (USD per container) 1,924 1,182 1,561Documents for Import (number) 14 13.9 12Time for Import (days) 62 54.1 52Cost to Import (USD per container) 2,313 1,837 1,9471/ Averages.Source: World Bank (2006) and IMF Staff.
Sub-Saharan Economies
Table 3: The Use of Non-Tariff Barriers 1/
Trading Across Borders CEMAC Countries
WAEMU Countries
Promoting export diversification requires improving the business climate in the region. CEMAC economies’ export profile is highly skewed in favor of few natural resources (oil and forestry mainly), a feature that makes these economies prone to a noncompetitive production structure. The Republic of Congo is not an exception. Table 4 summarizes factors that hamper entrepreneurship and block further development of the non-oil, non-forestry sectors in CEMAC and WAEMU countries. The figures reported represent the relative ranking of each country in each variable vis-à-vis the 175 countries included in the sample. CEMAC countries as well as WAEMU countries occupy the latter part of the ranking (Chad and the Republic of Congo ranking 172 and 171, respectively).
7 OHADA stands for Organisation pour l'Harmonisation en Afrique du Droit des Affaires. Their main objective is to enhance the legal environment in Africa by proposing a modern and uniform business law.
8 Nontariff barriers refer to nonmonetary restrictions on trade. These range from quantitative measures such as quotas, licensing procedures or prohibitions to qualitative measures like technical specifications, or restrictions deriving from poor physical infrastructure, lack of access to financing sources, and other burdensome measures raising barriers to the free movement of goods and services. Nontariff barriers are less transparent than tariff barriers and also more distorting and difficult to account for.

13
In sum, CEMAC trade policy remains more restrictive than originally envisaged under the 1994 CEMAC Agreement, which in turn is restrictive if compared to other similar arrangements. There are strong arguments calling for tariff cuts and other steps to ease the cost of doing business in the region.
Business ClimateSub-Saharan Economies
average dispersion average dispersion average
Ease of Doing Business 159 17 150 10 131Starting a Business 149 16 149 16 125Dealing with Licenses 112 40 129 33 110Employing Workers 153 12 143 16 118Registering Property 131 27 122 33 121Getting Credit 114 7 136 13 112Protecting Investors 77 24 102 30 92Paying Taxes 142 32 139 17 104Trading Across Borders 146 21 131 40 124Enforcing Contracts 147 40 129 24 111Closing a Business 128 25 92 20 111
Source: World Bank (2006) and IMF Staff.
Table 4: Business-Related Non-Tariff Barriers, 2006
CEMAC Countries WAEMU Countries
IV. CONGO’S TRADE REGIME: THEORY AND PRACTICE
Import Policy Scheme Congo’s trade regime is restrictive. Table 5 summarizes the complex customs regime that was formally adopted by Congo in 2001. The simple average applied MFN rate is 18.7 percent; the average rate rises to 22 percent after accounting for other duties and taxes applied to imports.
Congo’s trade policy regime includes a number of fees and taxes to trade that render the regime complex. Other taxes and duties include, for example, an automation fee that was supposed to be included in the statistical tax, and the municipality tax applied on imports from the Democratic Republic of Congo (DRC). In addition, Congo imposes a levy of 5 percent of the import value that accounts as an advance payment on income taxes, and a maritime transportation fee to be paid to SOCOTRAM9 on all imports and exports shipped to and from the country. Under its WTO
9 SOCOTRAM is a state-owned company that holds the national traffic rights for 40 percent of operations. Although Congo officially abolished traffic sharing back in 2000, traffic sharing continues in practice.

14
commitments, these other taxes and duties—including the OHADA levy, statistical tax, the automation fee, as well as a number of integration-related duties which are applied to imports originating outside CEMAC countries—were bound at zero but continue being collected (WTO 2006, p. viii). However, since 2003 Congo’s applied rate on the automation fee has been 2 percent, doubling the 1 percent rate mentioned in the trade code approved by Congolese authorities in 2002.
Term Base Rate (2001 Code) Rate (WTO, 2006))
Applicable to Imports Only(i) CEMAC's Tariff Code
Common External Tariff Customs value 5%, 10%, 20%, 30% 18.7% (average rate)Statistical Tax Customs value 0.2% 0.2%
(ii) Regional TaxesRegional Integration tax (TCI) Customs value 1% 1.0%Tax CEEAC (CCI) Customs value 0.4% 0.04%OHADA Levy 0.05%
(iii) OthersAutomation fee Customs value 1.0% 2%Municipality Tax (MT) Customs value + all other taxes 20.0%Advance payment on income taxes 5.0%
Tax on imports of wood and derivatives (except for those to supply local industries) 15.0%
Value Added Tax CV+ CET+ET+RIT+ST+CR+CTRI 0.18CEMAC's Value added tax Customs value 18.0%Excise taxes Customs value + CET 24%
Export duty FOB value 2% to 20%Royalties on Wood Variable --Routing fond
Specific tax
75 franc/m3: Congolese wood;
100 franc/m3: CEMAC wood;
250 franc/m3: Third countries' wood
Royalty on diamonds FOB value 2%Access rights to exit FOB value + ExT 2%
Source: Congolese authorities, WTO (2006) and IMF Staff.
Import Regime
Export Regime
Applicable to Domestic Production and Imports
Table 5: Congolese Tariff Code. Summary of Main Instruments
Customs value ([cif price + transporation costs+ assurances + other costs] * exchange rate * adjusting coefficient )
Congo’s trade regime also exhibits some tariff escalation, a feature most economists consider to lead to an inefficient allocation of scarce resources. The average applied rate on raw materials is 20 percent, on semi-finished products is 15.2 percent, and 20.4 percent on finished products. Higher protection levels target agricultural products, which are subject to average rates of 23 percent. Manufactures and mining products are subject to average rates of 18.4 and 11.4 percent respectively. At the product level, more significant differences emerge according to the WTO (WTO 2006, page 31).
Congolese Import/Export Policy Scheme by Instrument After the CET, royalties on wood exports and the automation fee are the most important instruments of the Congolese trade policy framework in terms of revenue collection. The CET and VAT account for about 44 and 35 percent of revenues collected at customs,

15
respectively. Table 6 reports the importance of each tariff instrument on Congo’s customs revenues. It shows the share of total revenues collected by Congolese authorities in 2002–2005, by instrument, relative to total revenue collection from trade taxes.
2002 2003 2004 2005 1/ 2006 1/
Import RegimeApplicable to Imports Only
(i) CEMAC's Tariff CodeCommon External Tariff 42.1 44.1 40.9 44.1 42.4Statistical Tax 0.4 0.6 0.8 0.8 0.8
(ii) Regional TaxesRegional Integration Tax (TCI) 2.2 2.5 2.3 2.6 2.7
Contribution Tax on Regional Integration 0.0 0.0 1.1 1.2 1.4Ohada Levy 0.0 0.0 0.0 0.0 0.1
(iii) OthersAutomation fee 0.0 5.3 8.7 6.8 6.9Municipality Tax 0.1 0.1 0.3 0.3 0.3Disputes 0.3 0.7 0.7 0.4 1.0Ancillary charges 0.2 0.0 0.0 0.0 0.0Surcharge 0.0 0.0 0.0 0.1 0.0Preferential Tax 0.1 0.0 0.0 0.0Tax not in the Budget 3.9 3.6 4.6 0.0 0.0
Value Added Tax 37.3 34.7 31.9 34.7 35.2Excises taxes 1.2 1.0 0.8 1.0 0.9
Export RegimeExport duty 0.0 0.0 0.0 0.1 0.1Royalties on Wood 3.4 10.4 12.2 7.6 8.0Tax on exports' value 0.1 0.1 0.1 0.1 0.1Road Fund 0.1 0.1 0.1 0.1 0.1
Import-only related 49.4 57.0 59.4 56.3 55.6Export-only related 3.5 10.5 12.4 7.9 8.3
Applicable to Domestic Production and Imports 38.5 35.7 32.7 35.8 36.1
Source: Congolese authorities, WTO (2006) and IMF Staff. 1/ Data for 2005 and 2006 covers up to June 2005 and June 2006 respectively.
Table 6: Revenue from Trade Taxation, by Instrument
(as percentage of total revenues from taxing trade)
Import and Export Duty Revenues
Applicable to Domestic Production and Imports
A number of instruments have been gaining prominence in Congo’s trade taxes since 2001. These instruments include the automation fee, export duties and royalties on wood, the Chamber of Commerce and Industry (CCI) fee, and preinspection fees. Together, these instruments account for 20–25 percent of total revenues from the taxation of trade (Table 6). It is noteworthy that a number of instruments in place do not contribute to tariff collection but make the regime cumbersome and less transparent.

16
There are inconsistencies between the current trade regime and a pro-growth strategy as illustrated by the case of cement (Box 1):
Artificially high import costs apply to key inputs. Besides cement, other products like electrical appliances and rubber products, to cite a few among many examples, face average rates well above the 20 percent tariff rate.
The number of other duties, taxes and surcharges, is well beyond those approved under the CEMAC’s code. As a result, the regime becomes quite cumbersome and non-transparent. Apart from the customs duty rate and the VAT, cement is subject to four more import-related fees (see Box 1).
Departures from the WTO transaction-based import valuation method. Cement import prices, for
instance, are based on a preset reference list of prices and not on the actual value of imports.
Prices are controlled by the government. Therefore, the supply of scarce products, rather than adjusting to market forces, tends to decline when import costs increase (i.e., importers’ markups decline), leading also to a non-transparent allocation.
Box 1: The Case of Cement
Barriers to trade are having an important negative effect on Congo’s development efforts. A clear example concerns the measures affecting cement imports, a basic input needed for the reconstruction of the country. Formally, under the 2001 Congolese customs code, cement is subject to the following taxes:
the common external tariff of 30 percent;
the automation fee of 1 percent of cement’s customs value;
the VAT with a rate of 18 percent;
the CEMAC regional tax of 1 percent of the customs value and a 0.4 percent of customs value financing the ECCAS;
a transportation fee (redevance fluviale) of CFAF 650 (about $1.20) per ton on imports from the Democratic Republic of Congo;
the price of cement sold in Congo is an administered price fixed by the government. And, the reference value used to calculate the customs value was increased from CFAF 20.000 per ton to CFAF 40.000 in 2006.1/
Such high level of trade protection creates substantial bottlenecks for construction activity.
1/ On February 12, 2007, authorities announced the liberalization of cement prices.

17
Lack of storage capacity is of special relevance, as it exposes the supply of staple foods, cement and other basic goods to great volatility. As such, shortages tend to occur frequently, harming mostly the poor.
The lack of transparency. According to Congo’s trade code, cement is subject to close to
30 percent duty rate. According to the WTO (2006), the applicable rate is 0 percent. However, Congolese Law (number 20–2004) re-established in 2004 the 30 percent CET rate as the official rate.
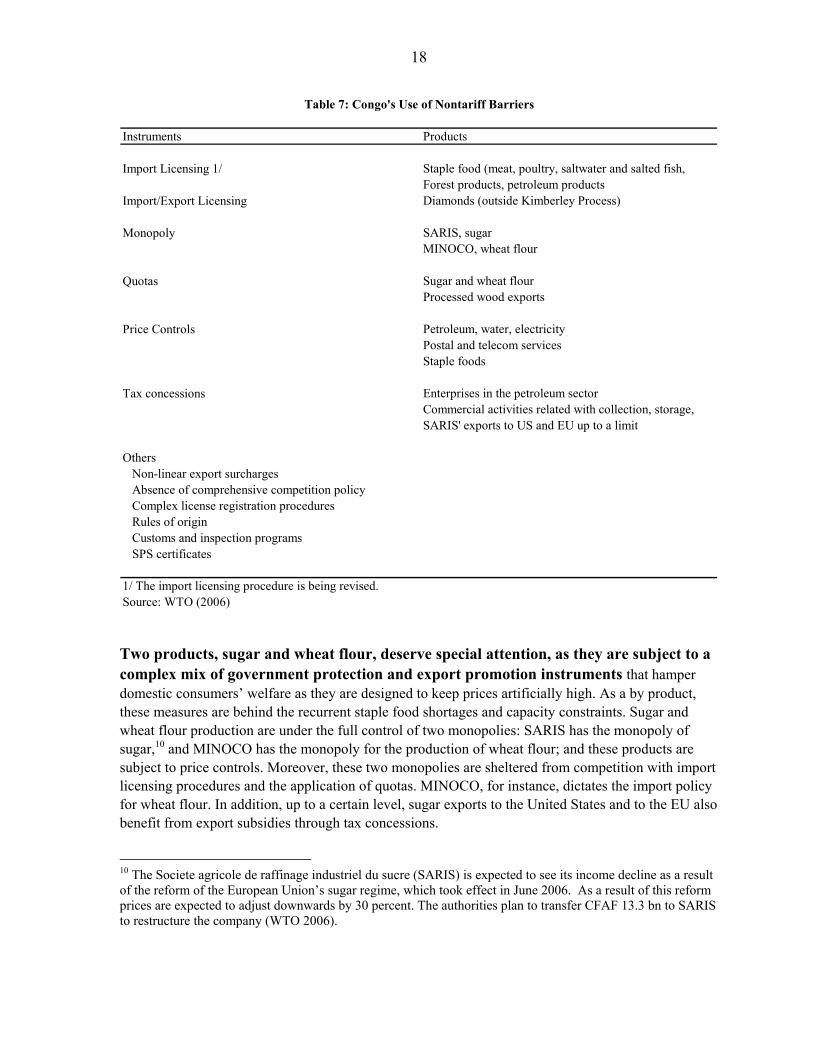
To enhance trade, Congo should simplify its currently applied tariff and para-tariff schemes, and to make its current trade regime more transparent and predictable. The analysis permits drawing a number of policy recommendations that, if implemented, could significantly simplify the trade policy scheme being applied in Congo. The consolidation of taxes to trade and elimination of those para-tariff measures (automation fee, transportation fees, OHADA levy, among others)—which may raise issues of consistency with the country’s international commitments and, de facto, yield little revenue to Congo’s treasury—would greatly enhance the transparency of the regime and reduce the scope for discretionary practices. Measures that limit uncertainty faced by importers and exporters, enhance transparency, and make Congo’s business environment more efficient include the publication of the full list of tariff lines subject to para-tariff measures and of exemptions to the VAT and excises (see Oliva 2007). Nontariff Barriers Despite its dependence on trade, some nontariff barriers are quite prominent in the Congolese legislation. For instance, on average, Congo requires 12 documents for export and 15 documents for imports, above the average for all CEMAC countries and WAEMU economies (Appendix Tables 3a and 3b). The time required to import and export is roughly equal to the CEMAC average. However, the cost to import and exports remains well above that afforded by WAEMU and Sub-Saharan economies on average. Nontariff barriers include price control measures, finance measures, quality control measures and monopolistic measures. Moreover, despite food shortages, imports of staple food supplies are subject to licensing requirements and price controls. Table 7 summarizes the main quantitative non-tariff barriers faced by importers and exporters in Congo, as identified in WTO (2006).
18
Instruments
Forest products, petroleum productsImport/Export Licensing Diamonds (outside Kimberley Process)
SARIS, sugarMINOCO, wheat flour
Sugar and wheat flourProcessed wood exports
Petroleum, water, electricityPostal and telecom servicesStaple foods
Enterprises in the petroleum sector
SARIS' exports to US and EU up to a limit
OthersNon-linear export surchargesAbsence of comprehensive competition policyComplex license registration proceduresRules of originCustoms and inspection programsSPS certificates
1/ The import licensing procedure is being revised. Source: WTO (2006)
Tax concessionsCommercial activities related with collection, storage,
Products
Table 7: Congo's Use of Nontariff Barriers
Monopoly
Price Controls
Staple food (meat, poultry, saltwater and salted fish, Import Licensing 1/
Quotas
Two products, sugar and wheat flour, deserve special attention, as they are subject to a complex mix of government protection and export promotion instruments that hamper domestic consumers’ welfare as they are designed to keep prices artificially high. As a by product, these measures are behind the recurrent staple food shortages and capacity constraints. Sugar and wheat flour production are under the full control of two monopolies: SARIS has the monopoly of sugar,10 and MINOCO has the monopoly for the production of wheat flour; and these products are subject to price controls. Moreover, these two monopolies are sheltered from competition with import licensing procedures and the application of quotas. MINOCO, for instance, dictates the import policy for wheat flour. In addition, up to a certain level, sugar exports to the United States and to the EU also benefit from export subsidies through tax concessions.
10 The Societe agricole de raffinage industriel du sucre (SARIS) is expected to see its income decline as a result of the reform of the European Union’s sugar regime, which took effect in June 2006. As a result of this reform prices are expected to adjust downwards by 30 percent. The authorities plan to transfer CFAF 13.3 bn to SARIS to restructure the company (WTO 2006).

19
Apart from a number of quantitative non-tariff barriers, importers and exporters also must contend with a number of qualitative barriers. These include: the imperfect implementation of preferential arrangements, red tape, poor and inefficient customs administration, costly and cumbersome transit procedures, double taxation, discretionary application of exemptions, and weak and costly infrastructure—especially in transportation leading to shortages and a de facto monopoly in many sectors where supply depends on imports. Also, lack of information and uncertainty of the trade regime render the current regime unpredictable and noncompetitive.
Congo performs below WAEMU countries in such areas as tax payments, enforcement of contracts, and labor market rigidity (Appendix Table 3a). Relative to other African regions, Congo has ample room for improvement in its business climate. Other areas for progress include reducing the cost of dealing with licenses, closing a business, and registering property. Congo performs poorly in the labor market variables, particularly in the rigidity of the labor market (i.e., difficulty of firing and rigidity in hours worked).
V. CONGO’S TRADE REGIME AND REVENUE COLLECTION
Trade Regime and Low Revenues In 2002–2003 and 2004–2005 higher import values coexisted with lower custom duties revenues. In principle, one should expect a positive correlation between import duties and import values. In the case of Congo, import duties declined despite high tariff rates and a jump in imports to Congo in 2005. Figure 3 shows customs duty collections against import values for years 1999 to 2006.
Moreover, customs duty taxation has not risen from its 2001-02 levels. Revenue from taxation of international trade was about 3.6 percent of the total trade in 2003 and 2004, down from the 4.7 percent share recorded in 2001 (Table 8). In terms of fiscal revenues and trade in goods and services, collections have declined. This weak performance—recorded despite the high tariff rates envisaged under the Congolese tariff code—raises questions about the effectiveness of customs administration11 and about important leakages in the system. How can this be explained? The answer hinges on a number of factors: the number of exemptions provided in these years, a weak customs administration, and the difficulties in the application of the WTO-agreed transaction based customs valuation system.
11 The adoption of the ASYCUDA computerization system is expected to be fully operational by 2007.

20
Source: Congolese authorities and IMF staff.
2000 2001 2002 2003 2004 2005 1/ 2006 1/
In CFA Million 69,303 97,061 86,939 73,582 83,058 72,792 92,916In percent of nominal non-oil GDP 3.0 4.7 4.1 3.6 3.6 2.6 2.2In percent of nominal GDP 8.8 10.9 8.9 7.1 7.6 5.8 6.9In percent of Fiscal Revenue 11.4 15.4 15.1 12.0 11.1 6.7 4.4In percent of trade of G and NFS 2.6 2.4 2.5 2.1 1.6 1.6 1.4
Memorandum items: (in CFA bn)Nominal GDP 2,293 2,048 2,105 2,072 2,294 3,150 3,770 Nominal Non-oil GDP 790 890 979 1,035 1,089 1,247 1,353 Fiscal revenue 609 632 575 614 746 1,246 1,871 Exports of G and NFS 1,586 1,716 1,642 1,938 2,743 2,722 3,403 Imports of G and NFS (1,092) (1,135) (1,112) (1,315) (1,581) (1,579) (1,694)
1/ Projections are based on 2005 and 2006 data for the first semester.Source: WTO (2006) and IMF
Table 8: Revenue from Taxation of International Trade
Figure 3: Rep. Congo. Customs Duties and Imports
200
300
400
500
600
700
800
900
20 25 30 35 40 45 50 55 60
Customs Duties (in bn CFAF)
Impo
rt V
alue
s (in
bn
CFA
F)
2006e
2004
2005
2001
20032002
1998
2000
1999

21
Trade Regime and Revenues: Exceptions and Discretionary Practices Overall exemptions in the first semester of 2006 matched the levels reached in 2005, which in turn more than doubled those of 2004. In 2005, overall exemptions, amounted to CFAF 109 billion (3.5 percent of GDP and about 9 percent of non-oil GDP), more than twice the level reached in preceding years. In 2004, exemptions amounted to 2.3 percent of GDP. Exemptions granted to oil products, wheat flour imports by MINOCO, and for exceptional reasons were especially high in 2005 (Table 9). In the first semester of 2006, the bulk of exemptions concentrated in the oil sector, municipalization projects, and other public investments, and CEMAC imports under the chapter of statutory exemptions. Officially, (and appropriately) Congo grants exemptions on products that are in transit, under temporary admission and products placed under customs warehousing. However, in practice, a number of other products are also exempted, as shown in Table 9.
Exemptions 2000 2001 2002 2003 2004 20052006 First Semester
Total 46,398 55,219 59,390 45,955 52,086 108,957 107,298Petroleum Sector o/w 38,480 36,052 43,711 30,490 36,057 91,166 90,751
related to conventions 38,299 35,863 43,340 30,133 25,631 18,374 39,205total exemptions 0 0 0 0 9,674 60,758 49,439automation fee 0 0 0 0 475 11,520 1,897
Statutory o/w 1,314 3,973 4,100 4,379 6,715 5,569 10,154CEMAC Imports-related 0 0 0 0 781 2,453 9,044
Pro-Investment, o/w 4,931 8,549 9,841 9,993 6,562 8,056 4,709
Public contract-related 2,190 4,112 5,662 3,661 3,645 2,282 3,847Minoco (wheat flour) 0 0 0 0 206 1,486 776Plasco (mineral water) 0 0 0 0 0 166 86
Exceptional Measures 1,673 6,646 1,738 1,094 2,752 4,166 1,685
Source: WTO (2006), Congolese authorities and IMF.
Table 9: Congolese Exemptions to Trade (in bn CFAF) 1/
1/ Revenue foregone as a result of exemptions to the customs tariff and other taxes imposed on imports (e.g., excise taxes and statistical taxes).

22
The fiscal revenue impact of reducing the use of exemptions would be significant (Figure 4). In 2005 and 2006 exemptions are projected to account for 60 and 54 percent, respectively, of potential fiscal revenue associated to trade. Such weak customs duty collection calls for the consolidation and harmonization of tax measures, the rationalization of exemptions, and the strengthening of customs.
VI. REGIONAL INTEGRATION AND OTHER PARTNERSHIPS
Most Congolese trade is with the United States, the European Union, and China. Trade relations vis-à-vis the United States, Congo’s major trading partner according to the WTO report, are skewed towards exports, which account for about 94 percent of trade exchanges (Table 10) and oil-related products in particular. Congo mostly imports machinery and transportation equipment, agricultural products and minerals and metals.
Figure 4: The Fiscal Revenue Impact of Suppressing Exemptions
0
50,000
100,000
150,000
200,000
250,000
2000 2001 2002 2003 2004 2005 1/ 2006 /1Year
In m
illio
n C
FAF
Exemptions Total potential revenue Actual trade revenue

23
2004 2005 2006 2004 2005 2006 2004 2005 2006
All sectors 64,512 103,429 137,310 849,730 1,662,438 3,045,473 342,248 571,419 774,536 Agricultural products 7,571 10,404 6,721 3,021 3,500 141 - - - Forest products 552 5,674 224 2,887 8,168 5,581 - - - Chemicals and related products 3,615 3,446 5,020 1,605 147 126 - - - Energy-related products 126 266 18,658 829,263 1,645,975 3,029,433 342,248 571,419 774,536 Textiles and apparel 6,502 5,897 4,896 10 - - - - - Footwear 19 66 268 - - - - - - Minerals and metals 6,374 10,678 15,506 11,289 2,693 1,781 - - - Machinery 7,552 14,751 12,822 25 - 61 - - - Transportation equipment: 26,987 43,629 58,008 - - 126 - - - Electronic products 2,978 4,564 8,402 198 54 68 - - - Miscellaneous manufactures 366 420 336 1,138 915 5,777 - - - Special provisions 1,870 3,634 6,450 294 986 2,380 - - -
Source: US ITC and IMF
Table 10. US and Congo Trade Relations: The AGOA Program (in thousand dollars)
US Exports to Congo US Imports from CongoUS Imports of duty-free items
added under Agoa
Congo reaps little benefit from its preferential arrangements despite being beneficiary of different preferential programs with some major trading partners: A weak business climate environment, poor infrastructure, stringent rules of origin, standards and other technical barriers constitute important constraints on Congo’s ability to utilize unilateral preferences granted by the United States, the EU, and others. To date, at least formally, Congo benefits from: AGOA with the United States, the Africa, Caribbean, and Pacific (ACP)-European Union (EU) Agreement, now being renegotiated, and the generalized system of preferences granted to least developed economies. That is,
The Economic Partnership Agreement (EPA) with the European Union. Congolese industrial products and processed agricultural products exports to the European Union have been the beneficiary of non-reciprocal duty-free treatment. Under the umbrella of the Cotonou Agreement, signed by the EU and 79 ACP countries in 2000, the European Union and ACP countries are engaged in negotiations12 to convert the current agreement into a reciprocal agreement (and thus compatible with the WTO Agreements). This EPA, to be implemented in 2008, is expected to lead to the progressive and reciprocal liberalization of trade in goods and services, in accordance with WTO rules. The EPA is also expected to cause revenue losses (estimated to be around 1 percent of GDP13) to be phased in gradually, allowing time to bring alternative revenue measures into place.
12 The Cotonou Agreement, also known as the The ACP-EU Partnership Agreement, is a comprehensive aid and trade agreement signed last June 2000 between the EU and 77 ACP countries. This agreement provides the framework for the negotiation of new reciprocal, and therefore WTO-compatible, trading arrangements between the EU and the 77 ACP countries. It is expected to enter into force in 2008.
13 UNECA (2006) estimates loses could amount to $75 million.

24
United States and African Growth and Opportunity Act (AGOA). Despite gaining preferential treatment to the U.S. markets, Congo’s use of such preferences is quite limited. According to the WTO, no product exported to the United States has benefited from the AGOA’s program. USITC data show that (i) only energy-related exports to the United States have been granted zero-duty status under the AGOA’s regime, and (ii) the share of energy-related exports benefiting from duty free treatment under AGOA has plummeted from 88 percent in 2003 to 26 percent in 200614 (Table 10). USAID (2004) refers to the numerous obstacles to trade and constraints the Congolese economy faces in order to explain the limited use of AGOA’s benefits. In particular, they stress high costs of production due to transport and fuel prices/ tariffs, the chaotic and unregulated cross border activity, and the need to streamline goods transshipment procedures in a transparent fashion.
The Generalized System of Preferences (GSP). Congo is a beneficiary of the GSP
preferential tariff program granted by many countries according to the WTO (2006). The number of products covered under the GSP program granted by the US to Congo has declined, however. In 2005, according to USITC, U.S. imports from Congo under the GSP regime remained close to 0 percent of Congo’s exports to the United States.
Other Bilateral Agreements. There are indications that Congo is mired by the process of
regionalism. The Economic Sub-Community of Central African States (ECCAS), comprising CEMAC members and other countries such as the Democratic Republic of Congo, Angola, Burundi, Rwanda, and São Tomé and Principe, has approved the adoption of a free trade area by year-end 2007, raising yet more questions about the benefits and drawbacks of overlapping regional trade arrangements. Moreover, the authorities have signed bilateral agreements with Brazil, Cuba, China, South Korea, Turkey, South Africa, and Vietnam, the specifics of which have yet to be made clear.
There is very limited information about Congo’s actual trade practices and trade flows as well as on Congo’s bilateral trade agreements with non-CEMAC countries. Lack of reliable trade flow data has several implications. For example, it makes it difficult to estimate the revenue impact of the ongoing ACP-EU EPA negotiations. Also, in order to avoid making the system even more cumbersome and unpredictable, and to limit the costs of regional arrangements, it is important that the authorities negotiate clear, transparent, and liberal rules of origin and ultimately publish the legislation and regulations of the signed agreements.
VII. POLICY RECOMMENDATIONS: TRADE REFORM AND GROWTH
It is widely accepted that trade openness has positive effects on growth. The literature also emphasizes the significant positive spillovers trade has on other aspects of policy reform.15 In the case of Congo, the links seem to be especially relevant given that the economy is highly dependent on 14 According to U.S. authorities, Congo claims for duty-preferences for all its exports of energy-related goods have declined. Most of these exports are in HTS 27090020 which has a MFN tariff of around $10.5c per barrel, a rate that is already considered quite low.
15 See Berg and Krueger (2003) for a survey of the literature on the link between trade and growth.

25
exports and imports, and suffers from capacity constraints that severely limit its capacity to recover from the effects of past civil wars.
Enhancing Congo’s trade performance also requires the following measures:
Simplifying its applied tariff and para-tariff schemes. This encompasses the consolidation of taxes to trade and the elimination of para-tariff measures (automation fee, transportation fees, OHADA levy, among others). Some of these measures may raise issues of consistency with the country’s international commitments and, moreover, yield de facto little revenue to Congo’s treasury.
Increasing transparency and the predictability of the current regime to enhance the volume of trade and limit the scope for discretionary practices and corruption. Measures to be considered include the publication of the full list of tariff lines subject to para-tariff measures, and reducing the scope of VAT and excises exemptions, among others. Also, transparency can be sharply improved with the publication of all applicable quantitative nontariff measures (e.g., licensing requirements, prohibitions, and quotas).
Easing quantitative and qualitative nontariff barriers. Measures to be considered cover the elimination of SARIS’s and MINOCO’s monopolies and the simplification of licensing procedures; the elimination of subsidies and tax concessions favoring domestic monopolies; the progressive phasing out of administrative prices; and the strengthening of customs administration.
Encouraging the reduction of CEMAC’s official external tariffs and other barriers against imports from non-regional partners. The study shows that the CEMAC framework, which constitutes the skeleton of Congo’s trade regime, is quite restrictive. The existing WAEMU CET, with a maximum rate of 20 percent contrasts with CEMAC’s maximum rate of 30 percent.
Rationalizing the “spaghetti bowl” of regional arrangements and avoiding the costs of overlapping membership and complex rules of origin. In order to avoid making the system even more cumbersome and unpredictable, and to limit the costs of regional arrangements, it is important that the authorities: (i) engage in regional integration projects that do not discriminate against outsiders and (ii) negotiate clear, transparent, and liberal rules of origin. Easing trade costs at the regional level encompasses enhancing customs operations, harmonizing product standards, and rationalizing any “other duties and charges” (other than the customs tariffs) that are applied exclusively to imports (such as automation fees, customs fees, and surcharges).
Enhancing cooperation with the CEMAC Secretariat and facilitating surveillance. Congo’s data on trade flows dates back to 1995. Lack of data reporting explains the gap. Data collection—both on trade flows and on country-specific regulations and practices—is crucial to the effectiveness of the CEMAC Secretariat.

26
The diversification of Congo’s trade structure is a must, given the projected oil production decline. As such, enhancing the business environment, promoting entrepreneurship, and removing supply side barriers is critical. Engaging in a review like that conducted under the Integrated Framework Initiative16 could help the authorities move in this direction. The Diagnostic Trade Integration Study (DTIS) has proven to be a very useful tool in identifying sectors with potential comparative and competitive advantage and in better understanding bottlenecks that limit reaping efficiency gains.
16 See http://www.integratedframework.org for further details.
27
REFERENCE
Berg, A. and A. Krueger, 2003, “Trade, Growth, and Poverty: A Selective Survey,” IMF Working Paper 03/30 (Washington: International Monetary Fund).
Doe, L, 2006a, “Harmonization of Domestic Consumption Taxes in Central and Western African
Countries,” IMF Working Paper 06/8. (Washington: International Monetary Fund). ———, 2006b, “Reforming External Tariffs in Central and Western African Countries,” IMF
Working Paper 06/12. (Washington: International Monetary Fund). Eifert, B., A. Gelb, and V. Ramachandran, 2005, Business Environment and Comparative Advantage
in Africa: Evidence from the Investment Climate Data. draft. (Washington: World Bank). Hinkle, L. et al, 1997, “What Lies Ahead for the Two CFA Zones,” draft. (Washington: World Bank). IMF, 2006, Central African Economic and Monetary Community: Financial System Stability
Assessment, including Reports on the Observance of Standards and Codes on the following topics: Monetary and Financial Policy Transparency, and Banking Supervision. (Washington: International Monetary Fund).
Gulde-Wolf, A. M., C. Tsangarides, and J.K. Martijn, 2006, “Trade Reform in the CEMAC:
Developments and Opportunities. Selected Issues,” IMF Country Report No. 06/309. (Washington: International Monetary Fund).
Masson, P. and C. Pattillo, 2005, “The Monetary Geography of Africa,” (Washington: Brookings
Institution Press). Oliva, M., 2007, “Trade Policy and Reform in the Republic of Congo. Selected Issues,” forthcoming
in IMF Country Report. (Washington: International Monetary Fund). TRAINS (Trade Analysis and Information System), 2006,
http://www.unctad.org/Templates/Page.asp?intItemID=1907&lang=1. (Geneva: UNCTAD).
Union Economique et Monetaire Ouest Africaine (2004). Règlement N. 01/2004/CM/UEMOA; N. 15/2005/CM/UEMOA; N. 25/2002/CM/UEMOA; N. 02/2000/CM/UEMOA; N. 2/1997/CM/UEMOA
UNECA, 2006, “The Economic and Welfare Impacts of the EU-Africa Economic Partnership
Agreements.” (Ethiopia: UNECA) Van den Boogaerde, P. and C. Tsangarides, 2005, “Ten Years After he CFA Franc Devaluation:
Progress Toward Regional Integration in the WAEMU,” IMF Working Paper 05/145. (Washington: International Monetary Fund).
World Bank, 2007, 2007 Doing Business. (Washington: World Bank). WTO, 2006, “Trade Policy Review,” (Geneva: World Trade Organization).
28
App
endi
x T
able
1. A
vera
ge M
FN R
ates
by
Reg
ion
and
Sect
or
Sour
ce:
TRA
INS
DA
TAB
ASE
(200
6) A
ND
IMF
STA
FF
HS C
lassif
icatio
nNu
mbe
r of
Tarif
Lin
esAv
erag
e M
FN R
ateSt
anda
rd
Devi
ation
Min
MFN
Ra
teM
ax M
FN
Rate
Num
ber o
f Ta
rif L
ines
Aver
age
MFN
Rate
Stan
dard
De
viati
onM
in M
FN
Rate
Max
MFN
Ra
te Nu
mbe
r of
Tarif
Lin
esAv
erag
e M
FN R
ateSt
anda
rd
Devi
ation
Min
MFN
Ra
teM
ax M
FN
Rate
Anim
al &
Ani
mal
Prod
ucts
258
22.7
6.4
530
240
15.1
6.1
520
233
25.6
9.7
060
Vege
table
prod
ucts
404
23.4
9.8
530
379
14.3
6.8
520
326
18.8
11.9
075
Food
stuffs
261
25.3
9.1
030
230
16.5
5.6
520
208
23.2
14.2
010
0M
iner
al pr
oduc
ts17
810
.12.
20
2017
66.
13.
40
2017
46.
38.
60
55Ch
emica
ls& A
llied
Pro
ducts
853
11.3
6.6
030
838
7.1
50
2082
23.
07.
20
35Pl
astic
s/Rub
bers
219
16.5
9.4
030
226
10.7
6.2
020
241
10.6
9.9
025
Raw,
Hid
es, S
kins
, Lea
ther
& F
un77
19.5
1010
3076
12.0
5.7
520
7414
.18.
10
25W
ood
& w
ood
prod
ucts
734
26.3
8.1
030
239
10.6
6.3
020
247
16.0
10.8
025
Text
iles
862
22.1
8.6
1030
867
17.1
50
2086
121
.09.
20
50Fo
otwe
ar/H
eadg
ear
5729
.32.
620
3057
17.7
4.2
1020
5521
.56.
70
25St
one/G
lass
199
24.9
9.3
030
208
15.3
60
2020
119
.18.
80
25M
etals
607
16.7
7.9
1030
631
12.7
6.8
520
596
10.3
9.1
040
Mac
hine
ry82
914
.27.
10
3081
78.
85.
80
2081
46.
69.
20
35Tr
ansp
ortat
ion
226
16.5
9.4
030
221
10.3
6.2
020
167
7.2
9.7
025
Misc
ellan
eous
408
21.3
9.4
530
441
14.4
6.6
020
403
14.9
11.1
025
Unwe
igth
ed A
vera
ge
6,17
2
19
.19.
60
305,
646
12.1
6.8
020
5,42
2
12
.911
.90
100
HS C
lassif
icatio
nNu
mbe
r of
Tarif
Lin
esAv
erag
e M
FN R
ateSt
anda
rd
Devi
ation
Min
MFN
Ra
teM
ax M
FN
Rate
Num
ber o
f Ta
rif L
ines
Aver
age
MFN
Rate
Stan
dard
De
viati
onM
in M
FN
Rate
Max
MFN
Ra
te Nu
mbe
r of
Tarif
Lin
esAv
erag
e M
FN R
ateSt
anda
rd
Devi
ation
Min
MFN
Ra
teM
ax M
FN
Rate
Anim
al &
Ani
mal
Prod
ucts
190
2.9
7.9
027
342
9.0
3.8
016
697
9.5
5.8
023
Vege
table
prod
ucts
351
7.1
80
3541
08.
03.
70
1462
16.
35.
50
20.8
Food
stuffs
218
14.4
12.4
055
269
14.9
42
2076
115
.28.
70
74.9
Min
eral
prod
ucts
174
1.9
4.8
020
214
2.5
1.8
06
252
0.7
1.5
08
Chem
icals&
Alli
ed P
rodu
cts99
42.
55.
40
222,
933
6.8
5.5
018
2,03
3
4.
82.
40
12.8
Plas
tics/R
ubbe
rs43
98.
58.
10
4340
611
.65.
80
1872
8
5.4
2.2
06.
5Ra
w, H
ides
, Ski
ns, L
eath
er &
Fun
8210
.811
.90
3012
111
.15.
82
2017
4
3.0
2.6
09.
7W
ood
& w
ood
prod
ucts
294
7.0
7.4
030
337
10.3
4.9
016
440
1.
32.
50
10Te
xtile
s97
921
.612
.80
4097
617
.04.
12
201,
661
8.0
3.2
012
Foot
wear
/Hea
dgea
r74
20.8
10.9
030
6219
.11.
416
2014
8
8.0
5.4
017
Ston
e/Glas
s24
46.
47.
70
3027
410
.45
020
376
3.
52.
90
12M
etals
751
5.6
7.04
030
738
11.8
5.2
025
1,36
8
2.
02.
40
10M
achi
nery
1,02
5
3.
96.
90
301,
765
7.6
7.9
026
2,07
1
2.
42.
70
14Tr
ansp
ortat
ion
214
8.7
11.1
034
211
14.9
13.3
035
315
4.
54.
80
22M
iscell
aneo
us42
13.
77.
40
3066
811
.88.
30
2073
62.
31.
80
7.7
Unwe
igth
ed A
vera
ge
6,45
0
8.
010
.80
559,
726
9.7
7.1
035
12,7
33
5.
35.
30
74.9
CEM
AC's
MFN
rate
W
AEM
U's M
FN ra
te
Mer
cosu
r's A
pplie
d M
FN ra
te
East
Afric
an C
usto
ms U
nion
's M
FN ra
te
SACU
's M
FN ra
te
EU
's Ap
plied
MFN
rate
29
App
endi
x T
able
2. C
EM
AC
and
WA
EM
U’s
Tar
iff R
ates
HS
N
umbe
r of
Tar
iff L
ines
Ave
rage
M
FN R
ate
Stan
dard
D
evia
tion
Min
MFN
R
ate
Max
MFN
R
ate
Num
ber o
f T
arif
f Lin
esA
vera
ge
MFN
Rat
eSt
anda
rd
Dev
iatio
nM
in M
FN
Rat
eM
ax M
FN
Rat
e
1L
ive
Ani
mal
s31
21.9
11.8
530
2715
.76.
75
202
Mea
t and
edi
ble
mea
t off
al61
200
2020
5920
020
203
Fish
& c
rust
acea
n, m
ollu
sk &
oth
er a
quat
ic in
vert
112
22.9
4.5
2030
9713
.76
4.9
520
4D
airy
pro
d; b
irds
' egg
s; n
atur
al h
oney
; edi
ble
prod
.36
26.3
6.8
530
3915
7.2
520
5Pr
oduc
ts o
f ani
mal
ori
gin,
nex
t or i
ncl.
1824
.59.
210
3018
50
55
6L
ive
tree
& o
ther
pla
nt; b
ulb,
root
; cut
flow
ers
1314
.612
.75
3012
11.2
57.
75
207
Edi
ble
vege
tabl
es a
nd c
erta
in ro
ots
and
tube
rs65
29.2
4.4
530
6619
.13.
65
208
Edi
ble
frui
t and
nut
s; p
eel o
f citr
us fr
uit o
r me
6029
.63.
25
3060
19.5
2.7
520
9C
offe
e, te
a, m
ate
and
spic
es91
28.6
5.7
530
6219
.42.
510
2010
Cer
eals
2714
.810
530
186.
12.
15
1011
Prod
. Mill
. Ind
ust;
mal
t; st
arch
es; i
nulin
; whe
at31
22.2
8.4
1030
3213
5.4
520
12O
il se
ed, f
olia
ge fr
uits
, mis
cell
grai
n, s
eed,
5110
.15.
45
3051
5.3
1.2
510
13L
ac; g
ums,
resi
ns &
oth
er v
eget
able
sap
s &
ext
ract
s12
100
1010
125
05
514
Veg
etab
le p
laiti
ng m
ater
ials
; veg
etab
le p
rodu
cts
810
010
109
50
55
15A
nim
al/v
eg fa
ts &
oils
& th
eir c
leav
age
prod
s.
4625
.78.
310
3057
13.3
5.8
520
16Pr
ep. O
f mea
t, fi
sh o
r cru
stac
eans
, mol
lusk
s et
c27
300
3030
2820
020
2017
Suga
rs a
nd s
ugar
con
fect
ione
ry19
21.6
10.1
1030
1812
.27.
35
2018
Coc
oa a
nd c
ocoa
pre
para
tions
1530
030
3020
13.3
6.5
520
19Pr
ep. O
f cer
eal,
flou
r, st
arch
/milk
; pas
try
cook
s27
24.8
9.95
530
2117
.45.
65
2020
Prep
. Of v
eget
able
, fru
it, n
uts,
or o
ther
par
ts o
f 77
29.6
2.5
1030
5719
.81.
310
2021
Mis
cella
neou
s ed
ible
pre
para
tions
2023
9.8
1030
2315
.26.
35
2022
Bev
erag
es, s
piri
ts a
nd v
ineg
ar37
28.2
55
3028
19.6
1.4
1020
23R
esid
ues
& w
aste
from
the
food
indu
st; p
rep.
Ani
mal
267.
57.
50
3026
9.8
15
1024
Tob
acco
and
man
ufac
ture
d to
bacc
o su
bstit
utes
1322
.310
.110
309
12.2
7.5
520
25Sa
lt; s
ulph
ur; e
arth
& s
ton;
pla
ster
ing
mat
; lim
e77
10.2
3.1
020
756.
74.
75
2026
Ore
s, s
lag
and
ash
4110
010
1041
50
55
27M
iner
al fu
els,
oils
& p
rodu
cts
of th
eir d
istil
latio
n60
10.2
1.3
1020
606
2.4
010
28In
orgn
che
m; c
ompd
s of
pre
c m
tl, ra
dio
act e
lem
ent
191
100.
885
2018
35.
10.
55
1029
Org
anic
che
mic
als
340
9.85
0.85
510
340
4.9
0.65
05
30Ph
arm
aceu
tical
pro
duct
s36
0.83
1.9
05
320
00
031
Fert
ilize
rs33
50
55
265
05
532
Tan
ning
/dye
ing
extr
act;
tann
ins
& d
eriv
es; p
igm
.46
13.0
46.
9510
3056
10.3
6.3
520
33E
ssen
tial o
ils &
resi
nous
; per
f, co
smet
ic/to
ilet
3520
.857
10.1
110
3039
15.4
5.1
1020
34So
ap, o
rgan
ic s
urfa
ce-a
ctiv
e ag
ents
, was
hing
pre
p.26
257.
610
3027
15.4
5.4
520
35A
lbum
inoi
dal s
ubs;
mod
ifie
d st
arch
es; g
lues
; enz
y22
13.1
84.
7710
2015
9.4
1.8
510
36E
xplo
sive
s, p
yrop
allo
923
.310
1030
913
.47.
95
2037
Phot
ogra
phic
or c
inem
atog
raph
ic g
oods
3821
.611
.35
3037
18.5
4.4
520
38M
isce
llane
ous
chem
ical
pro
duct
s77
11.9
6.9
530
748.
82.
80
2039
Plas
tics
and
artic
les
ther
eof
130
13.8
7.6
1030
135
10.4
6.3
520
40R
ubbe
r and
art
icle
s th
ereo
f89
20.3
10.4
030
9111
6.1
020
41R
aw h
ides
and
ski
ns (o
ther
than
fur s
kins
) and
leat
her
3810
010
1038
8.7
2.2
510
42A
rtic
les
of le
athe
r; s
addl
ery/
harn
ess
2427
.95.
910
3024
18.8
3.4
1020
43Fu
r ski
ns a
nd a
rtif
icia
l fur
; man
ufac
ture
s th
ereo
f15
300
3030
149.
35.
15
2044
Woo
d an
d ar
ticle
s of
woo
d. W
ood
char
coal
563
29.7
2.8
030
7310
.64.
65
2045
Cor
k an
d ar
ticle
s of
cor
k7
100
1010
710
.76.
75
2046
Man
ufac
ture
s of
str
aw, e
spar
to/o
ther
pla
iting
mat
.5
300
3030
620
020
2047
Pulp
of w
ood/
of o
ther
fibr
ous
cellu
lose
mat
.20
100
1010
205
05
548
Pape
r & p
aper
boar
d; a
rt o
f pap
er p
ulp,
pap
er11
616
.49.
10
3011
211
.76.
20
2049
Prin
ted
book
s, n
ewsp
aper
s, p
ictu
res
& o
ther
pro
d.
2310
12.4
030
216.
79.
10
20
WA
EM
U's
MFN
rate
(Sen
egal
as
refe
renc
e)C
EM
AC
's M
FN ra
te
(Rep
. Con
go a
s re
fere
nce)

30
App
endi
x T
able
2. C
EM
AC
and
WA
EM
U’s
Tar
iff R
ates
(Con
t.)
HS
Num
ber o
f T
arif
f Lin
esA
vera
ge
MFN
Rat
eSt
anda
rd
Dev
iatio
nM
in M
FN
Rat
eM
ax M
FN
Rat
e N
umbe
r of
Tar
iff L
ines
Ave
rage
M
FN R
ate
Stan
dard
D
evia
tion
Min
MFN
R
ate
Max
MFN
R
ate
50Si
lk10
157.
110
3010
127.
15
2051
Woo
l, fi
ne/c
oars
e an
imal
hai
r, ho
rseh
air y
arn
3815
.89.
210
3038
11.1
6.8
520
52C
otto
n13
318
.56.
810
3014
314
.85.
45
2053
Oth
er v
eget
able
text
ile fi
bers
; pap
er y
arn
& w
ove
2912
.45.
110
3030
9.8
6.1
520
54M
an-m
ade
fila
men
ts73
14.7
6.7
1030
6715
.45.
15
2055
Man
-mad
e st
aple
fibe
rs11
515
.76.
910
3011
816
.24.
95
2056
Wad
ding
, fel
t & n
o w
oven
; yar
ns; t
win
e, c
orda
ge37
16.5
9.5
1030
3415
.75.
25
2057
Car
pets
, and
oth
er te
xtile
fab.
Lac
e; ta
pest
ry23
300
3030
2320
020
2058
Spec
ial w
oven
fab;
tuft
ed te
x. fa
b; la
ce;
4128
.83.
320
3041
200
2020
59Im
preg
nate
d, c
oate
d, c
over
/lam
inat
ed te
xtile
2520
1010
3024
15.8
510
2060
Kni
tted
or c
roch
eted
fabr
ics
4420
020
2044
200
2020
61A
rt o
f app
arel
& c
loth
ing
acce
ss; k
nitte
d or
cro
c11
630
030
3011
620
020
2062
Art
of a
ppar
el &
clo
thin
g ac
cess
; not
kni
tted
or c
roc
119
300
3030
119
200
2020
63O
ther
mad
e up
text
ile a
rtic
les,
set
s, w
orn
clot
h.
5928
.15.
710
3060
19.4
3.2
020
64Fo
otw
ear,
gaite
rs a
nd th
e al
ike
2928
.63.
520
3031
18.1
410
2065
Hea
dgea
r and
par
ts th
ereo
f13
300
3030
1116
.45
1020
66U
mbr
ella
s, w
alki
ng-s
ticks
, sea
t stic
ks, w
hips
730
030
307
15.7
5.3
1020
67Pr
ep. F
eath
ers
& d
own;
art
i flo
wer
; art
icle
s hu
man
830
030
308
200
2020
68A
rt o
f sto
ne, p
last
er, c
emen
t, as
best
os, m
ica/
sim
4924
.78.
910
3050
17.1
4.7
520
69C
eram
ic p
rodu
cts
3026
.77.
610
3030
185.
25
2070
Gla
ss a
nd g
lass
war
e63
22.6
9.8
530
7516
.25.
25
2071
Nat
ural
/Cul
ture
d pe
arls
, pre
c st
ones
& m
etal
s57
26.8
9.3
030
5310
.76.
10
2072
Iron
and
ste
el17
314
.54.
9810
2017
58.
55.
95
2073
Art
icle
s of
iron
or s
teel
132
19.2
8.5
1030
152
16.2
5.9
520
74C
oope
r and
art
icle
s th
ereo
f60
158.
310
3060
126.
85
2075
Nic
kel a
nd a
rtic
les
ther
eof
1710
010
1018
12.2
6.7
520
76A
lum
inum
and
art
icle
s th
ereo
f41
17.8
9.08
1030
4213
.36.
75
2078
Lea
d an
d ar
ticle
s th
ereo
f10
126.
310
3010
9.5
65
2079
Zin
c an
d ar
ticle
s th
ereo
f12
13.3
7.8
1030
1110
.97.
45
2080
Tin
and
art
icle
s th
ereo
f8
12.5
7.1
1030
811
.97
520
81O
ther
bas
e m
etal
s; c
emen
ts; a
rtic
les
ther
eof
5211
.55.
410
3051
10.4
75
2082
Too
l, im
plem
ent,
cutle
ry, s
poon
& fo
rk, o
f bas
e 66
20.3
710
3067
15.2
510
2083
Mis
cella
neou
s ar
ticle
s of
bas
e m
etal
3627
.55.
510
3037
18.4
3.7
1020
84N
ucle
ar re
acto
rs, b
oile
rs, m
chy
& m
ech
appl
ianc
e54
111
.95
5.04
030
522
6.8
4.2
520
85E
lect
rica
l mch
y eq
uip
part
s th
ereo
f; s
ound
reco
rd28
818
.58.
410
3029
512
.36.
50
2086
Rai
lw/tr
amw
locu
m, r
ollin
g-st
ock
& p
arts
ther
eof
3810
010
1024
50
55
87V
ehic
les
o/t r
ailw
/tram
w ro
ll-st
ock,
pts
& a
cces
s14
520
.68.
45
3015
312
.26.
20
2088
Air
craf
t, sp
acec
raft
, and
par
ts th
ereo
f16
1.25
3.4
010
165
05
589
Ship
s, b
oats
and
floa
ting
stru
ctur
es27
12.6
7.6
030
287.
75.
45
2090
Opt
ical
, pho
to, c
ine,
mea
s, c
heck
ing,
pre
cisi
on16
712
.87.
75
3016
69.
56.
40
2091
Clo
cks
and
wat
ches
and
par
ts th
ereo
f53
25.1
5.04
2030
5319
.61.
910
2092
Mus
ical
inst
rum
ents
; par
ts a
nd a
cces
s of
2327
.84.
220
3023
100
1010
93A
rms
and
amm
uniti
on; p
arts
and
acc
esso
ries
ther
eof
2225
.95.
0320
3060
14.8
5.4
520
94Fu
rnitu
re, b
eddi
ng, m
attr
ess,
mat
t sup
port
, 41
26.9
56.
45
3038
17.9
4.6
520
95T
oys,
gam
es &
spo
rts
requ
isite
s; p
arts
& a
cces
s44
300
3030
4418
.74.
35
2096
Mis
cella
neou
s m
anuf
actu
red
artic
les
5126
.75.
910
3050
19.5
2.5
520
97W
orks
of a
rt, c
olle
ctor
s' pi
eces
and
ant
ique
s 7
300
3030
720
020
20
CE
MA
C's
MFN
rate
(R
ep. C
ongo
as
refe
renc
e)
WA
EM
U's
MFN
rate
(Sen
egal
as
refe
renc
e)
So
urce
: TR
AIN
S D
atab
ase
(200
6)

31
A
ppen
dix
Tab
le 3
A. B
usin
ess-
rela
ted
Non
tari
ff B
arri
ers,
2006
CEM
AC
Coun
tries
WA
EMU
Co
untri
es
(min
,max
)(m
in,m
ax)
Busin
ess C
limat
e
Ease
of D
oing
Bus
ines
s[1
32,1
72]
152
172
167
132
171
[137
, 163
]13
716
314
115
516
014
615
113
1St
artin
g a B
usin
ess
[132
,174
]15
217
413
214
214
6[1
26, 1
69]
126
131
154
163
147
150
169
125
Dea
ling
with
Lic
ense
s[5
4, 1
51]
151
114
148
5495
[66,
168
]13
316
815
812
212
666
132
110
Empl
oyin
g W
orke
rs[1
35, 1
63]
135
148
160
159
163
[131
, 168
]12
115
313
313
116
815
214
511
8Re
giste
ring
Prop
erty
[92,
163
]13
112
292
149
163
[85,
164
]85
164
101
9310
315
115
512
1G
ettin
g Cr
edit
[101
, 117
]11
711
711
710
111
7[1
17, 1
43]
117
117
143
143
143
143
143
112
Prot
ectin
g In
vesto
rs[4
6, 9
9]60
9946
9983
[46,
135
]46
9999
9999
135
135
92Pa
ying
Tax
es[9
4, 1
71]
143
132
171
9417
0[1
15, 1
62]
162
129
134
141
115
159
130
104
Trad
ing
Acr
oss B
orde
rs[1
12, 1
66]
140
157
156
112
166
[64,
174
]13
015
413
216
717
494
6412
4En
forc
ing
Cont
ract
s[7
7, 1
71]
170
171
161
7715
5[9
2, 1
62]
162
143
9214
010
413
812
311
1Cl
osin
g a
Busin
ess
[96,
151
]96
151
151
130
110
[68,
129
]98
9068
9912
974
8811
1
Gab
on
CEM
AC
WA
EMU
Sub-
Saha
ran
Econ
omie
s
(ave
rage
)Ca
mer
oon
Chad
Cent
ral
Afri
can
Repu
blic
Rep.
Con
go
Beni
nBu
rkin
a Fa
so
Côte
d’
Ivoi
reM
ali
Nig
erSe
nega
l To
go
S O
UR
CE:
WO
RLD
BA
NK
(200
6) A
ND
IMF
STA
FF

32
App
endi
x T
able
3B
. Tra
de-r
elat
ed N
onta
riff
Bar
rier
s, 20
06
Doc
umen
ts fo
r Exp
ort
(num
ber)
810
79
412
8.2
89
910
..6
7Ti
me
for E
xpor
t (da
ys)
5138
8763
1950
40.8
3569
2166
..22
32C
ost t
o Ex
port
(USD
per
co
ntai
ner)
1,92
452
41,
860
1,50
24,
000
1,73
21,
182
980
1,21
578
11,
752
..97
846
3D
ocum
ents
for I
mpo
rt (n
umbe
r)14
1414
1910
1513
.911
1319
1619
109
Tim
e fo
r Im
port
(day
s)62
5111
160
2662
54.1
4866
4861
8926
41C
ost t
o Im
port
(USD
per
co
ntai
ner)
2,31
31,
360
2,40
01,
572
4,03
12,
201
1,83
71,
452
1,70
01,
395
2,68
03,
266
1,67
469
51/
In a
vera
ge
CEM
AC
C
ount
ries 1
/W
AEM
U
Cou
ntrie
s 1/
Gab
onTr
adin
g Ac
ross
Bor
ders
C
amer
oon
Cha
dC
entra
l A
fric
an
Rep
ublic
Rep
. Con
go
Ben
inB
urki
na
Faso
C
ôte
d’Iv
oire
Sour
ce: W
orld
Ban
k (2
006)
and
IMF
Staf
f
Mal
i N
iger
Sene
gal
Togo