trade - ministry of statistics and program implementation · trade classification revission-2...
TRANSCRIPT

TRADE Foreign Trade
The figures represent trade with foreign countries both on private and government accounts, registered at Indian sea-ports, airports and land custom stations. Statistics are recorded on the basis of the general system of registration under which the goods arriving from abroad are first included under imports and when they are shipped again they are included under re-exports. With effect from April, 1963 trade arising in Goa, Daman & Diu, Andaman & Nicobar Islands and Lakshadweep is included. In the case of Nepal airborne trade alone was covered upto March, 1964, subsequently it covers trade both by land and air. The sources of foreign trade statistics are customs and central excise authorities. These are compiled by the Directorate General of Commercial Intelligence & Statistics from the bills of entry and shipping bills.
Table 13.1
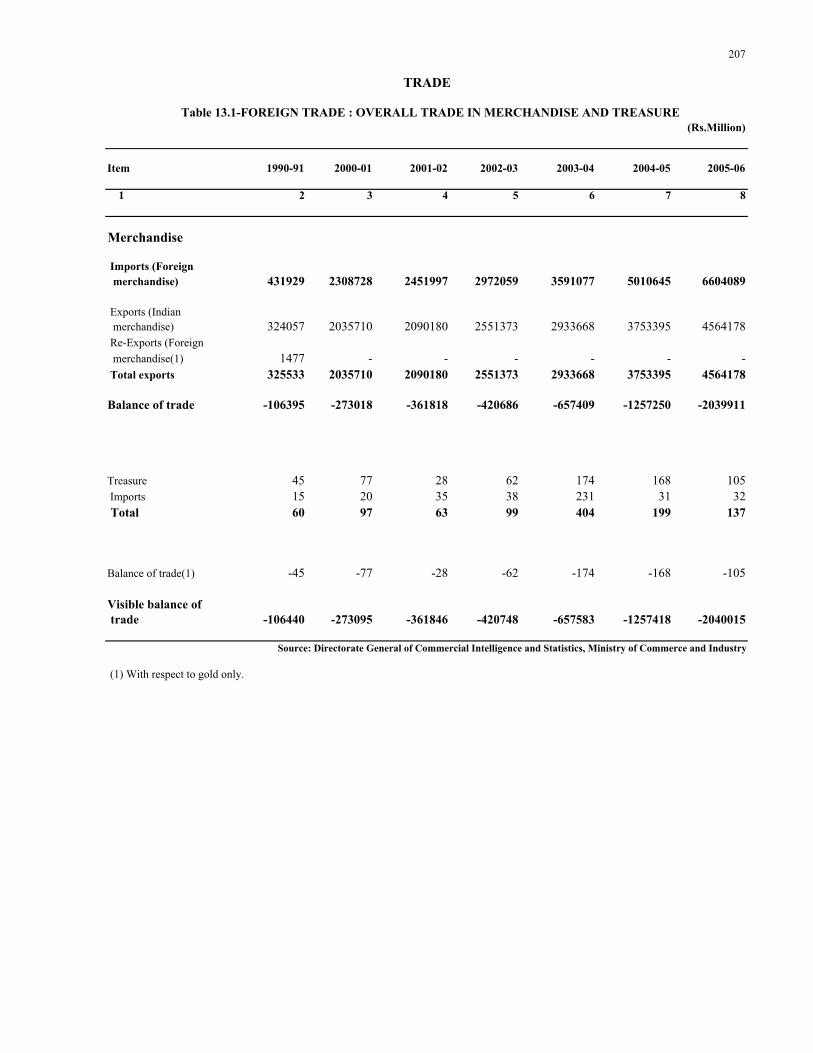
From April 1948 total value of foreign trade of India by all routes (i.e sea, air and land) has been taken into account for the purpose of calculating the balance of trade. All foreign trade transactions in gold, currency notes and coins are included under treasure. Balance of trade in treasure refers to gold and silver upto December 1956 and thereafter to gold only. Trade in silver is included under merchandise after December 1956.
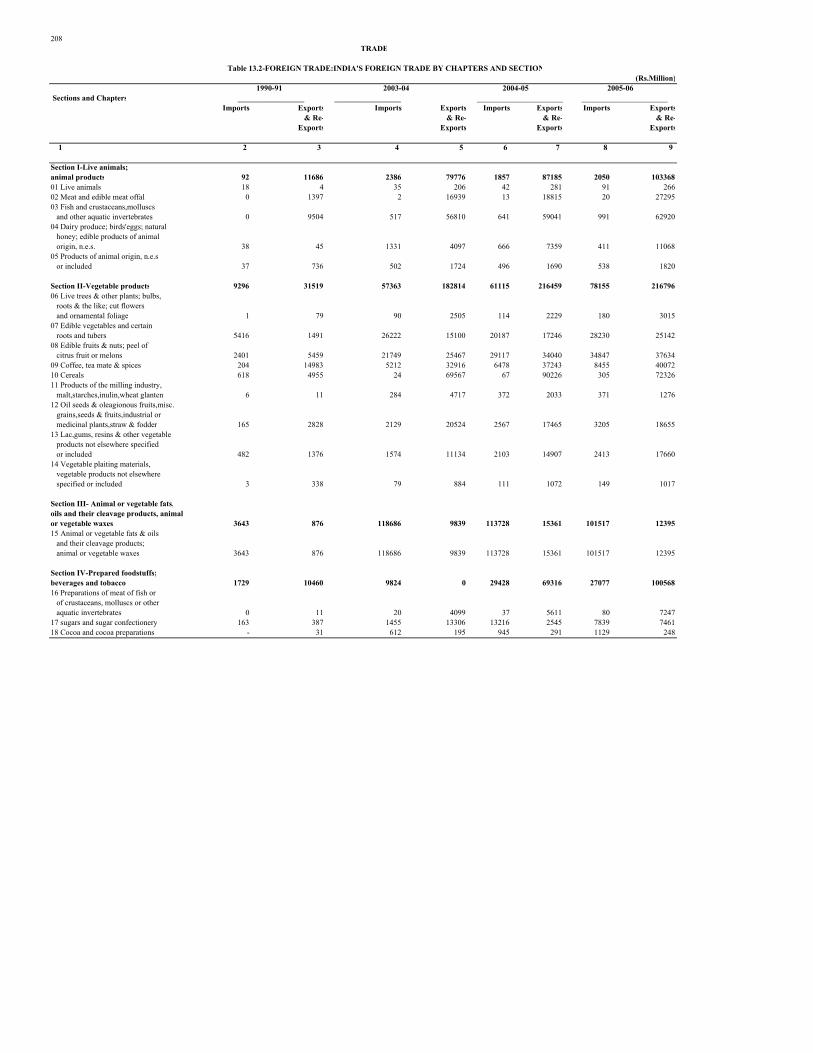
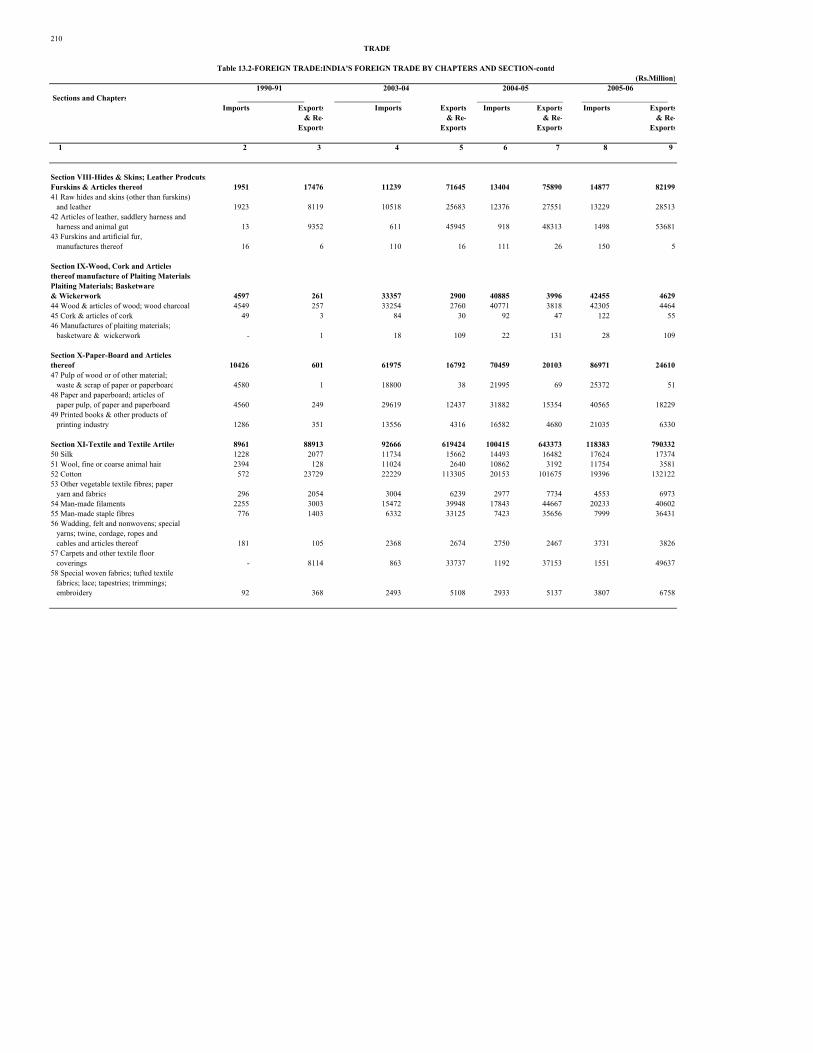
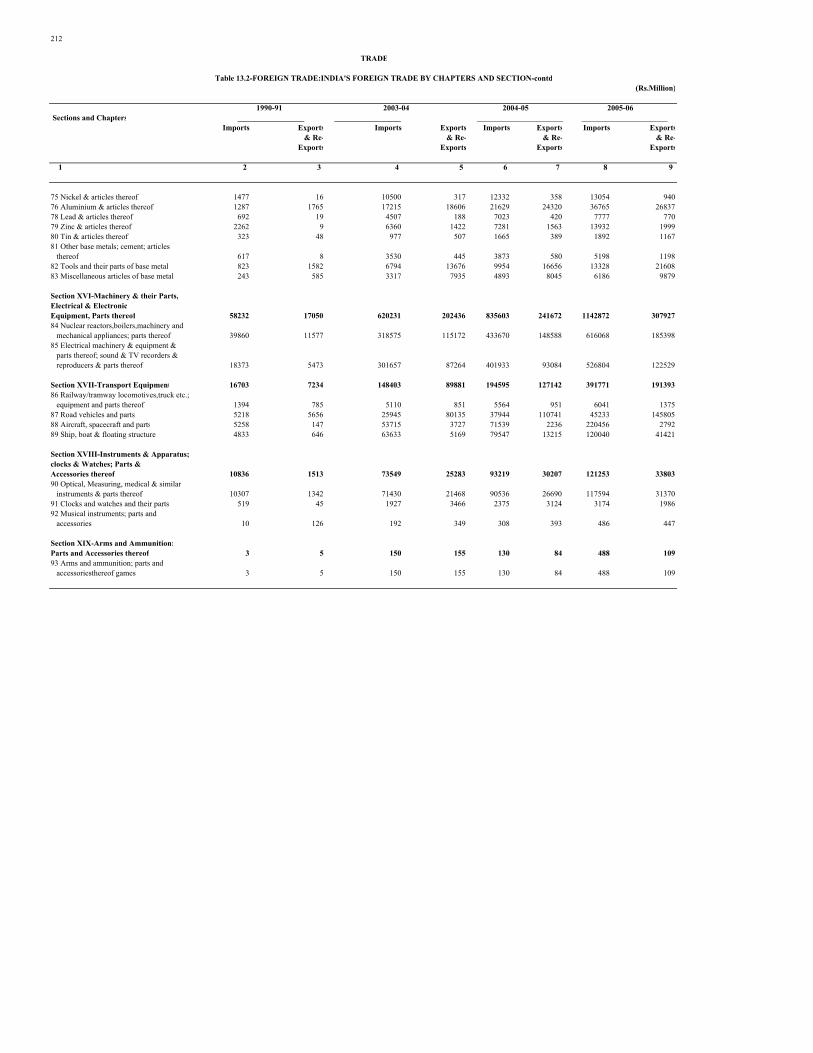
Table 13.2
The data for Imports, Exports and Re-exports given in this table are according to the Indian Trade Classification Revission-2 adopted from April, 1977 and followed upto March, 1987. From April 1987, a new system of commodity classification known as Indian Trade Classification (based on Harmonised Commodity description and coding system) has been adopted. Data for Imports, exports and re-exports is given by section and chapters.
Tables 13.3 and 13.6
Import figures generally show the trade as declared by importers in the bills of entry (applications for clearance) and as checked by custom officials.
Goods entered for storage in bonded warehouses and afterwards exported there from are included
under 'imports and re-exports'. Transshipment trade is not recognised for the purposes of Indian trade returns and is, thus, not included here. Direct transit trade is also excluded while indirect transit trade is included as imports first and then as re-exports.
Imports of baggage of passengers are not included since November, 1964. All dutiable
articles imported from foreign countries by parcel or letter post are included. Trade in defence store is omitted with effect from October 1979. The diplomatic goods, Gold and current coins & notes, ships stores are excluded.
199
TRADE-Contd.
Tables 13.4 and 13.7
Export figures represent actual shipments as checked by the custom officials. The figures of exports relate to Indian merchandise alone and re-exports relate to foreign merchandise previously imported into India and than exported from India. Direct transit trade, transshipment trade, passenger's baggage, ship's stores, defence stores, transaction in treasures i.e. gold and current coins & notes, diplomatic goods are excluded.
All articles dispatched to foreign countries by parcel or letter post are included since 1964-65. Transactions in silver (other than current coins) and in notes & coins not in circulation or withdrawn from circulation and indirect transit trade are also included.
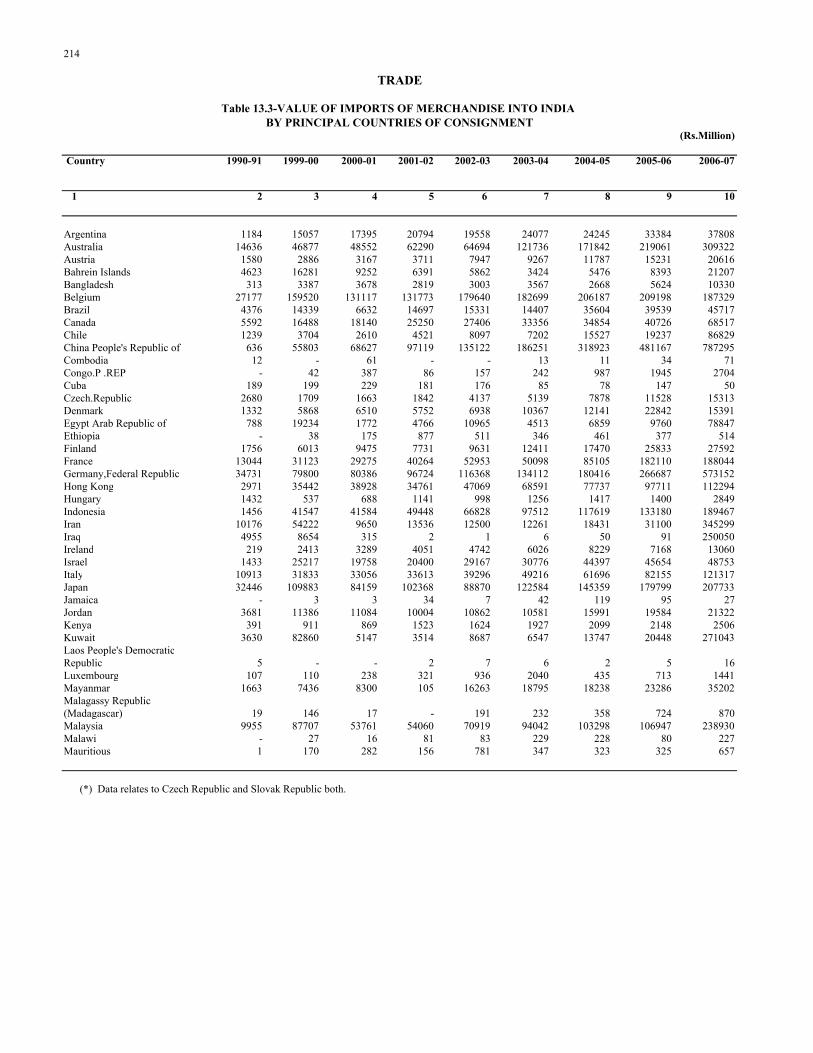
Classification of Trade by Countries-Tables 13.3 and 13.4 Imports are classified with reference to the countries whence they were consigned to India and not with reference to the countries whence they were shipped direct to India. The country of consignment is defined as that from which the goods have come whether by land and sea or by sea only or by air, without interruption of transit save in the course of transshipment or transfer from one means of conveyance to another. Thus the countries where goods are consigned are not in all cases the countries of actual origin of goods since goods produced in one country may be purchased by a firm in another country and then dispatched after an interval to India.
Exports are credited to the country of final destination as declared by exporters in the shipping bill whether that country possesses a sea-port or not. The country of final destination is defined as that to which goods exported from India are intended to pass whether by sea and land or by sea only or by air without interruption of transit, save in the course of transshipment or transfer from one means of conveyance to another.
The figures are those declared by importers and exporters in the bills of entry and shipping bills. The value of goods represents the wholesale cash price less trade discount for which goods(i) the like and quality are sold or are capable of being sold at the time and place of importation or exportation as the case may be without any abatement or deduction whatever, except that in the case of goods imported, of the amount of duties payable on the importation thereof, or (ii) where such price is not ascertainable the cost at which the goods of the like quality could be delivered at such place without any abatement or deduction except as aforesaid. Import valuation in practice corresponds to c.i.f. method. Export valuation is based on f.o.b inclusive of export duty and/or cess where leviable. Tables 13.5
This table gives data on the value of merchandise trade for the years 2003-04, 2004-05, 2005-06 and 2006-07. According to 'revised economic regions. The regions are as follows.
Region 01:Economic Community of West African States (ECOWAS) Benin; Burkina Faso; Cape Verde; Cote d' Ivoire; Ghana; Gambia; Guinea; Guinea-Bissau; Liberia; Mali; Mauritania: Niger; Nigeria; Senegal; Sierra Leone, Togo.
200

TRADE-Contd. Region 02: Southern African Development Community (SADC) Angola; Botswana; Congo. Demo. Rep.; Lesotho; Malawi; Mozambique; Mauritius; Namibia; Swaziland; Seychelles; South Africa; Tanzania Rep; Zambia', Zimbabwe. Region 03: Organisation of American States (OAS) Antigua and Barbuda; Argentina; Bahamas; Barbados; Belize; Bolivia; Brazil; Canada; Chile; Colombia; Costa Rica Cuba; Dominica; Dominican Republic; Ecuador; EI Salvador; Grenada; Guatemala; Guyana; Haiti; Honduras; Jamaica; Mexico; Nicaragua; Panama Republic; Paraguay; Peru; St. Christopher and Nevis; St Lucia; St Vincent and the Grenadines; Surinam; Trinidad and Tobago; USA; Uruguay;Venezuela. Region 04: Association of Caribbean States (ACS) Antigua and Barbuda; Bahamas; Barbados; Belize; Colombia; Costa Rica; Cuba; Dominica; Dominican Republic; EI Salvador; Grenada; Guatemala; Guyana; Haiti; Honduras; Jamaica; Mexico; Nicaragua; Panama Republic; St. Lucia St. Christopher and Nevis; St Vincent and the Grenadines; Surinam; Trinidad and Tobago,Venezuela. Region 05: Pacific Island Forum (PIF) Australia; Cook Islands; Fiji Islands; Kiribati Rep; Marshall Islands; Micronesia; Nauru Republic; New Zealand; Niue Islands; Palau; Papua New Guinea; Samoa (Ameri); Solomon Islands; Tonga; Tuvalu; Vanuatu Republic. Region 06: Organisation of the Petroleum Exporting Countries (OPEC) Algeria; Indonesia; Iran; Iraq; Kuwait; Libya;Nigeria; Qatar; Saudi Arabia; United Arab Emirates; Venezuela. Region 07: Asia Pacific Economic Cooperation Australia; Brunei; Canada; Chile; China P.R.P.; Hong Kong; Indonesia; Japan; Korea Republic; Malaysia; Mexico; New Zealand; Papua New Guinea; Peru; Philippines; Russia; Singapore; Taipei (Taiwan); Thailand; USA; Vietnam Soc. Rep. Region 08: South Asian Association for Regional Cooperation (SAARC) Bangladesh; Bhutan; India; Maldives; Nepal; Pakistan, Sri Lanka. Region 09:Association of South East Asian Nations (ASEAN) Brunei; Cambodia; Indonesia; Lao PD RP; Malaysia; Mayanmar; Philippines; Singapore; Thailand; Vietnam Soc. Rep. Region 10: Economic Cooperation Organization (ECO) Afghanistan; Azerbaijan; Iran; Kazakhstan; Kyrgyzstan; Pakistan; Turkey; Tajikistan; Turkmenistan;Uzbekistan. Region 11: European Union (EU) Austria; Belgium; Denmark; Finland ;France,Germany; Greece; Republic of Ireland; Italy; Luxembourg; Netherlands; Portugal; Spain; Sweden;U.K.
201

TRADE-Contd. Region 12: European Free Trade Association (EFTA) Iceland; Liechtenstin; Norway; Switzerland Region 13: Black Sea Economic Co-operation Group (BSEC) Albania; Armenia; Azerbaijan; Bulgaria; Georgia; Greece; Moldova; Romania; Russia; Turkey,Ukraine. Region 14: Council of Baltic Sea States Denmark; Estonia; Finland; Germany; Iceland; Latvia; Lithuania; Norway; Poland; Russia, Sweden. Region 15: Commonwealth of Independent States (CIS) Armenia; Azerbaijan ; Belarus ; Georgia; Kazakhstan; Kyrgyzstan; Moldova; Russia; Tajikistan; Turkmenistan; Ukraine,Uzbekistan Tables 13.8 and 13.9
Many significant changes took place in the pattern of Indian foreign trade since 1958 and particularly from 1980. New commodities entered into the exports and many other items which were insignificant earlier gained importance. The commodity composition of imports, too, changed with the changing needs of the country. In view of changing pattern of foreign trade, the base period was further changed to 1978-79 from 1968-69 and the corresponding commodities basket was revised.
Scope and coverage
In order to ensure adequate coverage of trade for the new series of index numbers ,the number of items included in case of exports and imports has been increased to 738 and 623 respectively as against 489 and 511 in the old series. The coverage of revised commodity basket accounts for 85 per cent of the value of exports and imports for the year 1978-79.
Method of Construction
As in the case of old series, the revised Index Numbers are of the fixed base type. The Unit Value (price) Index numbers are calculated according to the Paasche formula and the Quantum Index Numbers according to the Laspeyres formula; these are, however, not computed separately but are derived from the former indices i.e. Unit Value Index Numbers.
The method of calculation of Unit Value Indices briefly consists of comparing the trade in the
current period with that valued at base period prices. Symbolically, the Unit Value Index Number is given by the formula:
Σ Pn qn P= ----------------
Σ Po qn
Where Po and Pn denote the unit value of an article in the base period and the current period respectively and Q the quantity traded in the current periods.
202
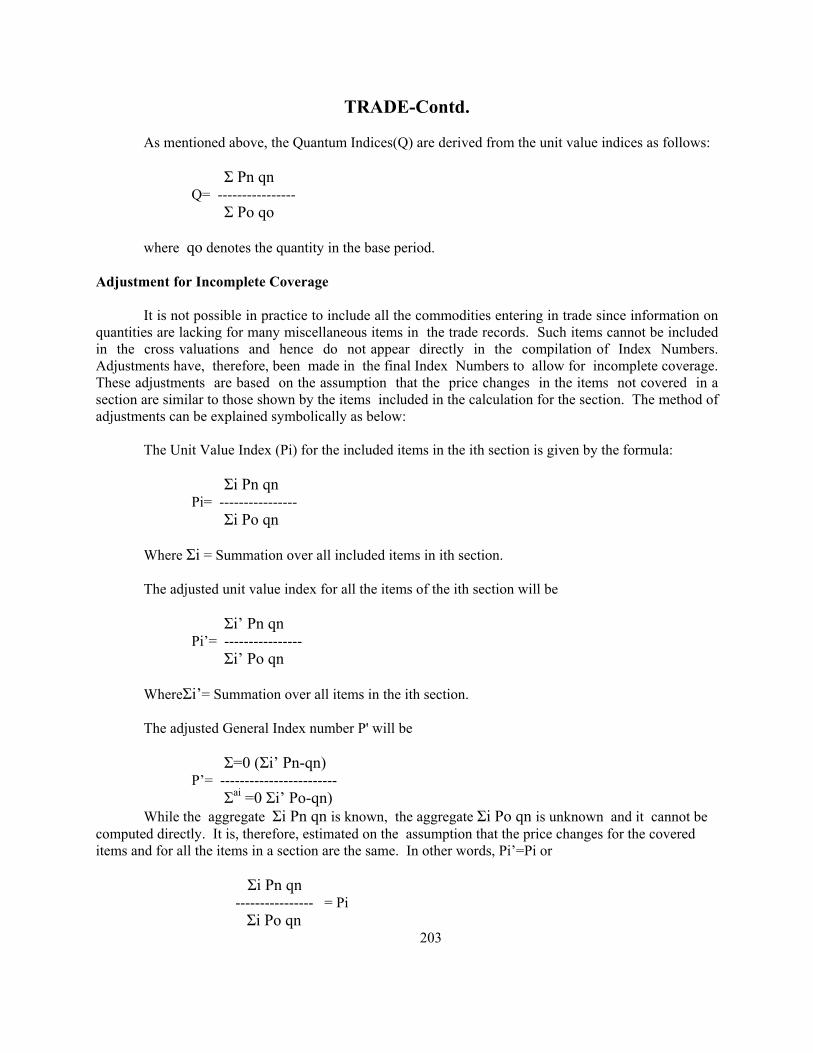
TRADE-Contd. As mentioned above, the Quantum Indices(Q) are derived from the unit value indices as follows:
Σ Pn qn
Q= ---------------- Σ Po qo
where qo denotes the quantity in the base period.
Adjustment for Incomplete Coverage
It is not possible in practice to include all the commodities entering in trade since information on quantities are lacking for many miscellaneous items in the trade records. Such items cannot be included in the cross valuations and hence do not appear directly in the compilation of Index Numbers. Adjustments have, therefore, been made in the final Index Numbers to allow for incomplete coverage. These adjustments are based on the assumption that the price changes in the items not covered in a section are similar to those shown by the items included in the calculation for the section. The method of adjustments can be explained symbolically as below:
The Unit Value Index (Pi) for the included items in the ith section is given by the formula: Σi Pn qn
Pi= ---------------- Σi Po qn Where Σi = Summation over all included items in ith section. The adjusted unit value index for all the items of the ith section will be Σi’ Pn qn
Pi’= ---------------- Σi’ Po qn WhereΣi’= Summation over all items in the ith section. The adjusted General Index number P' will be Σ=0 (Σi’ Pn-qn)
P’= ------------------------ Σai =0 Σi’ Po-qn) While the aggregate Σi Pn qn is known, the aggregate Σi Po qn is unknown and it cannot be
computed directly. It is, therefore, estimated on the assumption that the price changes for the covered items and for all the items in a section are the same. In other words, Pi’=Pi or
Σi Pn qn ---------------- = Pi
Σi Po qn 203

TRADE-Contd. So Σ Pn qn
Σi Po qn = ---------------- Pi
Total value of all items in the ith section Σi Po qn = ------------------------------------------------
Unadjusted unit value Index for the ith section
The adjusted General Unit Value Index Number P’ is obtained by substituting the above value of Σi’ Po qn in above equation.
Quantum Indices are similarly adjusted for incomplete coverage by using the adjusted Unit
Value Index instead of the unadjusted Index occurring in the formula for deriving the Quantum Indices. Linking of the old and revised series The linking of the new series of index numbers I (new) with the old series I(old) would be possible by the application of the formula given below:
I (old)=K^I (new) Σ I (old) i Where K^ = ------------- Σ I (new) i
An empirical study has demonstrated that this formula gives more precise results than the other formulae meant for this purpose. I n I(Old)
(i) I(old) = C^I (new). where C^ = ------- Σ ----------- and n i=I I (New) C^1 (New)n= number of years of data used. Cov [I(old)I(new)] (ii) I(old) =a^ +b^I(new) where b^ ---------------------- and Var [I(new)] a^=I(old)-b^I(new) Coastal Trade Tables 13.10 and 13.11
Coasting trade statistics represent the inland trade registered at the ports in the States, that is, the trade between one State on one side and all other States on the other. The trade among ports within the same state has been stated as internal trade within the same maritime block.
204

TRADE-Contd. The following Maritime Blocks each of which corresponds to a Maritime State or Union
Territory have been adopted from April,1957: (1) West Bengal,(2) Orissa,(3) Andhra Pradesh,(4) Tamil Nadu,(5) Kerala,(6) Karnataka,(7)
Mumbai (8) Andaman and Nicobar Islands and (9) Lakshadweep. Further, consequent on bifurcation of Bombay State into two corresponding maritime blocks(1)
Maharashtra and (2) Gujarat are being shown from April, 1961. Pondicherry has been adopted as a maritime block with effect from the same date and Goa, from April,1963. These are that 12 maritime blocks had in respect of each of which coastal trade is recorded from April,1963.
In pursuance of Government orders with effect from April,1964 coastal trade statistics are
being compiled on import basis from daily trade returns received from the ports open to coastal trade. Export figures are being derived from import data, as imports into one port represents the exports from other ports.
Inland Trade Table 13.12 (A) & 13.12 (B)
Nature and scope-Inland Trade Statistics represent the movement of assignments pertaining to 78 items by railways and on steamer service, from and into a State taken as a whole or a chief port or ports, the trade of which is registered separately from that of the state in which such port or ports may be situated. Movement of trade by other means (e.g. road, air, country boats etc.) is thus excluded from the scope of these statistics.
Trade Block- Prior to April,1962 there were 29 Trade Blocks. The list has since been amplified with a view to taking into account the bifurcation of the erstwhile Bombay State into Gujarat and Maharashtra. It was further amplified in April,1965 to provide for separate formation of Nagaland.For the purposes of accounts,and as from April,1965,India is divided into 31 Trade Blocks, representing the States and Union Territories except Andhra Pradesh, Gujarat, Kerala, Tamil Nadu, Maharashtra, Karnataka and West Bengal which have been constituted into more than one Trade Block. The Reorganisation of the Punjab and Himachal Pradesh has been given effect from April, 1967. Chandigarh is shown as a separate Trade Block since April 1967.
Further, a new trade block of Kandla was introduced in April,1975 and three more trade blocks
namely Meghalaya, Arunachal Pradesh and Mizoram were introduced in April,1976. Thus number of trade blocks stood 38 in April, 1976.
Method of Registration- The figures from April,1965 onwards represent actual exports from
each trade block. According to arrangement in force, each of the railways and the steamer companies registers such traffic as is dispatched from stations on its line within a particular trade block to other trade blocks.Prior to April,1965 these figures were recorded on imports' basis. In case of Tripura, howevere,there is no railway or steamer station or out-agency within the trade block, and special arrangements have been made to record the trade. The trade of this block is recorded by the following agencies:
205
TRADE-Concld.
(1) in respect of trade via the Bangladesh Railway by certain land and customs stations on the Tripura Bangladesh border; (2) in respect of trade via Patharkandi station on the Assam-Tripura border, by the North East Frontier Railway.
River borne trade- The statistics upto the period ending August,1965 cover only the trade carried by the River Steam Navigation Co.Ltd. between the trade blocks mentioned below.
(1) Kolkata (2) Assam (3) West Bengal (excluding Kolkata) No account is taken of (a) trade carried by other steamer owners or boat-owners between these trade blocks or (b) river borne trade between other trade blocks.
For the purposes of registration, trade originating in a railway and transshipped, through booking arrangements, at a railway station to a steamer for conveyance to a river station, is treated as carried wholly by rail. The above company, however, suspended its steamer service from September, 1965. Thus the statistics relate only to rail-borne trade from September,1965 to 1971-72, thereafter i.e. from 1972-73 the Central Inland Water Transport Corporation Ltd.,Kolkata,are furnishing statistics in respect of river borne trade between the above mentioned blocks.
Articles and Units of measurement- The trade in certain staple articles only is recorded and
the weight recorded is the net weight i.e.,the gross weight entered in the invoices less certain fixed percentage which have been taken to represent the weight of packing etc. From 1978-79 the weight recorded is the Gross weight. Values are not recorded. Figure of oilseeds represent the trade in the following varieties: (1) castor, (2) cottonseed, (3) groundnut,(4)linseed,(5)rape and mustard,(6)til (jinjili). Cotton Piecegoods include both Indian and foreign. Jute raw includes both loose and pucca bales. Raw cotton figures do not make distinction between ginned and unginned.
Period- Figures relate generally to the financial year April-March, but in the case of raw cotton
figures relate to the year September-August.
206
207
Item 1990-91 2000-01 2001-02 2002-03 2003-04 2004-05 2005-06
1 2 3 4 5 6 7 8
Merchandise
Imports (Foreign merchandise) 431929 2308728 2451997 2972059 3591077 5010645 6604089
Exports (Indian merchandise) 324057 2035710 2090180 2551373 2933668 3753395 4564178 Re-Exports (Foreign merchandise(1) 1477 - - - - - - Total exports 325533 2035710 2090180 2551373 2933668 3753395 4564178
Balance of trade -106395 -273018 -361818 -420686 -657409 -1257250 -2039911
Treasure 45 77 28 62 174 168 105 Imports 15 20 35 38 231 31 32 Total 60 97 63 99 404 199 137
Balance of trade(1) -45 -77 -28 -62 -174 -168 -105
Visible balance of trade -106440 -273095 -361846 -420748 -657583 -1257418 -2040015
(1) With respect to gold only.
TRADE
(Rs.Million) Table 13.1-FOREIGN TRADE : OVERALL TRADE IN MERCHANDISE AND TREASURE
Source: Directorate General of Commercial Intelligence and Statistics, Ministry of Commerce and Industry
208
(Rs.Million)
Sections and Chapters _________________Imports Exports Imports Exports Imports Exports Imports Exports
& Re- & Re- & Re- & Re- Exports Exports Exports Exports
1 2 3 4 5 6 7 8 9
Section I-Live animals;animal products 92 11686 2386 79776 1857 87185 2050 10336801 Live animals 18 4 35 206 42 281 91 26602 Meat and edible meat offal 0 1397 2 16939 13 18815 20 2729503 Fish and crustaceans,molluscs and other aquatic invertebrates 0 9504 517 56810 641 59041 991 6292004 Dairy produce; birds'eggs; natural honey; edible products of animal origin, n.e.s. 38 45 1331 4097 666 7359 411 1106805 Products of animal origin, n.e.s or included 37 736 502 1724 496 1690 538 1820
Section II-Vegetable products 9296 31519 57363 182814 61115 216459 78155 21679606 Live trees & other plants; bulbs, roots & the like; cut flowers and ornamental foliage 1 79 90 2505 114 2229 180 301507 Edible vegetables and certain roots and tubers 5416 1491 26222 15100 20187 17246 28230 2514208 Edible fruits & nuts; peel of citrus fruit or melons 2401 5459 21749 25467 29117 34040 34847 3763409 Coffee, tea mate & spices 204 14983 5212 32916 6478 37243 8455 4007210 Cereals 618 4955 24 69567 67 90226 305 7232611 Products of the milling industry, malt,starches,inulin,wheat glanten 6 11 284 4717 372 2033 371 127612 Oil seeds & oleagionous fruits,misc. grains,seeds & fruits,industrial or medicinal plants,straw & fodder 165 2828 2129 20524 2567 17465 3205 1865513 Lac,gums, resins & other vegetable products not elsewhere specified or included 482 1376 1574 11134 2103 14907 2413 1766014 Vegetable plaiting materials, vegetable products not elsewhere specified or included 3 338 79 884 111 1072 149 1017
Section III- Animal or vegetable fats,oils and their cleavage products, animal or vegetable waxes 3643 876 118686 9839 113728 15361 101517 1239515 Animal or vegetable fats & oils and their cleavage products; animal or vegetable waxes 3643 876 118686 9839 113728 15361 101517 12395
Section IV-Prepared foodstuffs;beverages and tobacco 1729 10460 9824 0 29428 69316 27077 10056816 Preparations of meat of fish or of crustaceans, molluscs or other aquatic invertebrates 0 11 20 4099 37 5611 80 724717 sugars and sugar confectionery 163 387 1455 13306 13216 2545 7839 746118 Cocoa and cocoa preparations - 31 612 195 945 291 1129 248
2004-05 2005-06
TRADE
Table 13.2-FOREIGN TRADE:INDIA'S FOREIGN TRADE BY CHAPTERS AND SECTION
1990-91 _________________ ______________________ ______________________
2003-04

209
(Rs.Million)
Sections and Chapters _________________Imports Exports Imports Exports Imports Exports Imports Exports
& Re- & Re- & Re- & Re- Exports Exports Exports Exports
1 2 3 4 5 6 7 8 9
19 Preparations of cereals,flour,starch or milk; pastry-cooks'products 1208 219 856 3129 1109 4000 1251 542820 Preparations of vegetables, fruit, nuts or other parts of plants 1 297 785 3948 845 4429 972 683321 Miscellaneous edible preparations 189 460 665 6281 751 6173 1077 774822 Beverages, spirits and vinegar 100 325 1377 1251 7587 1421 9675 258223 Residues and waste from the food industries; prepared animal fodder 50 6097 3485 34003 3828 32299 4260 4971424 Tobacco and Manufactured tobacco substitutes 17 2634 569 10965 1110 12546 794 13307
Section V-Mineral products 128072 24447 1084883 260354 1639131 526072 2329511 76271225 Salt; sulphur; earths and stone; plastering materials, lime and cement 8173 3288 18498 28687 29054 37251 33730 4020426 Ores, slag and ash 2016 11680 23274 60068 45622 167992 68379 19713327 Mineral fuels, mineral oils & products;bituminous substances; mineral waxes 117884 9480 1043111 171598 1564455 320829 2227402 525376
Section VI- Products of the Chemical or Allied Industries 46956 25487 311796 304203 411106 372809 528537 47633228 Inorganic chemicals; compounds of precious metals,of rare-earth metals,of radio-active of radio-active elements or isotopes 8579 3072 59163 19488 81301 28716 104459 3430629 Organic chemicals 15898 4528 143630 129746 187849 162674 227752 21504030 Pharmaceutical products 2818 7676 11499 74445 13028 92634 19491 10821231 Fertilizers 11413 2 23139 333 43207 590 74238 50732 Dyeing, tanning and colouring matter 1687 4238 16170 31116 18784 31113 22446 3749733 Essential oils and resinoids; cosmetic and other similar preparations 795 2804 4557 14593 5877 13335 6842 1930534 Soap & other similar preparations; polishes & creams; candles and the like, dental waxes & preparations 628 1600 6086 3034 6585 3215 8048 483535 Albuminoidal substances; modified starches; glues; enzymes 322 27 2681 3238 3209 4844 4164 614136 Explosives; matches; certain combustible preparations 19 45 132 716 238 1114 228 147637 Photographic or cinematographic goods 1953 185 11119 1061 10575 1327 10623 124038 Miscellaneous chemical products 2843 1311 33621 26434 40453 33248 50247 47774
Section VII-Plastics & Rubber 14781 3912 79329 91975 105367 128721 145996 14147539 Plastics and articles thereof 11506 1427 56853 61369 74917 94590 113183 9565440 Rubber and articles thereof 3275 2486 22476 30605 30450 34131 32812 45821
2003-04 2005-06
Table 13.2-FOREIGN TRADE:INDIA'S FOREIGN TRADE BY CHAPTERS AND SECTION-contd
_________________ ______________________ ______________________
TRADE
1990-91 2004-05
210
(Rs.Million)
Sections and Chapters _________________Imports Exports Imports Exports Imports Exports Imports Exports
& Re- & Re- & Re- & Re- Exports Exports Exports Exports
1 2 3 4 5 6 7 8 9
Section VIII-Hides & Skins; Leather Prodcuts;Furskins & Articles thereof 1951 17476 11239 71645 13404 75890 14877 8219941 Raw hides and skins (other than furskins) and leather 1923 8119 10518 25683 12376 27551 13229 2851342 Articles of leather, saddlery harness and harness and animal gut 13 9352 611 45945 918 48313 1498 5368143 Furskins and artificial fur, manufactures thereof 16 6 110 16 111 26 150 5
Section IX-Wood, Cork and Articlesthereof manufacture of Plaiting Materials;Plaiting Materials; Basketware& Wickerwork 4597 261 33357 2900 40885 3996 42455 462944 Wood & articles of wood; wood charcoal 4549 257 33254 2760 40771 3818 42305 446445 Cork & articles of cork 49 3 84 30 92 47 122 5546 Manufactures of plaiting materials; basketware & wickerwork - 1 18 109 22 131 28 109
Section X-Paper-Board and Articles thereof 10426 601 61975 16792 70459 20103 86971 2461047 Pulp of wood or of other material; waste & scrap of paper or paperboard 4580 1 18800 38 21995 69 25372 5148 Paper and paperboard; articles of paper pulp, of paper and paperboard 4560 249 29619 12437 31882 15354 40565 1822949 Printed books & other products of printing industry 1286 351 13556 4316 16582 4680 21035 6330
Section XI-Textile and Textile Artiles 8961 88913 92666 619424 100415 643373 118383 79033250 Silk 1228 2077 11734 15662 14493 16482 17624 1737451 Wool, fine or coarse animal hair 2394 128 11024 2640 10862 3192 11754 358152 Cotton 572 23729 22229 113305 20153 101675 19396 13212253 Other vegetable textile fibres; paper yarn and fabrics 296 2054 3004 6239 2977 7734 4553 697354 Man-made filaments 2255 3003 15472 39948 17843 44667 20233 4060255 Man-made staple fibres 776 1403 6332 33125 7423 35656 7999 3643156 Wadding, felt and nonwovens; special yarns; twine, cordage, ropes and cables and articles thereof 181 105 2368 2674 2750 2467 3731 382657 Carpets and other textile floor coverings - 8114 863 33737 1192 37153 1551 4963758 Special woven fabrics; tufted textile fabrics; lace; tapestries; trimmings; embroidery 92 368 2493 5108 2933 5137 3807 6758
Table 13.2-FOREIGN TRADE:INDIA'S FOREIGN TRADE BY CHAPTERS AND SECTION-contd
2004-05 2005-06
TRADE
2003-04 _________________
1990-91 ______________________ ______________________

211
(Rs.Million)
Sections and Chapters _________________Imports Exports Imports Exports Imports Exports Imports Exports
& Re- & Re- & Re- & Re- Exports Exports Exports Exports
1 2 3 4 5 6 7 8 9
59 Impregnated, coated & laminated textile fabrics; textile articles for industrial use 375 320 8200 3057 11766 3151 16035 350060 Knitted or crocheted fabrics 161 1300 2067 2373 2704 1986 4447 219761 Articles of apparel and clothing accessories, knitted or crocheted 9 10520 502 124149 485 118677 767 14128262 Articles of apparel and clothing accessories, not knitted or crocheted 1 29607 1277 162731 1011 176701 1749 24064963 Other made up textile articles; sets; worn textile articles; rags 622 6184 5103 74677 3823 88697 4740 105401
Section XII-Footwear,Headgear, UmbrellasPrepared Feathers & Articles thereof 351 9283 1970 38956 2915 44912 4707 5138864 Footwear, gaiters and the like; parts of such articles 238 9194 1714 35278 2472 40922 4100 4627665 Headgear and parts thereof 0 34 37 335 53 254 104 40566 Umbrellas, walking & seat sticks; whips, riding crops & parts thereof 112 4 141 54 285 64 352 7967 Prepared feathers & down with articles,artificial flowers; articles of human hair 1 51 78 3289 105 3672 151 4627
Section XIII-Stone, Cement and similarMaterials; Cermamic Products;Glass & Glassware 2021 1405 15842 34081 22387 33067 29920 4450368 Articles of stone, plaster,cement, asbestos, mica or similar materials 330 826 3518 19524 4811 18937 6084 2857069 Ceramic products 605 220 4900 4907 7830 4325 10766 549770 Glass & glassware 1086 360 7424 9650 9747 9806 13070 10437
Section XIV-Pearls, Precious or Semi-Precious Stones/Metals and Articles thereof:Jewellery & Coin 37589 52525 650445 494511 933874 648641 916041 70208771 Pearls, precious or semi-precious stones/metals and articles thereof; imitation jewellery & coin 37589 52525 650445 494511 933874 648641 916041 702087
Section XV-Base Metals & Articles ofBase Metal 48413 13237 179403 258711 283343 388098 436380 42517572 Iron & steel 25911 3644 81553 119068 150774 189537 241133 16883673 Articles of Iron & steel 6537 4980 29512 70304 39838 103798 57891 12461474 Copper & articles thereof 8241 580 15140 26242 24082 42433 39225 67328
Table 13.2-FOREIGN TRADE:INDIA'S FOREIGN TRADE BY CHAPTERS AND SECTION-contd
2003-04 2004-05
TRADE
1990-91 _________________
2005-06 ______________________ ______________________
212
(Rs.Million)
Sections and Chapters _________________Imports Exports Imports Exports Imports Exports Imports Exports
& Re- & Re- & Re- & Re- Exports Exports Exports Exports
1 2 3 4 5 6 7 8 9
75 Nickel & articles thereof 1477 16 10500 317 12332 358 13054 94076 Aluminium & articles thereof 1287 1765 17215 18606 21629 24320 36765 2683778 Lead & articles thereof 692 19 4507 188 7023 420 7777 77079 Zinc & articles thereof 2262 9 6360 1422 7281 1563 13932 199980 Tin & articles thereof 323 48 977 507 1665 389 1892 116781 Other base metals; cement; articles thereof 617 8 3530 445 3873 580 5198 119882 Tools and their parts of base metal 823 1582 6794 13676 9954 16656 13328 2160883 Miscellaneous articles of base metal 243 585 3317 7935 4893 8045 6186 9879
Section XVI-Machinery & their Parts,Electrical & ElectronicEquipment, Parts thereof 58232 17050 620231 202436 835603 241672 1142872 30792784 Nuclear reactors,boilers,machinery and mechanical appliances; parts thereof 39860 11577 318575 115172 433670 148588 616068 18539885 Electrical machinery & equipment & parts thereof; sound & TV recorders & reproducers & parts thereof 18373 5473 301657 87264 401933 93084 526804 122529
Section XVII-Transport Equipment 16703 7234 148403 89881 194595 127142 391771 19139386 Railway/tramway locomotives,truck etc.; equipment and parts thereof 1394 785 5110 851 5564 951 6041 137587 Road vehicles and parts 5218 5656 25945 80135 37944 110741 45233 14580588 Aircraft, spacecraft and parts 5258 147 53715 3727 71539 2236 220456 279289 Ship, boat & floating structure 4833 646 63633 5169 79547 13215 120040 41421
Section XVIII-Instruments & Apparatus; clocks & Watches; Parts &Accessories thereof 10836 1513 73549 25283 93219 30207 121253 3380390 Optical, Measuring, medical & similar instruments & parts thereof 10307 1342 71430 21468 90536 26690 117594 3137091 Clocks and watches and their parts 519 45 1927 3466 2375 3124 3174 198692 Musical instruments; parts and accessories 10 126 192 349 308 393 486 447
Section XIX-Arms and Ammunition:Parts and Accessories thereof 3 5 150 155 130 84 488 10993 Arms and ammunition; parts and accessoriesthereof games 3 5 150 155 130 84 488 109
2003-04 ______________________
2004-05
Table 13.2-FOREIGN TRADE:INDIA'S FOREIGN TRADE BY CHAPTERS AND SECTION-contd
TRADE
_________________ ______________________1990-91 2005-06

213
(Rs.Million)
Sections and Chapters _________________Imports Exports Imports Exports Imports Exports Imports Exports
& Re- & Re- & Re- & Re- Exports Exports Exports Exports
1 2 3 4 5 6 7 8 9
Section XX-Miscellaneous ManufacturedArticles 549 1138 11604 17822 15397 22887 22596 2691494 Furniture, Bedding and allied articles, lighting fittings nes; illuminated articles; prefabricated buildings 45 97 4908 6841 7371 11808 11035 1318195 Toys, gmes & sports requisites;parts and accessories thereof 94 609 2287 4146 2974 4588 5056 586596 Miscellaneous manufatured articles 411 431 4409 6835 5052 6491 6505 7869
Section XXI-Works of Art, Collector's Pieces and Antiques 0 13 62 22752 48 16834 656 2026197 Works of art, collectors'pieces and antiques 0 13 62 22752 48 16834 656 20261
Section XXII-Project goods andMisc. Goods 26727 6493 25914 32185 42241 40568 62316 4520398 Project goods; some special uses 25511 1612 18481 3915 27112 3479 40063 686799 Miscellaneous goods 1216 4881 7433 28269 15128 37089 22253 38336
Grand Total 431929 325533 3591077 2933668 5010645 3753395 6604089 4564178
Note: Totals may not tally due to rounding off the figures.
2003-04
Table 13.2-FOREIGN TRADE:INDIA'S FOREIGN TRADE BY CHAPTERS AND SECTION-concld.
TRADE
1990-91
Source: Directorate General of Commercial Intelligence and Statistics, Ministry of Commerce & Industry
_________________ ______________________ ______________________2005-062004-05
214
Table 13.3-VALUE OF IMPORTS OF MERCHANDISE INTO INDIA BY PRINCIPAL COUNTRIES OF CONSIGNMENT
(Rs.Million)
Country 1990-91 1999-00 2000-01 2001-02 2002-03 2003-04 2004-05 2005-06 2006-07
1 2 3 4 5 6 7 8 9 10
Argentina 1184 15057 17395 20794 19558 24077 24245 33384 37808Australia 14636 46877 48552 62290 64694 121736 171842 219061 309322Austria 1580 2886 3167 3711 7947 9267 11787 15231 20616Bahrein Islands 4623 16281 9252 6391 5862 3424 5476 8393 21207Bangladesh 313 3387 3678 2819 3003 3567 2668 5624 10330Belgium 27177 159520 131117 131773 179640 182699 206187 209198 187329Brazil 4376 14339 6632 14697 15331 14407 35604 39539 45717Canada 5592 16488 18140 25250 27406 33356 34854 40726 68517Chile 1239 3704 2610 4521 8097 7202 15527 19237 86829China People's Republic of 636 55803 68627 97119 135122 186251 318923 481167 787295Combodia 12 - 61 - - 13 11 34 71Congo.P .REP - 42 387 86 157 242 987 1945 2704Cuba 189 199 229 181 176 85 78 147 50Czech.Republic 2680 1709 1663 1842 4137 5139 7878 11528 15313Denmark 1332 5868 6510 5752 6938 10367 12141 22842 15391Egypt Arab Republic of 788 19234 1772 4766 10965 4513 6859 9760 78847Ethiopia - 38 175 877 511 346 461 377 514Finland 1756 6013 9475 7731 9631 12411 17470 25833 27592France 13044 31123 29275 40264 52953 50098 85105 182110 188044Germany,Federal Republic 34731 79800 80386 96724 116368 134112 180416 266687 573152Hong Kong 2971 35442 38928 34761 47069 68591 77737 97711 112294Hungary 1432 537 688 1141 998 1256 1417 1400 2849Indonesia 1456 41547 41584 49448 66828 97512 117619 133180 189467Iran 10176 54222 9650 13536 12500 12261 18431 31100 345299Iraq 4955 8654 315 2 1 6 50 91 250050Ireland 219 2413 3289 4051 4742 6026 8229 7168 13060Israel 1433 25217 19758 20400 29167 30776 44397 45654 48753Italy 10913 31833 33056 33613 39296 49216 61696 82155 121317Japan 32446 109883 84159 102368 88870 122584 145359 179799 207733Jamaica - 3 3 34 7 42 119 95 27Jordan 3681 11386 11084 10004 10862 10581 15991 19584 21322Kenya 391 911 869 1523 1624 1927 2099 2148 2506Kuwait 3630 82860 5147 3514 8687 6547 13747 20448 271043Laos People's DemocraticRepublic 5 - - 2 7 6 2 5 16Luxembourg 107 110 238 321 936 2040 435 713 1441Mayanmar 1663 7436 8300 105 16263 18795 18238 23286 35202Malagassy Republic (Madagascar) 19 146 17 - 191 232 358 724 870Malaysia 9955 87707 53761 54060 70919 94042 103298 106947 238930Malawi - 27 16 81 83 229 228 80 227Mauritious 1 170 282 156 781 347 323 325 657
(*) Data relates to Czech Republic and Slovak Republic both.
TRADE
215
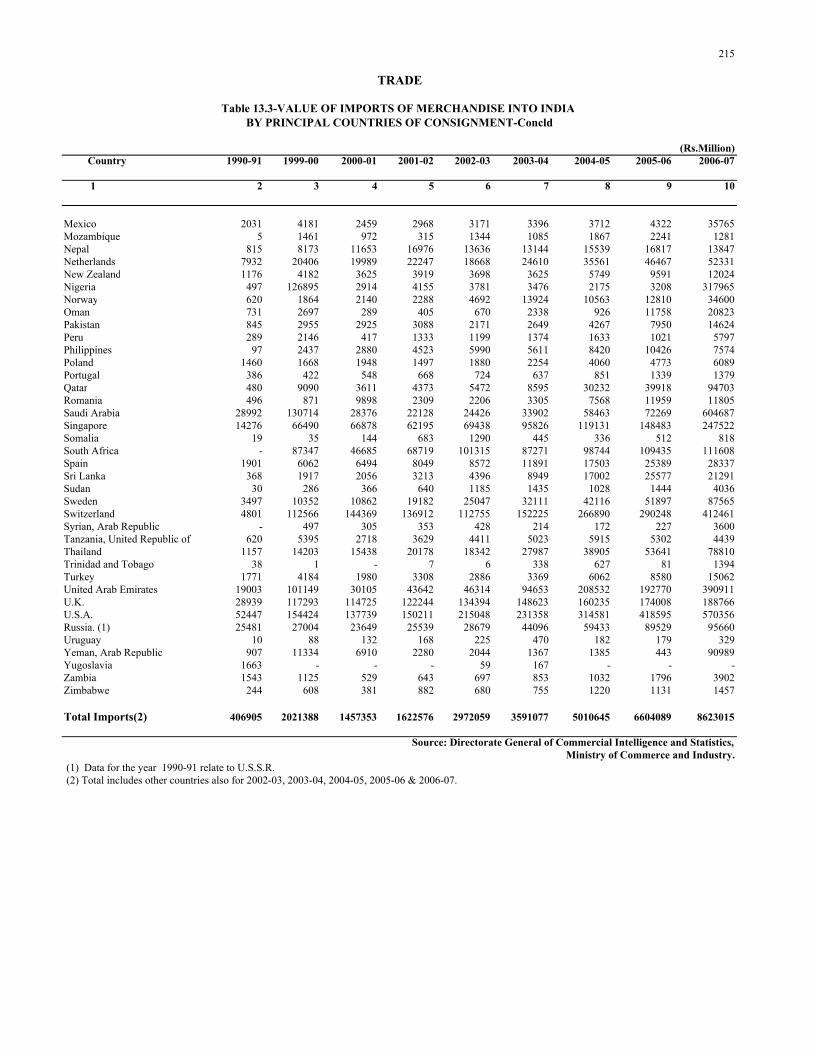
Table 13.3-VALUE OF IMPORTS OF MERCHANDISE INTO INDIA BY PRINCIPAL COUNTRIES OF CONSIGNMENT-Concld
(Rs.Million) Country 1990-91 1999-00 2000-01 2001-02 2002-03 2003-04 2004-05 2005-06 2006-07
1 2 3 4 5 6 7 8 9 10
Mexico 2031 4181 2459 2968 3171 3396 3712 4322 35765Mozambique 5 1461 972 315 1344 1085 1867 2241 1281Nepal 815 8173 11653 16976 13636 13144 15539 16817 13847Netherlands 7932 20406 19989 22247 18668 24610 35561 46467 52331New Zealand 1176 4182 3625 3919 3698 3625 5749 9591 12024Nigeria 497 126895 2914 4155 3781 3476 2175 3208 317965Norway 620 1864 2140 2288 4692 13924 10563 12810 34600Oman 731 2697 289 405 670 2338 926 11758 20823Pakistan 845 2955 2925 3088 2171 2649 4267 7950 14624Peru 289 2146 417 1333 1199 1374 1633 1021 5797Philippines 97 2437 2880 4523 5990 5611 8420 10426 7574Poland 1460 1668 1948 1497 1880 2254 4060 4773 6089Portugal 386 422 548 668 724 637 851 1339 1379Qatar 480 9090 3611 4373 5472 8595 30232 39918 94703Romania 496 871 9898 2309 2206 3305 7568 11959 11805Saudi Arabia 28992 130714 28376 22128 24426 33902 58463 72269 604687Singapore 14276 66490 66878 62195 69438 95826 119131 148483 247522Somalia 19 35 144 683 1290 445 336 512 818South Africa - 87347 46685 68719 101315 87271 98744 109435 111608Spain 1901 6062 6494 8049 8572 11891 17503 25389 28337Sri Lanka 368 1917 2056 3213 4396 8949 17002 25577 21291Sudan 30 286 366 640 1185 1435 1028 1444 4036Sweden 3497 10352 10862 19182 25047 32111 42116 51897 87565Switzerland 4801 112566 144369 136912 112755 152225 266890 290248 412461Syrian, Arab Republic - 497 305 353 428 214 172 227 3600Tanzania, United Republic of 620 5395 2718 3629 4411 5023 5915 5302 4439Thailand 1157 14203 15438 20178 18342 27987 38905 53641 78810Trinidad and Tobago 38 1 - 7 6 338 627 81 1394Turkey 1771 4184 1980 3308 2886 3369 6062 8580 15062United Arab Emirates 19003 101149 30105 43642 46314 94653 208532 192770 390911U.K. 28939 117293 114725 122244 134394 148623 160235 174008 188766U.S.A. 52447 154424 137739 150211 215048 231358 314581 418595 570356Russia. (1) 25481 27004 23649 25539 28679 44096 59433 89529 95660Uruguay 10 88 132 168 225 470 182 179 329Yeman, Arab Republic 907 11334 6910 2280 2044 1367 1385 443 90989Yugoslavia 1663 - - - 59 167 - - -Zambia 1543 1125 529 643 697 853 1032 1796 3902Zimbabwe 244 608 381 882 680 755 1220 1131 1457
Total Imports(2) 406905 2021388 1457353 1622576 2972059 3591077 5010645 6604089 8623015
(1) Data for the year 1990-91 relate to U.S.S.R. (2) Total includes other countries also for 2002-03, 2003-04, 2004-05, 2005-06 & 2006-07.
Source: Directorate General of Commercial Intelligence and Statistics,Ministry of Commerce and Industry.
TRADE

216
Country 1990-91 1999-00 2000-01 2001-02 2002-03 2003-04 2004-05 2005-06 2006-07* * * *
1 2 3 4 5 6 7 8 9 10
Argentina 86 2713 4500 3082 2918 4013 8372 8833 9536 Australia 3212 17374 18542 19936 24400 26849 32362 36359 41840 Austria 1258 3254 3701 3641 3925 4888 5264 5865 5970 Bahrain Islands 628 2609 3594 3605 4817 5130 7030 8511 8256 Barbados 0 155 140 51 119 54 78 102 120 Bangladesh 5474 27565 42717 47796 56913 79990 73289 73687 73692 Belgium 12584 57882 67181 66321 80425 82976 112765 127120 157168 Brazil 265 5848 10327 10445 23183 12665 30471 48285 66862 Canada 2799 25045 29991 27891 33793 35070 38947 45229 52218 Chile 56 2972 4955 3971 3491 3815 4997 6736 16980 China,People's Republic of 326 23345 37978 45400 95604 135791 252330 299249 375149 Combodia 2 - - - - 855 - 1071 2339 Congo (People's Republic of Congo) 5 969 1800 1834 2583 2815 4190 4942 6094 Cuba 108 128 220 282 233 228 334 527 1215 Czechoslovakia 1452 1463 1754 1959 2779 4045 3954 4289 4631 Denmark 1523 9145 7967 7242 8889 11115 13737 18165 20713 Egypt, Arab Republic of 1774 10257 16331 22069 14434 16887 19982 29771 34336 Ethiopia 245 2484 3041 4332 2999 3696 2494 3309 5184 France 7626 38695 46599 45069 51981 58858 75527 92071 95708 German Democratic Republic .. .. .. .. .. .. .. .. .. Germany,Federal Republic of 25358 75084 87146 85290 101953 116926 126988 158770 180434 Ghana 156 2683 2690 3263 5112 8394 8226 8891 20845 Greece 514 3896 5185 5081 7196 9192 13764 24974 30409 Hong Kong 10696 107828 120646 112856 126473 149885 165879 197961 211955 Hungary 834 1374 1949 2227 2336 4222 4857 3726 4685 Indonesia 1962 13981 18262 25454 39977 51797 59876 61106 91736 Iran 1408 6588 10369 12068 31686 42189 55328 52612 65646 Iraq 435 2140 3839 9862 10399 3454 5895 6904 9207 Ireland 357 3461 4714 4883 6573 6936 9525 12386 10221 Israel 954 21540 21576 20413 30709 33268 45190 53194 59851 Italy 10004 48487 59790 57542 65676 79469 102713 111527 167059 Jamaica 4 169 418 242 512 416 603 1145 909 Japan 30372 72941 81980 72036 90210 78545 95610 109854 127279 Jordan 572 2719 3632 3858 4927 6938 5762 8189 8104 Kenya 646 5055 6438 7440 9853 10545 19169 25525 59491 Kuwait 737 6685 9096 9836 12126 14663 18936 22745 27658 Laos People's Democratic Republic 1 60 285 151 76 20 119 242 108 Malagasy Republic (Madagascar) 70 397 493 628 708 1799 1623 1888 2027 Malaysia 2708 19351 27783 36899 36266 41024 48709 51440 59042 Malawi 60 871 849 976 1491 1756 2618 1932 1928 Mauritius 916 7348 9125 7769 7954 9329 11601 8830 33320 Mayanmar 34 1477 2408 2904 3633 4119 5086 4901 6299 Mexico 382 6105 9526 11324 12658 12151 16561 19616 23868 Mozambique 137 1382 1464 1472 2259 3177 3653 5647 8643
for footnotes please see next page
TRADE
Table 13.4-VALUE OF EXPORTS OF MERCHANDISE (INDIAN PRODUCE AND MANUFACTURES)FROM INDIA,BY PRINCIPAL COUNTRIES OF DESTINATION
(Rs.Million)

217
Country 1990-91 1999-00 2000-01 2001-02 2002-03 2003-04 2004-05 2005-06 2006-07* * * *
1 2 3 4 5 6 7 8 9 10
Nepal 87 6553 6434 10228 16956 30758 33390 38074 42147Netherlands 6416 38359 40207 41200 50714 59237 72109 109567 120766New Zealand 403 2786 2891 2967 3276 3951 4189 6282 22767Nigeria 1128 12726 17573 26857 21733 25985 28966 38696 40803Norway 568 2214 2759 2590 3428 3478 4664 5765 8262Oman 1015 5753 6607 7106 9612 11901 12027 18083 28372Pakistan 736 4028 8535 6868 9977 13185 23412 30515 61011Peru 8 1128 1203 1673 2405 1747 3092 3730 5660Philippines 509 6218 9256 11818 22843 14775 18522 21901 26377Poland 1654 3972 3939 5165 5113 6167 7921 10048 13857Portugal 806 5396 6702 7051 7846 7807 10027 11550 16564Puerto Rico 4 133 248 318 322 1215 659 853 1292Qatar 309 1541 2907 2337 4651 5902 9410 11482 14908Saudi Arabia 4181 32168 37595 39414 45528 51618 63446 50125 116872Seychelles 31 223 359 273 299 463 477 470 579Singapore 5848 28973 40070 46371 68798 97639 179754 240197 272450Somalia 20 374 318 717 965 1843 2117 1756 3894South Africa - 12343 14193 16833 23422 24784 44214 67600 101642Spain 2818 23735 30437 32297 39224 46070 62426 71088 84963Sri Lanka 2349 21630 29245 30089 44571 60619 63497 89639 101997Sudan 385 3097 4468 5827 5090 4934 14263 13045 18240Sweden 1552 6280 8048 7358 8532 10104 10864 14451 17527Switzerland 4002 15134 19996 19511 18522 20672 24303 21230 20990Syrian, Arab Republic 176 2639 3441 4693 5867 9257 11376 12249 18480Tanzania, UnitedRepublic of 531 3552 4659 4330 5588 8078 7813 10778 13060Thailand 4432 19472 24218 30195 34419 38217 40501 47608 65317Trinidad and Tobago 27 356 397 515 1081 902 1300 2950 4890Turkey 950 8209 15242 10447 17825 25886 32517 44720 59730United Arab Emirates 7868 89921 118666 118838 161034 235529 330151 380388 543661U.K. 21211 88012 105015 103056 120814 138923 165397 223992 251006U.S.A. 47896 363213 425099 406018 527304 527985 618516 768281 853949Russia(1) 52503 41072 40614 38067 34070 32798 28364 32459 41096Uruguay 11 1150 1631 1237 817 895 1101 1236 1663Vietnam,SocialistRepublic of 308 6689 10320 10405 16328 18860 24980 30579 44458Yemen, Arab Republic 547 3478 7261 7046 7925 9997 11072 12344 53664Zaire Republic of 50 214 203 173 .. .. .. .. ..Zambia 400 1007 1027 1226 1498 1832 2265 2945 4897Zimbabwe 184 801 688 596 766 1080 1054 1062 1438
Total Exports(2) 324057 1590233 2035710 2090180 2551373 2933668 3753395 4564179 5716419
(1) Data for the year 1990-91relate to U.S.S.R. (2) Total Includes other countries also. * Note: i The figures for 2002-03, 2003-04, 2004-05, 2005-06 & 2006-07 includes figures for re-exports also.
TRADE
(Rs.Million)
ii From 2002-03, the source agency has discountined the suppling breakup of values of export and re export.
Ministry of Commerce & Industry.
Table 13.4-VALUE OF EXPORTS OF MERCHANDISE (INDIAN PRODUCE AND MANUFACTURES)FROM INDIA,BY PRINCIPAL COUNTRIES OF DESTINATION-Concld.
Source: Directorate General of Commercial Intelligence and Statistics,

218
2003-04 2004-05 Economic Region
Imports Exports Balance Imports Exports Balance
1 2 3 4 5 6 7
Region 01:Economic Community of West African States (ECOWAS) 13680 30791 17111 24625 46068 21442Region 02: Southern African Development Community (SADC) 51645 30176 -21470 109839 46539 -63300Region 03: Organisation of American States (OAS) 188453 500265 311812 292618 621623 329005Region 04: Association of Caribbean States (ACS) 4356 21142 16787 5570 57527 51957Region 05: Pacific Island Forum (PIF) 53996 22591 -31405 68853 30812 -38041Region 06: Organisation of the Petroleum Exporting Countries (OPEC) 122836 221569 98733 168385 333182 164797Region 07: Asia Pacific Economic Cooperation 674103 942177 268074 961748 1231979 270232Region 08: South Asian Association for Regional Co-operation (SAARC) 21280 88104 66825 24777 131835 107058Region 09:Association of South East Asian Nations (ASEAN) 189415 132756 -56659 249215 223516 -25699Region 10: Economic Cooperation Organization (ECO) 17185 39668 22483 20432 49661 29229Region 11: European Union (EU) 480154 475609 -4545 606960 557633 -49327Region 12: European Free Trade Association (EFTA) 146557 23026 -123531 118116 22367 -95749Region 13: Black Sea Economic Co-operation Group (BSEC) 34230 66221 31992 45224 67272 22049Region 14: Council of Baltic Sea States 135302 154579 19278 194331 166953 -27378Region 15: Commonwealth of Independent States (CIS) 31163 48620 17457 40860 44542 3682
Grand Total 2164353 2797295 632942 2931552 3631509 699957
Note:Exports includes re-exports also.
TRADE
Table 13.5-SUMMARY OF THE VALUE OF MERCHANDISE TRADE BY REVISED ECONOMIC REGIONS
___________________________________________ __________________________________________
(Rs. In Million)
219
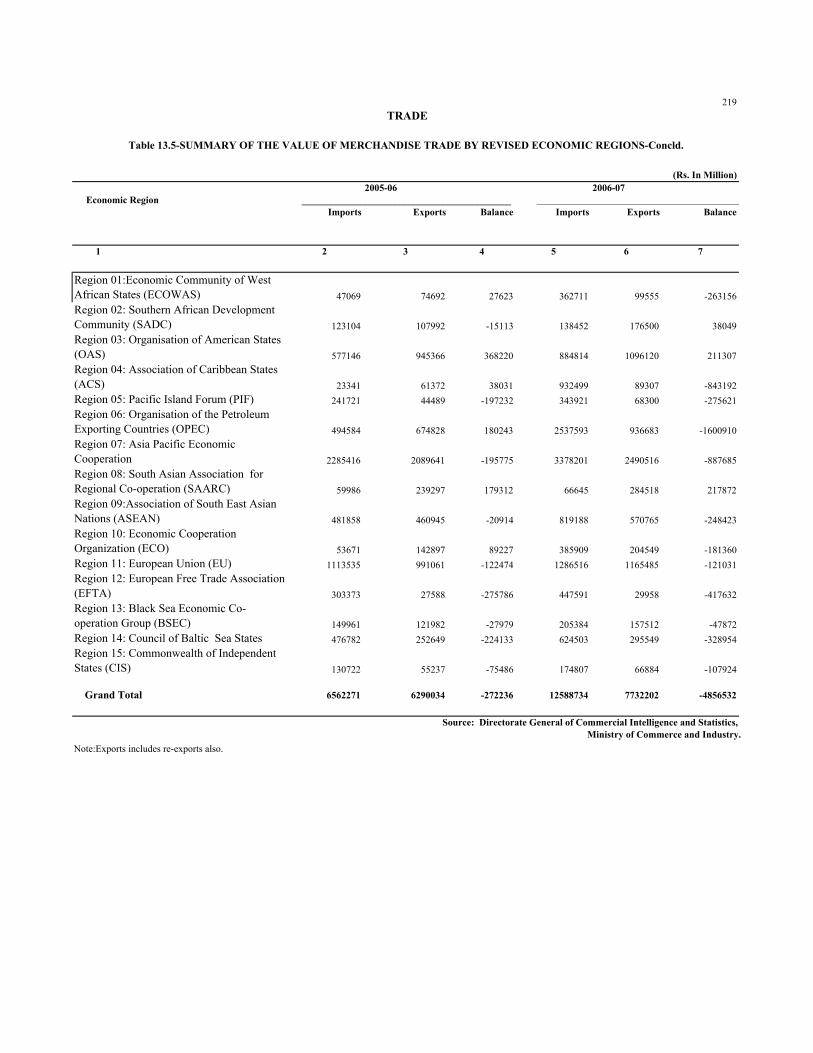
2005-06 2006-07 Economic Region
Imports Exports Balance Imports Exports Balance
1 2 3 4 5 6 7
Region 01:Economic Community of West African States (ECOWAS) 47069 74692 27623 362711 99555 -263156Region 02: Southern African Development Community (SADC) 123104 107992 -15113 138452 176500 38049Region 03: Organisation of American States (OAS) 577146 945366 368220 884814 1096120 211307Region 04: Association of Caribbean States (ACS) 23341 61372 38031 932499 89307 -843192Region 05: Pacific Island Forum (PIF) 241721 44489 -197232 343921 68300 -275621Region 06: Organisation of the Petroleum Exporting Countries (OPEC) 494584 674828 180243 2537593 936683 -1600910Region 07: Asia Pacific Economic Cooperation 2285416 2089641 -195775 3378201 2490516 -887685Region 08: South Asian Association for Regional Co-operation (SAARC) 59986 239297 179312 66645 284518 217872Region 09:Association of South East Asian Nations (ASEAN) 481858 460945 -20914 819188 570765 -248423Region 10: Economic Cooperation Organization (ECO) 53671 142897 89227 385909 204549 -181360Region 11: European Union (EU) 1113535 991061 -122474 1286516 1165485 -121031Region 12: European Free Trade Association (EFTA) 303373 27588 -275786 447591 29958 -417632Region 13: Black Sea Economic Co-operation Group (BSEC) 149961 121982 -27979 205384 157512 -47872Region 14: Council of Baltic Sea States 476782 252649 -224133 624503 295549 -328954Region 15: Commonwealth of Independent States (CIS) 130722 55237 -75486 174807 66884 -107924
Grand Total 6562271 6290034 -272236 12588734 7732202 -4856532
Note:Exports includes re-exports also.
TRADE
Table 13.5-SUMMARY OF THE VALUE OF MERCHANDISE TRADE BY REVISED ECONOMIC REGIONS-Concld.
Source: Directorate General of Commercial Intelligence and Statistics, Ministry of Commerce and Industry.
___________________________________________ __________________________________________
(Rs. In Million)
220
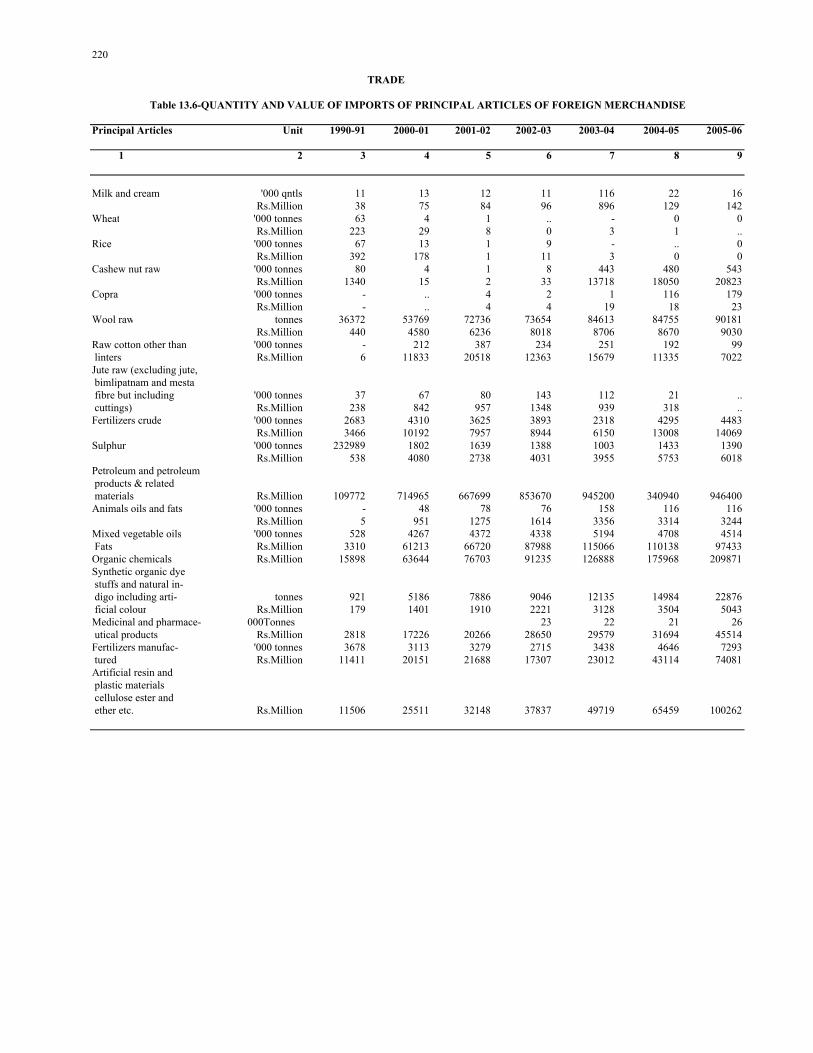
Table 13.6-QUANTITY AND VALUE OF IMPORTS OF PRINCIPAL ARTICLES OF FOREIGN MERCHANDISE
Principal Articles Unit 1990-91 2000-01 2001-02 2002-03 2003-04 2004-05 2005-06
1 2 3 4 5 6 7 8 9
Milk and cream '000 qntls 11 13 12 11 116 22 16Rs.Million 38 75 84 96 896 129 142
Wheat '000 tonnes 63 4 1 .. - 0 0Rs.Million 223 29 8 0 3 1 ..
Rice '000 tonnes 67 13 1 9 - .. 0Rs.Million 392 178 1 11 3 0 0
Cashew nut raw '000 tonnes 80 4 1 8 443 480 543Rs.Million 1340 15 2 33 13718 18050 20823
Copra '000 tonnes - .. 4 2 1 116 179 Rs.Million - .. 4 4 19 18 23Wool raw tonnes 36372 53769 72736 73654 84613 84755 90181
Rs.Million 440 4580 6236 8018 8706 8670 9030Raw cotton other than '000 tonnes - 212 387 234 251 192 99 linters Rs.Million 6 11833 20518 12363 15679 11335 7022Jute raw (excluding jute, bimlipatnam and mesta fibre but including '000 tonnes 37 67 80 143 112 21 .. cuttings) Rs.Million 238 842 957 1348 939 318 ..Fertilizers crude '000 tonnes 2683 4310 3625 3893 2318 4295 4483
Rs.Million 3466 10192 7957 8944 6150 13008 14069Sulphur '000 tonnes 232989 1802 1639 1388 1003 1433 1390
Rs.Million 538 4080 2738 4031 3955 5753 6018Petroleum and petroleum products & related materials Rs.Million 109772 714965 667699 853670 945200 340940 946400Animals oils and fats '000 tonnes - 48 78 76 158 116 116
Rs.Million 5 951 1275 1614 3356 3314 3244Mixed vegetable oils '000 tonnes 528 4267 4372 4338 5194 4708 4514 Fats Rs.Million 3310 61213 66720 87988 115066 110138 97433Organic chemicals Rs.Million 15898 63644 76703 91235 126888 175968 209871Synthetic organic dye stuffs and natural in- digo including arti- tonnes 921 5186 7886 9046 12135 14984 22876 ficial colour Rs.Million 179 1401 1910 2221 3128 3504 5043Medicinal and pharmace- 000Tonnes 23 22 21 26 utical products Rs.Million 2818 17226 20266 28650 29579 31694 45514Fertilizers manufac- '000 tonnes 3678 3113 3279 2715 3438 4646 7293 tured Rs.Million 11411 20151 21688 17307 23012 43114 74081Artificial resin and plastic materials cellulose ester and ether etc. Rs.Million 11506 25511 32148 37837 49719 65459 100262
TRADE

221
Principal Articles Unit 1990-91 2000-01 2001-02 2002-03 2003-04 2004-05 2005-06
1 2 3 4 5 6 7 8 9
Ingots blooms,slabs, '000 tonnes 379 356 175 103 114 419 711 billets Rs.Million 1396 4473 2135 1624 2234 9243 14222Bars,angles,shapes, sections etc. exclu- '000 tonnes 41 76 97 137 137 301 702ding wire rods Rs.Million 916 2734 3001 4585 5244 12163 24746Universal, plates and '000 tonnes 569 935 1000 1309 1761 2151 3755sheets Rs.Million 6587 18763 24333 26588 43490 70298 120539Railway rails '000 tonnes 31 2 7 3 - 7 ..
Rs.Million 302 56 226 78 2 304 ..Iron or steel wire (excl-cluding wire rod), whetheror not coated, but '000 tonnes 1 12 19 19 23 29 39not insulated Rs.Million 340 789 987 986 1416 2102 2514Tubes, pipes fittings welded or drawn of '000 tonnes 207 92 115 146 216 237 389iron or steel Rs.Million 4726 5098 6437 8006 11818 16821 29630Copper and alloys re-fined or refined un- '000 tonnes 72 15 10 16 50 41 48 wrought Rs.Million 3487 1496 863 1358 4898 6060 8860Aluminium '000 tonnes 23 115 193 179 200 242 408
Rs.Million 811 8161 12266 11754 13341 17104 29882Zinc '000 tonnes 77 98 132 125 179 192 265
Rs.Million 493 4262 5079 4790 6292 7181 13813Steam generating boilers Rs.Million 77 129 128 48 88 745 1320Internal combustion diesel & semidiesel engine other than aircraft engines Rs.Million 78 1376 3627 3697 3107 6472 9256Machine tools for working metal e.g.boring,drilling etc. Rs.Million 4050 8882 8028 10029 18231 24037 41810Metal working machineryother than machine tools Rs.Million 897 5118 3143 3491 6949 7286 16025Conveying, Hoisting, exca- vating and road const- ruction machinery Rs.Million 1436 6721 10889 15204 17564 31912 35188Textile machinery and accessories (including bobbins etc.) Rs.Million 4963 15506 16077 23090 28108 40033 78189Electric generators,motorsand connectors etc Rs.Million 1929 6088 8971 10036 13826 23338 33120Insulated cables and wire for electricity Rs.Million 962 4335 9471 7829 8913 13990 15514Railways locomotives Rs.Million 8 - 5 10 22 68 8
Ministry of Commerce& Industry.
TRADE
Concld.
Source: Directorate General of Commercial Intelligence and Statistics,
Table 13.6-QUANTITY AND VALUE OF IMPORTS OF PRINCIPAL ARTICLES OF FOREIGN MERCHANDISE-

222
Principal Articles Unit 1990-91 2000-01 2001-02 2002-03 2003-04 2004-05 2005-06
1 2 3 4 5 6 7 8 9
Fish fresh and simply '000 tonne 47 309 248 263 143 188 238 preserved Rs. Million 1011 14575 13149 14818 8674 11335 14762Cashew kernal '000 tonne 50 82 90 122 98 118 ..
Rs. Million 4414 18793 16471 19294 16779 24747 ..Sugar raw (including beet '000 tonne 24 338 1448 1662 1198 107 321and cane) Rs. Million 220 4322 17174 17678 12128 1465 5678Coffee (unroasted) '000 qntl 830 185 176 1849 1884 168 177
Rs. Million 2244 11849 10949 9944 10859 10691 15874Tea and mate '000 tonne 198 202 180 184 178 183 163
Rs. Million 10691 19764 17199 16632 16374 18403 17312Spices '000 tonne 95 242 235 274 270 363 366
Rs. Million 1983 14181 12031 134748 14502 16244 14693Oilseed cake meal (includ- ing other vegetable oils '000 tonne 1989 2414 2780 1782 3242 3505 5825 residue) Rs. Million 5480 20435 22624 14953 33459 31443 48275Tobacco unmanufactured '000 tonne 70 97 84 101 121 136 143
Rs. Million 1934 6613 5821 7384 8014 9401 10213Skins (goats and kids) '000 qntl .. - .. .. - 6 21 undressed Rs. Million .. 1 16 - 26 53 167Wool (sheeps and lambs) tonne 30 785 374 2219 1841 2678 2751
Rs. Million 6 79 75 610 505 815 781Raw cotton other than '000 tonne 366 30 8 12 180 87 61 linters Rs. Million 8459 2241 427 505 9424 4226 29044Mica including spliting '000 qntl 420 632 577 338 1066 981 798 and mica waste Rs. Million 348 637 560 410 1057 634 770Iron ore and concentrates '000 tonne 32493 20161 23084 57093 51498 87283 84046
Rs. Million 10491 16338 20336 42004 51733 147256 168288Manganese ore and concen- '000 tonne 318 265 248 336 240 318 237 trates Rs. Million 442 595 543 693 502 701 464Natural gums and resins, '000 qntl 90 168 132 139 242 180 156 etc. Rs. Million 519 3759 4334 4506 4023 5249 4256Coal '000 tonne 412 1290 1902 1516 1611 1373 1987
Rs. Million 87 1676 2902 2583 2920 2426 2667Castor oil '000 qntl 447 2596 2137 1777 1624 2717 ..
Rs. Million 700 9528 6259 6098 6561 10780 ..Medicinal and pharmaceuti- '000 qntl 76759 - - .. 2316 .. ..cal products Rs. Million 20 - - .. 74445 .. ..Leather Rs. Million 8119 17449 21902 24630 19274 24289 20900
TRADE
INDIAN PRODUCE AND MANUFACTURES Table 13.7-QUANTITY AND VALUE OF EXPORTS OF PRINCIPAL ARTICLES OF

223
Principal Articles Unit 1990-91 2000-01 2001-02 2002-03 2003-04 2004-05 2005-06
1 2 3 4 5 6 7 8 9
Cotton fabrics millmade mn.sqm. 187 .. .. .. .. .. ..grey unbleached Rs. Million 2968 4521 2481 2474 15463 14538 0Cotton fabrics bleached mn.sqm. 113 .. .. .. .. .. .. Rs. Million 1821 6466 5560 5623 26726 24535 5182Cotton fabrics,handloom lakh sqm. 38 .. .. .. .. .. ..grey unbleached Rs. Million 607 2530 2668 5373 15463 .. 374Jute fabrics '000 tonne 96 78 42 83 126 125 136
Rs. Million 1439 2702 1458 2850 3006 3214 3407Jute bags and sacks '000 tonne 84 48 28 65 92 141 80(new or used) Rs. Million 1228 1764 1090 1999 2777 2414 2925Woollen carpet and rugs, '000SQ meter 9730 12652 10184 11821 13967 14239 15587 etc.inct. travelling rugs Rs. Million 5644 11031 8685 10501 12495 14316 15169Pearls and precious and semi precious stones Rs. Million 49257 292692 292771 369657 391778 478916 526889Pig iron,spiegelesen,iron & steel powders and shots '000 tonne 86 425 452 645 615 784 866and ferro-alloys Rs. Million 769 6224 4170 5685 8561 18323 17109Iron & steel bars,rods, '000 tonne 123 263 355 379 559 414 450 angles Rs. Million .. 7760 8576 11324 16054 20433 22728
Machinery other than electric Rs. Million 9751 53649 58362 70411 96068 131341 166423Electrical machinery appar-atus and appliances Rs. Million 6754 .. .. .. 108733 .. ..Transport equipment Rs. Million 7187 .. .. .. 89881 .. ..Leather footwear '000 pair 19027 .. .. .. .. .. .. Rs. Million 2862 17525 18857 20492 25413 29555 34990
Ministry of Commerce & Industry.Source: Directorate General of Commercial Intelligence and Statistics,
TRADE
Table 13.7-QUANTITY AND VALUE OF EXPORTS OF PRINCIPAL ARTICLES OF INDIAN PRODUCE AND MANUFACTURES-concld.
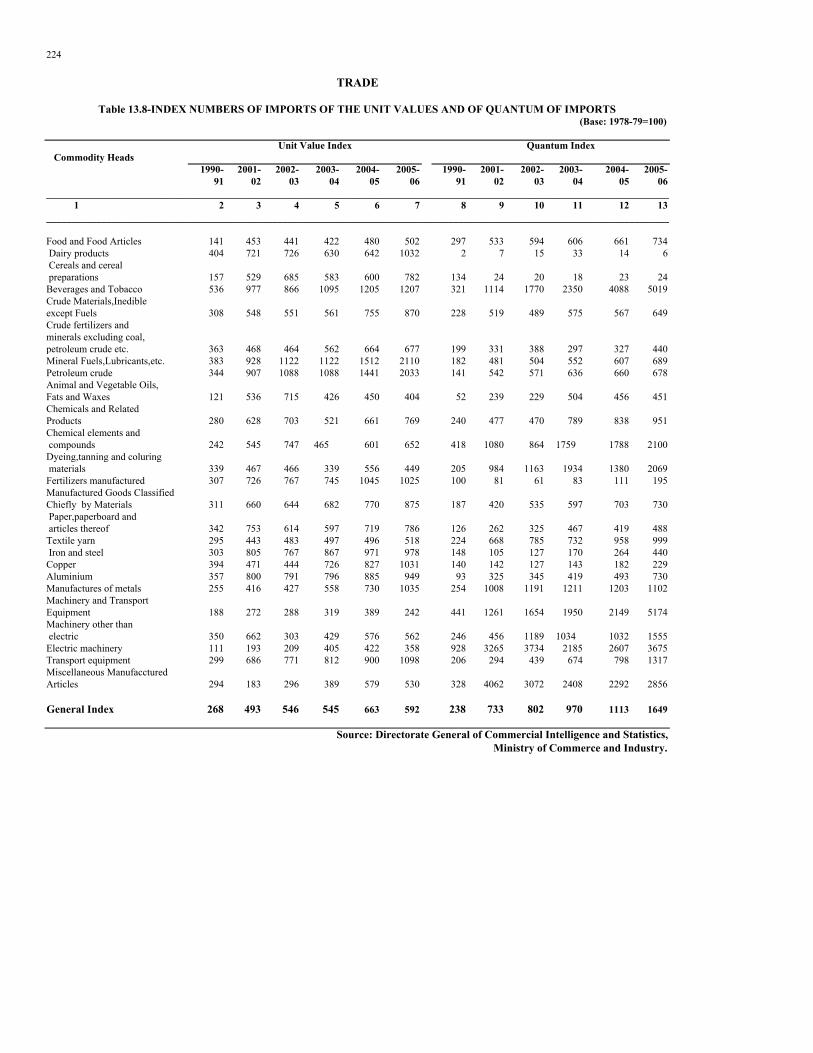
224
Unit Value Index Quantum Index Commodity Heads 1990- 2001- 2002- 2003- 2004- 2005- 1990- 2001- 2002- 2003- 2004- 2005-
91 02 03 04 05 06 91 02 03 04 05 06____________________________________________________________________________________________________________________________ 1 2 3 4 5 6 7 8 9 10 11 12 13____________________________________________________________________________________________________________________________
Food and Food Articles 141 453 441 422 480 502 297 533 594 606 661 734 Dairy products 404 721 726 630 642 1032 2 7 15 33 14 6 Cereals and cereal preparations 157 529 685 583 600 782 134 24 20 18 23 24Beverages and Tobacco 536 977 866 1095 1205 1207 321 1114 1770 2350 4088 5019Crude Materials,Inedibleexcept Fuels 308 548 551 561 755 870 228 519 489 575 567 649Crude fertilizers andminerals excluding coal, petroleum crude etc. 363 468 464 562 664 677 199 331 388 297 327 440Mineral Fuels,Lubricants,etc. 383 928 1122 1122 1512 2110 182 481 504 552 607 689Petroleum crude 344 907 1088 1088 1441 2033 141 542 571 636 660 678Animal and Vegetable Oils,Fats and Waxes 121 536 715 426 450 404 52 239 229 504 456 451Chemicals and Related Products 280 628 703 521 661 769 240 477 470 789 838 951Chemical elements and compounds 242 545 747 465 601 652 418 1080 864 1759 1788 2100Dyeing,tanning and coluring materials 339 467 466 339 556 449 205 984 1163 1934 1380 2069Fertilizers manufactured 307 726 767 745 1045 1025 100 81 61 83 111 195Manufactured Goods ClassifiedChiefly by Materials 311 660 644 682 770 875 187 420 535 597 703 730 Paper,paperboard and articles thereof 342 753 614 597 719 786 126 262 325 467 419 488Textile yarn 295 443 483 497 496 518 224 668 785 732 958 999 Iron and steel 303 805 767 867 971 978 148 105 127 170 264 440Copper 394 471 444 726 827 1031 140 142 127 143 182 229Aluminium 357 800 791 796 885 949 93 325 345 419 493 730Manufactures of metals 255 416 427 558 730 1035 254 1008 1191 1211 1203 1102Machinery and TransportEquipment 188 272 288 319 389 242 441 1261 1654 1950 2149 5174Machinery other than electric 350 662 303 429 576 562 246 456 1189 1034 1032 1555Electric machinery 111 193 209 405 422 358 928 3265 3734 2185 2607 3675Transport equipment 299 686 771 812 900 1098 206 294 439 674 798 1317Miscellaneous ManufaccturedArticles 294 183 296 389 579 530 328 4062 3072 2408 2292 2856
General Index 268 493 546 545 663 592 238 733 802 970 1113 1649
Ministry of Commerce and Industry.
TRADE
Table 13.8-INDEX NUMBERS OF IMPORTS OF THE UNIT VALUES AND OF QUANTUM OF IMPORTS (Base: 1978-79=100)
Source: Directorate General of Commercial Intelligence and Statistics,

225
Unit Value Index Quantum Index Commodity Heads 1990- 2001- 2002- 2003- 2004- 2005- 1990- 2001- 2002- 2003- 2004- 2005-
91 02 03 04 05 06 91 02 03 04 05 06
1 2 3 4 5 6 7 8 9 10 11 12 13
Food and Food Articles 226 482 437 445 483 512 138 350 451 449 457 486Fish and fish preparations 259 703 682 623 287 570 164 371 449 436 491 550Fruits and vegetables 279 411 443 498 464 437 181 664 693 627 795 1119Coffee 117 198 186 190 227 321 170 244 265 273 295 245Tea 273 470 445 453 490 514 114 103 105 101 105 94Spices 172 432 426 452 418 397 78 152 163 148 195 211Oilseed cake 171 470 494 524 600 550 277 416 261 551 453 758Beverages and Tobacco 228 479 507 574 567 551 103 159 191 180 207 233Crude Materials, Inedibleexcept Fuels 261 647 718 1110 1390 1407 236 236 311 252 368 456Raw cotton 114 338 317 350 308 314 3686 75 82 1365 698 4654Crude fertilizers,minerals excluding coal,petroleumcrude etc. 367 577 488 761 716 769 164 602 785 519 786 878Crude animal and vegetablematerials 287 758 851 1037 1090 1201 106 194 189 150 162 183Mineral Fuels, Lubricants,etc. 246 946 897 1158 1511 1935 1988 567 7520 7629 10643 13982Coal,coke and briquettes 512 946 920 889 752 872 32 578 529 619 608 576Animal and Vegetable OilsFats and Waxes 223 450 536 627 621 563 213 995 760 861 1374 1215Chemicals and Related Products 232 503 492 548 518 506 681 2934 3798 4052 5442 6788Manufactured Goods ClassifedChiefly by Materials 378 661 731 759 919 886 138 504 575 609 617 709Leather & Leather Manufactures excluding footwear 440 479 443 708 718 731 105 261 289 142 167 154Textile yarn 238 442 424 484 461 465 689 4222 5184 4687 4968 5457 Floor coverings 341 593 618 700 547 489 206 397 416 412 578 858Machinery and TransportEquipment 201 464 493 559 544 642 311 970 1102 1294 1707 2003Miscellaneous Manufactured Articles 348 797 687 720 648 849 262 771 1041 1057 1377 1245
General Index 293 618 620 672 732 798 194 593 722 765 899 1005Terms of Trade (1) 109 125 114 123 110 136 122 124 111 127 124 164
(1) The figures shown against this item are the net and gross terms of trade respectively. The former shown under the heading Unit Value Index is the ratio of overall export unit value index to similar import index and the latter shown under the heading Quantum Index is the ratio of overall import Quantum Index to similar export index.
Ministry of Commerce and Industry.Source: Directorate General of Commercial Intelligence and Statistics,
TRADE
Table 13.9-INDEX NUMBERS OF EXPORTS OF THE UNIT VALUES AND OF QUANTUM OF EXPORTS (Base: 1978-79=100)

226
Maritime block1990-91 2000-01 2001-02 2002-03 P 2003-04 2004-05 2005-06
1 2 3 4 5 6 7 8
Andhra Pradesh 3305464 2497544 33021899 29590414 36731600 61778200 49933000Gujarat 1031673 - - - - 40277500 45803300Karnataka 85011 7300606 16563194 7540662 41011600 47817300 83642900Kerala 3959924 7216901 6883853 9259786 3457400 5685200 7693300Maharashtra 438142 6742332 1775606 1886732 3186500 5318600 7084600Orissa 866582 8611554 5279497 1527818 14052900 183000000 11627800Tamil Nadu 2634685 14693438 12421271 12018442 19184300 25960800 45562400West Bengal 685653 2439134 477297 391290 104618200 73910600 52322500Andaman andNicobar Islands 1294152 - 649258 3849910 9147100 18480300 48738100Goa 223 10900758 13966199 12596323 12386300 10831600 2324100Lakshadweep 888113 1272873 3381958 3219458 4281600 8501800 8280100Pondicherry - - - -
Total 15189622 61675141 94420033 81880835 248052300 316862000 363012100
Note: Gujarat includes Daman and Diu also.
(Rs.'000)
Maritime block1990-91 2000-01 2001-02 2002-03 P 2003-04 2004-05 2005-06
1 2 3 4 5 6 7 8
Andhra Pradesh 297968 3214818 3103986 732276 17067100 15854300 28073900Gujarat 606916 17313019 45393901 28709387 69991800 95939200 88630700Karnataka 10295 5173316 16061364 20610412 12516000 19907600 17360600Kerala 1328739 3283578 5434955 3367483 13291600 19450700 39003100Maharashtra 8440128 15875548 11578813 12901760 76841200 94307400 92871400Orissa 630730 3022669 1710951 2202376 32229000 14604100 23975800Tamil Nadu 2024709 4347032 2059530 4154609 13136300 28586500 50373300West Bengal 830425 7285361 6052414 7086929 10936800 22188900 21761000Andaman & NicobarIslands 632864 1641531 2108121 1729811 1951100 5625500 938300Goa 7 75592 280046 185182 90000 376300 23200Lakshadweep 386541 63897 304520 200610 1300 7600 200Pondicherry 300 378779 331432 - - 13900 500
Total 15189622 61675141 94420033 81880835 248052300 316862000 363012100
Note: Gujarat includes Daman and Diu also.Ministry of Commerce.
(Rs.'000)
Source: Directorate General of Commercial Intelligence and Statistics,
Source: Directorate General of Commercial Intelligence and Statistics,
Table 13.11-COASTING TRADE:TOTAL VALUE OF EXPORT MERCHANDISE FROM VARIOUS MARITIME BLOCKS OF INDIA
Exports merchandise
Ministry of Commerce and Industry.
TRADE
Table 13.10-COASTING TRADE: TOTAL VALUE OF IMPORT MERCHANDISE TO VARIOUS MARITIME BLOCKS OF INDIA
Imports merchandise

227
('000 tonne)
Rice and Wheat Raw cottonYear\States\ Coal and Cotton Jute Raw (lint)Chief of Ports Town coke piece Rice Wheat (Indian and
goods foreign) (1)
1 2 3 4 5 6 7
1990-91 80257 10 2986 2527 19 57 1996-97 109098 - 645 1407 - 35 1997-98 114060 360 905 1 6 1998-99 112028 - 32 37 18 1 1999-00 113496 - 20 11 24 7 2000-01 116438 6 8802 7034 24 11 2001-02 124435 0 11614 12946 27 1 2002-03 127546 1 17394 24782 18 42003-04 93407 1 15243 16515 18 42004-05 135410 0 19535 19095 10 1
Exported during 2004-05 Andhra Pradesh (excl.Ports) 8603 .. 2520 5 .. .. Other posts of Andhra Pradesh 3872 .. 89 2 .. .. Assam 2076 .. 330 128 .. .. Arunachal Pradesh .. .. .. .. .. .. Bihar 10701 .. 11 22 1 .. Chattishgarh 36825 .. 1854 2 .. .. Chandigarh .. .. 75 .. .. .. Delhi .. .. 89 177 .. .. Goa 362 .. .. .. .. .. Gujarat (excl.Ports) .. .. 4 6 .. .. Other ports of Gujarat .. .. .. .. .. .. Haryana .. .. 1667 4155 .. .. Himachal Pradesh .. .. .. .. .. .. Jammu & Kashmir .. .. .. .. .. ..Jharkhand 1698 .. 6 2 1 .. Karnataka (excl.Ports) 280 .. .. .. .. .. Other ports of Karnataka 15 .. 12 .. .. .. Kerala (excl.Ports) .. .. 853 314 .. ..Other ports of Kerala 112 .. 1 .. .. .. Madhya Pradesh 7715 .. .. 685 .. .. Maharashtra (excl.Ports) 6124 .. 217 24 .. .. Other ports of Maharashtra 14679 .. 72 119 .. .. Manipur .. .. 37 9 .. .. Meghalaya .. .. .. .. .. ..Mizoram .. .. .. .. .. .. Nagaland .. .. .. 1 .. .. Orissa 26813 .. 184 7 .. .. Pondicherry & Karikal .. .. .. .. .. .. Punjab 3 .. 9340 9836 .. .. Rajasthan .. .. .. 262 .. .. Tamil Nadu(excl. Ports) 1107 .. 14 .. .. ..Other ports of Tamil Nadu 3797 .. 2 1 .. .. Tripura .. .. .. .. .. .. Uttaranchal .. .. 144 51 .. .. Uttar Pradesh .. .. 1945 3268 .. 1 West Bengal (excl.Ports) 10628 .. 60 9 8 .. Other ports of West Bengal .. .. 9 10 .. ..
For footnotes, please see next page
TRADE
Table 13.12 (A)-MOVEMENT OF CERTAIN PRINCIPAL ARTICLES BY RAIL AND RIVERBETWEEN THE STATES AND CHIEF PORT TOWNS
(Exported to/Outward)
228
Iron & Oil seeds Salt Sugar Sugar-rawYear\States\ Steel (including (Gur,JaggeryChief of Ports Town Khandsari) and Shakkar)
1 8 9 10 11 12
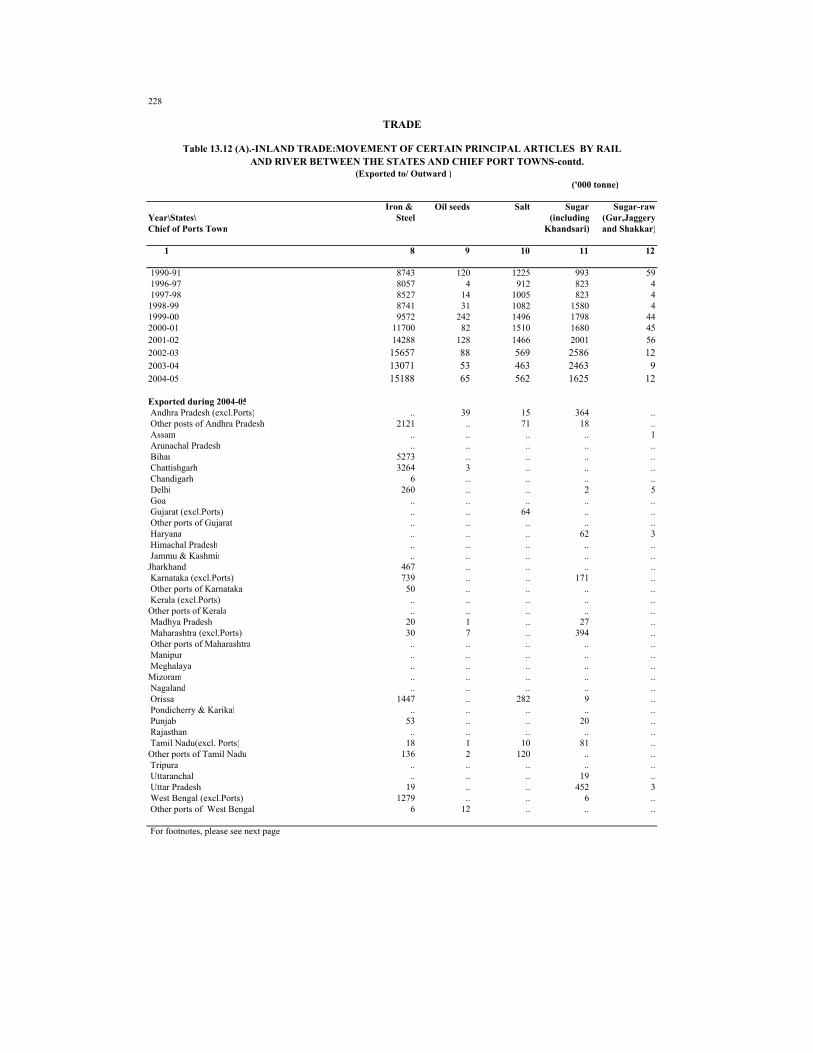
1990-91 8743 120 1225 993 59 1996-97 8057 4 912 823 4 1997-98 8527 14 1005 823 41998-99 8741 31 1082 1580 41999-00 9572 242 1496 1798 442000-01 11700 82 1510 1680 452001-02 14288 128 1466 2001 562002-03 15657 88 569 2586 122003-04 13071 53 463 2463 92004-05 15188 65 562 1625 12
Exported during 2004-05 Andhra Pradesh (excl.Ports) .. 39 15 364 .. Other posts of Andhra Pradesh 2121 .. 71 18 .. Assam .. .. .. .. 1 Arunachal Pradesh .. .. .. .. .. Bihar 5273 .. .. .. .. Chattishgarh 3264 3 .. .. .. Chandigarh 6 .. .. .. .. Delhi 260 .. .. 2 5 Goa .. .. .. .. .. Gujarat (excl.Ports) .. .. 64 .. .. Other ports of Gujarat .. .. .. .. .. Haryana .. .. .. 62 3 Himachal Pradesh .. .. .. .. .. Jammu & Kashmir .. .. .. .. ..Jharkhand 467 .. .. .. .. Karnataka (excl.Ports) 739 .. .. 171 .. Other ports of Karnataka 50 .. .. .. .. Kerala (excl.Ports) .. .. .. .. ..Other ports of Kerala .. .. .. .. .. Madhya Pradesh 20 1 .. 27 .. Maharashtra (excl.Ports) 30 7 .. 394 .. Other ports of Maharashtra .. .. .. .. .. Manipur .. .. .. .. .. Meghalaya .. .. .. .. ..Mizoram .. .. .. .. .. Nagaland .. .. .. .. .. Orissa 1447 .. 282 9 .. Pondicherry & Karikal .. .. .. .. .. Punjab 53 .. .. 20 .. Rajasthan .. .. .. .. .. Tamil Nadu(excl. Ports) 18 1 10 81 ..Other ports of Tamil Nadu 136 2 120 .. .. Tripura .. .. .. .. .. Uttaranchal .. .. .. 19 .. Uttar Pradesh 19 .. .. 452 3 West Bengal (excl.Ports) 1279 .. .. 6 .. Other ports of West Bengal 6 12 .. .. ..
For footnotes, please see next page
('000 tonne)
TRADE
Table 13.12 (A).-INLAND TRADE:MOVEMENT OF CERTAIN PRINCIPAL ARTICLES BY RAIL AND RIVER BETWEEN THE STATES AND CHIEF PORT TOWNS-contd.
(Exported to/ Outward )

229
('000 tonne)
Coal and Cotton Rice and Wheat Jute Raw Raw cottonYear\States\ coke piece (lint)Chief of Ports Town goods Rice Wheat (Indian and
foreign) (1)
1 2 3 4 5 6 7
Exported during 2004-05 135410 0 19535 19095 10 1
Andhra Pradesh (excl.Ports) 13341 .. 669 881 .. .. Other posts of Andhra Pradesh 6501 .. 1258 179 .. .. Assam 9 .. 2367 750 .. .. Arunachal Pradesh .. .. 249 .. .. .. Bihar 2354 .. 522 1134 8 .. Chattishgarh 5220 .. .. 185 .. .. Chandigarh 12 .. 12 7 .. .. Delhi 821 .. 71 107 .. .. Goa 3 .. 18 13 .. .. Gujarat (excl.Ports) 16314 .. 287 741 .. .. Other ports of Gujarat 343 .. 16 747 .. .. Haryana 2588 .. 1 2 .. .. Himachal Pradesh 243 .. .. .. .. .. Jammu & Kashmir 240 .. 404 92 .. ..Jharkhand 5755 .. 540 426 .. .. Karnataka (excl.Ports) 7935 .. 1123 497 .. .. Other ports of Karnataka 425 .. 1633 409 .. .. Kerala (excl.Ports) 134 .. 1481 497 .. ..Other ports of Kerala 5862 .. 429 280 .. .. Madhya Pradesh 4753 .. 364 1616 .. .. Maharashtra (excl.Ports) 23027 .. 551 1554 .. .. Other ports of Maharashtra 2016 .. 812 1150 .. .. Manipur .. .. .. .. .. .. Meghalaya .. .. .. .. .. ..Mizoram 3 .. .. .. .. .. Nagaland 3 .. 206 125 .. .. Orissa 1976 .. 344 212 .. 1 Pondicherry & Karikal .. .. 14 83 .. .. Punjab 6561 .. 7 19 .. .. Rajasthan 11105 .. 26 846 .. .. Tamil Nadu(excl. Ports) 2218 .. 3117 1744 .. ..Other ports of Tamil Nadu 1107 .. 929 430 .. .. Tripura 6 .. 136 19 .. .. Uttaranchal .. .. 724 45 .. .. Uttar Pradesh 3895 .. 75 1384 .. .. West Bengal (excl.Ports) 9163 .. 927 1776 1 .. Other ports of West Bengal 1477 .. 223 1145 1 ..
For footnotes, please see next page
TRADE
Table 13.12(A)-MOVEMENT OF CERTAIN PRINCIPAL ARTICLES BY RAIL AND RIVERBETWEEN THE STATES AND CHIEF PORT TOWNS-contd.
(Exported From/ Inward)
230
Iron & Oil seeds Salt Sugar Sugar-rawYear\States\ Steel (including (Gur,JaggeryChief of Ports Town Khandsari) & Shakkar)
1 8 9 10 11 12
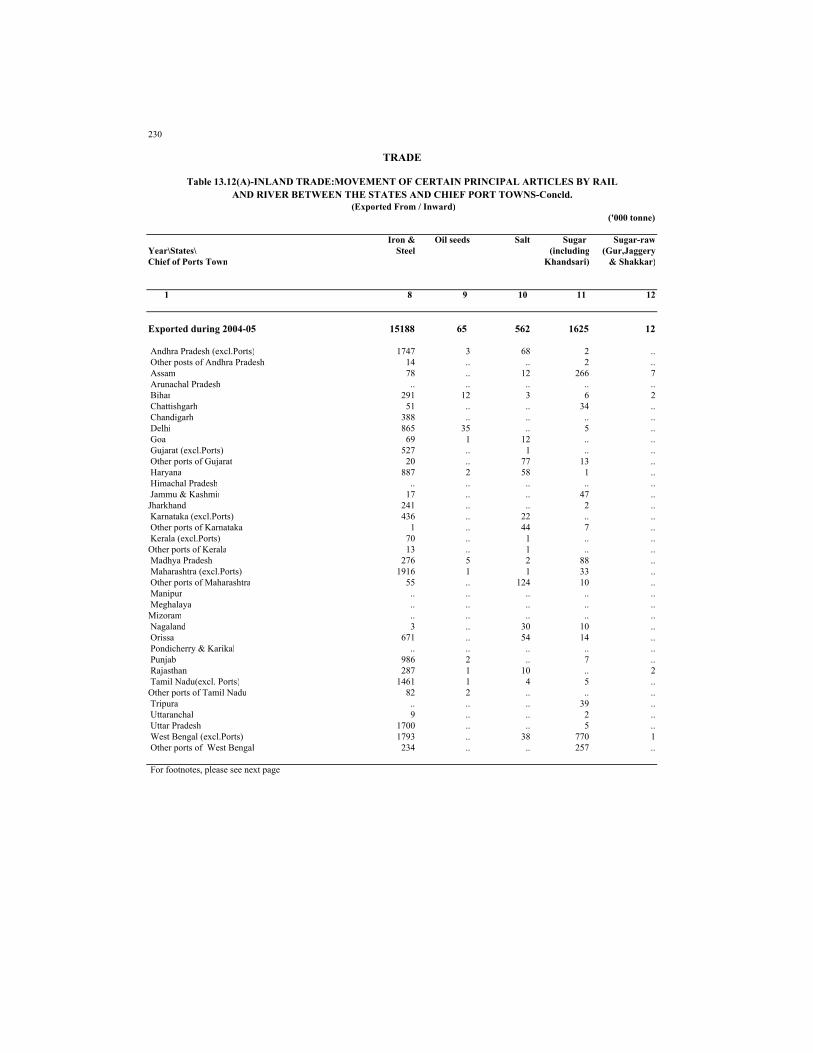
Exported during 2004-05 15188 65 562 1625 12
Andhra Pradesh (excl.Ports) 1747 3 68 2 .. Other posts of Andhra Pradesh 14 .. .. 2 .. Assam 78 .. 12 266 7 Arunachal Pradesh .. .. .. .. .. Bihar 291 12 3 6 2 Chattishgarh 51 .. .. 34 .. Chandigarh 388 .. .. .. .. Delhi 865 35 .. 5 .. Goa 69 1 12 .. .. Gujarat (excl.Ports) 527 .. 1 .. .. Other ports of Gujarat 20 .. 77 13 .. Haryana 887 2 58 1 .. Himachal Pradesh .. .. .. .. .. Jammu & Kashmir 17 .. .. 47 ..Jharkhand 241 .. .. 2 .. Karnataka (excl.Ports) 436 .. 22 .. .. Other ports of Karnataka 1 .. 44 7 .. Kerala (excl.Ports) 70 .. 1 .. ..Other ports of Kerala 13 .. 1 .. .. Madhya Pradesh 276 5 2 88 .. Maharashtra (excl.Ports) 1916 1 1 33 .. Other ports of Maharashtra 55 .. 124 10 .. Manipur .. .. .. .. .. Meghalaya .. .. .. .. ..Mizoram .. .. .. .. .. Nagaland 3 .. 30 10 .. Orissa 671 .. 54 14 .. Pondicherry & Karikal .. .. .. .. .. Punjab 986 2 .. 7 .. Rajasthan 287 1 10 .. 2 Tamil Nadu(excl. Ports) 1461 1 4 5 ..Other ports of Tamil Nadu 82 2 .. .. .. Tripura .. .. .. 39 .. Uttaranchal 9 .. .. 2 .. Uttar Pradesh 1700 .. .. 5 .. West Bengal (excl.Ports) 1793 .. 38 770 1 Other ports of West Bengal 234 .. .. 257 ..
For footnotes, please see next page
TRADE
Table 13.12(A)-INLAND TRADE:MOVEMENT OF CERTAIN PRINCIPAL ARTICLES BY RAILAND RIVER BETWEEN THE STATES AND CHIEF PORT TOWNS-Concld.
(Exported From / Inward) ('000 tonne)

231
('000 tonne)
Rice and Wheat Raw cottonYear\States\ Coal and Cotton Jute Raw (lint)Chief of Ports Town coke piece Rice Wheat (Indian and
goods foreign) (1)
1 2 3 4 5 6 7
1990-91 80257 10 2986 2527 19 57 1997-98 114060 360 905 1 6 1998-99 112028 - 32 37 18 1 1999-00 113496 - 20 11 24 7 2000-01 116438 6 8802 7034 24 11 2001-02 124435 4 11614 12946 27 1 2002-03 127546 1 17394 24782 18 42003-04 93407 1 15243 16515 18 42004-05 135410 0 19526 19085 10 12005-06 (P) 142672 4 24647 12754 29 8
Exported during 2005-06 (P) Andhra Pradesh (excl.Ports) 8534 .. 2601 .. .. 1 Other posts of Andhra Pradesh 5446 .. 136 3 .. .. Assam 2995 .. 378 112 .. .. Arunachal Pradesh .. .. .. .. .. .. Bihar 3182 .. 4 .. .. .. Chattishgarh 33601 .. 7666 .. 3 .. Chandigarh .. .. 47 .. .. .. Delhi .. .. 47 3 .. .. Goa 637 .. .. .. .. .. Gujarat (excl.Ports) .. .. .. .. .. .. Other ports of Gujarat .. .. .. .. .. .. Haryana .. .. 2208 2897 .. .. Himachal Pradesh .. .. .. .. .. .. Jammu & Kashmir .. .. .. .. .. ..Jharkhand 10053 .. 7 3 .. .. Karnataka (excl.Ports) 44 .. 8 .. .. .. Other ports of Karnataka 82 .. .. .. .. .. Kerala (excl.Ports) 4 .. 637 425 .. ..Other ports of Kerala 221 .. 1 .. .. .. Madhya Pradesh 28041 .. 79 244 .. 1 Maharashtra (excl.Ports) 4683 .. 178 18 .. .. Other ports of Maharashtra .. .. .. .. .. .. Manipur .. .. .. .. .. .. Meghalaya .. .. .. .. .. ..Mizoram .. .. .. .. .. .. Nagaland .. .. .. 3 .. .. Orissa 27050 .. 120 2 .. 1 Pondicherry & Karikal .. .. .. .. .. .. Punjab .. .. 9706 8049 .. .. Rajasthan .. .. .. 212 .. 5 Tamil Nadu(excl. Ports) 754 .. 38 3 .. ..Other ports of Tamil Nadu 5050 .. 29 .. .. .. Tripura .. .. .. .. .. .. Uttaranchal .. .. 205 171 .. .. Uttar Pradesh .. .. 516 605 20 .. West Bengal (excl.Ports) 12295 4 36 2 6 .. Other ports of West Bengal .. .. .. 2 .. ..
For footnotes, please see next page
TRADE
Table 13.12 (B)-MOVEMENT OF CERTAIN PRINCIPAL ARTICLES BY RAIL AND RIVERBETWEEN THE STATES AND CHIEF PORT TOWNS
(Exported to/Outward)

232
Iron & Oil seeds Salt Sugar Sugar-rawYear\States\ Steel (including (Gur,JaggeryChief of Ports Town Khandsari) and Shakkar)
1 8 9 10 11 12
1990-91 8743 120 1225 993 59 1997-98 8527 14 1005 823 41998-99 8741 31 1082 1580 41999-00 9572 242 1496 1798 442000-01 11700 82 1510 1680 452001-02 14288 128 1466 2001 562002-03 15657 88 569 2586 192003-04 13071 53 463 2463 92004-05 15182 53 562 1625 122005-06 (P) 17102 294 594 2210 19
Exported during 2005-06 (P) Andhra Pradesh (excl.Ports) 67 47 6 404 .. Other posts of Andhra Pradesh 2153 .. 124 35 .. Assam .. .. .. 1 1 Arunachal Pradesh .. .. .. .. .. Bihar 7 .. .. 3 .. Chattishgarh 3835 2 .. 4 4 Chandigarh 22 .. .. .. .. Delhi 242 2 .. 3 10 Goa .. .. .. .. .. Gujarat (excl.Ports) .. .. .. .. .. Other ports of Gujarat .. .. .. .. .. Haryana 3 1 .. 16 .. Himachal Pradesh .. .. .. .. .. Jammu & Kashmir .. .. .. .. ..Jharkhand 5977 .. .. .. .. Karnataka (excl.Ports) 1478 .. .. 167 .. Other ports of Karnataka 32 .. .. .. .. Kerala (excl.Ports) .. .. .. 1 ..Other ports of Kerala 4 .. .. .. .. Madhya Pradesh 42 22 .. 300 .. Maharashtra (excl.Ports) 17 10 5 43 .. Other ports of Maharashtra .. .. .. .. .. Manipur .. .. .. .. .. Meghalaya .. .. .. .. ..Mizoram 1 .. .. 3 .. Nagaland 1615 3 348 33 .. Orissa .. .. .. .. .. Pondicherry & Karikal .. .. .. .. .. Punjab 116 .. .. .. .. Rajasthan 1 193 61 .. 4 Tamil Nadu(excl. Ports) 41 .. 7 259 ..Other ports of Tamil Nadu 92 .. 41 2 .. Tripura .. .. .. .. .. Uttaranchal .. .. .. .. .. Uttar Pradesh 17 .. 2 933 .. West Bengal (excl.Ports) 1339 .. .. 3 .. Other ports of West Bengal 1 14 .. .. ..
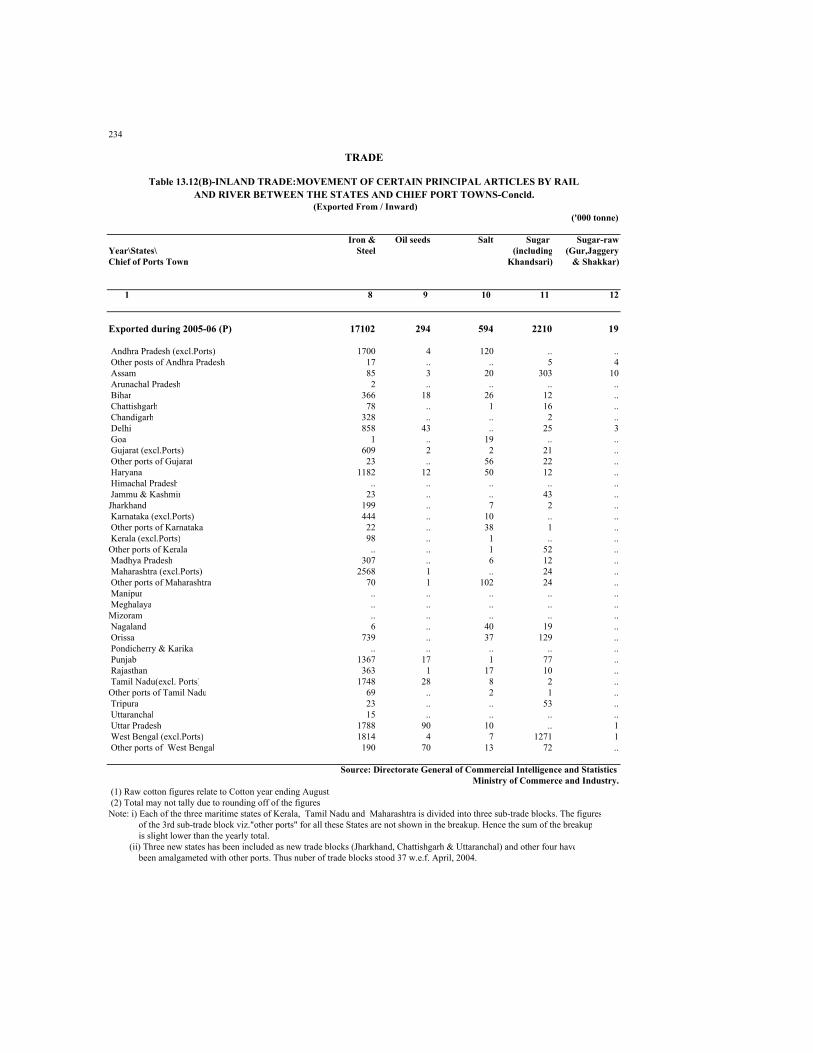
Note : Three new states has been included as new trade blocks (Jharkhand, Chattishgarh & Uttaranchal) and other four have been amalgameted with other ports. Thus nuber of trade blocks stood 37 w.e.f. April, 2004.
TRADE
Table 13.12 (B).-INLAND TRADE:MOVEMENT OF CERTAIN PRINCIPAL ARTICLES BY RAIL AND RIVER BETWEEN THE STATES AND CHIEF PORT TOWNS-contd.
(Exported to/ Outward )('000 tonne)
233
('000 tonne)
Coal and Cotton Rice and Wheat Jute Raw Raw cottonYear\States\ coke piece (lint)Chief of Ports Town goods Rice Wheat (Indian and
foreign) (1)
1 2 3 4 5 6 7
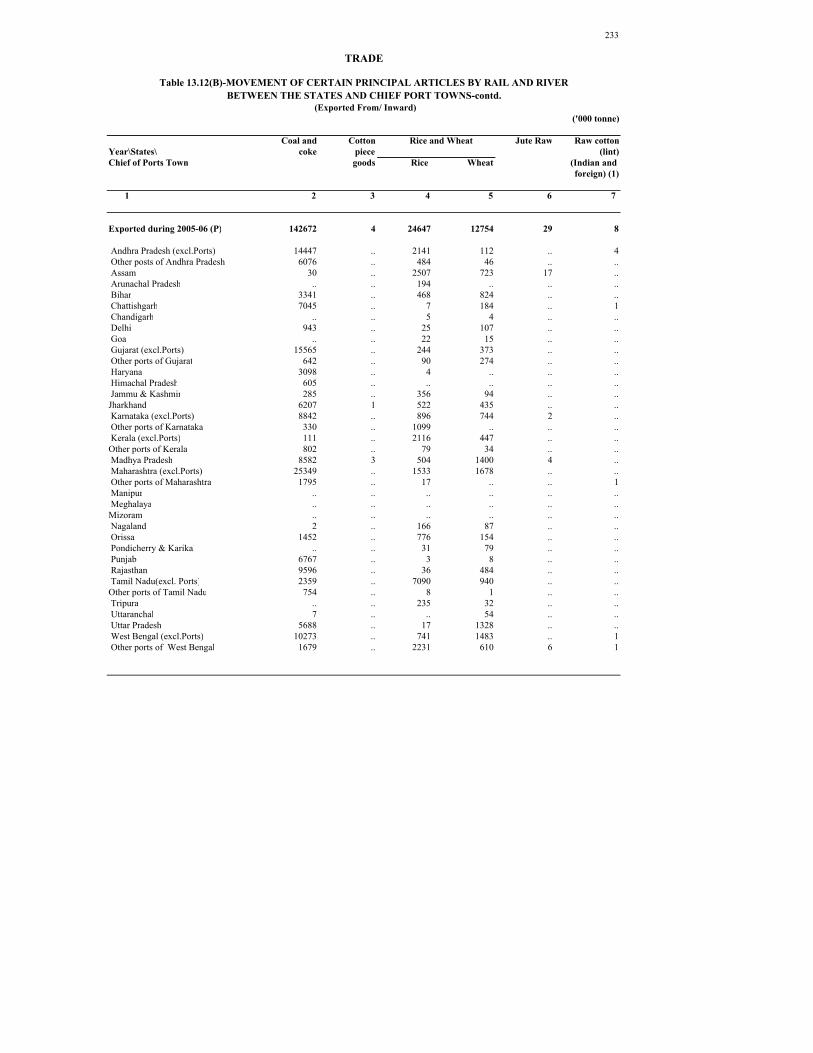
Exported during 2005-06 (P) 142672 4 24647 12754 29 8
Andhra Pradesh (excl.Ports) 14447 .. 2141 112 .. 4 Other posts of Andhra Pradesh 6076 .. 484 46 .. .. Assam 30 .. 2507 723 17 .. Arunachal Pradesh .. .. 194 .. .. .. Bihar 3341 .. 468 824 .. .. Chattishgarh 7045 .. 7 184 .. 1 Chandigarh .. .. 5 4 .. .. Delhi 943 .. 25 107 .. .. Goa .. .. 22 15 .. .. Gujarat (excl.Ports) 15565 .. 244 373 .. .. Other ports of Gujarat 642 .. 90 274 .. .. Haryana 3098 .. 4 .. .. .. Himachal Pradesh 605 .. .. .. .. .. Jammu & Kashmir 285 .. 356 94 .. ..Jharkhand 6207 1 522 435 .. .. Karnataka (excl.Ports) 8842 .. 896 744 2 .. Other ports of Karnataka 330 .. 1099 .. .. .. Kerala (excl.Ports) 111 .. 2116 447 .. ..Other ports of Kerala 802 .. 79 34 .. .. Madhya Pradesh 8582 3 504 1400 4 .. Maharashtra (excl.Ports) 25349 .. 1533 1678 .. .. Other ports of Maharashtra 1795 .. 17 .. .. 1 Manipur .. .. .. .. .. .. Meghalaya .. .. .. .. .. ..Mizoram .. .. .. .. .. .. Nagaland 2 .. 166 87 .. .. Orissa 1452 .. 776 154 .. .. Pondicherry & Karikal .. .. 31 79 .. .. Punjab 6767 .. 3 8 .. .. Rajasthan 9596 .. 36 484 .. .. Tamil Nadu(excl. Ports) 2359 .. 7090 940 .. ..Other ports of Tamil Nadu 754 .. 8 1 .. .. Tripura .. .. 235 32 .. .. Uttaranchal 7 .. .. 54 .. .. Uttar Pradesh 5688 .. 17 1328 .. .. West Bengal (excl.Ports) 10273 .. 741 1483 .. 1 Other ports of West Bengal 1679 .. 2231 610 6 1
TRADE
Table 13.12(B)-MOVEMENT OF CERTAIN PRINCIPAL ARTICLES BY RAIL AND RIVERBETWEEN THE STATES AND CHIEF PORT TOWNS-contd.
(Exported From/ Inward)
234
Iron & Oil seeds Salt Sugar Sugar-rawYear\States\ Steel (including (Gur,JaggeryChief of Ports Town Khandsari) & Shakkar)
1 8 9 10 11 12
Exported during 2005-06 (P) 17102 294 594 2210 19
Andhra Pradesh (excl.Ports) 1700 4 120 .. .. Other posts of Andhra Pradesh 17 .. .. 5 4 Assam 85 3 20 303 10 Arunachal Pradesh 2 .. .. .. .. Bihar 366 18 26 12 .. Chattishgarh 78 .. 1 16 .. Chandigarh 328 .. .. 2 .. Delhi 858 43 .. 25 3 Goa 1 .. 19 .. .. Gujarat (excl.Ports) 609 2 2 21 .. Other ports of Gujarat 23 .. 56 22 .. Haryana 1182 12 50 12 .. Himachal Pradesh .. .. .. .. .. Jammu & Kashmir 23 .. .. 43 ..Jharkhand 199 .. 7 2 .. Karnataka (excl.Ports) 444 .. 10 .. .. Other ports of Karnataka 22 .. 38 1 .. Kerala (excl.Ports) 98 .. 1 .. ..Other ports of Kerala .. .. 1 52 .. Madhya Pradesh 307 .. 6 12 .. Maharashtra (excl.Ports) 2568 1 .. 24 .. Other ports of Maharashtra 70 1 102 24 .. Manipur .. .. .. .. .. Meghalaya .. .. .. .. ..Mizoram .. .. .. .. .. Nagaland 6 .. 40 19 .. Orissa 739 .. 37 129 .. Pondicherry & Karikal .. .. .. .. .. Punjab 1367 17 1 77 .. Rajasthan 363 1 17 10 .. Tamil Nadu(excl. Ports) 1748 28 8 2 ..Other ports of Tamil Nadu 69 .. 2 1 .. Tripura 23 .. .. 53 .. Uttaranchal 15 .. .. .. .. Uttar Pradesh 1788 90 10 .. 1 West Bengal (excl.Ports) 1814 4 7 1271 1 Other ports of West Bengal 190 70 13 72 ..
(1) Raw cotton figures relate to Cotton year ending August. (2) Total may not tally due to rounding off of the figures
TRADE
Table 13.12(B)-INLAND TRADE:MOVEMENT OF CERTAIN PRINCIPAL ARTICLES BY RAILAND RIVER BETWEEN THE STATES AND CHIEF PORT TOWNS-Concld.
(Exported From / Inward) ('000 tonne)
Source: Directorate General of Commercial Intelligence and Statistics
(ii) Three new states has been included as new trade blocks (Jharkhand, Chattishgarh & Uttaranchal) and other four have been amalgameted with other ports. Thus nuber of trade blocks stood 37 w.e.f. April, 2004.
Ministry of Commerce and Industry.
Note: i) Each of the three maritime states of Kerala, Tamil Nadu and Maharashtra is divided into three sub-trade blocks. The figures of the 3rd sub-trade block viz."other ports" for all these States are not shown in the breakup. Hence the sum of the breakup is slight lower than the yearly total.

TABLE NUMBER 13.1FOREIGN TRADE IN MERCHANDISE AND TREASURE
0
1000000
2000000
3000000
4000000
5000000
6000000
7000000
1990-91 2000-01 2001-02 2002-03 2003-04 2004-05 2005-06
IMPORTS EXPORTS AND RE-EXPORTS
(RS. MILLION)
TABLE NUMBER 13.3+13.4EXPORTS & IMPORTS BY MAJOR COUNTRIES
(RS. MILLION)(2006-2007)
0 100000 200000 300000 400000 500000 600000 700000 800000 900000
AUSTRALIA
BANGLA DESH
BAHARAIN ISLANDS
BELGIUM
CANADA
CHINA REP. OF PEOP.
FRANCE
GERMANY
HONGKONG
ITALY
JAPAN
KUWAIT
MALAYSIA
RUSSIA
SAUDI ARABIA
SINGAPORE
SWITZERLAND
U.A.E.
U.K.
U.S.A.
IMPORTS EXPORTS

0
100
200
300
400
500
600
700
1990-91 2001-02 2002-03 2003-04 2004-05 2005-06
0200400600800
10001200140016001800
1990-91 2001-02 2002-03 2003-04 2004-05 2005-06
TABLE NUMBER 13.8&13.9INDEX NO.OF IMPORTS AND EXPORTS
UNIT VALUE INDEX
QUANTUM INDEX
(BASE:1978-79=100)
0
50000000
100000000
150000000
200000000
250000000
300000000
350000000
400000000
1990-91 2000-01 2001-02 2002-03 2003-04 2004-05 2005-06
TABLE NUMBER 13.10&13.11COASTING TRADE
EXPORT/ IMPORT OF MERCHANDIES (RS.THOUSANDS)