trade facilitation, value creation, and competitiveness · vietnam's economic growth ... 4.2.2...
TRANSCRIPT

TRADE FACILITATION, VALUE CREATION, AND COMPETITIVENESS:POLICY IMPLICATIONS FOR VIETNAM'S ECONOMIC GROWTH
VOLUME 2
N
ATI
ON
AL
C
OMMITTEE FOR INTERNATIO
NA
L
ECONOMIC COOPERATIO
N
NATIONAL COMMITTEEFOR INTERNATIONALECONOMIC COOPRATION
Duc Minh Pham Deepak MishraKee-Cheok CheongJohn ArnoldAnh Minh Trinh Huyen Thi Ngoc NgoHien Thi Phuong Nguyen
July 15, 2013
Pub
lic D
iscl
osur
e A
utho
rized
Pub
lic D
iscl
osur
e A
utho
rized
Pub
lic D
iscl
osur
e A
utho
rized
Pub
lic D
iscl
osur
e A
utho
rized

TRADE FACILITATION,VALUE CREATION,
AND COMPETITIVENESS:POLICY IMPLICATIONS FOR VIETNAM'S ECONOMIC GROWTH
VOLUME 2
Duc Minh PhamDeepak Mishra
Kee-Cheok CheongJohn Arnold
Anh Minh TrinhHuyen Thi Ngoc Ngo
Hien Thi Phuong Nguyen
THE WORLD BANK
N
ATIO
NAL
COMMITTEE FOR INTERNATIO
NAL
ECONOMIC COOPERATION
NATIONAL COMMITTEEFOR INTERNATIONALECONOMIC COOPRATION

ii
Standard Disclaimer:
This volume is a product of the staff of the International Bank for Reconstruction and Development/ The World Bank.The findings, interpretations, and conclusions expressed in this paper do not necessarily reflect the views of the ExecutiveDirectors of The World Bank or the governments they represent. The World Bank does not guarantee the accuracy ofthe data included in this work. The boundaries, colors, denominations, and other information shown on any map inthis work do not imply any judgment on the part of The World Bank concerning the legal status of any territory or theendorsement or acceptance of such boundaries.
Copyright Statement:
The material in this publication is copyrighted. Copying and/or transmitting portions or all of this work withoutpermission may be a violation of applicable law. The International Bank for Reconstruction and Development/ The WorldBank encourages dissemination of its work and will normally grant permission to reproduce portions of the workpromptly.
For permission to photocopy or reprint any part of this work, please send a request with complete information to theCopyright Clearance Center, Inc., 222 Rosewood Drive, Danvers, MA 01923, USA, telephone 978-750-8400, fax 978-750-4470, http://www.copyright.com/.
All other queries on rights and licenses, including subsidiary rights, should be addressed to the Office of the Publisher,The World Bank, 1818 H Street NW, Washington, DC 20433, USA, fax 202-522-2422, e-mail [email protected].
Cover photo: Supply Chain Vietnam

iii
POLICY IMPLICATIONS FOR VIETNAM’S ECONOMIC GROWTH
TABLE OF CONTENTS
List of figures .....................................................................................................................................................................................vList of tables......................................................................................................................................................................................viList of boxes ......................................................................................................................................................................................viForeword...........................................................................................................................................................................................viiAcknowledgements.......................................................................................................................................................................ixGuide to the Report .......................................................................................................................................................................xiAbbreviations and Acronyms...................................................................................................................................................xiii
Chapter 1: Textiles and Garments .............................................................................................................11.1 Introduction................................................................................................................................................................................11.2 Production and Trade..............................................................................................................................................................11.3 Structure of the Garment Industry .....................................................................................................................................4
1.3.1 Transportation ................................................................................................................................................................61.3.2 Forecast for Garment and Textile Export ..............................................................................................................81.3.3 Forecast for Import of Raw Materials/Inputs for the Garment and Textile Industry .............................91.3.4 Forecast for Export Markets.......................................................................................................................................91.3.5 Forecast for Transport System ..................................................................................................................................9
1.4 Development Strategies ......................................................................................................................................................111.5 Strategy Implementation ....................................................................................................................................................12
Chapter 2: Footwear.................................................................................................................................152.1 Introduction .............................................................................................................................................................................152.2 Production and Trade ...........................................................................................................................................................152.3 Structure of the Footwear Industry .................................................................................................................................18
2.3.1 Transportation..............................................................................................................................................................202.3.2 Forecast of Footwear Export...................................................................................................................................23
2.4 Development Strategies ......................................................................................................................................................262.5 Strategy Implementation ....................................................................................................................................................26
Chapter 3: Electronics and Electrical Equipment ..................................................................................293.1 Introduction .............................................................................................................................................................................293.2 Production and Trade ...........................................................................................................................................................293.3 Structure of the Electronics Industry ..............................................................................................................................31
3.3.1 Transportation..............................................................................................................................................................333.3.2 Forecast for Export of Electronics and Electrical Equipment ......................................................................353.3.3 Future Export Markets...............................................................................................................................................353.3.4 Future Imports .............................................................................................................................................................353.3.5 Future Transport Routes ...........................................................................................................................................36
3.4 Development Strategies ......................................................................................................................................................373.5 Strategy Implementation ....................................................................................................................................................38
Chapter 4: Rice..........................................................................................................................................394.1 Introduction .............................................................................................................................................................................394.2 Vietnam in the Global Rice Market...................................................................................................................................39
4.2.1 Key Exporters................................................................................................................................................................414.2.2 Key Importers ...............................................................................................................................................................41

iv
TRADE FACILITATION, VALUE CREATION, AND COMPETITIVENESS
4.3 Vietnamese Production and Trade...................................................................................................................................424.4 Structure of the Rice Industry ............................................................................................................................................44
4.4.1 Transportation .............................................................................................................................................................464.4.2 Forecast for Rice Export ............................................................................................................................................49
4.5 Supply Chain-Focused Development Strategies ........................................................................................................514.6 Strategy Implementation ....................................................................................................................................................53
Chapter 5: Coffee......................................................................................................................................595.1 Introduction .............................................................................................................................................................................595.2 Production and Trade ...........................................................................................................................................................595.3 Structure of the Coffee Industry .......................................................................................................................................625.4 Development Strategies for the Sector..........................................................................................................................685.5 Strategy Implementation....................................................................................................................................................69
Chapter 6: Seafood...................................................................................................................................716.1 Introduction .............................................................................................................................................................................716.2 Production and Trade ...........................................................................................................................................................716.3 Structure of the Seafood Industry....................................................................................................................................74
6.3.1 Transportation...............................................................................................................................................................766.3.2 Forecast for Seafood Export....................................................................................................................................78
6.4 Development Strategies ......................................................................................................................................................796.5 Strategy Implementation ....................................................................................................................................................81
References ................................................................................................................................................83

v
POLICY IMPLICATIONS FOR VIETNAM’S ECONOMIC GROWTH
LIST OF FIGURES
Figure 1.1 Vietnam Garment Exports by value, 1996-2011 ..................................................................................2Figure 1.2 Vietnam Garment Market, 2000-2010 .....................................................................................................2Figure 1.3 Woven and Knitted Garments, 2002-2010.............................................................................................2Figure 1.4 Women and Men’s Garments, 2002-2010 ..............................................................................................3Figure 1.5 Garment Import Content of Exports, 2005-2011.................................................................................3Figure 1.6 The Garment Industry in Vietnam.............................................................................................................4Figure 1.7 Garment Export Flows, 2010.......................................................................................................................7Figure 1.8 Garment and Textile Transportation Flows for Export-Import by 2020 ....................................10Figure 1.9 The Process of Backwards Integration ..................................................................................................13Figure 2.1 Vietnam Footwear Exports, 2001-2011 ................................................................................................16Figure 2.2 Vietnam Footwear Exports by Type, 2002-2011................................................................................16Figure 2.3 Vietnam Footwear Exports by Destination, 2010 .............................................................................17Figure 2.4 Primary Participants in Footwear Supply Chains ..............................................................................19Figure 2.5 Footwear Production and Export Flows, 2010...................................................................................21Figure 2.6 Export Footwear Movement Flows, 2020 ............................................................................................25Figure 3.1 Vietnam Electronic Exports by Types, 2012 – 2011 ..........................................................................30Figure 3.2 Vietnam Electronic Export Markets (2000 - 2010).............................................................................30Figure 3.3 Relationships of Electronics Supply Chain Activities.......................................................................32Figure 3.4 Electronics and Electrical Equipment Export Flows, 2010.............................................................34Figure 3.5 Electronic Export and Import Movement Flows by 2020 ..............................................................36Figure 3.6 Location of Industrial Zones Relative to International Gateways ...............................................38Figure 4.1 Major Rice Producers, 2010-2011 ...........................................................................................................40Figure 4.2 Major Rice Exporters and Importers ......................................................................................................40Figure 4.3 Rice Exporters, 2007-2011.........................................................................................................................40Figure 4.4 Global Rice Export Value Share................................................................................................................40Figure 4.5 Vietnam Rice Exports, 1989-2011 ...........................................................................................................42Figure 4.6 Vietnam Rice Export Destinations, 2001-2011...................................................................................43Figure 4.7 Exported Rice .................................................................................................................................................43Figure 4.8 Alternative Rice Supply Chain..................................................................................................................45Figure 4.9 Domestic Traffic Flows of Rice Export ...................................................................................................47Figure 4.10 Projected Rice Export Movement Flows, 2020...................................................................................50Figure 4.11 Price for Hom Mali and 5% Broken White ............................................................................................55Figure 4.12 Price for Fragrant and 5% Broken White ..............................................................................................55Figure 4.13 Price of 5% and 25% Broken White Long Grain .................................................................................56Figure 4.14 Market Price for White Long Grain 5% Broken...................................................................................57Figure 5.1 Vietnam Coffee Production and Export Value and World Coffee Prices ...................................60Figure 5.2 Key Destination Markets for Vietnam Coffee Exports, 2001-2010 ..............................................60Figure 5.3 Competitiveness of Coffee Exporters, 2011........................................................................................61Figure 5.4 Coffee Production Chain............................................................................................................................63Figure 5.5 Exported Coffee Movement Flows, 2010 .............................................................................................65Figure 5.6 Exported Coffee Movement Flows, 2020 .............................................................................................67Figure 6.1 Vietnamese Seafood Production (by Source), 1990 – 2010 ..........................................................72Figure 6.2 Key Destination Markets for Seafood Exports (by Value), 2000 – 2010.....................................72

vi
TRADE FACILITATION, VALUE CREATION, AND COMPETITIVENESS
Figure 6.3 Shrimp and Pangasius Export Volumes and Values, 2003 – 2009...............................................73Figure 6.4 Shrimp Destinations by Value, 2009 ......................................................................................................74Figure 6.5 Supply Chain for Seafood Exports..........................................................................................................75Figure 6.6 Traffic Flows of Seafood..............................................................................................................................77Figure 6.7 Exported Seafood Movement Flows by 2020 ....................................................................................80
LIST OF TABLES
Table 1.1 Enterprises in Vietnam Apparel Industry, 2006 ....................................................................................4Table 1.2 Characteristics of Different Business Models ........................................................................................5Table 1.3 Main Domestic Transport Routes ..............................................................................................................6Table 1.4 Potential Elements of a Vision for the Garment Industry...............................................................12Table 2.1 Main Domestic Transport Routes............................................................................................................22Table 3.1 Domestic Traffic Routes..............................................................................................................................35Table 4.1 Main Domestic Routes................................................................................................................................47Table 4.2 Opportunities for Value Addition in Rice Supply Chain..................................................................52Table 5.1 Coffee Production by Province, 2010 ....................................................................................................61Table 5.2 Examples of Integration of Supply Chain Activities .........................................................................63Table 5.3 Main Domestic Transport Routes............................................................................................................65Table 6.1 Main Domestic Transport Routes............................................................................................................78
LIST OF BOXES
Box 1.1 Paths to High value Garments .................................................................................................................11Box 4.1 Cho Gao Canal ...............................................................................................................................................48

vii
POLICY IMPLICATIONS FOR VIETNAM’S ECONOMIC GROWTH
FOREWORD
Trade plays a particularly important role in contributing to the economic growth of Vietnam. The country’srapid trade growth during the past two decades has been built on international economic integrationprocess -- lower barriers to trade and participation in agreements with trade partners. However, with thisprogress in international commitments well advanced, the advantages of trade liberalization in contributingto the growth of trade are reaching their limits. It is time to have a new approach to improve tradecompetitiveness and export growth.
The study “Trade Facilitation, Value Creation, and Competitiveness: Policy Implications for Vietnam’sEconomic Growth” is an activity under the World Bank-funded technical assistance program to support theformulation and the implementation of the National Action Plan for trade competitiveness enhancementin Vietnam. The program has been carried out in collaboration with Office of the National Committee forInternational Economic Cooperation (NCIEC) to help Vietnam formulate and implement activities to enhancetrade competitiveness, especially in the context of global crisis, and at the same time improve the efficiencyof international economic integration.
I must welcome and am highly appreciative of the close collaboration between the World Bank in Vietnamand Office of the NCIEC in this and the past endeavours. I believe that the continued cooperation andsupport of the World Bank will contribute to promote the economic development of Vietnam.
Vu Van NinhDeputy Prime Minister
Chairman, National Committee for International Economic Cooperation

viii
TRADE FACILITATION, VALUE CREATION, AND COMPETITIVENESS
ix
This report was prepared by a World Bank team led by Duc Minh Pham and consisting of Deepak Mishra,Kee-Cheok Cheong, and John Arnold under the guidance of Shudhir Shetty and Victoria Kwakwa.
This report is a product of a comprehensive study “Trade and Transport Facilitation Assessment” (TTFA)funded by Trust Fund TF097373 under the umbrella of the World Bank-managed Trade Facilitation Facility(TFF). The general objective of this study is to identify ways to improve the competitiveness of Vietnam’sexports. The challenge facing Vietnam is not only reducing the cost and time of logistics for its exports butalso restructuring its supply chains to add value to its exports and to promote trade in higher value goods.The study supports activities that can bridge the policy gap in trade and logistics facilitation and assist theformulation of a national trade facilitation strategic plan. The strategy, when implemented, will enhanceVietnam’s competitiveness and sustain productivity-based growth.
An endeavor of this breadth and detail cannot succeed without the contribution of many people. The teamis grateful to the following for contributing to the writing of this report: Thomas Farole, Gerard McLinden,Jose Barbaro, Jean-Francois Gautrin, Trinh Minh Anh, Nguyen Luong Hien, Ngo Thi Ngoc Huyen, NguyenDuc Tri, Nguyen Thi Phuong Hien, Nguyen Thi Diem Hang, and Nguyen Ngoc Anh.
Others who contributed comments are Habib Rab, Steven Jaffee, Paul Vallely, Luis Blancas, Viet Tuan Dinh,Quang Hong Doan, Dung Anh Hoang, Jean Francois Arvis, Monica AlinaMustra, Baher El-Hifnawi, Ivailo V.Izvorski, Hamid R. Alavi, Hinh T. Dinh, Myla Taylor Williams, and Julian Latimer Clarke from the World Bank;Lam Thi Quynh Anh, Le Gia Thanh Tung from the National Committee for International EconomicCooperation (NCIEC); Pham Dinh Thuong, Truong Chi Binh, Pham Ngoc Hai and Tran Minh Thu from theMinistry of Industry and Trade (MOIT); Nguyen Thanh Hung from the Office of the Government (OOG); TranCong Thang and Dinh Bao Linh from the Ministry of Agriculture and Rural Development (MARD); NguyenThi Vuot, La Tra Linh, Le Thanh Nhan, Le Tuan Anh, Le Duc Nghia, Ngo Thi Nhuong, Nguyen Nhu Thang, andHuynh Minh Hue from the Ministry of Transport (MOT); Nguyen Thang from the Vietnam’s Academy of SocialSciences (VASS); Nguyen Toan from the General Department of Customs (GDC); Nguyen Kim Thao, HoangThi Phuong Thao, Tran Hong Hai, and Le Kim Loan from the University of Economics of Ho Chi Minh City(UEH); Pham Lan Huong from the Central Institute for Economic Management (CIEM); Pham Gia Tuc, DauAnh Tuan from the Vietnam Chamber of Commerce and Industry (VCCI); Luong Van Tu from the VietnamCoffee Association (VICOFA); Dang Phuong Dung from the Vietnam Textile and Garment Association (VITAS);Nguyen Huu Dung from the Vietnam Association of Seafood Exporters and Producers (VASEP); Do XuanQuang from the ASEAN Federation of Forwarders Association (AFFA), Nguyen Minh Phong from the NhanDan Newspaper; Pham Chi Lan (Senior Economist), Hoang Tich Phuc (Senior Trade Economist), Pham MinhNghia (Senior Transport Specialist), Doan Thi Phin (Senior Transport Specialist), Nguyen Duc Nhat (SeniorEconomist), and Nguyen Tuong (Senior Transport and Logistics Specialist).
ACKNOWLEDGEMENTS
POLICY IMPLICATIONS FOR VIETNAM'S ECONOMIC GROWTH

The National Committee for International Economic Cooperation (NCIEC) and the Vietnam Chamber ofCommerce and Industry (VCCI) are the host and co-host agencies, respectively, for this study. In expressingour thanks to them we wish to especially acknowledge the guidance of Mr. Nguyen Cam Tu, GeneralSecretary of NCIEC and Vice Minister of the Ministry of Industry and Trade, and Mr. Pham Gia Tuc, ViceChairman of VCCI. NCIEC and VCCI have supported the conduct of the TTFA survey and the organization ofseveral seminars and workshops with research institutions, government agencies, and in particularbusinesses in Ha-Noi, Ho Chi Minh City and Can-Tho.
The team wants to record a special thank you to Deputy Prime Minister Vu Van Ninh for endorsing this studyand for providing the foreword for its synthesis report. We would like to express our specialacknowledgement to Sudhir Shetty, Victoria Kwakwa, Shubham Chaudhuri, and Mona Haddad, whoprovided valuable leadership, guidance and support throughout the various phases of this work.
Charles Kunaka, Richard Record (World Bank), and Nguyen Dinh Cung (Central Institute for EconomicManagement) are the peer reviewers. We thank them for their comments.
The study benefited from editorial and administrative support from Ibrahim Ndoma, Mara Baranson, CharlesWarwick, Vu Thi Anh Linh, and Le Thi Khanh Linh.
x
TRADE FACILITATION, VALUE CREATION, AND COMPETITIVENESS

xi
This report consists of three volumes. The first, the Summary Report captures the salient features and keymessages of the entire study. Volume 1 provides the detailed analysis of the themes while Volume 2 containscase studies of trade facilitation of six industries.
The summary report brings together the main features of trade facilitation. It views trade facilitation ashaving three main components -- trade-related (“hard infrastructure”), regulatory and organizationalframework (“soft infrastructure”), and supply chain organization. These components are considered againstthe context of changes in Vietnam’s trade environment, as well as function within the country’s institutionalframework. The strengths and deficiencies of these components are highlighted and the role of governmentin capitalizing on these strengths while addressing weaknesses discussed. A summary of recommendationsconcludes the report.
Volume 1 consists of the detailed analytical discussion from which conclusions are drawn andrecommendations made. Chapter 1 presents the conceptual framework for the analysis, beginning withcharacterizing trade facilitation and demonstrating how different parts fit together to have an impact on exportcompetitiveness. Chapter 2 provides the context of Vietnam’s trade dynamics, showing why, despite a currentrobust export performance, Vietnam needs to take trade facilitation seriously. Chapter 3 depicts the country’sperformance in this area, identifying performance gaps to show the scope for improvement. Chapters 4 to 6provide detailed discussion of the “pillars” of trade facilitation. Chapter 4 examines the state of Vietnam’s traderelated infrastructure in terms of the major transport nodes. Chapter 5 outlines the regulatory framework forcross-border trade. This is viewed from the perspective of the domestic economy as well as Vietnam’s tradefacilitation commitments from agreements with other countries, especially the ASEAN grouping of which it isa member. Chapter 6 explores the role and state of supply chains in Vietnam. This is an important area fortrade facilitation, but one in which little work has been carried out. The discussion consolidates surveys of sixsubsectors undertaken specifically for the study. Chapter 7 discusses the institutional framework within whichthe pillars of trade facilitation function. This framework has macro-, mezzo-, and firm-level dimensions. Thefinal chapter summarizes the many policy recommendations to address the deficiencies identified in thepreceding chapters. A policy matrix matches deficiencies to remedies.
Volume 2 contains case studies of supply chains for six subsectors - three manufacturing and threeagricultural. The manufacturing subsectors are textiles and garments, footwear, and electronics andelectrical equipment. The agricultural/aquaculture subsectors are rice, coffee and seafood. All thesesubsectors have experienced healthy export growth but each has weaknesses in its supply chain.
GUIDE TO THE REPORT
POLICY IMPLICATIONS FOR VIETNAM'S ECONOMIC GROWTH

xii
TRADE FACILITATION, VALUE CREATION, AND COMPETITIVENESS

xiii
AFET Agricultural Futures Exchange of Thailand
ASEAN Association of South East Asian Nations
BMP Better Management Practices
C&F / CIF Cost and Freight / Cost, Insurance and Freight
CMT Cut-Make-Trim
CNF Cost, No Insurance, and Freight
CoC Code of Conduct for Responsible Aquaculture
DWT Dead-Weight Tonnage
EMS Electronic Manufacturing Services
ERP Enterprise Resource Planning
EU European Union
FOB Freight on Board
FDI Foreign Direct Investment
G-to-G Government-to-Government
GAP Good Aquaculture Practices
HACCP Hazard Analysis and Critical Control Points
HCMC Ho Chi Minh City
ICD Inland Container Depot
ICT Information and Communication Technology
MARD Ministry of Agriculture and Rural Development (Vietnam)
MDB Multinational/Multilateral Development Bank
OBM Original Brand Manufacturer
ODM Original Design Manufacturer
OEM Original Equipment Manufacturer
PCU Passenger Car Unit
QR Qualitative Restrictions
SOE State-Owned Enterprise
TBT Technical Barriers to Trade
TEU Twenty-Foot equivalent unit (cargo capacity measure)
THC Terminal Handling Charge
UK United Kingdom
UN United Nations
US$ / USD US Dollar
USA United Stated of America
USDA United States Department of Agriculture
VF Vendor Factory
WTO World Trade Organization
ABBREVIATIONS AND ACRONYMS
POLICY IMPLICATIONS FOR VIETNAM'S ECONOMIC GROWTH

xiv
TRADE FACILITATION, VALUE CREATION, AND COMPETITIVENESS

1 China exports six times the value of its nearest competitor, http://www.vietnamtextile.org.vn/en/statistics/other-markets/10590/worlds-clothing-exports-%282000---2010%29/newsdetail.aspx.
2 http://www.vietnamtextile.org.vn/en/statistics/vietnam/10290/vietnams-textile-and-garment-export-by-category-in-july-2011/newsdetail.aspx.
1.1 Introduction
Garments are Vietnam’s most valuable export. They accounted for 14 percent of the country’s total exportearnings in 2011 and 4 percent of global garment exports. However, its market share is small compared toChina with about 40 percent of garment exports.1 Vietnam specializes in relatively low value garments witht-shirts, jackets and trousers representing the largest proportion of garment exports in 2011. 2
1.2 Production and Trade
The value of Vietnam’s exports of apparel has grown at an average rate of 20 percent over the last 15 years(Figure 1.1). Apparel exports were estimated to total US$16 billion in 2011 with strong growth projectedfor 2012. Over the last decade, Vietnam’s share of the global garment trade has quadrupled. There are anumber of factors driving this growth. First, there is continuing migration of manufacturers to Asia lookingto reduce the costs of labor inputs. Second, large retailers and brand manufacturers are reducing supplyrisk exposure by ordering garments from a wider array of countries. Third, Vietnam has gained preferentialaccess to large markets through bilateral and free trade agreements. Vietnam entered a bilateral tradeagreement with the United States of America (USA) in 2001 and, in the subsequent 10 years, garment exportshave increased 15-fold from US$45 million to nearly US$$7 billion in 2011. As a member of the Associationof South East Asian Nations (ASEAN), Vietnam is part of free trade agreements with developed countries likeJapan and Australia.
CHAPTER 1
TEXTILE AND GARMENTS
1

3 http://www.vietnamtextile.org.vn/en/statistics/vietnam/10901/vietnams-textile-and-clothing-exports-in-2011-%28by-markets%29/newsdetail.aspx.
Figure 1.1: Vietnam Garment Exports by value, 1996-2011
Source: Vietnam Textile and Apparel Association.
2
TRADE FACILITATION, VALUE CREATION, AND COMPETITIVENESS
The principal destinations for Vietnam’s apparel exports are the USA, the European Union (EU), and Japan(Figure 1.2). The countries within the EU that account for most of the demand are Germany, the UnitedKingdom (UK), Spain and the Netherlands.3 However, these countries’ shares of Vietnamese exports havebeen declining as Vietnam has diversified into new markets.
Garment exports include both woven and knitted garments. The value share of knitted garments hasgradually increased and now accounts for about half of garment exports (Figure 1.3). Since the unit valuefor woven garments is higher than for knitted, the increase in share of knitted garments measured in termsof volume is much greater.
Source: UN Comtrade. Source: UN Comtrade.
Figure 1.3: Woven and Knitted Garments,2002-2011
Figure 1.2: Vietnam Garment Market,2000-2010
Others
Mill
ion
US$
Japan EU countries USA

4 http://www.keepandshare.com/doc/1514992/onderzoek-bandolera-870k?da=y.
3
POLICY IMPLICATIONS FOR VIETNAM’S ECONOMIC GROWTH
Exports can also be divided into market segments. The basic division is between men and women’s clothes,and others. The latter includes athletic clothes, t-shirts and pullovers. The share of women’s clothes in totalexports increased over the four years up to 2005, but has since fallen to 34 percent in 2011. The share ofexport value from men’s clothes has been falling steadily for the last 10 years. In contrast, t-shirts andpullovers have increased their share in recent years to 35 percent (Figure 1.4). As garments in the ‘others’category are generally less expensive, this shift has been more pronounced in terms of volume. Thiscombination of trends suggests that growth in Vietnam’s apparel exports has been driven by volume whilethe unit value of garments has been declining.
The textile industry in Vietnam is less developed. Production of local and synthetic fiber is limited andsignificant imports of fiber are required for local spinning. For example, less than 4 percent of the cottonused is grown locally. Most of the fabric produced domestically is of low quality and used in the manufactureof apparel for the domestic market. As a result, Vietnam imports about 80 percent of the fabric used in theapparel sector, mostly from the Asian region. While it is estimated that the portion of local inputs increasedsignificantly (Figure 1.5), this is partly a result of purchases of imported inputs from local wholesalers.
Vietnam has about 2400 garment manufacturers and about 750 firms involved in the production of textiles.Together they employ almost 2 million workers. A majority of the factories are located around Ho Chi MinhCity, but some factories have been built in rural areas in response to tax incentives offered by government(Table 1.1).4 There is little concentration in the industry with the exception of VINATEX, which has about a20 percent market share -- much of which is produced for the domestic market.
Most of the output is produced by factories employing 1000-5000 workers, but there are much smaller firmsthat serve the domestic market and act as subcontractors to larger firms. More than half of Vietnam’sgarment exports are produced by companies that are either foreign-owned or have a significant amount ofForeign Direct Investment (FDI). The portion of exports produced by State-Owned Enterprises (SOEs) hasbeen decreasing together with the number of SOEs in the garment industry.
Figure 1.4: Women and Men’s Garments,2002-2010
Figure 1.5: Import Content of ExportedGarments, 2005-2011
Source: UN Comtrade and ITC. Source: Vietnam Textile and Apparel Association.
2002
Other Men’s Women’s
100%
90%80%70%
60%50%40%
30%20%
10%0%
2004 2006 2008 2010
% of export value derived from imports
2005
75%
70%
65%
75%
55%
50%
45%
40%2006 2007 2008 2010 20112009

Table 1.1: Enterprises in Vietnam’s Apparel Industry 2006
Location Product Categories
Ho Chi Minh City 1090 Materials and spinning 96
Ha-Noi City 17 Woven Fabric 382
Dong-Nai Province 142 Non-Woven Fabric 6
Binh-Duong Province 116 Garment 1446
Long-An Province 27 Accessories 35
Da-Nang City 55 Services 265
Other 364
1.3 Structure of the Garment Industry
Garment manufacturing can be divided into six distinct activities (see Figure 1.6). The core activity is theassembly processes, which include cutting, sewing (making) and trimming. This step, referred to as Cut-Make-Trim (CMT), is usually the most labor intensive. Upstream of the assembly is the sourcing and procuringof fabric and other inputs while downstream is the distribution of the garments. These represent theinbound and outbound supply chains and include both transactions and logistical services. The remainingactivities -- establishing a brand and designing the garment -- are performed separately but utilizeinformation gathered from distribution and marketing.
4
TRADE FACILITATION, VALUE CREATION, AND COMPETITIVENESS
Source: “Textile & Garment Industry in Vietnam: Research on Garment Producers in Vietnam”, International BusinessResearch Vietnam, 2008.
Figure 1.6: The Garment Industry in Vietnam
Source: Vietnam TTFA Survey, 2012.
Brand
Contract Manufacturer (FOB I)
Original Equipment Manufacturer (OEM/FOB II)
Original Design Manufacturer (ODM)
Original Brand Manufacturer (OBM)
Design CMTSourcing Strategies
Vendor Factory
Distribution & MarketingProcurement

Source: Authors.
5
POLICY IMPLICATIONS FOR VIETNAM’S ECONOMIC GROWTH
5 One business model that has been underutilized is the subcontractor network, in which large firms outsource excess orders or demandfor special components to smaller firms included in their networks.
Margin on processing order for inputs If supplies shipped FOB
OEM
ODM
Delays producing samples
Obtain buyer’s approvalPossible savings in costs, more valuefrom design
Reduce input cost but lack scale to buyfrom larger suppliers
Contract CMT manufacturer (FOB 1)
FOB 2
Terminology Value-added Risk
Vendor factory CMT Labor only None
FOB 3
In Vietnam, most of the firms are involved only with the core activity. A relatively small proportion participatesin all six activities.5 The former are called foreign-owned vendor factories (VF) and make up around 60 percentof factories in Vietnam. Vendor factories operate under the direction of their foreign owners and have littledirect involvement in their inbound and outbound supply chains. The next largest group of firms is contractmanufacturers. In addition to undertaking the CMT, they also purchase the necessary input materials. InVietnam, these firms are referred to as “Freight on Board” (FOB) 1 since they receive payment for the full priceof the garment that is exported, not just a payment for the assembly of the garment (as vendor factories do).Firms that have extended their activities to include sourcing and procuring a significant portion of their inputsare referred to as original equipment manufacturers (OEMs) or FOB II in Vietnam. About 98 percent of thefirms in the garment industry fall within one of these three categories.
The fourth category of firms is original design manufacturer (ODM). These firms extend their involvementto include design and distribution and marketing. The fifth category, original brand manufacturers (OBM),is involved in all stages of production including developing a brand. At present, the garments producedby these firms are marketed only within the region. But this is only the beginning of what is expected tobecome an important niche market with a number of firms considering establishing design teams as ameans to increase the value addition of their business.
The five types of firms have different levels of value addition within Vietnam and face different levels ofcommercial risks depending on their involvement in different aspects of the industry. These are summarizedin Table 1.2.
Table 1.2: Characteristics of Different Business Models
Nearly all factories base their production on existing orders and maintain a minimum inventory of inputs orproducts. Inputs are ordered only after a production order has been confirmed. The time from orderconfirmation to delivery to the buyer varies, with some firms operating in the range of 40 - 60 days andothers 90 - 120 days. Most of this variation is due to the delivery time for inputs, which varies from a fewdays for domestic inputs to three months for custom-made imported fabrics. Most imported inputs aresourced from China, Taiwan (China), Korea and other locations in Asia. Standard items can be obtained in2 - 4 weeks. If special fabric is required, then the delivery time can extend to 45 days for solid fabrics and60 days for striped fabrics.

Source: Transport Development and Strategy Institude (TDSI).
6
TRADE FACILITATION, VALUE CREATION, AND COMPETITIVENESS
Route Road
Traffic volume on NH5, the main connecting link to Hai-Phong port is very heavy. Since this road passesthrough densely population areas, vehicle speeds are limited and the rate of accidents is high. A trafficcount at Hai-Duong station (km58+700) in 2010 recorded a volume of 54,000 passenger car units (PCUs)per day versus a capacity of only 30,000 PCUs per day. The truck traffic was also heavy with nearly 6000trucks per day with three or more axles.
A similar level of congestion was observed on NH1A. In 2011, a volume in excess of 150,000 PCUs per daywas reported on the section between Dong-Nai and HCMC. This included more than 20,000 trucks of three-axle or more. The section between Can-Tho and HCMC had a volume of 56,700 PCUs per day. The links tothe ports including Nguyen-Van-Linh – Phu-My bridge and Ha-Noi highway – Nguyen-Thi-Dinh road haveproblems with frequent congestion.
1.3.1 Transportation
Figure 1.7 shows the locations of productive areas and flows of textile and garments exports in Vietnam. Atpresent, apparel and textile production is scattered throughout the country. Nevertheless, 88 percent ofapparel and textiles are exported from two major export centers: one in the North (31 percent) and one inthe South (57 percent). The different shades of blue color in the map denote the export value by province.The map also shows the main international gateways for the garment export flows. 2010 statistics of theGeneral Department of Customs (GDC) show that 80 percent of apparel and textiles is exported by sea, 13percent by air, and the remaining 7 percent by road. The export transport hubs in the North include theHai-Phong port and Noi-Bai international airport. Those in the South include ports in Ho Chi Minh City(HCMC) and Tan-Son-Nhat airport.
Currently, Vietnam's apparel and textile industry imports high cost inputs that account, on average, for 60percent of the total exported value. 2010 statistics of the GDC show that apparel and textile raw materialsare mainly imported to Vietnam by sea (US$8.7 billion, 89 percent in total) and by air (US$780 million, 8percent in total, mainly through Noi-Bai and Tan-Son-Nhat airports). The primary sea traffic ports were theHCMC port complex (approximately US$6 billion, or 68 percent in total) and Hai-Phong port (US$2.5 billion,or 29 percent in total). The remainder of imports came through Da-Nang, Vung-Tau and Can-Tho ports.The bar charts show volume and destinations of textile and apparel products exported through the maingateways. The exported volume is denoted by the size of the bar. The area of the empty circle in the legendrepresents a sample volume measured by 50,000 twenty-foot equivalent units (TEUs). Exported appareland textiles and imported raw materials are transported by road to and from exporting areas, ports andfactories through main transport routes as shown in Table 1.3 below.
Table 1.3: Main Domestic Transport Routes
The Red River Delta region to Ha-Noi and Hai-Phong NH5
The Northern Mountainous region to Hai-Phong NH2, NH3, Thang-Long – Noi-Bai and NH5
The Northern Central region to Hai-Phong NH1A, NH10 and NH5
The South East region to HCMC NH13, NH22 and NH51
The Mekong Delta region to HCMC NH1A from Ca-Mau to HCMC
The Central Region to HCMC NH1A

EXPORT VOLUME BY AIR USA 47%
Korea 11%
Other 42%
SHARE OF EXPORT VALUE BY TRANSPORT MODE
0% 20% 40% 60% 80% 100%
Export
Import
Seaport Border gate Airport
EXPORT VOLUME BY AIR
USA 48%
Japan 19%
Germany 5%
Others 28%
EXPORT VOLUME BY SEA
USA 47%
Japan 8%Korea
5%
Germany 5%
Spain 5%
Others 30%
50.000 TEUs
EXPORT
HCM City
Ha-Noi
LAO PDR
CAMBODIA
Hai-Phong Cai Lan
Da-Nang
Quy Nhon
Vung-Tau Sai-Gon
EXPORT VOLUME BY SEA
USA
59%
Others
41%
EXPORT VALUE BY PROVINCE
EXPORT FLOWS
500 Mil.USD
100 Mil.USD
>1,000 Mil.USD
10,000 TEUs50,000 TEUs100,000 TEUs
7
POLICY IMPLICATIONS FOR VIETNAM’S ECONOMIC GROWTH
Figure 1.7: Garment Export Flows, 2010
Source: Freight flows data provided by TDSI.

Apparel and textile exports are loaded into containers at the factory and transported by road to the gatewayports. From the Northern region to Hai-Phong port, the average cost for transport is US$1.5-2 per TEU-km.The cost for unloading at the port is US$30 per TEU. Travel time between Ha-Noi and Hai-Phong is 3-4 hours.For the Southern region, cost for transport is US$1.3-2.0 per TEU-km, with a charge of US$27 per TEU forunloading at the port. The principal destinations for apparel and textiles are USA (43 percent), EU countries(16 percent), Japan (11 percent) and Korea (6 percent). The international routes are:
n From Hai-Phong port and Sai-Gon port complex, transshipping via Singapore, then through the SuezCanal and the Mediterranean to Europe and the US East Coast.
n From Hai-Phong port and Sai-Gon port complex, transshipping in Hong Kong SAR (China)/Japan to theUS West Coast.
n By air from Noi-Bai airport to America, Japan, South Korea and from Tan-Son-Nhat airport to the UnitedStates, Japan, Germany, France, the UK, and South Korea.
International sea transport costs depend on the routes and the ship tonnage: for HCMC ports to America thecost is 2200-2500 US$/TEU, to Europe it is 1500-2500 US$/TEU, and to Korea and Japan it is 900-1200 US$/TEU.Time for transport is about 30-40 days to America, 25-35 days to Germany and about 7-10 days to Japan.
1.3.2 Forecast for Garment and Textile Export
Vietnam’s 2020 Export and Import Strateg for Apparel and Textiles envisage a gradual relocation of production factoriesto provinces with local agricultural workforces and transport advantages, while fashion centers, sample design researchunits and centers for material supply and trade will be built in Hanoi, HCMC and other big cities. From 2011 to 2015,the export growth rate in this sector is forecasted at 12 percent per annum. Export revenue is forecast to increasefrom US$11.2 billion in 2010 to US$18 billion in 2015. From 2016 to 2020, a sector growth rate of 9 percent per yearis forecast, while the total export value is targeted to reach US$25 billion by 2020. According to the Garment andTextile Plan by Region under Decision 36/2008/QD-TTg, the following zones will play specific roles in sectordevelopment:
n Region I - Red River Delta region. Ha-Noi is projected to become a service center, supplying materials,technology, design and factories for high value added products. Other factories will be moved toprovincial industrial zones such as Hoa-Xa (Nam-Dinh), Nguyen-Duc-Canh (Thai-Binh), Pho-Noi B (Hung-Yen), Dong-Van (Ha-Nam), Vinh-Phuc, Bac-Ninh, and Ninh-Binh.
n Region II - South East region. HCMC is projected to become the center of trade, fashion design, appareland textile industry services and high value added fashion factories. Dyeing and finishing factories willbe located in HCMC with additional finishing factories in Hoa-Khanh (Da-Nang) and Quang-Tri.
n Region III - Mekong Delta region. Can-Tho will be the center for an export apparel and textile industrialcomplex, with a dyeing industrial zone located in Tra-Vinh.
n Region IV - Northeast and Northwest region. A textile industrial zone will be developed in Phu-Tho. Othergarment factories will be located in other provinces. Planting areas for cotton and the production of silkwill also be developed in Son-La and Dien-Bien.
n Region V - Northern Central region. Garment and textile factories are expected to locate along NH1A insome industrial parks/zones in Bim-Son (Thanh-Hoa), Vinh (Nghe-An) and Hue (Thua-Thien-Hue). Threeintegrated dyeing and weaving industrial parks will be established in Dien-Chau (Nghe-An), Ha-Tinh, andQuang-Tri between 2012-2015.
n Region VI - Central Highlands region. This area will be the center of agricultural production of cotton andmulberry trees for silkworms, with a focus on processing materials for export products and domesticmarkets.
8
TRADE FACILITATION, VALUE CREATION, AND COMPETITIVENESS

1.3.3 Forecast for Import of Raw Materials/Inputs for the Garment and Textile Industry
The general direction of export and import strategies for 2011-2020 is to promote domestic production ofthe raw materials required for the apparel and textile industry, thereby reducing imports from externalmarkets.
Over the next few years, raw material imports for the apparel and textile sector will continue to increase. From2011 to 2015, the value of imported cotton is projected to increase by 15.7 percent per year to US$1.4 billion,the value of yarn to increase 8.9 percent per year to US$1.8 billion, imported fabric to increase 10.9 percentper year to US$6.3 billion and the value of accessories to increase 7.7 percent per year to US$2.6 billion.Between 2016 and 2020, the value of imported cotton and yarn is expected to increase only slightly due tothe substitution of domestic production to supply the demand.
Garment and textile raw materials will be centralized primarily in Ha-Noi and HCMC, with materials supplied tosector enterprises from there. Imported cotton will be supplied primarily to Phu-Tho, Hung-Yen, Thai-Binh, Thanh-Hoa, Quang-Tri, Hue, Quang-Nam, Da-Nang, Binh-Dinh, Tay-Ninh, and Tien-Giang provinces. Imported yarn willbe delivered to many provinces in four main regions: the Red River Delta region, the Central region, the SouthEast region and the Mekong Delta region. Fabric will be supplied to provinces with an available workforce.
1.3.4 Forecast for Export Markets
Export markets for the sector’s finished products are expected to be developed in countries such as the UnitedStates, the EU, Canada, Japan, Korea, Australia and some smaller markets such as Hong Kong SAR (China),Singapore, Switzerland, UK, etc. In addition, emerging markets such as China, South Korea, Angola, NewZealand, India, and Russia are seen as potential export markets for the Vietnamese garment and textile sector.
1.3.5 Forecast of Transport System
Based on the sector development strategy, export route requirements will be determined by the relocationof factories from Ha-Noi and HCMC to neighboring provinces and the needs for domestic linkages. Thedevelopment of ports in the Central region and the promotion of the Vung-Tau container transshipmentport will reduce the traffic for two major export centers, namely: Noi-Bai aiport and Hai-Phong port in theNorth and the export center in HCMC in the South. Long-Thanh airport – Dong-Nai is also expected tobegin operation, attracting export and import traffic from HCMC. Through implementing the ExpresswayNetwork Master Plan, it is expected that domestic road transport networks will meet the demand fortransport within the garment and textile sector.
In the future, therefore, more than 90 percent of apparel will be exported by sea, and the rest by air, whileraw material is completely imported by sea. Domestic transportation will be formed as follows:
n The Red River Delta: Corridor of NH2 – NH5, NH10 – NH5, NH18 – NH5 to Hai-Phong port and Noi-BaiAirport;
n The Northern Mountains : Corridor NH2, NH3, NH1A – NH5 to Hai-Phong Port;
n The Northern Central Region and Central Coastal Region: NH1A to Da-Nang Port;
n Central Coastal Region, Central Highlands, South East Region, MeKong River Delta: Corridor of NH1A (Khanh-Hoa – HCMC), NH20 – NH1A, NH13 and NH14 – NH1, NH51 – NH1, NH1A (Ca-Mau – HCMC) to Sai-Gonport complex; and
n The South East Region: NH13 – NH1A, NH1A to Tan-Son-Nhat and Long-Thanh airport.
9
POLICY IMPLICATIONS FOR VIETNAM’S ECONOMIC GROWTH

10
TRADE FACILITATION, VALUE CREATION, AND COMPETITIVENESS
Figure 1.8: Garment and Textile Transportation Flows for Export-Import by 2020
Source: Freight flows data provided by TDSI.
SHARE OF EXPORT VALUE BY TRANSPORT MODE
0% 20% 40% 60% 80% 100%
Export
Import
Seaport Airport
HCM City
Ha-Noi
Hai-Phong
Da-Nang
Quy Nhon
Vung-Tau Sai-Gon
LAO PDR
CAMBODIA
CHINA
EXPORT VALUE BY PROVINCE
EXPORT FLOWS
1,000 Mill.USD
2,000 Mill.USD
4,000 Mill.USD6,000 Mill.USD>8,000 Mill.USD
50,000 TEUs100,000 TEUs 150,000 TEUsInternational Gateway (primary)
International Gateway (secondary)

1.4 Development Strategies
Broadly speaking, by 2020 exported flows of apparels will be changed by the fact that factories in Ha-noiand HCMC will move to neighboring provinces. The development of port groups in the Central region andthe promotion of Vung-Tau container transshipment port will reduce the concentration on two major exportcenters: Noi-Bai airport and Hai-Phong port in the North region and the export center in HCMC. Theexpected operation of Long-Thanh airport – Dong-Nai will attract exported and imported flows in HCMC tothis area. With the expressway network as envisioned in the master plan, domestic road transport isexpected to meet the demand of transport flows.
While Vietnam has been successful in increasing its market share in the global apparel trade, it has done soby increasing the volume of lower-value garments. In the process, it has reduced the value addition thatcould otherwise have been attained. While this strategy has been successful in the past, it will facedifficulties in the future as the labor costs rise and Bangladesh and other low-wage countries gain acompetitive advantage. There will also be continuing competition from China, which has an advantage interms of scale and efficiency. A more sustainable path would be to move into the production of higher-value goods. Since Vietnam’s garment industry is relatively diverse, with different business models andmarkets, any move towards higher value garments will be incremental and gradual.
There are different approaches to increasing garment value, five of which are discussed in the box below.There are firms in Vietnam’s apparel industry that are applying each of these approaches and it is expectedthat development along the different paths will continue. A significant portion of the industry will continueto function at the low-end of the market but will gradually be crowded out by manufacturers in low-wagecountries. Therefore, the objective should be to accelerate this transition.
Box 1.1: Paths to High Value Garments
There are several paths that can be followed to increase the unit value of garments. The first involves moving up thefashion pyramid, a path followed by Italy, France and more recently Japan. Another path is to produce thosecomponents of the textile and apparel industry that offer the highest value addition. A third path is to focus on nichemarkets that require higher value inputs and more sophisticated production procedures, a path followed successfullyby Sri Lanka but not so by Nepal. A fourth path, which has been followed by Turkey, is to provide additional services,such as design, input sourcing and marketing. A final path is to move into markets that offer higher prices in exchangefor shorter delivery times and greater flexibility. For example, mass-market retailers in the USA buy large orders ofrelatively uniform products and are more concerned about price than quality and lead-time. In contrast, EU retailersplace smaller orders with greater variety in terms of quality and design content. As a result, lead times and flexibilityare usually more important than price. Japanese retailers have similar requirements.
Source: Authors.
To increase the value added of the garment industry in Vietnam it is necessary to develop a consensus onthe future development of the industry, especially among local factory owners. This vision should includeincreasing not only the value of the garments but also the value addition taking place in Vietnam, forexample, through greater participation in procurement of inputs and design of products. This vision shouldaddress the major changes not only in products and markets but also in order cycles and business models.An example is presented in Table 1.4.
11
POLICY IMPLICATIONS FOR VIETNAM’S ECONOMIC GROWTH

Table 1.4: Potential Elements of a Vision for the Garment Industry
Higher value, limited fashion content, requiring skilled labor (e.g., men’s suits, athleticwear, women’s undergarments, children’s clothes)
National Markets Greater presence in regional markets, reduce presence in mass-market garments
Direct sales to up-market retail that is expanding in the area (e.g., Uniqlo, Esprit, Forever21, H&M, Zara)
Inputs Imported fabrics with local finishing
Order Cycles 2-3 months from order confirmation to overseas delivery
OEM and OBM, sourcing inputs with mix of FOB and Cost & Freight (C&F) deliveries
It is assumed that the target audience for this vision is domestic factory owners and foreign-owned contractmanufacturers. The long-term goal is to increase the proportion of these enterprises that apply the ODMand OBM business models. Some have already made the transition, but it is difficult since it requires arestructuring of supply chains to develop new sources of inputs and diversify the distribution channels. Thesituation is different for vendor factories. They operate under the direction of their foreign owners whomanage their logistics and arrange for procurement of inputs and sale of outputs. They will benefit fromany improvements in logistics, but are unlikely to change their current business model or market.
The movement to higher value products requires similar changes in supply chains. More efficientinbound supply chains are required to reduce order cycles and a greater variety of inbound and outboundsupply chains are required to handle smaller order sizes and specialized shipments. This implies a broaderselection of more reliable and efficient transport services in the principal trade corridors and simpler andfaster clearance procedures for imported inputs and exported products. It would require planninginvestments for the trade corridor serving the urban area to improve overall performance on the majortrade, beginning with the completion of the access road to Cai-Mep ports. It also requires simplerprocedures for temporary admission and expedited testing procedures through the use of private certifiedlaboratories and risk analysis.
Additional efforts would include backwards integration of the inbound supply chains through developmentof textile and apparel clusters. For the private sector, these clusters would provide the opportunity to utilizeboth economies of scale and scope. For the government, they would simplify the provision of utilities (e.g.,reliable power and water), and logistics infrastructure to the industry. Government could also improve andexpand the bilateral and regional trade agreements to reduce barriers to other countries’ markets; this wouldobviously help the development of the garment export industry. Finally, it could provide support for trainingin basic production skills, supply chain management and product development to improve the level ofhuman capital in the apparel sector.
1.5 Strategy Implementation
Efforts to develop this vision would require a marketing study to identify opportunities in terms of products,markets and distribution channels. This would be conducted jointly by the government and the privatesector. The study should also review opportunities for implementing modern design techniques that applyup-to-date technology in order to keep up with current trends.
Source: Authors.
12
TRADE FACILITATION, VALUE CREATION, AND COMPETITIVENESS
Product Niches
Distribution Channels
Business Models

Diversification of the outbound supply chains may be more challenging. The more entrepreneurialmanufacturers have already begun this process, but the majority continues to give priority to increasing thevolume moving through the existing distribution channels. Also, most manufacturers focus on a specificregion, be it the USA, EU or East Asia. With the improvement in the container ports around HCMC, it isaccepted that there will be significant improvement in connectivity providing faster access to more markets.
Another opportunity currently being pursued is upgrading the quality of domestic production of textilesand accessories. This is expected to occur as a natural expansion of business activity and will increase thevalue added provided by Vietnam. Since Vietnam does not produce a significant quantity of natural fibersand lacks experience in the production of woven fabrics, the principal growth will be in knitted fabrics madefrom synthetic fibers and blends. The garment factories producing for export will likely continue to importhigher quality fabric in order to meet the requirements of different buyers. This lack of backward integrationdoes not necessarily reduce Vietnam’s competitive advantage. In fact, the modern trend has been towardsseparation of textile and garment production as shown in Figure 1.9.
The production of higher value goods will increase the amount of working capital required per unit ofproduction but this will be offset by a reduction in order cycles and therefore the cash-to-cash cycle. Sofar, the factories do not appear to have difficulty obtaining trade finance primarily through their foreignowners; however, for local manufacturers to compete effectively they will require access to foreign exchangeat interest rates that are comparable to that available to competitors.
The industry has begun to introduce modern IT systems with increased use of programs for client managementand inventory control. However, the transition to Enterprise Resource Planning (ERP) systems, which are usedto manage the activities and transactions linking suppliers, manufacturers and buyers, has yet to occur.
13
POLICY IMPLICATIONS FOR VIETNAM’S ECONOMIC GROWTH
Figure 1.9: The Process of Backwards Integration
Source: Gary Gereffi, “The Global Economy: Organization, Governance, and Development,” in Neil J. SmelserandRichard Swedberg, The Handbook of Economic Sociology, 2nd ed. (Princeton University Press, 2005), p. 172.
Hong Kong SAR (China)
Taiwan (China)

14
TRADE FACILITATION, VALUE CREATION, AND COMPETITIVENESS

2.1 Introduction
Footwear is one of Vietnam’s most important export categories accounting for 7 percent of export earningsin 2011. Exports are concentrated on sports shoes, canvas shoes, fashion shoes, and sandals. Vietnam isthe third largest exporter of footwear, after China and Italy, with 7.4 percent of global trade. 6
2.2 Production and Trade
Footwear exports have grown rapidly in value over the last 10 years to more than US$7 billion in 2011 (Figure2.1). Vietnam exports about 80 percent of its footwear production. These exports range from low-valueplastic footwear (including sandals) to high-value athletic shoes manufactured for international brands (e.g.,Nike, Reebok and Adidas). While the global average value per pair exported was US$6.50 in 2010, Vietnam’sunit value was almost US$7.50. 7
15
CHAPTER 2
FOOTWEAR
6 International Trade Center (ITC).7 The previous year the average value per pair for the world was about US$6.5 versus about US$3.3 in China, US$12.5 in India, and
about US$24 for Italy.

Ten years ago, textile shoes generated the most value for Vietnamese footwear exporters. Over the last decade,however, leather, rubber and plastic shoes have become more important. The production of plastic shoes ismore capital-intensive, especially when injection molding is involved. In contrast, leather shoes are more laborintensive because they are hand-assembled and stitched using semi-automatic machines (Figure 2.2).
16
TRADE FACILITATION, VALUE CREATION, AND COMPETITIVENESS
Figure 2.1: Vietnam Footwear Exports, 2001-2011
Source: UN Comtrade and Vietnam Customs.
Figure 2.2: Vietnam Footwear Exports by Type, 2002-2011
Source: UN Comtrade and ITC.
Mill
ion
US$
Footwear exports Annual growth
Shar
e of
Exp
ort i
n To
tal P
rodu
ctio
n
7,000
2001
70%
60%
50%
40%
30%
20%
10%
00%
-10%
-20%2002 2003 2004 2005 2006 2007 2008 2009 2010 2011
6,000
5,000
4,000
3,000
2,000
1,0000
-1,000
-2,000

Vietnam’s major footwear export markets are the EU and the United States, which collectively account formore than 70 percent of exports (Figure 2.3). Within the EU, it is the richer countries such as the UK, Germanyand the Netherlands which are Vietnam’s primary markets. The imposition by the EU of ‘anti-dumping’ tariffson footwear in 2006 did little to slow the growth of exports to the EU. The impact of the elimination ofthese tariffs in early 2011 is not yet clear.
The cost of material is about 80 percent of the ex-works8 cost of the footwear. Vietnam produces little ofthe necessary inputs for footwear manufacturing; therefore, about 70 percent of this cost goes towardsimported inputs. Vietnam has limited capacity for the production of leather, and most domestic leather issuitable only for production of low-value shoes. As a result, nearly all leather products are imported,primarily as pretreated leather.9 The same situation applies to canvas since domestic production does notprovide consistent dyeing quality. For plastic shoes, plastic resins and sheets must be imported because ofa lack of manufacturing capacity and quality. Because these are generic and imported mostly from theregion, delivery times are generally short. A large portion of these inputs are ordered by the foreign-ownedfactories from suppliers with whom they have established relationships.
Vietnam’s principal competitors are located in the region. China produces around 35 percent of globalfootwear exports, but most of this is low quality despite investments in advanced technology intended tooffset increasing labor costs. Elsewhere in the region, India focuses on mid value footwear while Indonesiaand Bangladesh produce low-to-mid value products. However, both expect to move up to higher-valueexports in the future. The manufacturing of high-value footwear continues to be concentrated in Europewith Italy, Germany, Belgium and the Netherlands responsible for more than 20 percent of world trade.
According to the government’s Footwear Industry Development Master Plan to 2020, footwear exports areforecast to grow 7 percent annually for 2011-2015, before growth rises to 8 percent for 2016-2020.Considering annual growth has averaged around 15 percent over the last decade, such forecasts appearconservative. In 2011, the first year for which 7 percent growth was forecast, exports expanded 27 percent.
17
POLICY IMPLICATIONS FOR VIETNAM’S ECONOMIC GROWTH
Figure 2.3: Vietnam Footwear Exports by Destination, 2010
8 Ex-works in this context refers to the non-transport costs of the good.9 China has a similar issue. Nearly 80 percent of the leather used for manufacturing is imported from various countries.
Source: UN Comtrade.
,
,
,
,
,
,

2.3 Structure of the Footwear Industry
It is estimated that there are around 700 footwear factories in Vietnam with each factory producing betweena few thousand and 10,000 pairs of shoes per day. Broadly speaking, there are four types of firms operatingin the Vietnamese footwear industry.
The first type is vendor factories which make up 45 percent of footwear factories. These are foreign ownedsubsidiaries of international firms. The international firms specify the design and arrange for the delivery ofinputs and manage the sale and distribution of the produced footwear.10
The second is locally owned original equipment manufacturers (OEMs), which produce goods under contractfor, and designed by, international footwear companies. OEMs make up around 40 percent of the industry.Approximately half of OEMs receive all required inputs from the company they are producing for, while theother half participates in the procurement of inputs. For the latter group, the buyers often providespecifications and a list of approved suppliers. Footwear produced by OEMs is usually sold to the buyer onan FOB basis with a nominated forwarder arranging international logistics.
The third type of firm is the original design manufacturers (ODMs), which produce products based on theirown generic designs, procure their own inputs and sell the finished footwear to traders as unbrandedproducts. These traders will often brand the shoes before selling them. ODMs are locally owned andaccount for 10 percent of footwear factories in Vietnam.
Finally, original brand manufacturers (OBMs) account for 5 percent of the industry, and produce footwearfrom their own designs under their own brands. Such footwear is sold in Vietnam and exported to someemerging economies.
The smaller domestic factories often sell to buying agents who, in turn, sell to wholesalers. The buyingagents provide contacts and negotiate with wholesalers/retailers. They also inspect the finished goods andensure delivery. Larger domestic factories sell not only to international buying agents but also to foreignwholesalers or brand manufacturers who then sell the finished goods directly to the retailers. Most of theexports are sold on FOB terms with the buyer’s nominated forwarder arranging the shipment. Figure 2.4shows the supply chain participants.
The foreign-owned firms have access to finance through their parent companies, while local producers aredependent on local banks for a significant portion of their investment and working capital. Working capitalis especially important since imported inputs account for a substantial portion of the value of the footwearand the cash-to-cash cycle varies from four to six months. The high proportion of inputs in the final priceslimits foreign exchange risk, since both inputs and products are priced in US dollars, Euros, or otherbenchmark currencies.
The major inputs are obtained from the region and the suppliers organize most of the logistics, so there arefew difficulties with delivery times. Instead, problems arise with the quality and consistency of inputs fordomestic factories which lack the buying power of larger foreign factories. These lead to low rates of orderfulfillment that lead to delays in production and missed export shipment dates. In order to obtain theamount and quality of inputs required, some firms rely on domestic wholesalers to maintain an inventoryof imported inputs. However, this adds to the cost and, more importantly, limits the selection of materialsavailable.
18
TRADE FACILITATION, VALUE CREATION, AND COMPETITIVENESS
10 Under some international firms’ Corporate Social Responsibility (CSR) requirements, wholesalers/retailers are increasingly likely toperform social audits of the factories.

19
POLICY IMPLICATIONS FOR VIETNAM’S ECONOMIC GROWTH
Figure 2.4: Primary Participants in Footwear Supply Chain
Source: TTFA Survey and Authors.
The footwear market can be divided into sub-markets with different requirements in terms of quality, costand time. The basic division is based on quality. High value footwear includes men’s leather shoes, women’sshoes and internationally-branded athletic shoes. These require high quality inputs and production thatprovides good fit and finish. Design is also an important source of value-added for athletic shoes andwomen’s shoes. Good quality control extends throughout the whole supply chain, from sourcing of inputsthrough to delivery to the buyer. The ex works value of such footwear is well above US$10 a pair. Thebuyers are larger brand manufacturers or high-end retailers. The principal markets are Europe and NorthAmerica, although there is growing demand in middle income countries. The logistics used for this segmentemphasize high reliability both inbound and outbound and relatively short delivery times. For the inboundsupply chain, consistency in the quality of inputs is critical whereas for outbound supply chains, it isimportant to deliver consignments with many different models and styles with fixed delivery dates.
Mid-value products cover five basic types of shoes: men’s, women’s, kids’ and athletic shoes, and specialtyfootwear produced from textiles, plastics (including synthetic leather) and rubber. The inputs are mid-valuebut consistent in quality. The designs are variations on standard designs. The level of automation varieswith product type and scale. The buyers are wholesalers and large retail chains. The logistics are simplerthan for high-value footwear since it is easier to manage the inventory of inputs and the size of exportconsignments is larger with fewer models. The resulting supply chains strike a compromise between costand reliability.
Low-value footwear includes simple shoes and sandals produced from synthetic material. These use lessexpensive inputs and are less durable. The designs are standard, the production is more automated, andthe order sizes are larger. The average value ex-works is in the range of US$2-4 per pair. The buyers areprimarily wholesalers who sell to low-end retailers. These products are in demand both in the domesticmarket and throughput the world. The logistics emphasize low cost and large volumes. For inboundlogistics, the priority is to insure timely delivery to support a lean production schedule. For outboundlogistics, the requirement is to ship large consignments of relatively few models but a full range of sizes andcolors at low cost with moderate delivery times.

20
TRADE FACILITATION, VALUE CREATION, AND COMPETITIVENESS
2.3.1 Transportation
Figure 2.5 shows the density of footwear production and flows of footwear export, including the nature ofdomestic linkages and international gateways used, and transport modes. Footwear industry productionis located in four key regions: the South East region (the largest production area, 79 percent), the Red RiverDelta region (10 percent), the North Central and Central Coastal region (6 percent) and the Mekong Deltaregion (5 percent). 77 percent of footwear exports came from the South East and the Mekong Delta region(factories are located primarily in HCMC, Binh-Duong and Dong-Nai) and 20 percent from the Red RiverDelta (located primarily in Hai-Phong, Ha-Noi, Hai-Duong, Quang-Ninh and Hung-Yen), while only 3 percentcame from the North Central and Central Coastal region.
Footwear products are containerized in the areas of production and typically put into 20-foot containers(containing approximately 4,000 pairs of sport shoes and 10,000 to 15,000 pairs of sandals), transportedmainly by road and shipped by sea. Of the total value of footwear exports, 92 percent is shipped by sea,and only 5 percent and 3 percent, respectively, by air and road transport. The main international gatewaysinclude HCMC port complex (73 percent), Hai-Phong port (19 percent), Tan-Son-Nhat airport (4 percent)and Noi-Bai airport (1 percent). Footwear is exported to the Chinese market by road (3 percent) throughLao-Cai and Mong-Cai border gates.
Currently, in Vietnam's footwear industry, 60 percent of raw materials are imported, mainly from Asiancountries, to make the end-product. Vietnam Customs statistics for 2010 show that 35 percent of totalimports are from China, 21 percent from Korea, 16 percent from Taiwan (China), 9 percent Japan, 5 percentand 3 percent from Hong Kong SAR (China) and Thailand, respectively, and 11 percent from other. Rawmaterials are largely imported by sea (92 percent), 7 percent by air, and only 1 percent by road. Importsprimarily come through the HCMC port complex (59 percent), Hai-Phong port (32 percent), Tan-Son-Nhatairport (5 percent), and Noi-Bai airport and Gia-Lam airport (2 percent).

21
POLICY IMPLICATIONS FOR VIETNAM’S ECONOMIC GROWTH
Figure 2.5: Footwear Production and Export Flows, 2010
Source: Freight flows data provided by TDSI.
SHARE OF EXPORT VALUE BY TRANSPORT MODE
0% 20% 40% 60% 80% 100%
Export
Import
Airport Border gate Seaport
50%
��������
���� 2000 TEUs
EXPORT VOLUME
100 MIL . USD
200 MIL . USD
300 MIL . USD
400 MIL . USD
>500 MIL . USD
EXPORT FLOWS10,000 TEUs
50,000 TEUs
100,000 TEUs
EXPORT VALUE BY PROVINCE
EXPORT VOLUME BY AIR
EU 71%
USA 17%
Others 12%
EXPORT VOLUME BY AIR
EU45%
USA39%
Other16%EXPORT VOLUME BY SEA
EU37%
USA30%
Other33%
EXPORT VOLUME BY SEA
EU50%
USA19%
Mexico9%
Other22%
HCM City
Ha-Noi
LAO PDR
CAMBODIA
Hai-Phong
Da-Nang
Quy Nhon
Vung-Tau Sai-Gon

Table 2.1 shows the main domestic transport routes. NH5, the main connection to the Hai-Phong port,currently suffers from too high traffic volume. Coupled with passing through many densely populatedareas, vehicle speeds are limited and serious accidents often occur. A traffic survey on this highway in 2010showed that the traffic volume through Hai-Duong station (km58+700) was 54,000 PCU/ per day, with thenumber of heavy trucks of three axles or more at nearly 6,000 vehicles per day when the capacity of theroad is only 30,000 CPU/day.
The Dong-Nai – HCMC section of NH1A also has high traffic volume. Survey data from 2011 showed thattraffic volume exceeded 150,000 PCUs per day, comprised of more than 20,000 heavy three-axle and moretrucks. The section from Can-Tho to HCMC had a high traffic volume of 56,700 PCUs per day. Inner roadsconnecting to ports in HCMC, including Nguyen-Van-Linh – through Phu-My bridge and Ha-Noi highway –Nguyen-Thi-Dinh road experience frequent serious congestion, increasing the time required to transportgoods to the ports.
Transport costs in the North to Hai-Phong port range from US$1.5 - 2 per TEU per km. The cost of cargodischarge at the port is US$30 per TEU. Container transport time from Ha-Noi to Hai-Phong is 3 - 4 hours.In the South, transport costs are about US$1.3 - 2 per TEU per km, with discharge costs at ports being aboutUS$27 per TEU. Footwear export companies often hire forwarding companies to take freight to ports andcomplete customs procedures. Customs declaration procedures for an export footwear batch can takeanywhere from about half a day to three days. The cost a company pays to a forwarding company is US$280- 340 per 20-foot container and US$330 - 440 per 40-foot container.
According to transport companies, overloading vehicles is quite popular because domestic transport costswould be very high if trucks carried their standard volume, resulting in higher product prices. Currently,the transport fee collection is unreasonable in some places because there are too many toll collectionstations on many important roads. For example, from HCMC to Binh-Duong, Binh-Phuoc, three tollcollection stations are located along the 100-km segment of road. In particular, some stations are locatednear other stations, such as in the 16-km segment from Suoi-Giua station (Thu-Dau-Mot town) to Vinh-Phustation (Lai-Thieu town), and in the 8-km segment from Vinh-Phu station to Binh-Trieu station. The fee-over-fee situation currently covers the Southern key economic region where freight traffic density is thehighest in Vietnam.
According to Vietnam Freight Forwarders Association (VIFFAS), transport companies are heavily influencedby the recent increase in fuel prices. Difficulties will increase if the road utilization fee is applied in the nearfuture. Transport companies must increase their cost to compensate for the fee, resulting in higherproduction and business costs for the economy. Thus, Vietnam’s products will be less competitive on theworld’s market. The main export markets for footwear are the EU (45 percent), the USA (25 percent), Japan(3 percent) and Mexico (3 percent). International export shipping routes include:
22
TRADE FACILITATION, VALUE CREATION, AND COMPETITIVENESS
Table 2.1: Main Domestic Transport Routes
Source: Corridor Analysis, TDSI 2012.
Road
NH5
NH18
NH10
NH1
NH13
NH22
Section
Ha-Noi – Hai-Phong
Ha-Noi – Quang-Ninh
Quang-Ninh – Thanh-Hoa
Thanh-Hoa – Can-Tho
HCMC – Binh-Phuoc
HCMC – Tay-Ninh
Length (km)
106
303
228
1745
142
58

n By sea from Hai-Phong and the HCMC port complex, transshipment via Singapore to Europe; and throughEuropean waters to the United States’ East Coast;
n By sea from Hai-Phong and the HCMC port complex, transshipment via Hong Kong SAR (China)/Japanto the United States’s West Coast; and
n By air from Noi-Bai airport to Italy, the United States, UK, Germany and Spain and from Tan-Son-Nhatairport to the United States, Spain, UK, France, Germany, Netherlands, Italy, Japan and other countries.
International sea transport costs depend on the routes and the ship tonnage. It costs between 2200-2500US$ per TEU from HCMC ports to the United States is, 1500-2500 US$ per TEU to Europe, 900-1200 US$ perTEU to Korea, Japan. Under normal conditions, transportation time is about 30-40 days to the United States,25-35 days to Germany, and about 7-10 days to Japan.
Since the beginning of 2012, almost every month, imported and exported companies have received noticesof increased fees and charges from shipping firms. Increased fees of 400 US$ per 20-foot container mustbe paid on the goods transiting from Vietnam to Europe and the United States. For destinations in Asia,the shipping firms have increased the Terminal Handling Charge (THC) and fuel surcharge 8 percent, onaverage. Sea transport costs have generally almost doubled since the beginning of 2012. With theseincreased transport costs, higher product sale prices have been inevitable. In particular, the increase in seatransport costs has had considerable influence on the contracts signed before the cost increases.
2.3.2 Forecast of Footwear Export
According to Vietnam’s 2020 Footwear Industry Development Master Plan (Decision No.6209/QD-BCT dated25th November 2010) and planning guidance to 2025, the development strategy focuses on productionand investments in four major regions, namely:
n Red River Delta Region. Ha-Noi will serve as the center for services, supply of materials, technologies,fashion samples, high-value footwear, bag production factories of a suitable scale, and trade promotioncenters. Outsourcing factories will be developed or relocated to provinces such as Hai-Duong, Bac-Ninh,neighboring areas of Hai-Phong city, Pho-Noi (Hung-Yen), Dong-Van (Ha-Nam), Nam-Dinh, Ha-Noi, Phu-Tho, and Vinh-Phuc.
n South East Region. HCMC will serve as the center for services, supply of materials, technologies, fashionsamples, high-value footwear, bag production factories of a suitable scale, and trade promotion centers.Small industrial zones and traditional craft villages will be built near the city. Leather factories in thecenter and near the city will be relocated to areas away from the city and densely populated areas.Footwear and bag production factories will be developed or moved to provinces such as Binh-Duong,Dong-Nai and Tay-Ninh.
n Northern Central and Coastal Region. Da-Nang will serve as the production center of footwear and bagoutsourcing. Factories manufacturing footwear uppers, footwear, bags and products from crocodile andostrich leather will be developed in provinces such as Binh-Dinh, Da-Nang, Quang-Nam, and Khanh-Hoa.
n Mekong Delta Region. Can-Tho will serve as the center. The Master Plan encourages enterprises to expandfootwear outsourcing and production and to establish factories in regions with available workers in order
23
POLICY IMPLICATIONS FOR VIETNAM’S ECONOMIC GROWTH

to support economic restructuring. Enterprises are also expected to focus on developing leather,footwear, bags made from crocodile and python leather. That this region has developed as the largestproducer of leather material has given it a competitive advantage.
Currently, sports and canvas shoes are the main items produced and exported, with a future focus onexporting fashionable and high-quality footwear products for new markets and advanced markets. Inrecent years, markets for footwear exports have been developed in countries with large purchasing powersuch as the United States, the EU, Canada, Japan, Hong Kong SAR (China), Korea, and Australia. In addition,Vietnam is exporting footwear to markets with smaller purchasing demands but which accept a volume ofgoods in line with Vietnam’s enterprises’ production capacities. These markets include Indonesia, Malaysia,the Middle East, Africa, South Asia, Russia and the old Eastern Europe countries, etc.
For imports, by 2015 the import substitution rate is expected to be 60-65 percent, and by 2020 to be 75-80percent with more emphasis on local designs and development of domestic industry. According to theVietnam Leather and Footwear Association, these figures are achievable due to estimates that current rawmaterial imports account for 45 percent of the total value of materials used for manufacturing handbagsand shoes. By 2020, imports of fabrics and materials for producing shoes are estimated to reach US$4,800million. Current suppliers of imported raw materials for footwear production are mainly Asian countries(e.g., China, Korea, Taiwan (China), Hong Kong SAR (China), Japan, etc.).
By 2020, depending on the development progress of major production regions, the production focus isexpected to shift due to the relocation of factories from Ha-Noi and HCMC to neighboring provinces. By2020 planned infrastructure development will also change traffic routes for footwear exports and rawmaterial imports.
Based on the 2020 Expressway Network Master Plan, domestic routes are expected to meet the demandfor efficient and effective transport. The development of ports in the Central region by 2020 is expectedto attract freight from the North Central and Central Coastal region for export through the Da-Nang port.In addition, through the development of the Vung-Tau container transshipment port, freight from theSouth East region will be exported through Vung-Tau instead of through ports in HCMC, reducing thehigh volume concentration on the largest exporting center in the country. Long-Thanh airport in Dong-Nai is expected to begin operating in 2020, attracting import-export traffic from Tan-Son-Nhat airport tothe area (Figure 2.6).
24
TRADE FACILITATION, VALUE CREATION, AND COMPETITIVENESS

HCM City
Ha-Noi
Lao-Cai
Mong-Cai
Hai-Phong
Vung-Tau Sai-Gon
Cai-Lan
Da-Nang LAO PDR
CAMBODIA
CHINA
1,000 Mill.USD
2,000 Mill.USD3,000 Mill.USD4,000 Mill.USD>5,000 Mill.USD
20,000 TEUs
40,000 TEUs
60,000 TEUs
International Gateway (primary)
International Gateway (secondary)
EXPORT FLOWS
EXPORT VALUE BY PROVINCE
Figure 2.6: Export Footwear Movement Flows by 2020
Source: Freight flows data provided by TDSI.
25
POLICY IMPLICATIONS FOR VIETNAM’S ECONOMIC GROWTH
2.4 Development Strategies
In setting objectives for future growth, the government’s ability to influence the policies of footwear parentcompanies is limited, but efforts can be made to encourage greater value addition within Vietnam. Fordomestic companies, the objective is clear: to increase the value of finished goods. This is necessary becausecompetition from lower-wage countries will limit future growth opportunities in mature markets. Moreimportantly, Vietnam has a comparative advantage in terms of skilled labor for producing, in large quantities,leather footwear and other finished goods that meet the standards of international brands.
In order to achieve the objective of increasing the value of finished goods, the domestic industry shouldfocus on mid-to-high value products, specifically men’s and woman’s dress shoes and athletic shoes thathave leather components. In order to do this, it will be necessary to strengthen inbound supply chains forprocurement of imported leather while increasing the quality and capacity of local leather production. Forproduction, it will be necessary to provide additional skilled labor and upgrade production equipment. Forthe outbound supply chains, it will be necessary to diversify into new markets, including in the region, andto increase the proportion of finished goods shipped direct to distributors and retailers.
This strategy should include developing the image of Vietnam as a supplier of quality products. This doesnot require creating brands, as this would entail a significant investment in marketing and distributionnetworks. It also does not require a significant reduction in order cycles or improvement in inventorymanagement. However, the improvement in connectivity associated with ongoing port developments willreduce delivery times for both inputs and exports, which currently account for a majority of the order cycle.
2.5 Strategy Implementation
Implementation of this strategy would build on the current trends among larger domestic factories toimprove product quality and attract business from brand manufacturers. It would also require continuedgrowth in the number of ODM/OBM firms, simplification of distribution channels, and an increase in thenumber of in house designed products.
The primary beneficiaries of this strategy would be domestic factories but it would also benefit foreign-owned factories. The strategy would focus on increasing the capacity to manufacture and export mid-to-high value leather goods but does not preclude continued growth in the low end of the market. However,the latter is likely to experience greater competition in the future.
Continued government support for FDI in the sector is important, as international investment assistsdomestic producers to access global markets and new technology. FDI has other positive externalities suchincreasing awareness of market trends and international standards, improving management skills andcreating demand for local inputs. International investment can also provide economies of scale and scopein procurement of inputs that developing markets such as Vietnam cannot generate on their own.
Four specific initiatives involving public-private participation have been identified. These are not newin the sense that they have been discussed in the past and are similar to recommendations made inother countries. However, they would be implemented within the context of objectives and strategiesdiscussed above.
Efforts to move into higher-value products should be informed by a marketing study that identifies potentialmarkets and distribution channels, and examines the requirements of these markets in terms of productquality and logistics performance. While individual firms already collect this type of data, a larger-scaleeffort is needed to refine an industry-wide strategy.
26
TRADE FACILITATION, VALUE CREATION, AND COMPETITIVENESS

Two initiatives to improve the supply of inputs can be undertaken. The first is investment in domesticproduction of inputs where there is potential for competitive advantage. This would include efforts toincrease the production of leather and textiles and the development of networks for supply of intermediategoods. For these, the constraint is not so much capital for investment as it is the development of effectivesupply chains between the factories and the sources. For leather this requires upgrading the collection ofhides and skins, and the tanning and treatment of the leather. For canvas, it means improving the qualityof yarn used in production.
A parallel initiative would be development of production clusters.11 Clustering production is a commonmechanism for overcoming the fragmented nature of the leather and leather products industry andconsolidating procurement and marketing activities. Some of this clustering may be infrastructure-based(e.g., industrial zones that include capacity for tanning and treatment of leather, which requires effluenttreatment plants and warehousing). Clustering can also be transaction-based, with companies collaboratingon procurement of inputs and equipment, promotion of products, integration supplier networks,outsourcing production to fill large orders, and monitoring supply chain performance.
The final initiative is to improve access to finance. There is a need to increase investment in equipment inorder to produce higher-value products but equally important is the provision of working capital becauseof the long cash-to-cash cycles and the high proportion of the cost of finished goods accounted for byinputs. Since foreign-owned firms can access global financing, it is necessary to provide comparablefinancing opportunities for domestic firms. This may be in the form of factoring of Letters of Credit or greaterlatitude in the use of foreign exchange earnings.
27
POLICY IMPLICATIONS FOR VIETNAM’S ECONOMIC GROWTH
11 The footwear products include numerous intermediate products, e.g. uppers, lasts, outsole, mid-sole, insole, heel, lining, which leadto a division of labor and production activities.

28
TRADE FACILITATION, VALUE CREATION, AND COMPETITIVENESS

3.1 Introduction
In recent years, the electronics and electrical equipment sector has become an important export industryin Vietnam. While Vietnam’s share of global exports is below 1 percent, the sector’s rapid growth hasprovided some evidence that Vietnam is moving up the manufacturing value chain.
3.2 Production and Trade
Vietnam’s electronic industry has seen impressive growth in recent years as a result of liberalization andsignificant foreign investment. In the period 2002-2008 export growth averaged 35 percent annually, albeitfrom a low basis. Growth slowed significantly in 2009 due to the global recession, but increased sharply in2010 and 2011 thanks to large factories coming online. Although Vietnam’s electronics exports have grownmore rapidly than global electronics exports, they still represent a very small fraction of global output.
While a wide range of products are produced in the electronics industry in Vietnam, volumes remainrelatively low and the entry of a new manufacturer can drastically modify the export share of differentproduct groups (Figure 3.1). In the period 2002-2009 wires/cables, computers and printers were the mostvaluable export groups -- the latter in part due to Canon manufacturing facilities. With the establishmentof a large Samsung plant in 2009, by 2010 the largest electronics export group was cell phones. Recently,motors and generators have increased their share of electronics exports with the production of nano-motorsand integrated circuits at a new Intel factory.
29
CHAPTER 3
ELECTRONICS ANDELECTRICAL EQUIPMENT

In 2009, the last year for which complete data is available, Japan was the leading destination for Vietnam’selectronics, with the United States ranked second. The products shipped to these countries includeassembled equipment such as printers and photocopiers and components such as circuit boards andautomotive electronic apparatuses. Vietnam Customs data for 2010 indicates that China became thenumber one destination for Vietnam’s electronics exports, while the proportion of exports going to Japandropped significantly.
Electronic exports from Vietnam often fit into complex global supply chains, where they are components ofmore complex electronics that are finally assembled in other countries. Vietnamese exports of this kind arenormally sold within Asia to markets like China, ASEAN, Korea, Hong Kong SAR (China) and India. It isestimated that 90-95 percent of the inputs for Vietnam’s electronics exports are imported. China is the mainsource of these inputs followed by Japan and Korea. Most of the local inputs are either packaging for themanufactured electronics or basic electrical equipment parts.
30
TRADE FACILITATION, VALUE CREATION, AND COMPETITIVENESS
Figure 3.1: Vietnam Electronic Exports, by Types, 2002-2011
Source: UN Comtrade and ITC.
Figure 3.2: Vietnam Electronic Export Markets, 2000-2010
Source: UN Comtrade.

Among emerging economies with electronics industries, India has an advantage in terms of the skilledworkers available to perform design work. China is attempting to emulate this through substantialinvestment in research and development and education, which is expected to double as a percentage ofGDP over the period 2006-2020.
Of the approximately 350 enterprises producing electronics in Vietnam, only 30 percent involve FDI. TheFDI businesses account for over 95 percent of the industry’s output value. More than 50 percent of outputis produced by fewer than 3 percent of electronics firms. Despite this high level of concentration, there arefew barriers to entry and it is expected that competition among exporters will increase over time.
Most of the FDI is from Japan and Korea, and involves leading brands such as Samsung, Canon, and Fujitsu,as well as suppliers like Intel, Compal and Foxconn. The size of investments has been increasing in the lastfew years, with Samsung investing over US$1 billion, Compal about US$500 million and Nokia making aninitial investment of about US$200 million. Their plants employ between 5000 and 20,000 workers andproduction typically reaches capacity within a few years of establishment. Nearly all output from theseoperations is exported, although an increasing proportion is sold in the local economy. Large-scaleelectronics plants are usually located in special purpose industrial parks near Ha-Noi and HCMC. Near Ha-Noi, these include Lang – Hoa-Lac High Technology Zone, Sai-Dong Industrial Zone, Quang-Minh IndustrialZone, Thang-Long Industrial Zone and Yen-Phong Industrial Zone. More than 90 percent of electronicsexports are produced in the northern region, around Ha-Noi.
Vietnam’s electrical equipment manufacturing focuses on household appliances and power distributionequipment (for example, insulated wires, transformers and switchgear). Most of the production ofhousehold appliances is focused on the domestic market, but larger manufacturers such as Midea andHitachi also export to the region. There are over 200 foreign-owned, local and joint venture firms involvedin the production of aluminum and copper cable, and insulated wires.
3.3 Structure of the Electronics Industry
The electronics and electrical equipment industry has a tiered structure like most modern manufacturingindustries. At the top is the brand manufacturer or retailer, which distributes the branded products to theconsumer. In the electronics industry, the brand manufacturer is designated as an original equipmentmanufacturer (OEM).12 The second tier is comprised of the contract manufacturers who produce thebranded products. These are either original design manufacturers (ODMs) that design the product to meetthe OEM’s requirements or electronic manufacturing services (EMS) that manufacture according to thedesigns provided by the OEM. The third tier is made up of the producers of components that supply inputsto the contract manufacturers. The fourth tier entities are the producers of the basic materials used toproduce the components. As with other industries, the responsibility for design is distributed throughoutthe value chain (Figure 3.3). Innovations occur early in the value chain and are incorporated into the designsin subsequent stages. The downstream activities are focused on assembling inputs produced at an earlierstage of the value chain.
31
POLICY IMPLICATIONS FOR VIETNAM’S ECONOMIC GROWTH
12 The terminology used in the industry differs slightly from that used in other industries, specifically with reference to the role of theOEMs.

Labor-intensive assembly & limited manufacturing, design to meet OEM performance requirements characteristics from OEM derived demand
Capital-intensive manufacture, innovation in material and processing capability
Manufacturing and assembly innovation in function and performance
Final customization and distribution, market-driven performance specifications
In Vietnam there are firms involved in all tiers of the electronics supply chain; these include Intel, whichproduces semiconductor components; Foxconn and Compal, which function as an EMS and ODM,respectively; and Samsung and Canon, which are OEMs but also do final assembly/customization. Firmsin Vietnam are also involved in the production of household appliances and electrical equipment at allfour levels.
The overseas owners manage both the inbound and outbound supply chains, and inputs are imported fromcompanies that provide components to the owner’s various production facilities. Deliveries are arrangedby the owners using the parent company's distribution network. The factories provide labor and procurelocal packaging material and some physical inputs. The factory has limited contact with suppliers andalmost none with the final buyer. The payments for imported inputs and exports are handled by the parentcompany and the only return to the local factories is the payment for local assembly, which is about 10percent of the product value.
Electrical equipment for power distribution is produced in Vietnam by both foreign and domestic companiesoperating as either contract manufacturers or brand manufacturers. These companies are involved in theprocurement of imported and local inputs and sell the products to construction companies or distributors.The inputs and outputs are shipped on both FOB and C&F terms.
Most electronics factories operate according to a semi-annual or annual production schedule provided by theirheadquarters. The suppliers receive procurement orders six weeks prior to the start of production and deliverthem according to a just-in-time schedule. The finished products are prepared for retail sales with deliveryarranged by the parent companies to regional distributors and through other corporate distribution channels.
Since volumes are determined by orders from the headquarters, the factories focus on reducingmanufacturing costs, maintaining reliability and improving quality control so as to eliminate returns.
The development of the electronics industry in Vietnam has been led by international players. Large brandmanufacturers have moved to Vietnam in order to reduce their production costs, locate nearer to theirmarkets and reduce their dependency on specific countries or suppliers. Initially, electronics factoriesimported and assembled components but once established many major suppliers built factories in Vietnamto simplify their inbound logistics. These suppliers import parts to be assembled into components that arethen delivered to their clients’ factories. It is likely that over time they will increase the amount of locally-produced parts they use. Eventually the brand manufacturers may procure components from localproducers. This phase is just beginning in Vietnam and further development could include both jointventures and diversification by existing domestic manufacturers.
32
TRADE FACILITATION, VALUE CREATION, AND COMPETITIVENESS
Figure 3.3: Relationships of Electronics Supply Chain Activities
Source: TTFA Survey 2012 and Authors.

3.3.1 Transportation
The production of electronics in Vietnam is primarily in the hands of FDI companies with connections toproduct supply and consumption networks worldwide. Electronic exporting enterprises share strategicconnections with other enterprises in their supply chains, based on direction received from their parentcorporation. Supplies and end-products are managed by specialized departments responsible for productsin various markets. A contracted freight-forwarding unit sends its staff to electronic enterprises in the chainto assess production and delivery schedules, ensuring that forwarding services meet the electronicenterprise’s demand. Characterized by small items of high value and specific transportation requirements,electronic products are packaged in cartons that can be stowed into containers for travel by sea.
Figure 3.4 shows that 92.1 percent of the national production of electronic products and relevant spare partsare exported from the North, with 90 percent exported by sea from Hai-Phong port and the remainderexported from Cai-Lan port and by air via Noi-Bai airport. Only 5.7 percent of electronic products and spareparts are exported through HCMC, with 3.4 percent of these exports shipped by air and 2.3 percent by sea.The remaining small percentage is exported by road. Accounting for only 5.7 percent of the total nationalexported electronics volume, the exported electronics value in the South accounts for 37 percent of thetotal exported electronics value due to the exported electronic products and spare parts from factories inDong-Nai, HCMC, Binh-Duong and Binh-Phuoc being small and light weight but of high value.
Twenty-five percent of electronic products and spare parts produced in Vietnam are shipped to Japan, 17percent to the United States, 7 percent to China, 6 percent to Thailand and 6 percent to Singapore.International shipping routes for electronics include: (a) by sea from Hai-Phong, HCMC ports to the UnitedStates; (b) by sea from Hai-Phong, HCMC ports to China, Singapore, Hong Kong SAR (China), Japan and othercountries; (c) by air from Noi-Bai airport to Japan, Hong Kong SAR (China), China; and (d) by air from Tan-Son-Nhat airport to China, Japan, the United States and ASEAN countries. Sea transport from Hai-Phongto Shanghai costs US$270 per TEU. Air transport from Noi-Bai airport to Shanghai costs US$11,000 per TEU.Shipping from HCMC port to Los Angeles (the United States) costs US$2,200 per TEU. From Tan-Son-Nhatairport to Los Angeles, the cost is US$23,100 per TEU.
33
POLICY IMPLICATIONS FOR VIETNAM’S ECONOMIC GROWTH

34
TRADE FACILITATION, VALUE CREATION, AND COMPETITIVENESS
Figure 3.4: Electronics and Electrical Equipment Export Flows, 2010
Source: Freight flows data provided by TDSI.
��������
����
SHARE OF EXPORT VALUE BY TRRANSPORT MODESHARE OF EXPORT VALUE BY TRANSPORT MODESHARE OF EXPORT VALUE BY TRANSPORT MODE
Import
Export
Seaport Airport OtherICD Border gate
0% 20% 60% 100%80%40%
200 TEUs
EXPORT VOLUME
200 MIL.USD
400 MIL.USD
600 MIL.USD
800 MIL.USD
1,000 MIL.USD
1,000 TEUs2,000 TEUs3,000 TEUs
EXPORT FLOWS
EXPORT VALUE BY PROVINCE
EXPORT VOLUME BY AIR 28%, Japan
25% Hong Kong SAR, China
18% China
29% Others
EXPORT VOLUME BY SEA 21%, China
17%, Japan
12%, USA
9%, Thailand
41%, Others
USA21%
China25%
Singapore5%
Netherlands14%
Others35%
EXPORT VOLUME BY SEA
Ha-Noi
EXPORT VOLUME BY AIR 12%, China
12%, Hong KongSAR, China
11%, India
8%, Japan7%
USA
50%, Others
HCM City
CAMBODIA
Hai-Phong
Da-Nang
Quy Nhon
Vung-Tau Sai-Gon

Electronic products and spare parts are transported by inland roads to ports for export. Road transportcosts are between US$1.5-2 per TEU per km, shipment loading costs are US$30 per TEU at ports in the Northand US$27 per TEU at ports in HCMC, with loading shipments on plants costs of about US$300 per TEU.
3.3.2 Forecast for Export of Electronics and Electrical Equipment
Projections indicate that from 2012 to 2015, the export value of electronics will increase, while the value ofimports will decrease. From 2016 to 2020 it is projected that export and import values will be equal, withsurplus value in the electronics industry due to:
n Enterprises producing exported goods will increasingly utilize partnerships with domestic enterprises todevelop spare parts and other materials;
n Although the consumption of televisions is projected to increase by only about 3 percent per year, thismarket segment will be replaced by demand for products with higher quality and more features; and
n The share of domestic assembly of computers and laptops will increase from 30 percent in 2010 to 60percent in 2020. Assemblers will only import spare parts so transport volumes will not increasesignificantly, but the value of imports will increase over 2012 - 2015 levels.
To achieve its electronics export objectives between 2011 and 2020, Vietnam needs to encourage FDIcompanies to invest in the electronics production field through preferential land tax treatment as well throughan assessment of the most important high technology goods for which to offer preferential tax treatment.
3.3.3 Future Export Markets
At present, the main export markets for electronics are in ASEAN, the EU, Japan, Korea, and the United States.In the future, markets will expand in countries such as China, Hong Kong SAR (China), the EU (especiallyGermany) and new members of the EU such as Poland, Hungary, Czech, and Slovakia. 13
3.3.4 Future Imports
In recent years, with industry development support from the State, imports have fallen gradually, with anincreasing import substitution rate. It is envisioned that enterprises supported through 100 percent foreignfunds will build satellite factories and joint-venture companies in Vietnam to produce spare parts. Themain sources of imports will be Taiwan (China), Korea, Japan, China, and Hong Kong SAR (China).
35
POLICY IMPLICATIONS FOR VIETNAM’S ECONOMIC GROWTH
13 Export and Import Strategies 2011-2020, Ministry of Industry and Trade.
Table 3.1: Domestic Traffic Routes
Source: Corridor Analysis, TDSI 2012.
Route
Ha-Noi to Noi-Bai airport
Bac-Giang, Bac-Ninh to Hai-Phong port
Bac-Giang, Bac-Ninh to Cai-Lan port
Road
North Thang-Long - Noi-Bai NH5
NH1A - NH5
NH1A - NH18
NH13, NH1A.Binh-Duong, Binh-Phuoc, Dong-Nai, HCMC to Tan-Son-Nhatairport and ports in HCMC

3.3.5 Future Transport Routes
According to a survey of existing exporting enterprises and newly developed enterprises, freighttransportation routes from provinces to the ports will not require significant change to handle the smallvolume of high value products. Expressway networks handling higher traffic capacity are expected to beconstructed, resulting in no major changes in traffic routes handling electronics. However, when Long-Thanh airport in Dong-Nai is in operation, it will attract some of the export shipments currently utilizingTan-Son-Nhat airport.
36
TRADE FACILITATION, VALUE CREATION, AND COMPETITIVENESS
Figure 3.5: Electronic Export and Import Movement Flows by 2020
Source: Freight flows data provided by TDSI.
1,000 Mill.USD
5,000 Mill.USD
10,000 Mill.USD
15,000 Mill.USD
10,000 TEUs
20,000 TEUs
30,000 TEUs
International Gateway (primary)
International Gateway (secondary)
EXPORT FLOWS
EXPORT VALUE BY PROVINCE
HCM City
Ha-Noi
Hai-Phong
Vung-Tau Sai-Gon
Cai-Lan
Da-Nang LAO PDR
CAMBODIA
Quy Nhon
CHINA
3.4 Development Strategies
The Vietnamese Government’s Master Plan for the Electronics Industry, introduced in 2007, sets out anambitious vision for 2020 including generating half a million jobs, a significant portion of these being engineers,technicians, and middle managers. These would be complemented by development of domestic researchcapabilities. The initial concentration on production of low-margin consumer goods would change as theindustry diversified into special-use electronic products and production of materials for use in components.
Although the electronics industry in Vietnam is currently in the early stages of development and is expandingrapidly, it is possible to reconsider the original objectives based on both recent events and the evolution ofthe electronics industry in other countries in Southeast Asia. The initial growth is characterized byinvestment in large factories to produce basic components or consumer goods. Continued growth dependson the ability to provide land, labor, power and logistics services in sufficient quantity and at reasonablecost. It also depends on the size of the market that is being served.
Over time, the products will become more sophisticated but the production methods will remain the same.As labor costs rise, growth will slow but production will continue through increases in productivity andchanges in product mix. To the extent that there is diversification, it will be in the form of developingsuppliers for inputs to the large factories. Production of specialized equipment and development of researchcapability may occur but not as a result of diversification by these factories. Instead, they will developthrough a separate path characterized by improvements in education and domestic investment researchand development.
The primary objective for the medium term is to sustain the growth in production and the employmentderived from that growth. Complementing this would be an increase in value addition through an increasein the inputs supplied by domestic industry.
The strategy for achieving these objectives is to address the current challenges facing the industry andVietnam. For the industry, some of the major challenges include reducing the time required to bring newproducts to market and improving the forecasting of demand and the flexibility of production to respondto changes in demand.
For the Vietnamese government, the rapid growth in electronics production means that improving thequality of logistics, including transport infrastructure, and increasing the supply of land with access to laborand international gateways is very important if the industry is to continue to expand. The governmentshould also ensure the availability and reliability of power, work to simplify administrative procedures,especially those related to trade facilitation, and develop IT-based procedures and transactions tocomplement those of the industry.
These can be addressed through development of industrial clusters with linkages to efficient trade corridors.The clusters would be designed to attract foreign investment but at the same time accommodate thedevelopment of local suppliers and subcontractors. The trade corridors would be designed to supporttransport and clearance of inputs and exports through the international gateways in a single day and allowfor multiple deliveries during that day.
The strategy should begin with an adjustment of the government’s vision. This need not be a formal exercisebut would involve assigning priority to the goals and developing a timeframe which takes into account what hasalready occurred and the experience of other countries in ASEAN, such as Malaysia, the Philippines, and Thailand.
37
POLICY IMPLICATIONS FOR VIETNAM’S ECONOMIC GROWTH
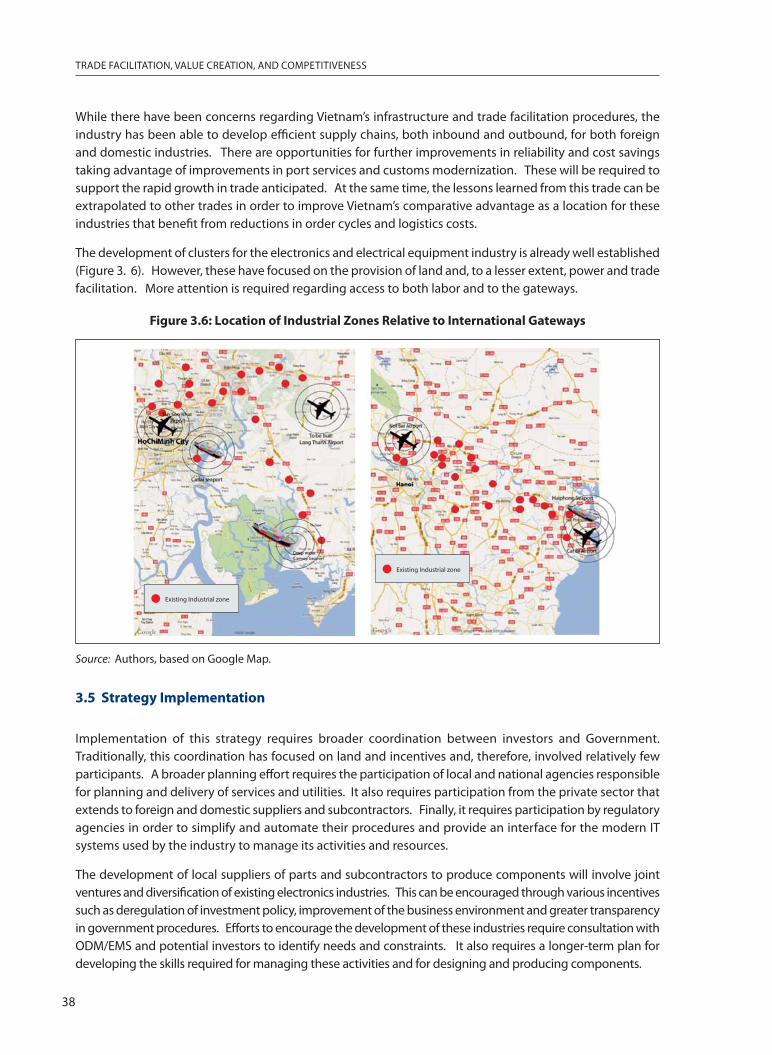
While there have been concerns regarding Vietnam’s infrastructure and trade facilitation procedures, theindustry has been able to develop efficient supply chains, both inbound and outbound, for both foreignand domestic industries. There are opportunities for further improvements in reliability and cost savingstaking advantage of improvements in port services and customs modernization. These will be required tosupport the rapid growth in trade anticipated. At the same time, the lessons learned from this trade can beextrapolated to other trades in order to improve Vietnam’s comparative advantage as a location for theseindustries that benefit from reductions in order cycles and logistics costs.
The development of clusters for the electronics and electrical equipment industry is already well established(Figure 3. 6). However, these have focused on the provision of land and, to a lesser extent, power and tradefacilitation. More attention is required regarding access to both labor and to the gateways.
3.5 Strategy Implementation
Implementation of this strategy requires broader coordination between investors and Government.Traditionally, this coordination has focused on land and incentives and, therefore, involved relatively fewparticipants. A broader planning effort requires the participation of local and national agencies responsiblefor planning and delivery of services and utilities. It also requires participation from the private sector thatextends to foreign and domestic suppliers and subcontractors. Finally, it requires participation by regulatoryagencies in order to simplify and automate their procedures and provide an interface for the modern ITsystems used by the industry to manage its activities and resources.
The development of local suppliers of parts and subcontractors to produce components will involve jointventures and diversification of existing electronics industries. This can be encouraged through various incentivessuch as deregulation of investment policy, improvement of the business environment and greater transparencyin government procedures. Efforts to encourage the development of these industries require consultation withODM/EMS and potential investors to identify needs and constraints. It also requires a longer-term plan fordeveloping the skills required for managing these activities and for designing and producing components.
38
TRADE FACILITATION, VALUE CREATION, AND COMPETITIVENESS
Existing Industrial zone
Existing Industrial zone
Existing Industrial zone
Figure 3.6: Location of Industrial Zones Relative to International Gateways
Source: Authors, based on Google Map.

4.1 Introduction
In 2011, with 20 percent of the world market, Vietnam was the second largest exporter of rice in the world,after Thailand. National rice production has nearly doubled since 1990, moving Vietnam from a food insecurecountry to a very large exporter of food.14 Rice exports currently account for around 4 percent of Vietnam’sexport earnings. Rice export growth contributes to both economic growth and poverty reduction, inparticular in rural areas where more than 80 percent of Vietnamese population lives. Vietnam’s two mostimportant rice-growing regions are at opposite ends of the country -- the Red River Delta in the north andthe Mekong Delta region in the south. While responsible for only just over half of Vietnam’s rice production,the Mekong Delta accounts for 95 percent of the country’s rice exports.15
4.2 Vietnam in the Global Rice Market
Global trade in rice has grown steadily over the last two decades but still accounts for less than 15 percentof global production (Figure 4.1). India and China produce about half of the global rice output, but generateonly 10 percent of total exports. In contrast, Vietnam and Thailand account for half of world exports butonly 10 percent of global production. Together with the US, Pakistan and India, they account for over threequarters of total exports (Figure 4.2). Unsurprisingly, importers are more diverse with concentrations amongAsian and Middle Eastern countries (Figure 4.3).
39
CHAPTER 4
RICE
14 Policy Note #2, Beyond the ‘Rice Bowl’: Building on Past Gains to Enhance the Quality, Sustainability, and Equity of Growth in theMekong Delta.
15 Ibid. 1-2

Of the major exporters, India’s value per kilogram is highest as most of its exports are high-price Basmatirice. Thailand has the second highest value per kilogram thanks to its various branded products and thequality of the milling. Vietnam’s rice exports have a relatively low value as most is generic, medium-gradewhite rice (Figure 4.3). Over the past 10 years, the top five exporters’ share of global trade has not changedsignificantly. On a value basis, Thailand has commanded a 25-30 percent share of global exports, whileVietnam has been responsible for 12 percent of exports (Figure 4.4).
40
TRADE FACILITATION, VALUE CREATION, AND COMPETITIVENESS
Figure 4.1: Major Rice Producers, 2010-2011 Figure 4.2: Major Rice Exporters and Importers
Note: Value average of 2007-2011. Source: US. Department of Agriculture (USDA).Source: UN Comtrade, Trademap.
Thailand Vietnam USAPakistan India Other
100%
2003 2004 2005 2006 2007 2008 2009 2010 2011
90%
80%
70%
60%
50%
40%
30%
20%
10%
0%
Figure 4.3: Rice Exporters, 2007-2011 Figure 4.4: Global Rice Export Value Share
Note: Quantity and value average of 2007-2011. Source: UN Comtrade, Trademap.Source: UN Comtrade, Trademap.
Exports
120
140
100
80
60
40
20
0
ChinaIndia
Indonesia
Thailand
Philippines
Burma
Brazil
Vietnam
Million tons
Domestic consumption
Thailand
Exports
Imports
VietnamIndiaUSA
PakistanItaly
ChinaBelgium
PhilippinesSaudi Arabia
UEAIran
MalaysiaUK
IndonesiaJapan
Nigieria
-2000 2000 40000US$ millions
Thailand
Quantity (LHS)
Tons, millions US$, millions
Value (RHS)
Vietnam USA Pakistan India
6000
5000
4000
3000
2000
1000
0
12
10
8
6
4
2
0

4.2.1 Key Exporters
Thailand’s success in the international rice trade is due to its high quality, long-grain white rice, which has asubstantial price premium over lower grades. Private export companies supply world markets with differentqualities of long grain rice, including fragrant rice. The marketing and milling industry in Thailand is verysophisticated and responsive, allowing it to compete with the United States in the high-quality market andwith India and Vietnam in the lower- and medium-quality markets. A significant portion of Vietnam’s riceexports are procured by Government and sold through Government-to-Government (G-to-G) arrangements.
Vietnam became the world's second largest rice exporter in 1997 but was a provider of low-quality rice.More recently, investments in milling and infrastructure, along with increased experience in dealing withimporters, have led to improvements in both quality and reliability. But issues in the supply chain remainand contribute to a lower price for Vietnamese rice compared to similar grades of Thai rice.
India exports high-value aromatic rice varieties such as Basmati. After a slow year is 2011, Indian rice exportsare likely to rebound with the lifting of a government ban on selling non-basmati varieties. To keep localprices above a certain floor the government-owned Food Corporation of India buys rice from farmers, oftenat above-market prices.
The United States exports relatively high quality long-, medium-, and short-grain rice to more than 100countries. The United States exports are a mix of raw rice, brown rice, and fully-milled rice. This makes itthe only major exporter not to capture the value added from fully milling the rice. There are more than10,000 rice farm operators in the country.
Pakistan exports both long-grained high-value aromatic rice to the Middle East and medium-grain rice toSouth and Southeast Asia. Rice is grown under diverse climatic conditions and the varieties producedinclude Basmati, Japonica, and long grain. An increasing proportion of the exports are parboiled rice, andPakistan is now second to Thailand in this trade.
4.2.2 Key Importers
The biggest importers of rice are found in Asia and the Middle East, although there has been real growth inthe imports of African nations. The type of rice imported varies with local preferences and purchasingpower. Canada, Western Europe, Saudi Arabia, and South Africa generally import high-quality long-grainrice. The Philippines, Indonesia, and the rest of the Middle East are more price-sensitive, switching betweenhigh- and medium-quality depending on prices and domestic conditions. The volume of imports variessignificantly from year to year and rice prices tend to be more volatile than the prices of other grains.
The Philippines has been the largest importer of rice on average over the last decade, although in 2011Indonesia imported more. In recognition of the food security concerns of the government, the Philippineshas been allowed by the World Trade Organization (WTO) to implement a policy of quantitative restrictions(QR). Once rice imports for the year reach a certain point, any additional rice imports are hit with a veryhigh tariff rate. Vietnam is the Philippines’ leading supplier of rice imports, responsible for between 75percent and 95 percent of annual rice imports over the last five years. Thailand is the country’s secondlargest source of rice imports.
Other major Asian importers are Malaysia and Indonesia. Malaysia imports about half its rice from Vietnam,a significant change from 10 years ago when Thailand supplied most of Malaysia’s rice imports, and Vietnamless than one fifth. A similar trend can be seen in Indonesia, where 10 years ago Vietnam supplied 15 percentof imports, while in recent years this has risen to around 60 percent.
41
POLICY IMPLICATIONS FOR VIETNAM’S ECONOMIC GROWTH

Large rice importers in the Middle East, such as Saudi Arabia, the United Arab Emirates and Iran, have apreference for expensive rice such as Basmati. As a result, they import most of their rice from India andPakistan. The UK has a very diverse import base, perhaps reflecting its multicultural population. Indiaprovides about one quarter of the UK’s rice, while Pakistan, Spain, Italy and Thailand each cover about 10-15 percent of import needs.
4.3 Vietnamese Production and Trade
Since 2000, Vietnam paddy rice16 production has increased at an annual average rate of around 2 percent.17
This growth, combined with improved milling techniques and a substantial increase in the ratio of exportsto domestic consumption, has allowed Vietnam to increase rice export volumes by an average of 7 percentper annum over the same period.18 In 2011, exports accounted for 36 percent of rice production.19
Increasing rice export volumes have been accompanied by rising world rice prices, leading to large increasesin the value of Vietnam’s rice exports. From around US$1 billion in 1999, rice exports have more than tripledto US$3.5 billion in 2011.20 Over this period, average rice prices have risen 123 percent while volumes haveincreased 56 percent (Figure 4.5).
The destinations of Vietnam’s rice exports have changed considerably over the last 10 years. In 2001 and2002, Ghana was particularly important, while since 2005 the Philippines has, on average, been Vietnam’smost important export market for rice. Exports to Indonesia have been especially volatile, with Indonesiaaccounting for around 20 percent of Vietnamese exports for a number of years, almost zero for most otheryears, but then more than 40 percent in 2011 (Figure 4.6).21
42
TRADE FACILITATION, VALUE CREATION, AND COMPETITIVENESS
16 Rice with its husk still attached, also called rough rice.17 http://www.gso.gov.vn/default_en.aspx?tabid=469&idmid=3&ItemID=1178018 Vietnam Food Association.19 http://usda.mannlib.cornell.edu/MannUsda/viewStaticPage.do?url=http://usda01.library.cornell.edu/usda/ers/./89001/2011/
index.html20 Vietnam Food Association.21 http://gain.fas.usda.gov/Recent%20GAIN%20Publications/Grain%20and%20Feed%20Annual_Hanoi_Vietnam_4-16-2012.pdf.
Figure 4.5: Vietnam Rice Exports, 1989-2011
Source: Vietnam Food Associaton.
Export quantity (million tonnes) (rhs)
1989
4
3.5
3
2.5
2
1.5
1
0.5
01991 1993 1995 1997 1999 2001 2003 2005 2007 2009 2011
Export value (million US$) (lhs)
Mill
ion
Tons
Billi
on U
S$
008
007
006
005
004
003
002
001
000

Around one quarter of Vietnamese rice exports are of high quality (5 percent broken) rice. Nearly half arelower quality (15 percent broken) rice, while around 20 percent are of a poorer quality. The remaining riceexports are either glutinous or aromatic (Figure 4.7). 22
According to U.S. Department of Agriculture (USDA) forecasts, Vietnam’s rice exports by quantity will fallslightly over the next couple of years before reaching about 8 million tons around 2020.23 The World Bankforecasts rice prices to fall over the next 10 years by about 10 percent.24
15% broken45%
5% broken27%
25% broken11%
10% broken1%
100% broken6%
Jasmine6%Glutinous
3%
Unknown1%
43
POLICY IMPLICATIONS FOR VIETNAM’S ECONOMIC GROWTH
22 http://gain.fas.usda.gov/Recent%20GAIN%20Publications/Grain%20and%20Feed%20Annual_Hanoi_Vietnam_4-16-2012.pdf 23 http://usda.mannlib.cornell.edu/MannUsda/viewStaticPage.do?url=http://usda01.library.cornell.edu/usda/ers/94005/./2012/
index.html24 http://siteresources.worldbank.org/INTPROSPECTS/Resources/334934-1304428586133/Price_Forecast.pdf
Figure 4.6: Vietnam Rice Export Destinations, 2001-2011
Source: UN Comtrade, TradeMap.
Figure 4.7: Exported Rice
Source: USDA.
ASEAN
2001 2002 2003 2004 2006 20072005 2009 201020082000
100%
90%
80%
70%
60%
50%
40%
30%
20%
10%
0%
Cuba Iraq Bangladesh Cote d’Ivoire Others
ASEAN
Cuba
IraqBangladesh
Cote d’Ivoire
Others

4.4 Structure of the Rice Industry
Broadly speaking, the rice sector in Vietnam has five components, as shown in Figure 4.8. The first is thefarm, where the rice is grown. The size of rice farms in Vietnam varies from smallholdings of less than 0.2hectare to large rice fields of over 3 hectares. The majority of rice for export is produced on the 300-400thousand largest farms. This concentration has increased in recent years as smaller farmers have diversifiedout of rice into other agricultural goods. In the Mekong Delta, yields have increased over the past twentyyears as multiple growing seasons have been introduced. Currently, the majority of export rice productionis from farms with at least two crops per year. More than one quarter of hectares in the Mekong Delta employtriple cropping. As most export rice production is dispersed across a large area of the Mekong Delta, thesecond component of the rice production process is collectors who purchase paddy (un-milled) rice fromfarms and transport it in barges for sale to small mills. There are several thousand collectors, somespecializing in rice but most handling a range of commodities.
The third component is the small mills located relatively close to the rice farms. These purchase dried orsemi-dried paddy and removes the husk to produce brown rice. These mills have a capacity of about 3-5tons of paddy per hour. They have limited storage capacity, with paddy rice often left outside or underbasic roofing, leading to physical losses of around 2 percent annually. The fourth component is the largemills that purchase husked rice and mill it to produce polished or unpolished white rice. Such mills operateat around 20-50 tons per hour. Some large mills also husk the paddy allowing some large rice producers tobypass the small mill stage.
The fourth component is the exporters and wholesalers who by rice from the large mills and export or sellto the domestic market or to exporters. Although there are about 200 registered exporters, most exportless than 1000 tons per year. Eleven companies account for 70 percent of the trade. SOEs, which areresponsible for G-to-G transactions, account for about 80 percent of exported rice25 and distribute theexported rice through concessional government programs in the Philippines, Indonesia, and Cuba.
Exports are usually sold on an FOB basis, payable with a time draft of 7-21 days following the rice beingloaded on the vessel. Payments are guaranteed through a Letter of Credit. Exporters also receive advancepayments of 10-30 percent from the importers. The ordering and processing requires less than one monthso that the exporter’s cash-to-cash cycle is limited to 6-8 weeks.
There is very little inventory stored in the supply chain even though both paddy and bagged rice haverelatively long shelf lives. Exporters purchase milled rice after an export order is confirmed. The millspurchase and mill paddy shortly after the exporter’s order is received. The smaller mills maintain a smallinventory of paddy and mill the rice for sale to larger mills at the time an order is received. Since the rice issold through brokers on a shipment-by-shipment basis, there is no need to maintain an inventory forsupplying regular customers throughout the year. As a result, the order cycle from receiving the initial orderto loading for shipment is 30 days or less with most of this time spent confirming the order and the sailingdate of the vessel.
This industry structure generally produces three levels of rice quality for export (see the arrows in Figure4.8). Low quality paddy is bought by collectors from the small farms in volumes ranging from 100 kilogramsto 50 tons per transaction. The paddy is delivered to small mills along the rivers where it is dried, husked,and stored. Upon receiving purchase orders or bids from exporters, the mills transfer raw rice to portsdesignated by the exporters or to the exporters’ mills where the brown rice is polished (red arrow). This
44
TRADE FACILITATION, VALUE CREATION, AND COMPETITIVENESS
25 Agrifood Consulting International, Inc. (2009). Economic and Sector Analysis for Agriculture, Rural Development, and NaturalResource Management in Vietnam in 2009 and 2010 (Phase 1), Final Report prepared for the World Bank.

rice has a high proportion of broken rice because the small mills have older technology, do not have thecapability to segregate different varieties, are unable to regulate moisture content effectively, and most lackHACCP (Hazard Analysis and Critical Control Points) certification.
Better quality paddy is purchased from the larger farms and delivered to the large mills where it is milledand polished (yellow arrow). This provides reasonably high yields, but also mixed varieties. The outputfrom the large mills is sold on a G-to-G basis or a private-to-private basis and shipped to the importingcountries in 50 kg bags on general cargo vessels. Both the low-and better-quality rice is packed into 25-50kilogram bags according to customers’ requirements and then transported by barges to Sai-Gon port wherethey are loaded into general cargo ships.
45
POLICY IMPLICATIONS FOR VIETNAM’S ECONOMIC GROWTH
Figure 4.8: Alternative Rice Supply Chains
Source: TTFA Survey, 2011.

The highest quality rice (blue arrow) consists of special varieties purchased from farms in specialized paddygrowing areas and delivered to the large mills. Each variety is processed as a separate product. Raw rice iscleaned, color separated and packaged based on the exporters’ requirements. This is primarily 5 percentbroken aromatic rice (e.g., jasmine, fragranced). The rice is packaged into 1-10 kilogram multi-layer bags.The bags are transported by road to the inland container depots (ICD)s near Sai-Gon port where they areloaded into containers for shipment to foreign distributors on CNF (cost, no insurance, freight; i.e., cost plusfreight with no insurance), CIF, or FOB terms. The destinations are primarily high-income countries/marketssuch as Hong Kong SAR (China), Saudi Arabica, and Korea.
For G-to-G trade, the importing government designates the buyer. For private-to-private trade, exporters sellto international traders or brokers who in turn sell to foreign distributors that supply retail outlets. The gradualliberalization of the rice trade has allowed the role of private traders to increase. However, most exports arestill sold through the state-owned traders. This arrangement may change in the future with foreign tradersbeing able to buy Vietnamese rice directly without entering into a joint venture with a domestic company.
Despite the large volumes shipped, in many respects the rice trade remains a small-scale activity involvinga large number of small-scale farmers, collectors, mills and even exporters. The fragmented nature of thetrade is reinforced by limitations on working capital, which leads to a large numbers of relatively smallshipments. Furthermore, the supply chains are not designed to maintain the integrity of the paddy/riceand instead tend to mix them indiscriminately. This begins with the small farms, which plant a significantquantity of saved-seeds of varying quality. The paddy collected from different farms is then combined intoa single consignment and loaded on a barge for delivery to a mill. Further mixing occurs when there is atwo-stage milling process. The small mills still employ older technology and have limited capacity forregulating moisture content, which results in low yields of hulled rice.26 This not only reduces the qualityof the exports but also the returns to farmers.
Because of the fragmentation, farmers have little interaction with the foreign markets or even the exporters.As a result, the incentives for improving the quality of the rice are not communicated to the farmers. Thispresents a challenge for the rice industry, as agricultural land is limited and other crops potentially offergreater returns. The predominance of large G-to-G rice contracts reinforce a system based on exportinglow-quality rice, as the buying governments are mainly concerned with price rather than quality.
Most of the trade continues to be in white rice, with the value determined based on ‘percentage broken’.However, some trade is developing in parboiled and aromatic brands. Trade in higher-value rice is primarilythrough private sector initiatives. The challenge is not only to produce and process higher quality rice, butalso to market and distribute the rice in way that earns higher returns.
4.4.1 Transportation
Paddies (un-milled rice) are mainly produced from Mekong Delta provinces. About 96 percent of exportedrice is produced in the Mekong Delta Region. In Figure 4.9, the different shades of blue color depict thevarious levels of provincial outputs of rice production. Paddies are collected from Mekong Delta to transportto two two-stage milling centers: one along Hau River for paddies from An-Giang, Dong-Thap, Kien-Giang,Can-Tho; and the other along the Tien River, for paddies from Tien-Giang and Long-An, etc. Around 90percent of the exported rice is transported from the Mekong Delta region to HCMC by inland waterwayswith a small volume being transported by road via NH1A and the HCMC – Trung-Luong expressway (for riceexports coming from Long-An and Tien-Giang). Table 4.1 shows the main inland waterway routes, whichare highlighted in Figure 4.9 as well.
46
TRADE FACILITATION, VALUE CREATION, AND COMPETITIVENESS
26 In Vietnam a normal private mill is, on average, only able to yield 60-66 kilograms of milled rice out of 100 kilograms of paddy rice, of whichonly 40-48 kilograms are head rice. This compares with a typical yield for Asian mills of 67-70 kg with 52 kilograms of head rice.

Given its serious alluvial status, Route 3 is less used compared to Route 1 and Route 2. In 2010, the inlandwaterway routes carried about 5.9 million tons of rice for export, of which 5.6 million tons passed throughRoute 1 and Route 2. These two routes connect to Cho-Gao canal, en-routed to Thi-Vai River ports in HCMC.The Cho-Gao canal therefore serves as an arterial route for rice export transported from the Mekong Deltato the main international gateways (see Box 4.1). It takes a longer time to transport to the ports and ICDs,and causes uncertainty in delivery time. Most of the inland waterways from the Mekong Delta to HCMCare not in optimal condition; many pre-existing bridges over the rivers are below standard, with limitedclearance for river traffic. Maintenance funds for inland waterways are limited, with only the most urgentworks being undertaken.
47
POLICY IMPLICATIONS FOR VIETNAM’S ECONOMIC GROWTH
Table 4.1: Main Domestic Routes
Source: Corridor Analysis, TDSI 2012.
Figure 4.9: Domestic Traffic Flows of Rice Export
Source: Freight flows data provided by TDSI.
Route
Route 1: HCMC – Ca Mau route via the Xa No canal
Route 2: HCMC – Kien Luong route via the Sa Dec – Lap Vo canal
Route 3: HCMC – Kien Luong route via the Thap Muoi canal number 1
Length (km)
338.3
322
288.8
THI VAI RIVER
ROUTE 1
ROUTE 2
ROUTE 3
CHO GAO CANAL
EXPORT VOLUME BY SEA
ASEAN53%
China2%
Other45%
SHARE OF EXPORT VALUE BY TRANSPORT MODE
0% 20% 40% 60% 80% 100%
Export
Border gate Seaport ICD
100 MIL.USD
200 MIL.USD
300 MIL.USD
400 MIL.USD
500 MIL.USD
50, 000 TEUs
100, 000 TEUs150, 000 TEUs
EXPORT FLOWS
EXPORT VALUE BY PROVINCE

The bar chart in Figure 4.9 shows the use of international gateways for rice export. HCMC ports, denotedas red arrow, account for 87.9 percent of rice exports, while other Mekong Delta ports (My-Thoi port, Can-Tho port) are used for 1.9 percent of rice exports. The remaining of 8.7 percent of rice exports passedthrough ICDs (mainly ICDs in HCMC).27 The main seaports for rice exports in HCMC include the Ben-Nghe,Tan-Cang, Cat-Lai, VITC, Hiep-Phuoc, Khanh-Hoi and Tan-Thuan ports.
From HCMC, 87.9 percent of the rice was transported directly to vessels for loading. About 600 thousandtonnes of rice are cleared at ICDs including Phuoc-Long - Thu-Duc ICD, Tay-Nam ICD (HCMC port - RegionIV), Transimex III ICD (HCMC port - Region IV) and other ICDs in HCMC and Dong-Nai. After being packedinto containers at the ICDs and completing customs procedures, the rice is transported by road to the portsfor export. The route from the ICDs is mainly via the Ha-Noi Expressway – Nguyen-Thi-Dinh road to Cat-Laiport. Traffic routes to the ports in HCMC are frequently congested because the ports are located in theinner city. Due to these problems, these routes are unable to meet transport demands in the area. The G-to-G trade with Indonesia and the Philippines is shipped on Vietnam vessels on CIF terms. For other markets,such as Africa, rice is exported on FOB terms with the buyers selecting the vessels.
Box 4.1: Cho-Gao Canal
The Cho-Gao canal is one of Vietnam’s most heavily transited waterways connecting the Mekong Delta Regionand HCMC. Constructed in 1877 and operational since the early 1900s, the canal is 28.6 kilometers long andapproximately 80 meters wide at its surface. The canal is a relatively narrow but critically positioned waterwaylinking the much wider, higher-capacity Tien and Vam-Co Rivers at each end of the canal; this narrowness, coupledwith increasing traffic levels and expanding average vessel sizes over the past several years, has rendered the canalthe most critical bottleneck for waterway cargo transport in the region. The resulting congestion has not onlyincreased logistics costs for regional and import-export shippers (in a region that accounts for 62 percent ofVietnam’s industrial output and 71 percent of its seaport container throughput), but has also led to unsafenavigation (e.g., higher collision and wreckage rates) and heavy bank erosion (with serious environmental andsocial implications).
In 2001, under the Bank-financed Vietnam Inland Waterways and Ports Rehabilitation Project, the canal wasformally dredged and upgraded to meet Class III standard for national inland waterways. Since the completionof those works, however, sustained high rates of economic growth, both nationally and in the region, have resultedin waterway cargo flows to/from the Mekong Delta and HCMC -- via Cho-Gao -- that have consistently grown at amultiple of GDP. For example, freight volumes through the canal increased from 16.9 million tons in 1995 to 65.0million tons in 2010, for an average annual growth rate of 9.4 percent over the period. The latter rate was 1.3times the average annual growth of Vietnam’s real GDP over the same 15-year span (7.2 percent). Today, accordingto government data, an average of approximately 1,400 vessels varying in size from 200 DWT to 1,000 DWT traversethe canal each day (with peak volumes closer to 1,800 vessels per day).
Despite considerable capacity constraints at Cho-Gao canal, the alternative routes to/from HCMC and Can-Thoremain far less desirable for a critical mass of shippers, as Cho-Gao canal still represents the most direct routebetween these two critical nodes in the Mekong Delta network. Another option for some shippers could be tobypass HCMC ports altogether and use Can-Tho as an international gateway for Mekong Delta trade. However,large vessels face severe restrictions entering Can-Tho ports as the Dinh-An estuary remains alluvial. Unless largeand time-intensive investments are committed to upgrading Can-Tho port and the related waterway systems,most import-export flows in and out of the Mekong Delta region will continue to pass through Cho-Gao canal enroute to HCMC and the Vung-Tau port range.
48
TRADE FACILITATION, VALUE CREATION, AND COMPETITIVENESS
27 According to Vietnam Customs statistics.
Source: Technical Note on the Proposed Cho Gao Canal Improvement Project, World Bank 2012.

River transport costs from the Mekong Delta to the ports in Ho Chi Minh City are from 4-5 US$/ton; costs forloading and unloading (at river ports and from ICDs to the ship) are from 2.3-2.5 US$/ton. Besides theseoperational costs, additional costs include the cost for river control stations at an average of 50 US$/shipmentas well as labour costs for loading and unloading at an average of 0.75 US$/ton, bringing the total cost to8.5 US$/ton. Transport time is from 18 to 36 hours depending on the region. Loading and unloading oftentakes two days. Thus, under favorable conditions, transport time per shipment is between 3 to 5 days. Thecost is reasonable compared to the time and quality of service. Waterway transport is suitable for low- andmedium-quality rice.
Road transport costs are from 12-20 US$/ton, with average tolls at 2 US$/ton. Besides these operationalcosts, additional costs are incurred at road control stations due to transport violations such as overloadedor poor quality vehicles, costing an extra 15 to 25 US$/ton. Travel time, loading and unloading takesapproximately 8-10 hours. Road transport is mostly used for high-quality rice, which requires morecareful treatment.
Vietnam's rice exports follow two main international routes: one to the ASEAN countries and the other toEurope and Africa. For shipments to ASEAN countries, ships of 3000-5000 dead-weight tonnage (DWT) aremost commonly used, and for shipments to more distant destinations such as to Africa and Europe, largerships of over 10,000 DWT are used. Transport costs depend on the routes and the ship tonnage: from HCMCports to Cebu (Philippines) costs 27 US$/ton, to Kobe (Japan) costs range from 12-20 US$/ton, and toHamburg (Germany) costs range from 30-45 US$/ton. Vessel speed ranges from 11 to 13 knots/hour. Thus,for long routes, such as those to Africa, transport takes about one month.
4.4.2 Forecast for Rice Export
According to the Ministry of Agriculture and Rural Development’s plan, by 2020 Vietnam will have 3.8 millionhectares of rice paddy under cultivation, predominantly located in the Mekong Delta, and will export 4million tons of rice annually. In the coming years, the focus for Vietnam will be on improving the quality ofexported rice, developing brand name recognition for specialty Vietnamese rice, and increasing the volumeof exported rice.
49
POLICY IMPLICATIONS FOR VIETNAM’S ECONOMIC GROWTH

According to seaport development planning, by 2020 construction and upgrading of ports in the Mekong
Delta will be completed. This includes ports such as Hoang-Dieu general berth, Cai-Cui and Tra-Noc with a
capacity of 12 - 13.5 million tons per year, able to handle ships from 5,000 to 12,000 DWT. The demand on
transportation routes for rice exports will change due to rice being exported directly from Mekong Delta ports,
reducing the volume of rice transported from the Mekong Delta to ports in HCMC. Shipments to other
countries in the ASEAN region can be directly exported from the Can-Tho port. For large-volume orders
destined for distant markets, rice will be transported by inland waterways to the ports of HCMC for export.
Rice exports will continue to focus on traditional markets such as Southeast Asia and Africa with potential
market expansion into South America and the Middle East. For SE Asia regional routes, ships from 5,000 -
10,000 DWT will be used for exports from the Mekong Delta in order to reduce transport time and costs.
50
TRADE FACILITATION, VALUE CREATION, AND COMPETITIVENESS
Figure 4.10: Projected Rice Export Movement Flows by 2020
Source: Freight flows data provided by TDSI.
EXPORT FLOWS
International Gateway (primary)
International Gateway (secondary)
20,000 TEUs40,000 TEUs60,000 TEUs

4.5 Supply Chain-Focused Development Strategies
In the past, growth in the export of rice has been achieved by increasing the volume of shipments andexpanding into new markets. However, the opportunities for increasing volume are diminishing becauseof limitations on available land and competition from other agricultural activities. If Vietnam is to increasethe value of its rice trade, it must do so by raising the unit value of rice exports, which will also increase thereturns to labor and land.28 Improvements in seed varieties and farming practices will raise yields at thefarm level, but this requires time and the rate of increase will decline over time. New markets for rice exportscan be developed but these will be more challenging in terms of demand for quality of rice and reliabilityof deliveries. Most short-term improvements will be obtained from changes in the performance of thesupply chains connecting farms to mills and mills to loading ports, and the introduction of distributionchannels with better connections to individual markets. The basic strategy for improving supply chainperformance has three components:
n For the inbound supply chain, the improvements would segregate different varieties of rice movingthrough the supply chains, coordinate sequential activities and reduce the number of transactions,capture economies of scale, add storage between the farm and the mill, and integrate quality controlfrom the farm-gate through to the mill;
n For the rice mill, the improvements would modernize the processing technology to increase yield andconsistency of milling, and transact directly with growers or operators of intermediate storage; and
n For the outbound supply chain, the improvements would reduce the proportion of sales that are G-to-Gsales or involve traders, increase linkages to distributors and retailers, differentiate products accordingto demand in individual markets, and develop the capacity to delivery smaller, higher value shipments.
These components would increase the unit value at various locations along the supply chain as shown inTable 4.2. Complementing these supply chain changes would be efforts to improve the quality of seedsand cultivation, simplify transactions and mitigate financial risk.
These changes would be introduced through a combination of public sector efforts to modify policies andlegal and regulatory frameworks, private sector efforts to introduce economies of scale in production anddistribution, and joint efforts to develop the institutions and financial instruments to promote investmentin facilities and mitigate the financial risks of those investments. Several changes in production and exportof rice that are consistent with this strategy have already begun. These include: (i) formation of growers’associations together with increased use of contract farming; (ii) gradual elimination of the two-stage millingprocess; (iii) construction of storage facilities; (iv) investments in modern drying and processing technology;and (v) better access to market information for both farmers and mills.
Perhaps the most important mechanisms for restructuring the supply chains are: the introduction ofappropriate financial instruments; a legal framework to enforce contractual relations between the producers,processors and exporters of rice; and dissemination of market information to improve the transparency ofrice trade and related supply chains. The financial instruments are needed to: (i) reduce the cost for capitalinvestment in storage and processing; (ii) increase availability of working capital for procurement andstorage; and (iii) mitigate the risk associated with the fluctuation in prices for paddy and milled rice.
51
POLICY IMPLICATIONS FOR VIETNAM’S ECONOMIC GROWTH
28 Farmers should also be supported to diversify out of rice if they can obtain higher returns from other crops or generate moreincome by taking employment in other sectors. Potential government interventions to encourage diversification should aim atmaking it easier for farmers to upgrade their production systems or, alternatively, to migrate to areas where better opportunitiesexist through wage employment.

A legal framework to enforce contracts is needed to encourage the use of supply contracts and therebyincrease both the reliability of the supply chains and the utilization of the processing capacity. Greatertransparency is needed not only to improve coordination among the participants in the supply chain butalso to develop a common set of performance goals. In combination, these three mechanisms greatly reducefinancial risk, which has been the major impediment to restructuring the supply chains.
The financial instruments to be introduced are:
n Loans for working capital with longer tenure and more favorable terms to accommodate supply chainswith larger inventories and longer cash-to-cash cycles. More rice will be stored during the period betweenharvests. For contract farming, the cash-to-cash cycle extends from procurement of agricultural inputsto delivery of the paddy rice to the mill, which may include the time in storage. For the mills, the cashcycle extends until final payment by the exporter;
n Domestic Letters of Credit to guarantee delivery of domestic supplies;
n Supply contracts including forward contracts, designed for clarity and ease of enforcement. These notonly guarantee physical delivery but can also be used to reduce the risk of price fluctuations during thecash-to-cash cycle. These are used for contract farming, deferred payment storage, and purchase/salesagreements for silo operators and millers/exporters; and
n Commodity futures contracts that allow operators of storage and mills to hedge against fluctuations inprices of paddy and milled rice. This can also be used to mitigate the risk associated with thesales/purchase agreements that are indexed against a spot price.
52
TRADE FACILITATION, VALUE CREATION AND COMPETITIVENESS
Table 4.2: Opportunities for Value Addition in Rice Supply Chain
Source: TTFA Survey.
Supply ChainLocation
Upstream
Processing
Downstream
Supply Chain Activity
Cultivation
Seeds
Storage
Milling
Certification
Packaging
Distribution
Type of ValueAdded
Yield
Variety (Fragrant)
Moisture,Market timingSegregation
% Broken,Polishing
Segregation
Market access
Retailing
Retailing
Increase in Value
20%-40%
40%-50%
20%-40%
10%-150%
20%-30%
20%-40%
20%-40%

4.6 Strategy Implementation
The restructuring of the supply chains would enable a transition in the rice trade:
n From smaller-holder production, with fragmented systems for collection of paddy rice, minimal storage,inefficient processing, and dominance of government-managed FOB trade;
n To farmers groups and large farms, with integrated collection and storage, modern processing, and privatesector sales and distribution.
The starting point would be efforts to develop farmers’ associations, contract farming agreements, and othermechanisms that increase the scale of production and collection of paddy rice. This would also createopportunities for dissemination of modern farming techniques and exchange of market information amongparticipants in the supply chain. It would also increase the predictability of supply and market price forpaddy rice, thereby encouraging the use of storage and allowing for better utilization of milling capacity.
This would lead, in turn, to an increase in investment in modern storage and processing. The additional storagewould be used to reduce the volatility of supply and allow supply contracts to extend over several months.The newer processing equipment would increase the yield and provide better control over moisture contentand consistency of the milled rice. Both would be designed to differentiate between paddy and milled riceand by variety and quality.
These improvements would allow the large private mills to assume a greater role in the export of rice andto develop different distribution channels based on the quality and variety of rice. These changes would allowgovernment to reduce its role in the rice trade and to decrease Government-to-Government trade. The stepsinvolved in implementation of this strategy would follow a similar sequence and include:
n Establishing policy support and risk migration (legal instruments) to encourage contract farming andformation of farmers groups;
n Improving finance for working capital and procedures for collecting paddy rice in order to simplify supplychain structure;
n Introducing new financing for modernization of processing equipment;
n Introducing loans for construction of storage facilities, and provision of forward contracts and supportinglegal framework to allow the use of storage for timing the sales of paddy and milled rice;
n Improving access and increasing capacity of seaports used for break-bulk and container shipments of riceand for developing inland water transport systems to support larger shipments of paddy rice and smallconsignments of specific varieties;
n Implementing policy reforms to reduce the role of the state in rice trading and setting of rice prices; and
n Developing benchmarks, an exchange, and legal framework for issuing futures contracts to better managerisk in rice trading. The buyers of these contracts would include farmer’s groups and operators of silosand mills.
53
POLICY IMPLICATIONS FOR VIETNAM'S ECONOMIC GROWTH

Public Support
Public policy would focus on value addition, rather than volume, in the rice trade. This implies a changefrom the supply-push strategy for increasing commodity volume to a market-pull strategy for increasingthe value of specific rice varieties. Complementing this would be a plan for reducing the proportion ofexports of low-value rice traded by state-owned enterprises using government-to-government agreementsand increasing sales by private mills of higher-value rice using supply contracts.
In order to simplify collection of paddy rice from farms, it is important to increase the proportion of directtransactions between small farms, which will remain the major source of rice, and the operators of the silosand mills. This will require the formation of growers’ associations and village-level institutions. These groupsalso provide scale in procurement of inputs, provision of local facilities for drying and storing, and sales tothe operators of silos and mills. They also provide an effective conduit for introducing higher-value ricevarieties and improved agricultural procedures. However, developing these relationships requires asustained, multi-year effort to build trust among market participants. Support for this effort requires aneffective public-private dialogue with a clear policy on the part of government and a broad consensusamong operators of silos and millers. This consensus could be developed through an association similar tothe Thai Rice Exporters Association.
The development of storage is critical to the transition to a higher quality rice trade. While there are somesilos available, most of the storage is warehouses with paddy or milled rice in bags. More importantly, mostof the storage is designed to be rented rather than used to time the sales of paddy rice and maintaininventory for large-scale shipments of rice exports and continuous supply of product to buyers.29 The privatesector can construct and manage silos but public regulation is required to enforce forward contracts andeventually future contracts. Public support is also needed to introduce loans with extended tenure to coverthe longer cash-to-cash cycles that accept trust receipts for collateral.
During this period, the Government should continue to develop infrastructure to support the gains inefficiency in the supply chains. The increase in the size of farms or farm groups and the scale of millingoperations requires infrastructure to accommodate larger-capacity transport units, especially for inlandwater transport. The separation of higher-value varieties requires intermodal facilities that can segregateproducts. The increase in containerization and the reduction in the size of bulk shipments as a result of thedecrease in Government-to-Government shipments will require continuing improvement in portperformance. This will, in turn, require improvements in the access to the port facilities as well as expansionin terminal capacity for both break-bulk and container shipments.
In order to increase the quality of rice exports, the facilities for testing and other regulatory proceduresshould be integrated into the supply chain to improve quality and avoid procedural delays. This is especiallyimportant for the phyto-sanitary certification and testing required for specific markets. Given the capabilitiesof the logistics industry and the millers/exporters to introduce electronic data solutions, it is important thatgovernment regulatory institutions utilize modern communications.
International Experience: Increase in Unit Value of Rice
There are several opportunities for increasing the unit value of rice. The principal ones are the introduction ofhigher-value varieties, improvements in processing, and the capture of downstream value added. The formercan have a dramatic impact as shown in Figure 4.11, which compares the prices for plain and aromatic long-
54
TRADE FACILITATION, VALUE CREATION AND COMPETITIVENESS
29 The decision on who should provide and operate the facilities and who would own the paddy rice that is being stored requires furtherassessment. Problems with publicly managed storage argue for a private sector effort. The large exporters could develop large storagefacilities; the growers’ associations might prefer their own, smaller storage facilities, while third parties might establish mid-sizedfacilities.

grain rice from Thailand. The price differential ranges from 75-100 percent. A similar but less dramatic increaseapplies for varieties currently grown in Vietnam, as shown in Figure 4.12. The price differential is 40-50 percent.
Improvements in processing can result in better control of moisture levels and improvement in appearancethrough polishing; however, the principal measure is the percentage of broken rice. The difference in unitvalue fluctuates, with price as shown in Figure 4.13 for Vietnam White Long Grain. The price differential is 10-15 percent. A more dramatic price differential can be seen in the timing of sale. The price fluctuations duringthe year were almost +20 percent. The extension of the supply chain to capture the some of the value addedincludes arranging for storage and shipment of rice and includes packaging the rice into smaller units (bagsand cartons) for retail distribution.
55
POLICY IMPLICATIONS FOR VIETNAM'S ECONOMIC GROWTH
Figure 4.11: Price for Hom Mali and 5% Broken White
Notes: Blue line - Thailand White Long Grain 5% BrokenRed line - Hom Mali White Long Grain 100% Grade B
Source: Jackson and Sons. http://livericeindex.com/members/rice-price-history?stock=56&compare=30
Figure 4.12: Price for Fragrant and 5% Broken White
Notes: Blue Line - Thailand White Long Grain 5% BrokenRed line - Vietnam White Long Grain 5% Broken
Source: Jackson and Sons. http://livericeindex.com/members/rice-price-history?stock=56&compare=30

56
TRADE FACILITATION, VALUE CREATION AND COMPETITIVENESS
Figure 4.13: Price of 5% and 25% Broken White Long Grain
Notes: Blue Line - Vietnam White Long Grain 5% BrokenRed line - Vietnam White Long Grain 25% Broken
Source: Jackson and Sons. http://livericeindex.com/members/rice-price-history?stock=56&compare=30
30 In effect, the futures exchange is the seller to every buyer and buyer to every seller. Its clearinghouse guarantees contractperformance thereby eliminating counterparty risk.
International Experience: Forward and Futures Contracts
A forward contract is an agreement between two parties to trade a commodity at a fixed price sometime inthe future. It is used to complement a cash purchase of that commodity or the inputs used to produce thatcommodity. It includes the terms of the physical transfer of the commodity and the counterparty risk. Incontrast, a futures contract is a standardized agreement to buy or sell a commodity at a date in the futurethat is guaranteed by a futures exchange rather than a physical transfer of goods.30 Futures are usedprimarily to hedge against changes in price over the period of the futures contract.
Forward contracts are important for operators of third party storage. The storage operator buys rice whenfarmers want to sell, and stores it until the millers/exporters want to buy it. A farmer can deliver grain tothe operator for payment at a later date, at the price prevailing at that time. The operator takes ownershipof the grain and may sell it at any time before or after the date specified by the farmer. This is inherentlyrisky since commodity prices can change. The operator can reduce the risk by using forward contracts tosell grain not yet purchased or to anticipate the price that will be set by the farmers for grain alreadypurchase.
Future contracts are used to manage price risk by hedging against future changes in price. These are usedto offset cash positions including those in forward contracts or in delayed-pricing contracts. In order tointroduce forward contracts to mitigate risks associated with both price fluctuations and physical delivery,changes must be made in the current system of rice trade including development of: (i) an effective legalframework for enforcement of forward contracts; and (ii) storage capacity under private management thathas sufficient capacity to store the rice for the period required in forward contracts.
In order to introduce futures contracts to hedge risks of fluctuations in commodity process, further changesin the rice trading system are required and will take some time to accomplish. These include: (i) astandardized price benchmark with a mechanism for linking this to prices of different varieties and qualities

(this is a problem because of significant differences in variety and quality of both paddy and milled rice.Thai white rice: 5-percent-broken has been introduced as a benchmark on Thailand’s Agricultural FuturesExchange (AFET) but the prices do not track close to Vietnam’s white long-grain, 5-percent-broken, as shownin Figure 4.14); (ii) a sufficient volume of forward contracts to establish a real-time market price; (iii) sufficientprice volatility to create interest in hedging; (iv) a legal system to support the enforcement of futurecontracts; (v) very limited involvement of government in rice procurement and export; (vi) minimal subsidies,price supports, or other mechanisms that constrain competitive markets; and (vii) widespread disseminationof information on rice market conditions so as to insure transparency.
57
POLICY IMPLICATIONS FOR VIETNAM'S ECONOMIC GROWTH
600
575
550
525
500
475
450
425
400
375
Figure 4.14: Market Price for White Long Grain 5 % Broken
Notes: Blue Line: Thailand White Long Grain 5% Broken; Red line: Vietnam White Long Grain 5% Broken.
Source: Jackson and Sons, http://livericeindex.com/members/rice-price-history?stock=56&compare=30

58
TRADE FACILITATION, VALUE CREATION AND COMPETITIVENESS

5.1 Introduction
Coffee is a seasonal crop grown and is processed mainly in equatorial countries with tropical climates, suchas Vietnam, Indonesia, India, Colombia, Brazil, and Ethiopia. After expanding its production activities rapidlyin the 1990s, Vietnam has become the second largest coffee producer in the world, currently responsiblefor 13 percent of world production volumes, behind Brazil (33percent), and followed by Colombia andIndonesia (at approximately 7 percent and 6 percent of total world production, respectively).31 Arabica andRobusta are the two main variants of coffee, with Vietnam being the world’s largest producer of the latter.Arabica is grown at higher altitudes, is more sensitive to pre-harvest conditions, and is more valued thanRobusta, due to flavor. However, the higher caffeine content of Robusta means it is favored as a cheapsubstitute for commercial instant coffee blends. Approximately 70 percent of world export volume is rawcoffee beans to be processed into instant coffee, and 95 percent of Vietnam’s coffee product is unroastedRobusta bean also for this purpose. Vietnam’s marked growth in coffee production accounts for the increasein world trade and production in Robusta.
5.2 Production and Trade
As shown in Figure 5.1, Vietnam’s coffee sector has experienced rapid output growth, increasing at anaverage rate of approximately 12 percent per annum over the last 15 years. As a result, Vietnam’s share ofthe export market has grown considerably (approaching 17 percent) and export value has risen by anaverage of 25 percent per annum over the last 10 years. This growth accounts for most of the increase inworld production and trade in Robusta. Nearly all of Vietnam’s coffee exports are dry-processed green beansof relatively low quality. The remaining 5 percent are exported as ground, roasted or instant.
59
CHAPTER 5
COFFEE
31 2011/12 Crop Year (CY), International Coffee Organization (ICO).

EU 27
2000
100%90%80%70%60%50%40%30%20%
10%0%
2001 2002 2003 2004 2005 2006 2008 2009 20102007
United States ASEAN Japan China Others
EU 27
United States
ASEAN
Japan ChinaOthers
Vietnam exports to more than 70 countries and territories, including leading importers in the EU and NorthAmerica. The United States and the European Union are the main destinations for coffee exports, accountingfor nearly 50 percent of world export volumes and these markets also represent the main destination countriesfor Vietnam’s exports as well. Figure 5.2 shows the key destinations of Vietnam coffee export during the 2000-2010 period.
The Vietnamese Ministry of Agriculture and Rural Development (MARD) estimates that coffee exports fromVietnam reached 1.25 million tons in 2011, up 2.7 percent from 2010. The export price rose about 45.8 percentto US$2,193 per ton. For 2012, trade is expected to drop to 1.1 million tons, with revenues reaching US$2 billion,implying about US$1,820 per ton in FOB prices. According to UN Comtrade data (2010), Brazil remains far andaway the world’s largest coffee exporter, accounting for 20.54 percent of the total coffee exports in 2010. WhileBrazil produces both natural Arabica and Robusta, exports are mainly the higher value Arabica. Vietnam is thefour largest coffee exporter in 2010, with a 6.78 percent share of global coffee exports. As Figure 5.3 indicates,Vietnam maintains its position on the basis of volume, largely of the cheaper Robusta variety. Nevertheless,Vietnamese production growth remains impressive – from under 300,000 tons in 2002 to over one million tonsin 2011 (ITC 2012).
60
TRADE FACILITATION, VALUE CREATION AND COMPETITIVENESS
Figure 5.1: Vietnam Coffee Production and Export Value and World Coffee Prices
Source: FAO/World Bank.
Figure 5.2: Key Destination Markets for Vietnam Coffee Exports, 2001-2010
Source: UN Comtrade.

Coffee is mainly grown in the Northern mountain region and Central Highlands of Vietnam (Table 5.1). Thelatter area is well suited for growing Robusta and has provided large areas for planting and reasonable yields.The area of Robusta accounts for more than 95 percent of the total cultivated area. The region’s coffee areaand volume account for 91 percent of Vietnam’s coffee area and 93 percent of Vietnam’s coffee volume.Arabica is mainly grown in the Southern Central region and Northern mountain region due to their altitude,but these regions offer small available area and output.
High coffee prices in the 1990s prompted farmers to raze forest and rush into planting trees without suitableland for cultivation. These practices, coupled with excessive soil exploitation and the practice of harvestingunripe coffee beans, have reduced yields and quality and threaten sustainable development in the sector.Currently, 25-30 percent of the planted area, almost 140 thousand hectares, has old-growth coffee trees thatneed to be replaced. These factors will make it difficult to maintain the rapid growth in output.
With the increasing growth rate came problems with the quality of both the parchment (i.e., coffe beans
61
POLICY IMPLICATIONS FOR VIETNAM'S ECONOMIC GROWTH
Figure 5.3: Competitiveness of Coffee Exporters, 2011
Source: UN Comtrade/ITC.
Table 5.1: Coffee Production by Province, 2010
Source: GSO.
% M
arke
t sha
re b
y tu
os e
xpor
ted
% Market share by value
Germany, 10%
Vietnam, 7%
Brazil, 21%
35%
30%
25%
20%
15%
10%
5%
0%0% 10% 15% 20% 25%
-5%
Colombia, 4%
Belgium, 8%
Italia,5%
Switzerland, 4%
Province
Whole country
Dak-Lak
Lam-Dong
Gia-Lai
Dak-Nong
Kon-Tum
Central Highlands
Area (ha)
548,200
190,765
143,212
77,182
75,946
11,502
498,607
Volume (tons)
1,218,000
399,098
332,036
143,123
138,521
21,206
1,033,984
% of whole country
100
36.09
30.03
12.94
12.53
1.92
93.51

with the parchment-skin layer still on) and green beans. The former are graded in terms of sieve size andpercentage substandard. The quality is affected by poor sorting (size and color), post-harvest procedures(processing technology), and limited drying facilities.
In Vietnam, there are nearly 100 processing plants, with annual capacities ranging from 5,000 to 60,000 tonsof coffee beans. Most of the plants use dry processing with domestically-produced processing equipment.32
The output has relatively high proportions of black and broken beans as well as a high percentage ofimpurities. Also, the moisture content is high, creating problems with mold contamination. Contributingto the low quality is the fragmentation of the supply chain and the lack of coordination between mills andfarms. Another factor is the lack of working capital, which limits the scale of the collection activity and thepotential for backward integration from the processor to the farm.
5.3 Structure of the Coffee Industry
Vietnam’s main contribution to the coffee supply chain is at the primary level of farm production. Many ofthe country’s coffee farmers have land property rights and run small-to-medium sized family-operated farmsof 2 to 5 hectares. Another 10-15 percent of coffee-producing households are tenant farmers for state-runplantations and private companies. A third group of farmers do not have assigned property rights butcultivate unused or forested land. The households of the third group are a more affluent segment ofoperators and constitute more than 50 per cent of the coffee farming producers in Vietnam.
Harvesting and the post-harvest processing are largely undertaken by farming households themselves, andquality control is a critical issue at these stages. Generally speaking, the Vietnamese coffee sector followstwo main process paths post-harvest (Figure 5.4). In the first, coffee is simply harvested and traded as greenbeans that are then sold, usually through domestic middlemen, to international traders. These traders thensell to roasters who prepare the beans for sale to different retail outlets. When harvesting, Vietnamesefarmers often pluck all the berries on each branch, and do not distinguish between ripe berries and greenones in order to achieve higher productivity.
A majority of farms will put the beans through a drying process. This involves drying the coffee “cherries”(i.e., the berries of the coffee tree) in the sun for up to four weeks following harvest, remove the pulp layer,and the having the resulting parchment sent to the mills. The method yields about one ton of parchmentfrom about 4.5 tons of coffee cherries. It is also the favored method because it is relatively cheap and easy,and the product obtains a better price. Few farmers will have access to more reliable machines for post-harvest processing but the broad reliance on the sun-drying method can be problematic particularly inwetter harvest seasons as the possibility of mold can compromise the quality of the product and, in moresevere cases, result in toxic contamination of Ochratoxin (OTA).
The parchment is purchased at the farm-gate by collectors who provide road transport from the farm andsell it to the buying agents who then transport it to the mill. Green beans can then be extracted from theparchment. The buying agents also purchase recently-harvested cherries for delivery to mills that havecapacity for wet processing. The buying agents are private companies operating at the provincial or locallevel. Most have contracts with mills or are subsidiaries of companies owning mills.
As such, the principal transactions occurring in the coffee supply chain are: (i) purchase of parchment fromthe farm by the collector or buying agent, generally on a cash basis; (ii) sale of parchment by the buyingagent to the processor on a cash basis; and (iii) sale of the green beans to the foreign trader under FOB termswith an advance and sight draft.
62
TRADE FACILITATION, VALUE CREATION AND COMPETITIVENESS
32 For plants using wet processing, better quality equipment is imported from Brazil. Also various mills have introduced sortingequipment from Japan.

63
POLICY IMPLICATIONS FOR VIETNAM'S ECONOMIC GROWTH
Figure 5.4: Coffee Production Chain
Source: TTFA and Authors.
Table 5.2: Examples of Integration of Supply Chain Activities
Source: TTFA Survey and Authors.
The span of control of the exporters varies from simple trading of beans produced by others to totalintegration from plantation to retail outlet. The various opportunities for integration in the inbound andoutbound supply chains are shown in Table 5.2. The first column reflects the situation of most farms whilethe second applies to the few growers’ associations.
Grow & HarvestPrepare ParchmentPrepare Green BeansRefineExportTradeBlendDecaffeinateRoastPrepare InstantRetail ProductsRetail Beverage
(1)Farm-DryProcess
√√
(2)Coop-Wet
Process√√√
(4)Roaster
√√√
(5)Barista
√√√√√√
(6)IntegratedCoffee Co
√√√
√√√√√√√√
(7)Integrated
Food Co√√√
√√√√√√√√
(3)International
Trader
√√√√
Roaster
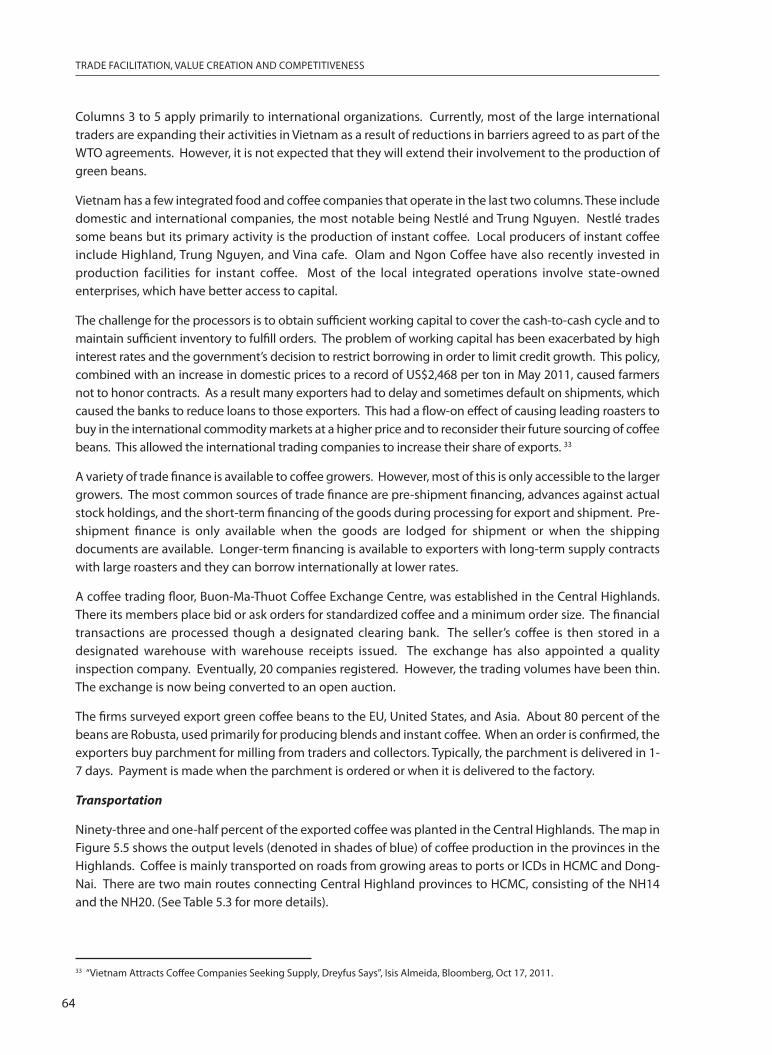
Columns 3 to 5 apply primarily to international organizations. Currently, most of the large internationaltraders are expanding their activities in Vietnam as a result of reductions in barriers agreed to as part of theWTO agreements. However, it is not expected that they will extend their involvement to the production ofgreen beans.
Vietnam has a few integrated food and coffee companies that operate in the last two columns. These includedomestic and international companies, the most notable being Nestlé and Trung Nguyen. Nestlé tradessome beans but its primary activity is the production of instant coffee. Local producers of instant coffeeinclude Highland, Trung Nguyen, and Vina cafe. Olam and Ngon Coffee have also recently invested inproduction facilities for instant coffee. Most of the local integrated operations involve state-ownedenterprises, which have better access to capital.
The challenge for the processors is to obtain sufficient working capital to cover the cash-to-cash cycle and tomaintain sufficient inventory to fulfill orders. The problem of working capital has been exacerbated by highinterest rates and the government’s decision to restrict borrowing in order to limit credit growth. This policy,combined with an increase in domestic prices to a record of US$2,468 per ton in May 2011, caused farmersnot to honor contracts. As a result many exporters had to delay and sometimes default on shipments, whichcaused the banks to reduce loans to those exporters. This had a flow-on effect of causing leading roasters tobuy in the international commodity markets at a higher price and to reconsider their future sourcing of coffeebeans. This allowed the international trading companies to increase their share of exports. 33
A variety of trade finance is available to coffee growers. However, most of this is only accessible to the largergrowers. The most common sources of trade finance are pre-shipment financing, advances against actualstock holdings, and the short-term financing of the goods during processing for export and shipment. Pre-shipment finance is only available when the goods are lodged for shipment or when the shippingdocuments are available. Longer-term financing is available to exporters with long-term supply contractswith large roasters and they can borrow internationally at lower rates.
A coffee trading floor, Buon-Ma-Thuot Coffee Exchange Centre, was established in the Central Highlands.There its members place bid or ask orders for standardized coffee and a minimum order size. The financialtransactions are processed though a designated clearing bank. The seller’s coffee is then stored in adesignated warehouse with warehouse receipts issued. The exchange has also appointed a qualityinspection company. Eventually, 20 companies registered. However, the trading volumes have been thin.The exchange is now being converted to an open auction.
The firms surveyed export green coffee beans to the EU, United States, and Asia. About 80 percent of thebeans are Robusta, used primarily for producing blends and instant coffee. When an order is confirmed, theexporters buy parchment for milling from traders and collectors. Typically, the parchment is delivered in 1-7 days. Payment is made when the parchment is ordered or when it is delivered to the factory.
Transportation
Ninety-three and one-half percent of the exported coffee was planted in the Central Highlands. The map inFigure 5.5 shows the output levels (denoted in shades of blue) of coffee production in the provinces in theHighlands. Coffee is mainly transported on roads from growing areas to ports or ICDs in HCMC and Dong-Nai. There are two main routes connecting Central Highland provinces to HCMC, consisting of the NH14and the NH20. (See Table 5.3 for more details).
64
TRADE FACILITATION, VALUE CREATION AND COMPETITIVENESS
33 “Vietnam Attracts Coffee Companies Seeking Supply, Dreyfus Says”, Isis Almeida, Bloomberg, Oct 17, 2011.

The 2010 survey found that 88.5 percent of exported coffee was shipped through ports in HCMC. As shownin the bar chart in Figure 5.5, in 2010, 67.4 percent of the total volume of exported coffee had been clearedby Vietnam Customs at seaports, 22.1 percent at ICDs in HCMC and Dong Nai, 0.2 percent at road bordergates, mainly to China, and 10 percent by other border gateways.
65
POLICY IMPLICATIONS FOR VIETNAM'S ECONOMIC GROWTH
Table 5.3: Main Domestic Transport Routes
Figure 5.5: Exported coffee Moverment Flow, 2010
Source: Freight flows data provided by TDSI.
Road
NH14
NH20
NH51
NH13
Section
Kon-Tum – Binh-Phuoc
Dong-Nai – Da-Lat
Dong-Nai – Vung-Tau
HCMC – Binh-Phuoc
Length
581
268
73.6
142
Grade
III
III, IV
I
III
Source: Corridor Analysis, TDSI 2012.
EXPORT VOLUME BY SEAGermany
18%
USA17%
Spain9%Italy
9%
Belgium6% Japan
6%
Korea4%
Others31%
SHARE OF EXPORT VALUE BY TRANSPORT MODE
0% 20% 40% 60% 80% 100%
Export
Border gate Seaport ICD Other
HCM City
Vung-Tau Sai-Gon
Da-Nang
LAO PDR
CAMBODIA
Quy Nhon
EXPORT VOLUME
EXPORT VALUE BY PROVINCE
EXPORT VOLUME
EXPORT FLOWS
100 MIL.USD
200 MIL.USD
300 MIL.USD
400 MIL.USD
500 MIL.USD
5,000 TEUs10,000 TEUs15,000 TEUs
10,000 TEUs

Traffic volumes on the main domestic transport roads are now at a moderate level, given their capacity of18,000 PCUs/day. Traffic surveys at Bao-Loc station (Km108+800 NH20) found traffic to be 9,000 PCUs/day.However, NH13 and NH1A, the connecting routes from NH14 and NH20 to HCMC, show large traffic volumes,especially those on NH1A. 2011 traffic data surveys show that at Dong-Nai station, the traffic volume wasover 150,000 PCUs/day, with more than 20,000 heavy over-3-axle trucks. When transiting to HCMC, vehiclesmainly travel along the Ha-Noi highway – Nguyen-Thi-Dinh road to Cat-Lai port, causing severe trafficcongestion on this road.
The costs of road transport from the Central Highlands to HCMC now range between 260-400 US$/TEU.Besides the standard operating costs, companies must pay additional costs at road control stations due tocharges for overloading, poor quality vehicles, etc. Transport time from the Central Highland provinces toHCMC is approximately two days. The time over which freight is stored at ICDs prior to loading onto a shipdepends on the shipping schedule and the volume of the export Bill of Lading.
Cat-Lai port is the main port for coffee exports. Vietnam's shipping routes for coffee exports includeinternational routes to European countries, to the United States and to Korea, Japan and other ASEAN countries,often using large ships over 10,000 DWT, with transshipping mainly at Singapore or in Hong Kong SAR(China) ports.
International shipping costs depend on the routes and the ship tonnage: from HCMC ports to the UnitedStates costs between 2200-2500 US$ per TEU; to Europe costs are between 1500-2500 US$ per TEU; and toKorea or Japan the cost is between 900-1200 US$ per TEU. Transport takes about 30-40 days to the UnitedStates, 25-35 days to the EU and about 7-10 days to Japan under normal conditions.
Figure 5.6 shows projected flows of coffee exported by 2020 based on the 2020 Coffee Export Strategy. Thestrategy focuses on increasing value-added processing of exported coffee products by enhancing the levelsof in-country processing, promoting investment by the processing industry from coffee beans to coffee end-products, and diversifying the types of coffee-related products and distribution channels.
The strategy made a forecast of the exported volume of coffee based on the total area of coffee plants(500,000 ha with productivity 2.4 ton per ha), and the total capacity of processing industry coffee (from120,000 to 130,000 ton products per year). It was forecasted that between 2011 and 2015, the export ofcoffee beans and processed coffee will increase at an average rate of 8.6 percent per year, with a value forexported coffee beans of 2500 US$ per ton. Exports will total 1.1-1.2 million tons per year, with an increasein value from US$1.85 billion in 2010 to US$2.8-3 billion in 2015. Between 2016 and 2020, the price ofexported coffee beans is forecasted to reach about US$3,000 per ton. It was projected that the export ofcoffee beans will reach around 0.9 million tons with a value of about US$2.7 billion, with an addition of 0.25million tons of roasted, ground and processed coffee with export value of about US$1.1 billion. Thus, thevalue of Vietnam’s exported coffee products will amount to around US$3.8 billion by 2020.
This projection is also based on increased value addition in the coffee supply chain and other industrypotential including the possibility to improve productivity of coffee plantations and enhancedcompetiveness of Vietnamese coffee products in the global market.
It was assumed that by 2020, road transportation will continue to be the sole means to carry the finishedcoffee product from producing provinces to main ports currently serving as key international gateways forexported coffee. As ports in Vung-Tau develop transshipment potential, it is expected that exported coffeewill be transported from storage in Bien-Hoa – Dong-Nai ICD via NH51 to these ports for export in the future.In addition, as planned in the Port Development Plan – Group No.3, it is expected that Quy-Nhon port willemerge as an additional gateway for export coffee; in this case, part of the exported coffee would betransported using the traffic route NH19 from Gia Lai to this port.
66
TRADE FACILITATION, VALUE CREATION AND COMPETITIVENESS

It is foreseen that the United States, Germany, Italy and Japan will remain the major destinations for Vietnam’scoffee through 2020. Vietnam is projected to maintain its market share for coffee exports in the 10 othermain countries and is expected to continue exporting to the 80 countries around the world which currentlyimport Vietnamese coffee.
67
POLICY IMPLICATIONS FOR VIETNAM'S ECONOMIC GROWTH
Figure 5.6: Exported Coffee Movement Flows by 2020
Source: Freight flows data provided by TDSI.
HCM City
Vung-Tau Sai-Gon
Da-Nang LAO PDR
CAMBODIA
Quy Nhon
EXPORT VALUE BY PROVINCE
EXPORT FLOWS
>60,000 TEUs
1,000 Mill.USD
1,000 Mill.USD
1,000 Mill.USD
International Gateway (primary)
International Gateway (secondary)
10,000 TEUs
20,000 TEUs
40,000 TEUs

5.4 Development Strategies for the Sector
The principal objective of Vietnam’s coffee trade over the last decade has been to increase its share of theglobal trade in Robusta by increasing both the area planted and the yield. The country has had remarkablesuccess in achieving this objective, but growth is expected to slow in the future. For example, the VietnamExport and Import Strategy to 2020 forecasts that export of coffee beans and processed coffee will slow to anaverage growth rate of 8.6 percent per year between 2011 and 2015. Going forward, it is recommendedthat the objective be changed to increasing value-addition exclusively rather than combining it with volume.This strategy would have four components: (i) increasing the quality of green bean exports; (ii) improvingcapacity in downstream processing of the beans; (iii) delivering value to farmers; and (iv) improving theperformance of the primary trade corridor.
The quality of Robusta, unlike Arabica, is less dependent on growing conditions and cultivars than on post-harvest processing and quality control.34 Therefore, there is considerable potential for productivityimprovements to the green bean product. This first component requires restructuring the inbound supplychain in order to: (i) increase the scale and efficiency of collection activities;35 (ii) simplify transactions andconvert from a system of spot market purchases of parchment to a system of contracts for procuringparchment and cherries; (iii) improve solar drying and increase the use of wet processing; and (iv) integratequality control activities (specifically sorting and grading) at critical points in the supply chain.
Complementing this effort would be changes in the outbound supply chain, including: (i) improving storageand inventory management; (ii) increasing order fulfillment; and (iii) requiring exporters to be millers.
The second component -- adding value through downstream processing -- would involve expansion in fourprocesses: roasting and blending, decaffeination, preparation of soluble coffee, and retailing. These wouldbe used for products sold in the domestic market and to neighboring countries, but would be less effectivefor sales to overseas markets. Nevertheless, the local markets are more accessible, the logistics are simplerand the cash-to-cash cycles are shorter. Foreign markets are more difficult because of the additionalinvestment required in marketing and distribution, the higher level of competition from major internationalcompanies, and the risk associated with operating in a foreign business environment.
The third component -- delivering value to farmers -- is necessary to ensure that the farmers do not switchto other crops that appear to offer more profits, since it is difficult to switch in and out of coffee production.36
It requires simplifying the supply chain linking farms to mills, introducing production contracts in place ofspot purchases, and providing the farmer with better information on opportunities to improve productionand the market prices for cherry and parchment.
The final component includes additional improvements in transport and trade facilitation. Although therehave been significant improvements in recent years, more are needed to reduce delivery times and costs,and improve reliability of delivery. Rather than approach these as separate initiatives, an effort should bemade to provide an efficient corridor, linking the farms and mills with terminals for general cargo andcontainer shipments. This could include enhanced procedures for testing and clearing exports, which couldbe performed at the mill rather than at the port.
68
TRADE FACILITATION, VALUE CREATION AND COMPETITIVENESS
34 There is some distinction between Robusta beans based on the origin. For example, there is current preference for African (Uganda,Congo, Guinea India, Madagascar) and Asian (India and Laos) beans, but it is unclear if this is related to taste or to scarcity.
35 Implicit in this component is to encourage the formation of growers associations and large-scale agricultural producers, which wouldinclude coffee plantations, however, this is will occur naturally need not be given priority.
36 Coffee plants require 5-7 years after planting to achieve full production.

5.5 Strategy Implementation
Efforts to implement this strategy would build on current private sector initiatives to improve the quality ofthe beans exported and the downstream processing of the coffee beans. The government could contributeto this effort by introducing a sector policy that focuses on value addition and by coordinating with theprivate sector in introducing financial instruments to address the requirements for capital investment andadditional working capital.
The principal challenge will be to restructure the supply chains linking the farms and the mills, beginningwith changes in procurement of parchment and cherries. The current system of small collectors purchasingat the farm-gate needs to be replaced with farmers groups selling both cherries and parchment directly tothe mills. The proportion of cherries would increase together with an increase in wet processing while thequality of the parchment would increase through improved solar drying and pulping. The mills wouldintroduce contracts to ensure regular supply and strengthen enforcement of these contracts through priceslinked to the spot market and financial obligations secured through domestic letters of credit. The millscould also provide technical assistance for replanting older plants and increasing the yield of existing plants.
Capital investments for upgrading the processing of parchment, increasing the capacity for wet processingof cherries, and introducing steam treatment for green beans37 could begin prior to restructuring theinbound supply chain, but major investments should only occur when the restructuring is well underway.At this point, the mills would also need to develop new distribution channels to supply roasters and retailerswith green beans throughout the year. Capital investment for downstream processing, to produce roastedblends and soluble coffee for retail outlets in local and regional markets, could occur on a parallel track.
Other financial instruments that could help develop the sector include: (i) lines of credit for domesticexporters backed by non-negotiable Letters of Credit from the buyer or warehouse credits; (ii) loans togrowers’ associations to improve post-harvest processing, encourage replacement of older cultivars, andpromote efficient use of agro-inputs; (iii) domestic letters of credit used to guarantee delivery to the millsby the growers’ associations; and (iv) commodity futures to be used together with contracts for green beansthat include a clause for adjustment of the selling price.
A possible source for these instruments is on-lending from Multinational Development Bank (MDBs).38
Other initiatives that will require government participation are: (i) selection of land suitable for coffeegrowing to be included in the national land allocation plan as agricultural land; (ii) enforcement ofinternational standards for coffee exports in a manner that will facilitate the clearance of coffee exports.This would include the use of certified private testing labs in the approval procedure; and (iii) identificationand elimination of key bottlenecks along the corridors that serve the coffee trade as soon as possible.
69
POLICY IMPLICATIONS FOR VIETNAM'S ECONOMIC GROWTH
37 Steam-treatment has increasingly been used to treat Robusta green beans to make a milder coffee with some 'acidity'. This allowsroasters increase the percentage of Robusta in their blends.
38 MDBs includes World Bank, Asian Development Bank, and Inter- American Development Bank, An example is the proposed US$55million loan facility to be provided by IFC to the commodity trader EcomAgro industrial. This would be used to finance workingcapital for inventory and advances to suppliers for its coffee operations in Africa and Asia and its cocoa operations in Indonesia andPapua New Guinea.

70
TRADE FACILITATION, VALUE CREATION AND COMPETITIVENESS

6.1 Introduction
Seafood is one of Vietnam’s six major exported commodities, and is an important contributor to economicgrowth and incomes, nutrition and rural development. In 2010, the value of exported seafood was aboveUS$5 billion, more than 1.5 times its value in 2006. The growth of the industry is broadly consistent withglobal trends, namely the rise of fish farming around the Mekong Delta and some inland areas, and thedecline of marine capture due to the effects of overfishing. In 1990, Vietnam represented a mere fraction ofthe world’s aquaculture output but has grown that share to over 3 percent in 2010. The success of its seafoodcultivation is in part due to a targeting of specific species for export. Tiger Shrimp and Pangasius representtwo-thirds of production and value; however, this concentrated dependence on two species can also raiseeconomic risks.
6.2 Production and Trade
Vietnam’s strong growth in production of seafood over the last two decades is attributable to the increasedactivity in aquaculture. In 2010, 52 percent of the 5.2 million tons of fish and shellfish produced werecultivated in aqua-farms (Figure 6.1).
71
CHAPTER 6
SEAFOOD

The percentage of production that was exported had been declining up to 1997, when it was only 7 percent.Since then, the value of exports has increased eight-fold. The percentage exported reached 26 percent in2010, when 1.35 million tons with a value of US$5.03 billion were exported. These exports included US$2.11billion of shrimp, US$1.44 billion of Pangasius (i.e., Striped Catfish), US$0.49 billion of mollusk, and US$0.29billion of tuna.
While the growth in exports of Pangasius was steady up through 2008, it dropped off as a result of traderestrictions in major markets. The exports of shrimp have also fluctuated due to various factors discussedbelow. Vietnam ships its seafood products to over 160 countries but three major importers accounted for61 percent of the value, as shown in Figure 6.2, with Germany and the UK being the most prominentEuropean destination markets.
72
TRADE FACILITATION, VALUE CREATION AND COMPETITIVENESS
Figure 6.1: Vietnamese Seafood Production (by Source), 1990-2010
Source: FAO.
Figure 6.2: Key Destination Markets for Seafood Exports (by Value), 2000-2012
Source: UN Comtrade.
100%
90%
80%
70%
60%
50%
40%
30%
20%
10%
0%
2000 2001 2002 2003 2004 2005 2006 2007 2008 2009 2010
EU 27
EU 27
United States
United States
China
China
Japan
Japan
Australia
Australia
Korea, Rep.
Korea, Rep.
Others
Others
ASEAN
ASEAN

Most of the growth has been as a result of the increase in production of white-legged shrimp, which wereonly recently introduced. Vietnam has traditionally produced Black Tiger shrimp, but the White-Leggedshrimp provide better income more quickly.39 In 2010, exports rose to 241 thousand tons due in part tothe collapse of Mexican exports following the oil spill and the global recovery in the demand. The increasein the value of shrimp exports was more dramatic because of a rapid run-up in the price of shrimp. As aresult, shrimp became the major source of revenue from seafood but are a much smaller contributor in termsof volume (Figure 6.3).
Japan is the leading destination for shrimp (Figure 6.4): approximately 30 percent of exports are shippedthere and Vietnam has a 20 percent market share in Japan despite strong competition from Indonesia,Thailand, India, and China. Another major destination for shrimp is the United States, and Europe is a growingmarket as a result of declining domestic fisheries industries. Most of the demand is for processed shrimp(i.e., peeled and/or deveined). About 65 percent of the total shrimp exports are either fresh, frozen, or driedwhereas 35 percent are processed. Competition focuses on quality, including freshness and freedom frombacterial contamination.
Vietnam is by far the world’s largest producer of Pangasius, a popular low-value generic fish product. Otherproducers are Thailand, Cambodia, Lao People's Democratic Republic, Myanmar, Bangladesh and China --but Vietnam produces about 90 percent of the global production of Pangasius. Its production increasedfrom about 160 thousand tons in 2003 to 1.3 million tons in 2008 and has since fluctuated between 1 and1.4 million tons. Most of the production is exported as fillets, with current annual volumes fluctuating around700 thousand tons. Approximately one-third of all Pangasius exports are shipped to the EU but otherwisethe import markets are quite diversified with the top ten importing countries accounting for only 43.5percent of tonnage and 42.5 percent of value.
73
POLICY IMPLICATIONS FOR VIETNAM'S ECONOMIC GROWTH
Figure 6.3: Shrimp and Pangasius Export Volumes and Values, 2003-2009
Source: FAO.
39 The quality of Asian white shrimp (P. Vannamei) is the same as Black tiger shrimp (P. Monodon), but the former is more profitable.As the result, Viet Nam’s black tiger shrimp is in danger of being weeded out from import contracts as has happened in Thailand.

An increasing proportion of Vietnam’s processed seafood product is imported from Scandinavia as frozenwhole fish then processed and then re-exported to East Asia. This trade has been important to increasingthe level of utilization of factories that were unable to secure sufficient supplies of local seafood.
6.3 Structure of the Seafood Industry
Vietnam’s seafood industry is highly competitive. There are several thousands of farmers engaged inaquaculture together with a large number of traders purchasing fish at the farm-gate. There are also asignificant number of fishermen still engaged in maritime fishing. The raw material intended for export isprocessed at approximately 455 plants. Margins are thin throughout the seafood supply chain and there issignificant excess capacity due to the limited local supply.40 In order to increase plant utilization, a numberof processors import whole fish from Northern Europe for export to East Asia.
The structure of the inbound and outbound supply chains for the sector is shown in Figure 6.5, which depictsthe major activities for the three major sources of inputs and five distribution channels for the outputs. Theprincipal intermediary in the supply chain is the collector -- who arranges the procurement and delivery ofmarine and freshwater catch from the wholesale market and aquaculture production from the farm;however, it is the processors that are the focal points and most powerful actors in seafood production,accounting for three quarters of the total net value added in the chain.41
74
TRADE FACILITATION, VALUE CREATION AND COMPETITIVENESS
40 One estimate is that plants are operating at about 30 percent of capacity.41 Bush, S., Khiem, N., and Sinh, Le (2009). ‘Governing the environmental and social dimensions of Pangasius production in Vietnam: a
Review’, Aquaculture Economics and Management13: 4: 271-293.
Figure 6.4: Shrimp Destinations by Value, 2009
Source: UN Comtrade / ITC.
Taiwan (China)

Ready to eat
There are a large number of state-owned processing plants, many owned by provincial People’s Committees.However, the proportion of privately-owned factories is increasing and most of the large plants are privatelyowned. Foreign investors come from northern Europe as well as from the Asia Pacific region, includingChina. There is also foreign investment in upstream activities, for example CP Foods of Thailand has investedin farms and feed plants for shrimp. There are also investments from Japan in state-of-the-art premises toproduce high-end seafood for the Japanese market.42
Most exporters are owners of processing plants. However, there are still a sizeable number of traders. In2010, there were 341 shrimp exporters (including 149 White-Legged shrimp exporters and 163 Black Tigershrimp ones). For Pangasius, there were 290 exporters shipping to 140 markets. The ten largest exportersship approximately 13 percent of the export tonnage, mostly of which are higher value products, andaccount for about 20 percent of the value.
Most of the exports are sold to foreign wholesalers and retailers in a wide range of countries. The wholesalersare generally limited to specific geographical areas while the seafood retailers are small to mediumenterprises and are not part of the larger chains. As a result, the distribution of exports is highly fragmented.
Competition among suppliers is based on quality and cost of production. The price of raw materials typicallyaccounts for 70-90 percent of the cost of producing the exported product. The price for the exports is basedon international prices. Thus, a small change in the cost or the quality of the raw material has a significant
75
POLICY IMPLICATIONS FOR VIETNAM'S ECONOMIC GROWTH
42 Mike Urch, SeafoodSource.com, 26 September, 2011.
Figure 6.5: Supply Chain for Seafood Exports
Source: TTFA Survey and Authors.

impact on competitive advantage in the world market. The challenge for the fish farmers and fishermen isto continually increase yields through more efficient use of inputs and reduction in post-harvest losses,while the challenge for the processors is to deliver quality and meet health standards at a competitive price.
The business model used by the processing plants is that of a stand-alone production facility, which can bedifferentiated by the type of seafood they process, the source of their inputs, the markets to which they sell,their contractual relationship with the fish farmers and fisherman, and the extent of processing as shown inthe matrix in Table 6.1 below.
The processor produces seafood ready for sale at grocery outlets and food services or semi-finished productsto be further processed just prior to retail sale. The larger processors do their own marketing and sales whilethe smaller processors rely on exporters. Exporters are also used to reduce the commercial risk and mitigateor quarantine health risks for the processors.
The involvement of the processors in the activities of their inbound and outbound supply chains varies. Onthe inbound side, processors generally purchase raw material from collectors under their employment orwho operate as independent buyers. For marine catch, the collectors purchase the fish at the wholesalemarket but may also contract boats to secure their catch. For aquaculture, some of the larger plants establishsupply contracts with larger farms or farmer groups and in some cases establish their own farms. For theimports of frozen whole fish, plants have long-term contracts with their foreign suppliers.
The involvement of the plants in the outbound supply chain is generally limited to loading the frozenproducts into containers and arranging for transport to the loading port. Some of the larger, foreign-ownedprocessing plants are also involved in arranging international transport, downstream processing, anddistribution, especially for shipments to East Asia.
The firms compete in terms of both quality and price. In order to increase trade volumes, they are expandinginto new markets and developing new distribution channels. To increase value, they plan to invest in newequipment and to diversify the species they process. There is also interest in exporting ready-to-eat seafoodbut as of yet, only one firm that exported table-ready (pre-cooked) seafood was identified.
6.3.1 Transportation
Figure 6.6 shows traffic flows of seafood. The Mekong Delta is the largest seafood production region inVietnam, accounting for 72 percent of production from hatcheries and 41 percent of seafood catches. TheNorth Central Coastal region accounts for 39 percent of catches. The Mekong Delta is also the focal area forseafood export enterprises, accounting for 70 percent of the total exported volume from Vietnam. Provinceshaving the highest seafood export values in 2010 were Ca-Mau, Soc-Trang, Can-Tho, Dong-Thap, and HCMC.
76
TRADE FACILITATION, VALUE CREATION AND COMPETITIVENESS

Broadly speaking, exported seafood is mainly transported by road between the Mekong Delta and HCMCand the Central region to HCMC and mainly shipped by sea. In 2010, 91 percent of the total exported seafoodwas shipped through ports in HCMC, 4.6 percent of the total was shipped through other ports such as Hai-Phong, Da-Nang, Quy-Nhon, etc., 1.8 percent by air via Tan-Son-Nhat International Airport, and 2.6 percentvia road through border gates in Quang-Ninh and other areas.43 (See the bar chart in Figure 6.6).
Table 6.1 shows the domestic traffic routes for exported seafood. The section of NH1A from Can-Tho toHCMC is the most important and has very high traffic volume. Survey data from 2010 showed that at Tan-An station, the traffic volume was 56,700 PCUs per day. Although the road had been widened to Category2 (4 lanes), in rush hours the road was overloaded. The opening of the HCMC – Trung-Luong expresswayhas contributed to a reduction in traffic jams on NH1A, but the road tolls per vehicle per km are consideredquite high. In order to reduce costs, heavy trucks therefore travel on NH1A, causing traffic jams. The Nguyen-Van-Linh road – Phu-My Bridge and the Ha-Noi highway – Nguyen-Thi-Dinh road connecting to the NH1Afrom the Mekong Delta and the Central region going to Cat-Lai port are often congested, increasing thedelivery time for transiting freight to the port.
77
POLICY IMPLICATIONS FOR VIETNAM'S ECONOMIC GROWTH
Figure 6.6: Traffic Flows of Seafood
Source: Freight flows data provided by TDSI.
43 According to the General Department of Customs of Vietnam.
EXPORT VALUE PROVINCE
EXPORT VOLUME BY SEA
EU23%
USA19%
Japan18%
Other40%
SHARE OF EXPORT VALUE BY TRANSPORT MODE
0% 20% 40% 60% 80% 100%
Export
Airport Border gate Seaport ICD
HCM City
Vung-Tau Sai-Gon
Da-Nang
LAO PDR
CAMBODIA
Quy Nhon
EXPORT VOLUME
200 MIL.USD300 MIL.USD400 MIL.USD> 500 MIL.USD
100 MIL.USD
20.000 TEUs
20.000 TEUs
30.000 TEUs
10.000 TEUsEXPORT FLOWS
EXPORT VALUE BY PROVINCE

After being processed at factories mainly in the Mekong Delta, exported seafood is transported by freezertrucks to the stores located HCMC, and containerized for transport to the ports. Only small volumes ofseafood products from the area near HCMC are directly transported by freezer containers to the ports forshipment. Transport costs from the Mekong Delta to storage facilities in HCMC are between 15 to 20 US$per ton depending on the distance. Transport costs from the storage facility to the port are about 200-250US$ per TEU. Travel time from Ca Mau to HCMC is about 10-12 hours.
The major destinations for Vietnam’s exported seafood are the EU (26 percent), Japan (18 percent), the USA(17 percent), and Korea (7 percent). The main international shipping routes from ports in HCMC are to Europe,the United States, and to Japan - Korea. To Europe and the United States, large ships with capacity over 10,000tons are often used, transshipped through Singapore or Hong Kong SAR (China). This result in longer traveltime and higher travel cost compare to no-transshipment traffic routes. It takes about 30-40 days to reachthe United States, about 25 - 35 days to Europe, and about 7-10 days to Japan or Korea. International seatransport costs depend on the routes and the ship tonnage: it costs between 2200-2500 US$ per TEU fromHCMC ports to the United States, 1500-2500 US$ per TEU to Europe, and 900-1200 US$ per TEU to Korea, orJapan.
6.3.2 Forecast for Seafood Export
According to the 2020 Vietnam Export and Import Strategy and the 2020 Seafood Industry DevelopmentStrategy, export-based seafood development will focus on new high-quality products, more-value-addedproducts, developing and protecting brand names, diversifying markets to disperse risks, dealing with tradebarriers, and protecting fair competition.
Vietnam’s seafood volume is projected to increase by an average rate of 6-7 percent per year in the periodfrom 2011-2015. The total volume is expected to increase from 5.2 million tons in 2010 to 7-7.2 million tonsby 2015. During the period from 2016-2020, seafood volume is forecasted to increase, on average, about 5percent per year, accompanied by a sizable increase in the rate of frozen and canned seafood productionand export. Currently, the main difficulties in the seafood sector are that other countries are applying tradeprotection actions, technical barriers, and strict quarantines. Additionally, foreign countries regularly issuenew and stricter standards on antibiotic residues and food hygiene safety. Weaknesses in internationalmarketing and lack of qualified managers as well as labor are also problems for the seafood sector.
With regards to seafood production and export from the delta and coastal regions, the goals of the 2020plan are to maintain the size of the fishing areas and also to keep stable the population of fish in the wild.In the Red River Delta region, the primary goal is to develop industrial hatching areas, while promoting
78
TRADE FACILITATION, VALUE CREATION AND COMPETITIVENESS
Table 6.1: Main Domestic Transport Routes
Source: Corridor Analysis, TDSI 2012.
NH
NH30
NH61
NH80
NH91
Section
HCMC – Ca-Mau Section
Thanh-Hoa – HCMC
Dong-Thap – Tien Giang
Hau-Giang – Kien-Giang
My-Thuan Bridge – Ha-Tien
Can-Tho – An-Giang
Length (km)
379
1588
119
96
217
142
Grade
I - III
I-V
III
III - V
IV
III
NH1A

79
POLICY IMPLICATIONS FOR VIETNAM'S ECONOMIC GROWTH
traditional fresh water and brackish water fishing (Figure 6.7). In the Northern Central and Coastal regionthe main goals are to maintain the development of fresh and brackish water aquaculture in estuaries, coastal,and swamp areas and to also develop a Vietnamese tuna brand name. The South East region’s goal is todevelop seafood hatcheries on the sea and in coastal areas and islands. The goals for the Mekong Deltaregion are to continue developing strong aquaculture capacity and to increase production efficiency byapplying advanced technology and new models and standards including Good Aquaculture Practices (GAP),Better Management Practices (BMP), and Code of Conduct for Responsible Aquaculture (CoC).
The overall objectives for Vietnam 2020 are to maintain large market share in the EU, the United States,Japan, and Russia and to expand to other markets to gain market share in China, Korea, the Middle East,Canada, Australia, East Europe, Central America and South America. Thus, production for seafood exportswill be mainly concentrated in the Mekong Delta and the Northern Central Coastal region. However,transportation routes will change due to new infrastructure development of specified port complexes. It isexpected that by 2020, the capacity of Da-Nang and Quy-Nhon ports will increase to meet the export needsof the Central region, reducing travel time and transport costs from the Northern Central Coastal region toHCMC for exports.
In addition, with the development of the Vung-Tau port complex into an international container transit port,it is projected that a significant flow of goods would come from the provinces of the Central Coastal regionand from HCMC via NH51 to the ports in Vung-Tau for export.
6.4 Development Strategies
The seafood industry is the third largest contributor to the country’s trade and generates a substantialamount of employment, especially in rural areas. The sector experienced strong growth over the last decadethrough expansion of farming activities as well as development of processing plants and diversification intonew markets. However, in the future, it will be important to consider environmental constraints onexpansion of both maritime capture and aquaculture. Limits on sustainable yields are already restrictingthe growth of exports of maritime capture and have led to the import of whole frozen fish to meet thedemands of the fish factories.
Other difficulties for the sector have been regulatory: trade protections, technical barriers, strict quarantineand new stricter standards on antibiotic residues and food hygiene safety present continuing challenges.The lack of production materials and knowledge is also problematic where there has not been a formalconnection (financial advance, better understanding of product requirements) between primary producersand processors.
The Vietnam Export and Import Strategy to 2020 and Seafood Industry Development Strategy to 2020 projectthat export volumes will increase at the average rate of 6-7 percent per year in the period between 2011and 2015, and slow moderately to 5 percent per year in the next five-year period to 2020. By 2020, exportedcatfish and shrimp values are estimated to be US$3.6 billion and US$3.2 billion, respectively.
The strategies have also identified a number of focus areas for sector development. These include focusingon new higher-quality and more-value-added products, the development and protection of Vietnam brandsand reputation, diversifying markets to disperse risks, overcoming trade barriers, and promoting faircompetition. Maintaining the sector’s growth momentum is also a priority, with directives to work on meansof sustainable development such as renewable resources, fisher safety, and the reduction of coastal andoffshore fishing.

80
TRADE FACILITATION, VALUE CREATION AND COMPETITIVENESS
HCM City
Ha-Noi
Hai-Phong
Vung-Tau Sai-Gon
LAO PDR
CAMBODIA
CHINA
Can-Tho
Quy Nhon
EXPORT VALUE BY PROVINCE
1,000 Mill. USD
EXPORT FLOWS
2,000 Mill. USD
4,000 Mill. USD
>6,000 Mill. USD
20,000 TEUs
40,000 TEUs
>60,000 TEUs
International Gateway (primary)
International Gateway (secondary)
Da-Nang
Figure 6.7: Exported Seafood Movement Flows by 2020
Source: Freight flows data provided by TDSI.

Even with environmental pressures, there is considerable potential for growth in the medium term foraquaculture. This would primarily be through improved management of fish farms, better selection ofspecies for breeding, and selective use of cold chain technology rather than through expansion in thenumber of farms. Also the transition from Black Tiger shrimp to White-Legged shrimp has begun in orderto increase both yields and returns to farmers.
At the same time, there is considerable potential for increasing the value of exported seafood throughadditional processing and selection of new distribution channels. Therefore, the primary objective for theseafood trade should be to increase the value of exports and the returns to the fish farmers rather than toincrease the volume of exports or employment in the industry.
The strategy for accomplishing this objective should be demand-driven and focused on how the market forseafood is changing. In this regard, two trends are important. First, the regulatory environment is becomingincreasingly complex with health standards evolving rapidly together with accountability throughtraceability. Second, retail chains for both groceries and food services increasingly dominate the distributionchannels. In addition to the health standards, they have strict requirements in terms of scale of production,uniformity of quality and packaging.
6.5 Strategy Implementation
The Vietnamese seafood industry can address these trends by restructuring the inbound supply chainslinking the farms and fish factories. This could include three parallel activities: (i) integrating controls forhealth standards into the supply chain;44 (ii) improving management of aquaculture to provide a morereliable supply of fresh seafood and accommodate larger orders; and (iii) introducing value-added processingand diversifying products in order to increase revenue yield from fresh seafood.
The first requires greater collaboration between the industry and Government to improve the process oftesting and certification. The private sector should assume greater responsibility for monitoring the qualityof seafood moving through the supply chain and performing the tests required for certification. Governmentcould then focus on general oversight of the testing procedures. This activity would build on the increasingapplication of Hazard Analysis and Critical Control Points (HACCP) systems management in processing plantsas well as the adoption of various certification programs based on international standards.
To provide more efficient and effective phyto-sanitary inspections, the responsibility for testing should betransferred to local laboratories that are internationally certified and that offer fee-based tests in acompetitive environment. The government should limit its efforts to perform random inspections basedon a risk-management approach and focus on working with the industry to introduce basic inspectioncapabilities at the farm level and eventually at the nurseries and hatcheries.
The second activity requires a change in the relationship between the farmers and the factories, in particularmore use of contract farming arrangements. This is necessary to ensure a regular supply of inputs,implement good agricultural practices, and facilitate monitoring of the quality and hygiene of seafoodmoving through the supply chain. It can also be used to allow factories to accept larger orders. This wouldaccelerate the current trend away from procuring fresh seafood through a network of traders who makespot market purchases from a large number of small farms to the use of supply contracts with a limitednumber of reliable suppliers.
The third requires investment in processing plants to enhance downstream processing and diversification
81
POLICY IMPLICATIONS FOR VIETNAM'S ECONOMIC GROWTH
44 Diseases in the Delta have affected about 25 percent of the area under aquaculture.

of distribution channels to serve niches in both grocery and food services markets. This has already begunwith the exports of shrimp in individual, ready-to-eat portions, but additional market research is needed toidentify other opportunities. It is also necessary to consider the additional labor skills required.
At the same time, the industry needs to strengthen the capabilities of its members in supply chainmanagement, improve the contractual arrangements between farmers and factories, and increase thetransparency of the supply chains. The last is needed not only to improve coordination among theparticipants in the seafood supply chain but also to improve the performance of aquaculture. To accomplishthis, the seafood industry needs to work with relevant government agencies and research institutions toestablish an information portal easily and freely accessible through the internet. This could also provideSMS services to farmers. This portal could provide information in five areas: (i) market indicators, includingprices for inputs to aquaculture, current market prices for different categories of seafood, and internationalprices for standard seafood products; (ii) environmental information including weather forecasts; (iii)regulatory information including new health and trade regulations for Vietnam and for major tradingpartners; (iv) new techniques and efforts to improve control of hygiene and quality and meet internationalstandards; and (v) programs and events relevant to the industry.
It would offer current information from various data feeds and also maintain a searchable archive of articlesand research papers relevant to the Vietnamese seafood industry.
The government’s role in these efforts should begin with the preparation of a common vision and policy incollaboration with Vietnam Association of Seafood Exporters and Producers (VASEP) and other industry-related associations. This collaboration could extend to funding market research to identify market nichesfor higher-value seafood exports and distribution channels that serve these niches. Following on this,individual firms could be encouraged to conduct more targeted product studies.
The most important role for Government remains the development and enforcement of regulations toensure the quality and safety of the country’s seafood exports. However, as suggested above, this shouldbe a joint effort with the private sector. A related role of Government could be to encourage the principalimporting countries to establish local offices for pre-shipment inspections.
Another important government initiative is to take a proactive approach towards technical barriers to trade(TBTs), using local and international research to support the country’s position in trade negotiations as wellas in cases brought to the attention of the WTO. This will not only prevent some of the more severefluctuations in demand, which can have a devastating effect on the fish farming community, but alsostrengthen the country’s reputation as a reliable supplier.
Finally, the government should continue funding research on species and farming techniques to increaseyields and reduce the threat of disease.
82
TRADE FACILITATION, VALUE CREATION AND COMPETITIVENESS

REFERENCES
Dang Kim Son (2010). Highlights of Vietnam Coffee Sector. Ministry of Agriculture and Rural Development,Institute of Policy and Strategy for Agriculture and Rural Development, Vietnam.
Ho Chi Minh University of Economic (2011). 10-sector Study. Ho Chi Minh.
Hsuing, You-tien. (1999). “Trading Companies in Taiwan’s Fashion Shoe Networks”, Journal of InternationalEconomics, 48: 101–120
Lu-Lin Cheng (1997). Embedded Competitiveness: Taiwan’s Shifting Role in International Footwear SourcingNetworks. Duke University. Durham, U.S.
Ministry of Industry and Commerce (2010). Report on Competitiveness Assessment in 10 sectors. MIC, Hanoi.
National Committee for International Economic Cooperation (NCIEC) Office (2012). Institutional Analysis onTrade Facilitation. Hanoi.
Nguyen Cong Thanh and Baldeo Singh (2006). Trend in Rice Production and Export in Vietnam. OMONRICEJournal 14: p111-123.
Porter, M.E. (2010). The 2010 Vietnam Competitiveness. Havard Business School, U.S.
Techakanont, K. (2011). Thailand Automotive Parts Industry, Intermediate Goods Trade in Eat Asia: EconomicDeepening Through FRAs/EPAs, BRC Research Report No 5, Bangkok, 2011.
Thai Agricultural Standard: TAS 4000-2003 Thai Hom Mali Rice, National Bureau of Agricultural Commodityand Food Standards, Ministry of Agriculture and Cooperatives, ICS 67.060, ISBN 974-403-194-8.
Transport Development and Strategy Institute (2012). Corridor Study for Trade and Transport Facilitation.Ministry of Transport, Hanoi.
University of Economics of Ho Chi Minh City (2008). Industrialization Strategy of Vietnam toward 2020. UoE.Ho Chi Minh.
University of Economics of Ho Chi Minh City (2012). Final reports on Apparels, Footwear, Electronics, Coffee,Rice and Seafood. UoE, Ho Chi Minh.
83
POLICY IMPLICATIONS FOR VIETNAM'S ECONOMIC GROWTH

TRADE FACILITATION, VALUE CREATION AND COMPETITIVENESS
Publishing License No: 173-2013/CXB/314-217/LĐ and QĐXB No: 340 QĐLK-LĐ Issued on 25 June 2013.