trade facilitation and paperless trade implementation … facilitation... · nations’ regional...
TRANSCRIPT
Trade Facilitation and Paperless TradeImplementation in ASEANResults of the UN Global Survey 2017

The Economic and Social Commission for Asia and the Pacific (ESCAP) serves as the United Nations’ regional hub promoting cooperation among countries to achieve inclusive and sustainable development. The largest regional intergovernmental platform with 53 Member States and 9 associate members, ESCAP has emerged as a strong regional think-tank offering countries sound analytical products that shed insight into the evolving economic, social and environmental dynamics of the region. The Commission’s strategic focus is to deliver on the 2030 Agenda for Sustainable Development, which is reinforced and deepened by promoting regional cooperation and integration to advance responses to shared vulnerabilities, connectivity, financial cooperation and market integration. ESCAP’s research and analysis coupled with its policy advisory services, capacity building and technical assistance to governments aims to support countries’ sustainable and inclusive development ambitions.

Trade Facilitation and Paperless TradeImplementation in ASEANResults of the UN Global Survey 2017
ii
TRADE FACIlITATION AND PAPERlESS TRADE IMPlEMENTATION IN ASEAN
United Nations publicationCopyright © United Nations 2017All rights reservedPrinted in ThailandST/ESCAP/2805
For further information on this publication, please contact:Ms. Mia MikicDirectorTrade, Investment and Innovation DivisionUNESCAPRajadamnern Nok AvenueBangkok 10200, ThailandFax: (+66-2) 288-1027, 288-3066e-mail: [email protected]
Reference to dollars ($) are to United States dollars unless otherwise stated.
The designations employed and the presentation of the material in this publication do not imply the expression of any opinion whatsoever on the part of the Secretariat of the United Nations concerning the legal status of any country, territory, city or area, or of its authorities, or concerning the delimitation of its frontiers or boundaries.
Where the designation “country or area” appears, it covers countries, territories, cities or areas.
Bibliographical and other references have, wherever possible, been verified. The United Nations bears no responsibility for the availability or functioning of URls.
The views expressed in this publication are those of the authors or case study contributors and do not necessarily reflect the views of the United Nations.
The opinions, figures and estimates set forth in this publication are the responsibility of the authors and contributors, and should not necessarily be considered as reflecting the views or carrying the endorsement of the United Nations. Any errors are the responsibility of the authors.
Mention of firm names and commercial products does not imply the endorsement of the United Nations, and any failure to mention a particular enterprise, commercial product or process is not a sign of disapproval.
The use of the publication for any commercial purposes is prohibited, unless permission is first obtained from the Secretary of the Publication Board, United Nations, New York. Request for permission should state the purpose and the extent of reproduction.
This publication has been issued without formal editing.

III
Executive SummaryReducing trade costs is essential for developing economies to effectively use trade as an engine of growth and sustainable development. As a result, trade facilitation and the digitalization of trade procedures have taken increasing importance as evidenced by the WTO Trade Facilitation Agreement (TFA), as well as the growing number of regional and subregional initiatives for facilitating the electronic exchange of information along international supply chains, including the ASEAN Single Window Agreement (ASWA) and the more recent Framework Agreement on Facilitation of Cross-borderPaperless Trade in Asia and the Pacific (FA-CPT).
This report presents an analysis of the results of the United Nations Global Survey on Trade Facilitation and Paperless Trade Implementation for ASEAN countries. The Survey, conducted between January and July 2017, provides information on the implementation of selected measures under the WTO TFA, as well as on the implementation of innovative, technology-driven measures aimed at enabling trade using electronic rather than paper-based data and documentation - otherwise referred to as “paperless trade”. The 2017 Survey also covers specific trade facilitation measures targeted at small and medium enterprises (SMEs), the agricultural sector and women. The report reveals that:
• ASEAN implementation rate of the measures stands at 64.3%, well above the Asia-Pacific regional average (50.4%). Apart from Australia and New Zealand, ASEAN’s implementation of trade facilitation and paperless trade is second only to that in East and Northeast Asia (73.7%).
• ASEAN has made good progress. Implementation rate of ASEAN as a group improved from 59% to 64% between the first and second Global Surveys conducted in 2015 and 2017. Myanmar made the most rapid progress in advancing implementation: its implementation rate increases by 15% during that period.
• Implementation in ASEAN remains quite heterogeneous. Malaysia, Singapore and Thailand achieve world-leading implementation rates of over 80%, while implementation in Myanmar stands at about 40%. Cambodia and Lao PDR lead all other Asia-Pacific Least Developed Countries, with implementation rates approaching 50%.
• ASEAN countries have already implemented many of the WTO TFA related measures, in particular transparency measures. However, cross-border paperless trade implementation remains low despite ASEAN having taken an early global lead in this area through the ASWA in 2005.1
• Implementation of “inclusive” trade facilitation measures to promote SME and women participation in trade remains low and ASEAN may further promote such measures in the context of the 2030 Sustainable Development Agenda.
The report also includes an analysis of the impact on trade cost of increasing implementation rates in ASEAN. Achieving basic ASEAN-wide compliance with the WTO TFA may reduce trade costs of the group by about 5-6%, while a more ambitious strategy involving digital trade facilitation and cross-border paperless trade could reduce trade costs by approximately 20%. Going forward, the ASEAN members may further accelerate implementation of the ASWA and related measures. To do so, all ASEAN members are encouraged to actively participate in the FA-CPT, the new UN treaty dedicated to advancing regional cross-border paperless trade through pilot projects, information sharing and coordinated adoption of international standards and implementation models.
This ASEAN report may best be read in conjunction with the global and Asia-Pacific reports on the results of the UN Global survey on Trade Facilitation and Paperless Trade. These reports, together with an interactive online database, are available at: http://bit.ly/2h8SQbG
1 The Agreement to Establish and Implement the ASEAN Single Window was signed in December 2005. It is available at: http://asean.org/?static_post=agreement-to-establish-and-implement-the-asean-single-window-kuala-lumpur-9-december-2005-2

IV
AcknowledgementsUnder the supervision of Mia Mikic and Yann Duval from the Trade, Investment and Innovation Division of the United Nations Economic and Social Commission for Asia and the Pacific (ESCAP) the report was prepared by Tengfei Wang, Yann Duval, Chorthip Utoktham and Zhang Yuhua from the same Division. Contribution from Luca Stanus-Ghib during his internship at ESCAP is gratefully acknowledged.
Le Quang Lan and Brasukra G. Sudjana from the ASEAN secretariat, as well as members of the ASEAN Trade Facilitation Joint Consultative Committee (ATF-JCC), substantially contributed to the preparation of the report by providing comments and support for data validation. The United Nations Network of Experts for Paperless Trade and Transport in Asia and the Pacific (UNNExT),2 a knowledge community supported by ESCAP and Economic Commission for Europe (ECE), also greatly facilitated initial data collection. Comments and suggestions received from participants of the 8th ASEAN Trade Facilitation Joint Consultative Committee meeting (Singapore, 20 - 22 June 2017) and United Nations Regional Commission (UNRC) side event to the 6th Global Review on Aid for Trade (Geneva, 12 July 2017)3 are gratefully acknowledged.
2 http://unnext.unescap.org 3 https://www.wto.org/english/tratop_e/devel_e/a4t_e/aid4trade_e.htm

V
ContentsExecutive Summary ................................................................................................................................... iii
Acknowledgments ..................................................................................................................................... iv
Abbreviations .............................................................................................................................................. vii
1. Introduction .............................................................................................................................................. 2
1.1 Background and objective ............................................................................................................. 2
1.2 Survey Instrument and Methodology .......................................................................................... 4
2. Trade facilitation implementation in ASEAN: Overview .................................................................. 8
2.1 Most and least implemented trade facilitation measures by ASEAN members ................ 11
2.2 Progress in implementation between 2015 and 2017 ............................................................ 13
3. Implementation of trade facilitation measures: a closer look ...................................................... 16
3.1 “Transparency” measures ............................................................................................................. 16
3.2 “Formalities” facilitation measures .............................................................................................. 17
3.3 “Institutional arrangement and cooperation” measures .......................................................... 18
3.4 “Paperless trade” measures .......................................................................................................... 19
3.5 “Cross-border paperless trade” measures .................................................................................. 20
3.6 “Transit facilitation” measures ...................................................................................................... 21
4. Assessing the impact of trade facilitation in ASEAN ...................................................................... 22
5. Conclusions and way forward ............................................................................................................. 26
References ................................................................................................................................................... 30
Annex 1: Definition of the different stages of implementation .......................................................... 31

VI
List of TablesTable 1: Intra-and extra-regional comprehensive trade costs in the Asia-Pacific region .......... 3
Table 2: Grouping of trade facilitation measures included in the questionnaire ........................ 4
Table 3: Most and least implemented measures in each group of trade facilitation
measures by ASEAN members ............................................................................................. 12
Table 4: Changes in trade costs in ASEAN resulting from implementation of trade facilitation
and paperless trade ................................................................................................................. 23
List of FiguresFigure 1: Trade costs of Asia-Pacific subregions with large developed economies, 1996-2014 ... 3
Figure 2: Trade facilitation implementation in Asia-Pacific sub-regions including ASEAN ...... 9
Figure 3: Overall implementation of trade facilitation measures in ASEAN countries .............. 9
Figure 4: Implementation of different groups of trade facilitation measures by ASEAN members .... 10
Figure 5: Level of implementation of WTO-TFA related measures (excluding transit measures)
by ASEAN members ............................................................................................................... 11
Figure 6: Trade facilitation implementation by ASEAN members between 2015 and 2017 .... 13
Figure 7: Average implementation of different groups of trade facilitation measures by
ASEAN members between 2015 and 2017 ........................................................................ 14
Figure 8: State of implementation of “transparency” measures for trade facilitation in ASEAN .... 17
Figure 9: Implementation of trade “formalities” facilitation measures in ASEAN ....................... 17
Figure 10: State of implementation of “institutional arrangement and cooperation” measures for
trade facilitation in ASEAN .................................................................................................... 18
Figure 11: Implementation of “paperless trade” measures in ASEAN ............................................. 19
Figure 12: Implementation of “cross-border paperless trade” measures in ASEAN ..................... 20
Figure 13: Implementation of “transit facilitation” measures in ASEAN .......................................... 21
Figure 14: Impact of trade facilitation implementation on trade costs of ASEAN economies ...... 23
Figure 15: Trade facilitation implementation and trade costs of Asia-Pacific economies .......... 27
Figure 16: Moving up the trade facilitation ladder towards seamless international supply chains ... 28

VII
AbbreviationsADB Asian Development BankAEO Authorized economic operatorASEAN Association of Southeast Asian NationsECA United Nations Economic Commission for AfricaECE United Nations Economic Commission for EuropeEClAC United Nations Economic Commission for latin America and the CaribbeanENEA East and North-East AsiaESCAP United Nations Economic and Social Commission for Asia and the PacificESCWA United Nations Economic and Social Commission for Western AsiaICT Information and communications technologyITC International Trade CentrelDC least developed countryllDC landlocked developing country NCA North and Central AsiaNTFC National trade facilitation committeeOCO Oceania Customs OrganizationOECD Organization for Economic Co-operation and Development PIDE Pacific Island Developing EconomiesSAARC South Asian Association for Regional CooperationSEA South-East AsiaSElA latin American and Caribbean Economic SystemSIDS Small island developing statesSSWA South and South-West AsiaTFA Trade Facilitation AgreementUN/CEFACT United Nations Centre for Trade Facilitation and Electronic BusinessUNCTAD United Nations Conference on Trade and DevelopmentUNNExT United Nations Network of Experts for Paperless Trade and Transport for Asia and the PacificUNRC United Nations Regional CommissionUSA United States of AmericaWTO World Trade Organization

2
1. Introduction1.1 Background and objectiveIt is well understood that reducing trade costs is essential in enabling economies to effectively participate in regional and global value chains and continue to use trade as a main engine of growth and sustainable development. As shown in Table 1,4 comprehensive non-tariff trade costs between the middle-income ASEAN economies (76% tariff-equivalent) are still significantly higher than the costs of trading goods among the three largest European Union economies (42% tariff-equivalent) or those between China, the Republic of Korea and Japan (51% tariff-equivalent). Trade costs of ASEAN economies with large developed economies have, on average, not decreased significantly over time since 1994, although they are lower than those of other Asia-Pacific subregions - except East Asia (see Figure 1).
Recent studies suggest that much of the trade cost reductions achieved over the past decade have been through eliminating or lowering tariffs. Further trade cost reduction therefore will have to come from tackling non-tariff sources of trade costs, such as inefficient transport and logistics infrastructure and services, as well as cumbersome regulatory procedures and documentation. Indeed, trade facilitation, including paperless trade, has taken increasing importance as evidenced by the entry into force of the WTO Trade Facilitation Agreement in February 2017, as well as the adoption of a new Framework Agreement on Facilitation of Cross-border Paperless Trade in Asia and the Pacific at ESCAP in 2016.5
4 See Arvis et al. (2016).5 As of 30 September 2017, Bangladesh, Cambodia, China, Armenia, and Iran (Islamic Republic of) have signed the new UN Treaty — Framework Agreement on Facilitation of Cross Border Paperless Trade in Asia and the Pacific. The ratification/accession phase started on 1 October 2017 and the Framework Agreement will enter into force as soon as five ESCAP members complete ratification/accession process.

3
In this context, this report provides an overview of the results for ASEAN of the 2017 United Nations Global Survey on Trade Facilitation and Paperless Trade Implementation, conducted between January and July 2017. Impacts on ASEAN trade costs of more or less ambitious trade facilitation reform strategies are also provided.
Table 1: Intra- and extra-regional comprehensive trade costs in the Asia-Pacific region(excluding tariff costs), 2010-2015
Region ASEAN-4 East Asia-3 North and Central Asia - 4
Pacific Islands Developing Economies
SAARC-4 AUS-NZL EU-3
ASEAN-4 76%(6.7%)
East Asia-3 76%(4.1%)
51%(-2.9%)
North and Central Asia - 4
343%(5.4%)
167%(-9.9%)
116%(-0.9%)
Pacific IslandsDeveloping Economies
172%(-9.0%)
173%(-3.1%)
370%(21.6%)
130%(-8.8%)
SAARC-4 130%(3.5%)
123%(-2.1%)
302%(7.7%)
300%(-4.6%)
119%(12.9%)
AUS-NZL 101%(2.9%)
87%(-5.4%)
341%(-4.9%)
82%(-8.9%)
136%(-6.7%)
51%(-4.9%)
EU-3 105%(-3.4%)
84%(-3.4%)
150%(-7.1%)
204%(-7.1%)
113%(0.3%)
108%(-2.3%)
42%(-8.1%)
USA 86%(8.0%)
63%(0.4%)
174%(-3.5%)
161%(-5.4%)
112%(6.7%)
100%(2.9%)
67%(0.4%)
Source: ESCAP-World Bank Trade Cost Database (June 2017 update). Available at: http://www.unescap.org/tid/artnet/trade-costs.asp.Notes: Trade costs may be interpreted as tariff equivalents. Percentage changes in trade costs between 2004-2009 and 2010-2015 are in parentheses. ASEAN-4: Indonesia, Malaysia, Philippines, Thailand; East Asia-3: China, Japan, Republic of Korea; North and Central Asia-4: Georgia, Kazakhstan, Kyrgyzstan, Russian Federation; Pacific islands developing economies: Fiji, Papua New Guinea; SAARC-4: Bangladesh, India, Pakistan, Sri Lanka; AUS-NZL: Australia, New-Zealand; EU-3: Germany, France, United Kingdom; USA: the United States of America.
Figure 1: Trade costs of Asia-Pacific subregions with large developed economies, 1996-2014
Source: ESCAP-World Bank Trade Cost Database (June 2017 update).
40
80
120
160
200
240
280
1996 1997 1998 1999 2000 2001 2002 2003 2004 2005 2006 2007 2008 2009 2010 2011 2012 2013 2014
Advalorem
trad
ecosts(pe
rcen
t)
TradecostofAsia-Pacificsubregionswithlargedevelopedeconomies
ASEAN-4 AUS-NZL PacificislandsEastAsia-3 EU-3 NorthandCentralAsia-4SAARC-4
4
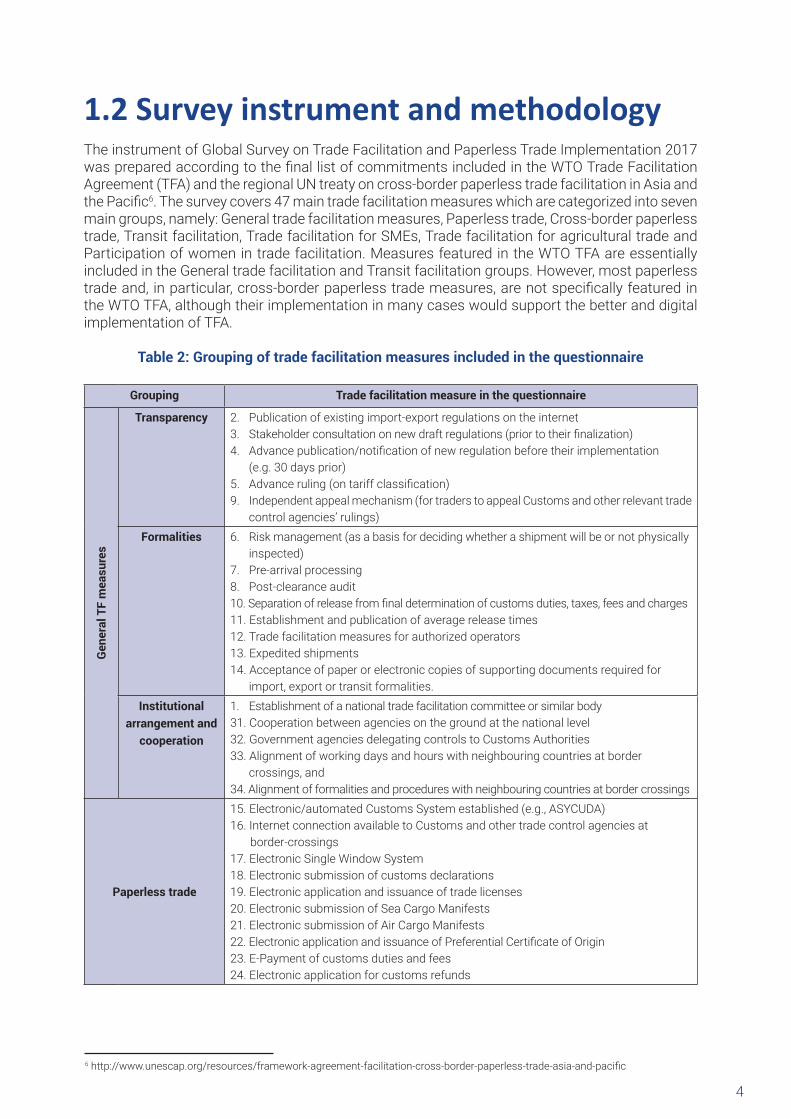
1.2 Survey instrument and methodologyThe instrument of Global Survey on Trade Facilitation and Paperless Trade Implementation 2017 was prepared according to the final list of commitments included in the WTO Trade Facilitation Agreement (TFA) and the regional UN treaty on cross-border paperless trade facilitation in Asia and the Pacific6. The survey covers 47 main trade facilitation measures which are categorized into seven main groups, namely: General trade facilitation measures, Paperless trade, Cross-border paperless trade, Transit facilitation, Trade facilitation for SMEs, Trade facilitation for agricultural trade and Participation of women in trade facilitation. Measures featured in the WTO TFA are essentially included in the General trade facilitation and Transit facilitation groups. However, most paperless trade and, in particular, cross-border paperless trade measures, are not specifically featured in the WTO TFA, although their implementation in many cases would support the better and digital implementation of TFA.
Table 2: Grouping of trade facilitation measures included in the questionnaire
Grouping Trade facilitation measure in the questionnaire
Gene
ral T
F m
easu
res
Transparency 2. Publication of existing import-export regulations on the internet3. Stakeholder consultation on new draft regulations (prior to their finalization)4. Advance publication/notification of new regulation before their implementation (e.g. 30 days prior)5. Advance ruling (on tariff classification)9. Independent appeal mechanism (for traders to appeal Customs and other relevant trade control agencies’ rulings)
Formalities 6. Risk management (as a basis for deciding whether a shipment will be or not physically inspected)7. Pre-arrival processing8. Post-clearance audit10. Separation of release from final determination of customs duties, taxes, fees and charges11. Establishment and publication of average release times12. Trade facilitation measures for authorized operators13. Expedited shipments14. Acceptance of paper or electronic copies of supporting documents required for import, export or transit formalities.
Institutional arrangement and
cooperation
1. Establishment of a national trade facilitation committee or similar body31. Cooperation between agencies on the ground at the national level32. Government agencies delegating controls to Customs Authorities33. Alignment of working days and hours with neighbouring countries at border crossings, and 34. Alignment of formalities and procedures with neighbouring countries at border crossings
Paperless trade
15. Electronic/automated Customs System established (e.g., ASYCUDA)16. Internet connection available to Customs and other trade control agencies at border-crossings17. Electronic Single Window System18. Electronic submission of customs declarations19. Electronic application and issuance of trade licenses20. Electronic submission of Sea Cargo Manifests21. Electronic submission of Air Cargo Manifests22. Electronic application and issuance of Preferential Certificate of Origin23. E-Payment of customs duties and fees24. Electronic application for customs refunds
6 http://www.unescap.org/resources/framework-agreement-facilitation-cross-border-paperless-trade-asia-and-pacific

5
Grouping Trade facilitation measure in the questionnaire
Cross-border paperless trade
25. Laws and regulations for electronic transactions are in place (e.g. e-commerce law, e-transaction law)26. Recognized certification authority issuing digital certificates to traders to conduct electronic transactions27. Engagement of the country in trade-related cross-border electronic data exchange with other countries28. Certificate of Origin electronically exchanged between your country and other countries29. Sanitary & Phyto-Sanitary Certificate electronically exchanged between your country and other countries30. Banks and insurers in your country retrieving letters of credit electronically without lodging paper-based documents
Transit facilitation
35. Transit facilitation agreement(s) with neighbouring country(ies)36. Customs Authorities limit the physical inspections of transit goods and use risk assessment37. Supporting pre-arrival processing for transit facilitation38. Cooperation between agencies of countries involved in transit
Trade facilitation and SMEs
39. Government has developed trade facilitation measures that ensure easy and affordable access for SMEs to trade related information40. Government has developed specific measures that enable SMEs to more easily benefit from the AEO scheme41. Government has taken actions to make the single windows more easily accessible to SMEs (e.g., by providing technical consultation and training services to SMEs on registering and using the facility.)42. Government has taken actions to ensure that SMEs are well represented and made key members of National Trade Facilitation Committees (NTFCs)
Trade facilitation and agricultural trade
43. Testing and laboratory facilities are equipped for compliance with sanitary and phytosanitary (SPS) standards in your country44. National standards and accreditation bodies are established for the purpose of compliance with SPS standards in your country45. Application, verification and issuance of SPS certificates is automated
Women and trade facilitation
46. The existing trade facilitation policy/strategy incorporates special consideration of women involved in trade47. Government has introduced trade facilitation measures to benefit women involved in trade
Source: ESCAP, based on the UN Global Survey on Trade Facilitation and Paperless Trade Implementation (2017)
The dataset was developed following a three-step approach:
Step 1. Data submission by experts: The survey instrument was sent by the ESCAP Secretariat to trade facilitation experts (from governments, private sector and/or academia) in Asia-Pacific countries to gather preliminary information. The questionnaire was also made publicly available online and disseminated with the support of OECD, ITC, UNCTAD and the United Nations Network of Experts for Paperless Trade and Transport for Asia and the Pacific (UNNExT). In some cases, the questionnaire was also sent to relevant national trade facilitation authorities or agencies and regional trade facilitation partners or organizations. This first step took place essentially between January and April 2017.
Step 2. Data verification by the ESCAP secretariat: The ESCAP Secretariat cross-checked the data collected in Step 1. Desk research and data sharing among UNRCs and survey partners were carried out to further check the accuracy of data. Face-to-face or telephone interviews with key informants were arranged to gather additional information when needed. The outcome of Step 2 was a consistent set of responses per country. Step 2 took place between January and May 2017.

6
Step 3. Data validation by national governments: The ESCAP Secretariat sent the completed questionnaire to each national government to ensure that the country had the opportunity to review the dataset and provide any additional information. The feedback from national governments was incorporated to finalize the dataset. Step 3 took place between June and July 2017. In the case of ASEAN members, the preliminary data was also presented to and made available for review by the ASEAN Trade Facilitation Joint Consultative Committee (ATF-JCC).
Based on the data collected, each of the trade facilitation measures included in the survey was rated as “fully implemented”, “partially implemented”, “on a pilot basis”, or “not implemented”. Definitions for each stage are provided in Annex 1. A score (weight) of 3, 2, 1 and 0 was assigned to each of the 4 implementation stages to calculate implementation scores for individual measures across countries, regions or categories. Country groupings used in the analysis are defined in ESCAP (2017).


8
2. Trade facilitation implementation in ASEAN: overviewThe UN Global Survey on Trade Facilitation and Paperless Trade Implementation 2017 reveals that the average implementation of a common set of 31 trade facilitation and paperless trade measures by ASEAN members stand at 64.3%, significantly higher than the Asia-Pacific regional average of 50.4% (see Figure 2).7 Within the region, ASEAN has the third highest average level of implementation after Australia & New-Zealand and East & North-East Asia.
7 See Questionnaire at: https://unnext.unescap.org/sites/default/files/Questionnaire%202017.docx

9
Figure 2: Trade facilitation implementation in Asia-Pacific sub-regions including ASEAN
Trade Facilitation Implementation of each individual country (%) Average trade facilitation implementation of the group (%)Source: ESCAP, based on the UN Global Survey on Trade Facilitation and Paperless Trade Implementation (2017)
The implementation of trade facilitation measures in ASEAN remains quite heterogeneous. Malaysia, Singapore and Thailand achieve world-leading implementation rates of over 80%, while implementation in Myanmar is just above 40% (see Figure 3).
Figure 3: Overall implementation of trade facilitation measures in ASEAN countries
Source: ESCAP, based on the UN Global Survey on Trade Facilitation and Paperless Trade Implementation (2017)
ASEAN members have implemented trade facilitation measures related to transparency, formalities, institutional arrangement and cooperation, paperless trade and transit measures to a large extent: implementation rates of all these measures exceed 60%. Challenges, however, remain for
6
2. Trade facilitation implementation in ASEAN: Overview
The UN Global Survey on Trade Facilitation and Paperless Trade Implementation 2017 reveals that the average implementation of a common set of 31 trade facilitation and paperless trade measures by ASEAN members stand at 64.3%, significantly higher than the Asia-Pacific regional average of 50.4% (see Figure 2). 7 Within the region, ASEAN has the third highest average level of implementation after Australia & New-Zealand and East & North-East Asia.
Figure 2: Trade facilitation implementation in Asia-Pacific sub-regions including ASEAN
Trade Facilitation Implementation of each individual country (%) Average Trade Facilitation Implementation of the group (%) Source: ESCAP, based on the UN Global Survey on Trade Facilitation and Paperless Trade Implementation (2017)
7 The survey questionnaire covers 47 trade facilitation measures which are categorized into seven groups, namely: General trade facilitation measures, Paperless trade, Cross-border paperless trade, Transit facilitation, Trade facilitation for SMEs, Trade facilitation and agricultural trade and Women and trade facilitation. The General trade facilitation measures and Transit facilitation measures are essentially measures featured in the WTO TFA. In contrast, most paperless trade and, in particular, cross-border paperless trade measures, are not specifically featured in the WTO TFA, although their implementation in many cases would support the better and digital implementation of the TFA. To better reflect trade facilitation in the context of SDGs, three groups of trade facilitation measures including Trade facilitation for SMEs, Trade facilitation for agricultural trade and Women in trade facilitation were also added to the Survey in 2017. See: https://unnext.unescap.org/sites/default/files/Questionnaire%202017.docx
0%
10%
20%
30%
40%
50%
60%
70%
80%
90%
100%
Australiaand NewZealand
East andNorth-East
Asia
ASEAN &Timor-Leste
North andCentral Asia
South andSouth-West
Asia
PacificIsland
DevelopingEconomies
LandlockedDevelopingCountries
LeastDevelopedEconomies
Small IslandDeveloping
States
7
The implementation of trade facilitation measures in ASEAN remains quite heterogeneous. Malaysia, Singapore and Thailand achieve world-leading implementation rates of over 80%, while implementation in Myanmar is just above 40% (see Figure 3).
Figure 3: Overall implementation of trade facilitation measures in ASEAN countries
Source: ESCAP, based on the UN Global Survey on Trade Facilitation and Paperless Trade Implementation (2017)
ASEAN members have implemented trade facilitation measures related to transparency, formalities, institutional arrangement and cooperation, paperless trade and transit measures to a large extent: implementation rates of all these measures exceed 60%. Challenges, however, remain for implementing cross-border paperless trade 8 . Implementation rate of cross-border paperless trade remains just above 30% (see Figure 4). Despite this, it is important to recognize that ASEAN has been actively working on cross-border paperless trade implementation. Notably, the ASEAN single window is one of the most advanced cross-border paperless trade initiative in the world, although implementation has been challenging.
In the context of 2030 Agenda for sustainable development, challenges also remain for ASEAN countries to make trade facilitation better serve SMEs, agricultural sector and women. Implementation of
8 Cross-border paperless trade means trade in goods, including their import, export, transit and related services, taking place on the basis of electronic communications, including exchange of trade-related data and documents in electronic form.
0%
20%
40%
60%
80%
100%
Brun
ei D
arus
sala
m
Cam
bodi
a
Indo
nesia
Lao
PDR
Mal
aysia
Mya
nmar
Phili
ppin
es
Sing
apor
e
Thai
land
Viet
Nam
ASEA
N
Transparency Formalities Institutional arrangement and cooperation Paperless trade Cross-border paperless trade

10
implementing cross-border paperless trade8. Implementation rate of cross-border paperless trade remains just above 30% (see Figure 4). Despite this, it is important to recognize that ASEAN has been actively working on cross-border paperless trade implementation. Notably, the ASEAN single window is one of the most advanced cross-border paperless trade initiative in the world, although implementation has been challenging.
In the context of 2030 Agenda for sustainable development, challenges also remain for ASEAN countries to make trade facilitation better serve SMEs, agricultural sector and women. Implementation of the specific trade facilitation measures for SMEs, agricultural sector and women are 29%, 28% and 10%, respectively, indicating significant room for improvement in these areas. (see Figure 4)
Figure 4: Implementation of different groups of trade facilitation measures by ASEAN members
Regional average implementation level of individual measures within each group. Average regional implementation level by groups of measures.
Source: ESCAP, based on the UN Global Survey on Trade Facilitation and Paperless Trade Implementation (2017)
8
the specific trade facilitation measures for SMEs, agricultural sector and women are 29%, 28% and 10%, respectively, indicating significant room for improvement in these areas. (see Figure 4)
Figure 4: Implementation of different groups of trade facilitation measures by ASEAN members
Regional average implementation level of individual measures within each group. Average regional implementation level by groups of measures.
Source: ESCAP, based on the UN Global Survey on Trade Facilitation and Paperless Trade Implementation (2017)
2.1 Most and least implemented trade facilitation measures by ASEAN members
Figure 5 shows the level of implementation of the WTO-TFA articles. The most implemented measure in ASEAN countries is Art. 4 Independent appeal mechanism, which has been fully or partially implemented by all ASEAN members. The least implemented measure is Article 7.7. Trade facilitation measures for authorized operators – however, the implementation of this measure is still very high (70%). Figure 5 is further supplemented by Table 3, which provides information on the most and least trade facilitation measures under each category of trade facilitation measures.
0%
10%
20%
30%
40%
50%
60%
70%
80%
90%
100%
transparency Formalities Institutionalarrangement
andcooperation
Paperlesstrade
Cross-borderpaperless
trade
Transitfacilitation
Tradefacilitationand SMEs
Tradefacilitation
andagriculture
trade
Women andtrade
facilitation

11
2.1 Most and least implemented trade facilitation measures by ASEAN membersFigure 5 shows the level of implementation of the WTO-TFA articles. The most implemented measure in ASEAN countries is Art. 4 Independent appeal mechanism, which has been fully or partially implemented by all ASEAN members. The least implemented measure is Article 7.7. Trade facilitation measures for authorized operators – however, the implementation of this measure is still very high (70%). Figure 5 is further supplemented by Table 3, which provides information on the most and least trade facilitation measures under each category of trade facilitation measures.
Figure 5: level of implementation of WTO-TFA related measures (excluding transit measures) by ASEAN members
Source: ESCAP, based on the UN Global Survey on Trade Facilitation and Paperless Trade Implementation (2017)
9
Figure 5: level of implementation of WTO-TFA related measures (excluding transit measures) by ASEAN members
Source: ESCAP, based on the UN Global Survey on Trade Facilitation and Paperless Trade Implementation (2017)
0% 20% 40% 60% 80% 100%
Art. 7.7: Trade facilitation measures for authorized operators
Art. 7.2: E-Payment of customs duties and fees
Art. 7.6: Establishment and publication of average release times
Art. 10.4: Electronic Single Window System
Art. 7.8: Expedited shipments
Art. 7.1: Pre-arrival processing
Art. 8: National legislative framework and institutional arrangementare available to ensure border agencies to cooperate with each other
Art. 7.5: Post-clearance audit
Art. 2.1: Advance publication/notification of new regulations beforetheir implementation
Art. 23: National Trade Facilitation Committee
Art. 7.4: Risk management
Art. 2: Stakeholders' consultation on new draft regulations (prior totheir finalization)
Art. 3: Advance ruling (on tariff classification)
Art. 10.2: Acceptance of paper or electronic copies of supportingdocuments required for import, export or transit formalities
Art. 7.3: Separation of Release from final determination of customsduties, taxes, fees and charges
Art. 1.2: Publication of existing import-export regulations on theinternet
Art. 4: Independent appeal mechanism
Fully implemented Partially implemented Pilot stage of implementation Not implemented

12
Table 3: Most and least implemented measures in each group of trade facilitation measures by ASEAN members
Category of trade facilitation measures
Most implemented (% of countries) Least implemented (% of countries)
Measure
Implemented fully, partially or on
pilot basis / Fully implemented
(% of countries/% of countries)
Measure
Implemented fully, partially or on
pilot basis / Fully implemented
(% of countries/% of countries)
Transparency Independent appeal mechanism
100 / 80
Advance publication/notification of new regulations before their implementation;Stakeholders’ consultation on new draft regulations (prior to their finalization)
100 / 50
Formalities Separation of release from final determination of customs duties, taxes, fees and charges;Acceptance of paper or electronic copies of supporting documents required for import, export or transit formalities
100 / 60
Trade facilitation measures for authorized operators
70 / 30
Institutional arrangement and cooperation
National Trade Facilitation Committee 100 / 50
Government agencies delegating controls to Customs Authorities
60 / 10
Paperless trade facilitation
Electronic/automated Customs System; Electronic submission of customs declarations
100 / 60
Electronic Application for customs refunds
40 / 20
Cross-border paperless trade
laws and regulations for electronic transactions
90 / 20
Electronic exchange of Sanitary & Phyto-Sanitary Certificate;Traders in your country apply for letters of credit electronically from banks or insurers without lodging paper-based documents
20 / 0
Transit facilitation Transit facilitation agreement(s) with neighbouring country(ies)
90 / 0Supporting pre-arrival processing for transit facilitation
60 / 20
Trade facilitation and SMEs
Government has developed trade facilitation measures that ensure easy and affordable access for SMEs to trade related information
50 / 20
Government has taken actions to ensure that SMEs are well represented and made key members of National Trade Facilitation Committees (NTFCs)
30 / 20
Trade facilitation and agriculture trade
Testing and laboratory facilities are equipped for compliance with sanitary and phytosanitary (SPS) standards in your country
50 / 20
Application, verification and issuance of SPS certificates is automated 30 / 10
Women in trade facilitation
Government has introduced trade facilitation measures to benefit women involved in trade;The existing trade facilitation policy/strategy incorporates special consideration of women involved in trade
10 / 10
Source: ESCAP, based on the UN Global Survey on Trade Facilitation and Paperless Trade Implementation (2017)

13
2.2 Progress in implementation between 2015 and 2017There is substantial progress in trade facilitation implementation between 2015 and 2017. Average implementation increases by approximately 5 percentage points from 59% in 2015 to 64% in 2017. The highest progress is recorded in Myanmar, whose implementation rate increases by 15 percentage points (from 26% in 2015 to 41% in 2017), followed by Malaysia (from 71% in 2015 to 81% in 2017) (see Figure 6).
Figure 6: Trade facilitation implementation by ASEAN members between 2015 and 2017
Source: ESCAP, based on the UN Global Survey on Trade Facilitation and Paperless Trade Implementation (2017)
11
2.2 Progress in implementation between 2015 and 2017
There is substantial progress in trade facilitation implementation between 2015 and 2017. Average implementation increases by approximately 5% from 59% in 2015 to 64% in 2017. The highest progress is recorded in Myanmar, whose implementation rate increases by 15% (from 26% in 2015 to 41% in 2017), followed by Malaysia (from 71% in 2015 to 81% in 2017) (see Figure 6).
Figure 6: Trade facilitation implementation by ASEAN members between 2015 and 2017
Source: ESCAP, based on the UN Global Survey on Trade Facilitation and Paperless Trade Implementation (2017)
The ASEAN members made the most progress in implementing the “Institutional arrangement and cooperation” measures between 2015 and 2017: implementation rate rose by approximately 9 percentage points (from 59% in 2015 to 68% in 2017), essentially because of establishment or strengthening of national trade facilitation committees. Implementation rate of the “Transparency” measures increased from 79% in 2015 to 87% in 2017 while implementation rate of “Formalities” rose by 5 percentage points: from 70% in 2015 to 75% in 2017. Similarly, implementation of the “paperless” and “cross-border paperless” measures improved by 5 percentage points. (Figure 7).
0%
20%
40%
60%
80%
100%
Brun
ei D
arus
sala
m
Cam
bodi
a
Indo
nesia
Lao
PDR
Mal
aysia
Mya
nmar
Phili
ppin
es
Sing
apor
e
Thai
land
Viet
Nam
ASEA
N
2015 2017

14
The ASEAN members made the most progress in implementing the “Institutional arrangement and cooperation” measures between 2015 and 2017: implementation rate rose by approximately 9 percentage points (from 59% in 2015 to 68% in 2017), essentially because of establishment or strengthening of national trade facilitation committees. Implementation rate of the “Transparency” measures increased from 79% in 2015 to 87% in 2017 while implementation rate of “Formalities” rose by 5 percentage points: from 70% in 2015 to 75% in 2017. Similarly, implementation of the “paperless” and “cross-border paperless” measures improved by 5 percentage points. (Figure 7).
Figure 7: Average implementation of different groups of trade facilitation measures by ASEAN members between 2015 and 2017
Source: ESCAP, based on the UN Global Survey on Trade Facilitation and Paperless Trade Implementation (2017).
12
Figure 7: Average implementation of different groups of trade facilitation measures by ASEAN members between 2015 and 2017
Source: ESCAP, based on the UN Global Survey on Trade Facilitation and Paperless Trade Implementation (2017).
0%
20%
40%
60%
80%
100%
Transparency Formalities Institutionalarrangement and
cooperation
Paperless trade Cross-borderpaperless trade
2015 2017


16
3. Implementation of trade facilitation measures: a closer look3.1 “Transparency” measuresFive trade facilitation measures included in the survey are categorized as “Transparency” measures which are related to the Articles 1-5 of the WTO TFA and GATT Article X on Publication and Administration of Trade Regulations. The average level of implementation of all five “transparency” measures by ASEAN members is over 80%, significantly higher than the Asia-Pacific average – in particular in terms of Advance ruling and Advance publication of new regulations.
Figure 8 shows that all “transparency” measures have been fully or partially implemented by all countries. Independent appeal mechanism is the most implemented measure and has been fully implemented by 80% of the countries in this sub-region. In contrast, Stakeholder consultation on new draft regulations (prior to their finalization) and Advance publication/notification of new regulation before their implementation are the least implemented of the “transparency” measures, having been fully implemented in 50% of all countries in the sub-region.

17
Figure 8: State of implementation of “transparency” measures for trade facilitation in ASEAN
Source: ESCAP, based on the UN Global Survey on Trade Facilitation and Paperless Trade Implementation (2017)
3.2 “Formalities” facilitation measuresEight of the general trade facilitation measures included in the survey are categorized as “formalities” facilitation measures which are related to streamlining and/or expediting regulatory trade procedures. They are related to the Articles 6-10 of the WTO TFA and GATT Article VIII on “Fees and Formalities connected with Importation and Exportation”. The level of implementation of most “formalities” facilitation measures in this sub-region is over 70%, higher than the Asia-Pacific average.
All “formalities” measures have been fully or partial implemented in more than 60% of all ASEAN members. Acceptance of paper or electronic copies of supporting documents required for import, export or transit formalities and Separation of release from final determination of customs duties, taxes, fees and charges are the most implemented measures in the sub-region. In contrast, the least implemented measure is Trade facilitation measures for authorized operators, which has not yet been implemented in 30% of the countries of the sub-region. (Figure 9)
Figure 9: Implementation of trade “formalities” facilitation measures in ASEAN
Source: ESCAP, based on the UN Global Survey on Trade Facilitation and Paperless Trade Implementation (2017)
13
3. Implementation of trade facilitation measures: A closer look
3.1 “Transparency” measures
Five trade facilitation measures included in the survey are categorized as “Transparency” measures which are related to the Articles 1-5 of the WTO TFA and GATT Article X on Publication and Administration of Trade Regulations. The average level of implementation of all five “transparency” measures by ASEAN members is over 80%, significantly higher than the Asia-Pacific average – in particular in terms of Advance ruling and Advance publication of new regulations.
Figure 8 shows that all “transparency” measures have been fully or partially implemented by all countries. Independent appeal mechanism is the most implemented measure and has been fully implemented by 80% of the countries in this sub-region. In contrast, Stakeholder consultation on new draft regulations (prior to their finalization) Advance publication/notification of new regulation befor e their implementation are the least implemented of the “transparency” measures, having been fully implemented in 50% of all countries in the sub-region.
Figure 8: State of implementation of “transparency” measures for trade facilitation in ASEAN
Source: ESCAP, based on the UN Global Survey on Trade Facilitation and Paperless Trade Implementation (2017)
3.2 “Formalities” facilitation measures
Eight of the general trade facilitation measures included in the survey are categorized as “formalities” facilitation measures which is related to streamlining and/or expediting regulatory trade procedures. They are related to the Articles 6-10 of the WTO TFA and GATT Article VIII on “Fees and
0% 10% 20% 30% 40% 50% 60% 70% 80% 90% 100%
Advance publication/notification of new regulationsbefore their implementation
Stakeholders' consultation on new draft regulations(prior to their finalization)
Advance ruling (on tariff classification)
Publication of existing import-export regulations onthe internet
Independent appeal mechanism
Fully implemented Partially implemented Pilot stage of implementation Not implemented
14
Formalities connected with Importation and Exportation”. The level of implementation of most “formalities” facilitation measures in this sub-region is over 70%, higher than the Asia-Pacific average.
All “formalities” measures have been fully or partial implemented in more than 60% of all ASEAN members. Acceptance of paper or electronic copies of supporting documents required for import, export or transit formalities and Separation of Release from final determination of customs duties, taxes, fees and charge are the most implemented measures in the sub-region. In contrast, the least implemented measure is Trade facilitation measures for authorized operators, which has not yet been implemented in 30% of the countries of the sub-region. (Figure 9)
Figure 9: Implementation of trade “formalities” facilitation measures in ASEAN
Source: ESCAP, based on the UN Global Survey on Trade Facilitation and Paperless Trade Implementation (2017)
3.3 “Institutional arrangement and cooperation” measures
Three trade facilitation measures featured in the survey are grouped under “Institutional and cooperation” measures. They are related to the long-standing recommendation that a national trade facilitation body and other measures be implemented to ensure coordination and cooperation among the various government agencies and other stakeholders involved in facilitating trade.9 All three measures are also specified in various Articles of the WTO TFA. Implementation rate of the three “institutional arrangement and cooperation” measures in ASEAN is around 67%, which is close to the Asia-Pacific regional average level.
9 See, for example, UN/CEFACT Recommendation No. 4 on establishment of national trade facilitation bodies, first issued in 1974.
0% 10% 20% 30% 40% 50% 60% 70% 80% 90% 100%
Trade facilitation measures for authorized operators
Establishment and publication of average release times
Expedited shipments
Pre-arrival processing
Post-clearance audit
Risk management
Acceptance of paper or electronic copies of supportingdocuments required for import, export or transit formalities
Separation of Release from final determination of customsduties, taxes, fees and charges
Fully implemented Partially implemented Pilot stage of implementation Not implemented

18
3.3 “Institutional arrangement and cooperation” measuresThree trade facilitation measures featured in the survey are grouped under “Institutional and cooperation” measures. They are related to the long-standing recommendation that a national trade facilitation body and other measures be implemented to ensure coordination and cooperation among the various government agencies and other stakeholders involved in facilitating trade.9 All three measures are also specified in various Articles of the WTO TFA. Implementation rate of the three “institutional arrangement and cooperation” measures in ASEAN is around 67%, which is close to the Asia-Pacific regional average level.
Figure 10 shows that National legislative framework and institutional arrangement are available to ensure border agencies to cooperate with each other and National trade facilitation committees have been at least partially implemented in all countries. In contrast, 40% of the countries have not implemented Government agencies delegating controls to Customs Authorities, making it the least implemented measure of this group.
Figure 10: State of implementation of “institutional arrangement and cooperation” measures for trade facilitation in ASEAN
Source: ESCAP, based on the UN Global Survey on Trade Facilitation and Paperless Trade Implementation (2017)
9 See, for example, UN/CEFACT Recommendation No. 4 on establishment of national trade facilitation bodies, first issued in 1974.
15
Figure 10 shows that National legislative framework and institutional arrangement are available to ensure border agencies to cooperate with each other and National trade facilitation committees have been at least partially implemented in all countries. In contrast, 40% of the countries have not implemented Government agencies delegating controls to Customs authorities, making it the least implemented measure of this group.
Figure 10: State of implementation of “institutional arrangement and cooperation” measures for trade facilitation in ASEAN
Source: ESCAP, based on the UN Global Survey on Trade Facilitation and Paperless Trade Implementation (2017)
3.4 “Paperless trade” measures
Nine of the trade facilitation measures included in the survey are categorized as “Paperless trade” measures. All these measures involve the use and application of modern information and communications technologies (ICT) to trade “formalities”, starting from the availability of internet connections at border-crossings and customs automation to full-fledged electronic single window facilities. Many of the measures featured here are closely related to those specified in the WTO TFA, although the new WTO agreement typically only encourages economies to work towards implementation of such measures, rather than make them a requirement.10
10 An example of this is the WTO TFA Article 10.3 on Single Window, which reads as follows: “Members shall endeavour to establish or maintain a single window, enabling traders to submit documentation and/or data requirements for importation, exportation, or transit of goods through a single entry point to the participating authorities or agencies... Members shall, to the extent possible and practicable, use information technology to support the single window.”
0% 10% 20% 30% 40% 50% 60% 70% 80% 90% 100%
Government agencies delegating controlsto Customs authorities
National legislative framework and institutionalarrangement are available to ensure border
agencies to cooperate with each other
National Trade Facilitation Committee
Fully implemented Partially implemented Pilot stage of implementation Not implemented

19
3.4 “Paperless trade” measuresNine of the trade facilitation measures included in the survey are categorized as “Paperless trade” measures. All these measures involve the use and application of modern information and communications technologies (ICT) to trade “formalities”, starting from the availability of internet connections at border-crossings and customs automation to full-fledged electronic single window facilities. Many of the measures featured here are closely related to those specified in the WTO TFA, although the new WTO agreement typically only encourages economies to work towards implementation of such measures, rather than make them a requirement.10
The implementation levels of “paperless” measures in ASEAN vary widely, ranging between less than 40% and over 80%. As shown in Figure 11, Electronic submission of Customs declarations and Electronic/automated Customs System are the two most implemented measures in the sub-region, having been at least partially implemented in all countries. In contrast, the least implemented measure is Electronic application for customs refunds, which has not been implemented in around 60% of countries in ASEAN.
Figure 11: Implementation of “paperless trade” measures in ASEAN
Source: ESCAP, based on the UN Global Survey on Trade Facilitation and Paperless Trade Implementation (2017)
10 An example of this is the WTO TFA Article 10.3 on Single Window, which reads as follows: “Members shall endeavour to establish or maintain a single window, enabling traders to submit documentation and/or data requirements for importation, exportation, or transit of goods through a single entry point to the participating authorities or agencies... Members shall, to the extent possible and practicable, use information technology to support the single window.” 16
The implementation levels of “paperless” measures in ASEAN vary widely, ranging between less
than 40% and over 80%. As shown in Figure 11, Electronic submission of Customs declarations and Electronic/automated Customs System are the two most implemented measures in the sub-region, having been at least partially implemented in all countries. In contrast, the least implemented measure is Electronic application for customs refunds, which has not been implemented in around 60% of countries in ASEAN.
Figure 11: Implementation of “paperless trade” measures in ASEAN
Source: ESCAP, based on the UN Global Survey on Trade Facilitation and Paperless Trade Implementation (2017)
3.5 “Cross-border paperless trade” measures
Six of the trade facilitation measures included in the survey are categorized as “cross-border paperless trade” measures, as shown in Figure 12. Two measures, Laws and regulations for electronic transactions and Recognized certification authority, are basic building blocks towards enabling the exchange and legal recognition of trade-related data and documents not only among stakeholders within a country, but ultimately also between stakeholders along the entire international supply chain. The other four measures relate to the implementation of systems enabling the actual exchange of trade-related data and documents across borders to remove the need for sending paper documents.
Figures 12 reveals that 90% of ASEAN countries have at least partially implemented Laws and regulations for electronic transactions. Recognised certification authority has been implemented in 70%
0% 10% 20% 30% 40% 50% 60% 70% 80% 90% 100%
Electronic application for customs refunds
Electronic application and issuance of preferentialcertificate of origin
Electronic submission of air cargo manifests
Electronic application and issuance of importand export permit, if such permit is required
E-Payment of customs duties and fees
Electronic single window system
Internet connection available to customs and othertrade control agencies at border-crossings
Electronic submission of customs declarations
Electronic/automated customs system
Fully implemented Partially implemented Pilot stage of implementation Not implemented

20
3.5 “Cross-border paperless trade” measuresSix of the trade facilitation measures included in the survey are categorized as “cross-border paperless trade” measures, as shown in Figure 12. Two measures, Laws and regulations for electronic transactions and Recognized certification authority, are basic building blocks towards enabling the exchange and legal recognition of trade-related data and documents not only among stakeholders within a country, but ultimately also between stakeholders along the entire international supply chain. The other four measures relate to the implementation of systems enabling the actual exchange of trade-related data and documents across borders to remove the need for sending paper documents.
Figures 12 reveals that 90% of ASEAN countries have at least partially implemented Laws and regulations for electronic transactions. Recognised certification authority has been implemented in 70% of the countries. Engagement in trade-related cross-border electronic data exchange has been implemented, either partially or on a pilot basis, in 60% of the countries. The least implemented measures are Electronic exchange of Sanitary and Phyto-sanitary Certificates and Traders in your country apply letters of credit electronically from banks and insurers retrieving letters of credit electronically without lodging paper-based documents
Figure 12: Implementation of “cross-border paperless trade” measures in ASEAN
Source: ESCAP, based on the UN Global Survey on Trade Facilitation and Paperless Trade Implementation (2017)
17
of the countries. Engagement in trade-related cross-border electronic data exchange has been implemented, either partially or on a pilot basis, in 60% of the countries. The least implemented measures are Electronic exchange of Sanitary and Phyto-sanitary Certificates and Banks and insurers retrieving letters of credit electronically without lodging paper-based documents.
Figure 12: Implementation of “cross-border paperless trade” measures in ASEAN
Source: ESCAP, based on the UN Global Survey on Trade Facilitation and Paperless Trade Implementation (2017)
3.6 “Transit facilitation” measures
Three trade facilitation measures included in the survey relate specifically to transit facilitation and WTO TFA Article 11 on Freedom of Transit. The intent of these measures is to simplify, as much as possible, the formalities associated with traffic in transit, allowing goods to be seamlessly transported through one or more transit countries. These measures are particularly important to landlocked developing countries whereas goods typically need to go through a neighboring country’s territory for transit.
The “Transit” measures are not readily applicable to the Philippines as it does not have a neighbouring country with land border (see Figure 13). The implementation level of “transit facilitation” measures in the sub-region exceeds 60%, higher than that of the Asia-Pacific region.
0% 10% 20% 30% 40% 50% 60% 70% 80% 90% 100%
Electronic exchange of Sanitary& Phyto-Sanitary Certificate
Traders in your country apply for letters of credit electronically from banks or insurers
without lodging paper-based documents
Electronic exchange of Certificate of Origin
Engagement in trade-related cross-borderelectronic data exchange
Recognised certification authority
Laws and regulations for electronic transactions
Fully implemented Partially implemented Pilot stage of implementation Not implemented

21
3.6 “Transit facilitation” measuresThree trade facilitation measures included in the survey relate specifically to transit facilitation and WTO TFA Article 11 on Freedom of Transit. The intent of these measures is to simplify, as much as possible, the formalities associated with traffic in transit, allowing goods to be seamlessly transported through one or more transit countries. These measures are particularly important to landlocked developing countries whereas goods typically need to go through a neighboring country’s territory for transit.
The “Transit” measures are not readily applicable to the Philippines as it does not have a neighbouring country with land border (see Figure 13). The implementation level of “transit facilitation” measures in the sub-region exceeds 60%, higher than that of the Asia-Pacific region.
Figure 13: Implementation of “transit facilitation” measures in ASEAN
Source: ESCAP, based on the UN Global Survey on Trade Facilitation and Paperless Trade Implementation (2017)
18
Figure 13: Implementation of “transit facilitation” measures in ASEAN
Source: ESCAP, based on the UN Global Survey on Trade Facilitation and Paperless Trade Implementation (2017)
4. Assessing the Impact of Trade Facilitation in ASEAN
In order to assess the potential impact of implementation of trade facilitation measures in ASEAN, we estimate a trade cost model as a function of trade facilitation implementation rates based on the UN Survey data presented above, in addition to other traditional trade cost factors such as natural geographic factors (distance, “landlockedness”, and contiguity), cultural and historical distance (e.g., common official language, former colonial relationships), the presence of regional trade agreements and maritime connectivity. The model extends previous work by Arvis et al. (2016) and ADB/ESCAP (2017) by capturing the changes in trade costs resulting not only from each countries’ own implementation of trade facilitation measures, but also those resulting from implementation of measures in partner countries.
The overall trade cost reductions that can be expected in ASEAN from implementation of three sets of trade facilitation measures are shown in table 4. The first set of trade facilitation measures is limited to implementation of WTO TFA binding measures only.11 The second set of measures includes all binding and non-binding WTO TFA measures included in the UN Survey. The final and most ambitious set is a WTO TFA+ set of measures, including digital implementation of TFA measures and cross-border paperless trade. For each set of measures, average changes in trade cost achieved if all ASEAN countries at least partially implement all measures, or if they all fully implement all measures, are calculated.
11 The list of binding and non-binding WTO TFA measures is available in the Appendix of ADB/ESCAP (2017).
0% 10% 20% 30% 40% 50% 60% 70% 80% 90% 100%
Supporting pre-arrival processingfor transit facilitation
Customs Authorities limit the physical inspectionsof transit goods and use risk assessment
Cooperation between agencies of countriesinvolved in transit
Transit facilitation agreement(s)with neighbouring country(ies)
Fully implemented Partially implemented Pilot stage of implementation
Not implemented Not applicable

22
4. Assessing the impact of trade facilitation in ASEANIn order to assess the potential impact of implementation of trade facilitation measures in ASEAN, we estimate a trade cost model as a function of trade facilitation implementation rates based on the UN Survey data presented above, in addition to other traditional trade cost factors such as natural geographic factors (distance, “landlockedness”, and contiguity), cultural and historical distance (e.g., common official language, former colonial relationships), the presence of regional trade agreements and maritime connectivity. The model extends previous work by Arvis et al. (2016) and ADB/ESCAP (2017) by capturing the changes in trade costs resulting not only from each countries’ own implementation of trade facilitation measures, but also those resulting from implementation of measures in partner countries.
The overall trade cost reductions that can be expected in ASEAN from implementation of three sets of trade facilitation measures are shown in table 4. The first set of trade facilitation measures are limited to implementation of WTO TFA binding measures only.11 The second set of measures include
11 The list of binding and non-binding WTO TFA measures is available in the Appendix of ADB/ESCAP (2017).

23
all binding and non-binding WTO TFA measures included in the UN Survey. The final and most ambitious set is a WTO TFA+ set of measures, including digital implementation of TFA measures and cross-border paperless trade. For each set of measures, average changes in trade cost achieved if all ASEAN countries at least partially implement all measures, or if they all fully implement all measures, are calculated.
Table 4: Changes in trade costs in ASEAN resulting from implementation of trade facilitation and paperless trade
Trade costs reduction from
TF improvement: ASEAN
WTO TFA (binding measures only)
WTO TFA (binding + non-binding)
WTO TFA+ (binding + non-binding + other
paperless and cross-border paperless)
Partially implemented
Fully implemented
Partially implemented
Fully implemented
Partially implemented
Fully implemented
Model 1
Overall TF -1.67% -5.31% -3.47% -9.80% -10.90% -19.59%
Model 2
General TF -2.10% -6.54% -3.25% -10.23% -4.24% -11.43%
Paperless and cross-border paperless trade
N.A. N.A. -0.81% -1.42% -4.96% -7.38%
Source: United Nations, ESCAP (2017)
Figure 14: Impact of trade facilitation implementation on trade costs of ASEAN economies
Source: United Nations, ESCAP (2017)
Two main findings emerge from this impact analysis. First, achieving basic compliance with WTO TFA by implementing only binding measures results in only modest trade cost reductions. Full implementation of binding measures results in a decrease of trade costs of about 5-6%, while full implementation of all measures results in a 9-10% reduction. Second, the paperless implementation of the TFA measures together with enabling the seamless electronic exchange of trade data and documents across borders results in much larger trade costs reductions, averaging nearly 19-20% for ASEAN as a whole.
19
Table 4: Changes in trade costs in ASEAN resulting from implementation of trade facilitation and paperless trade
Trade costs reduction from
TF improvement:
ASEAN
WTO TFA (binding measures only)
WTO TFA (binding + non-binding)
WTO TFA+ (binding + non-binding + other
paperless and cross-border paperless)
Partially implemented
Fully implemented
Partially implemented
Fully implemented
Partially implemented
Fully implemented
Model 1 Overall TF -1.67% -5.31% -3.47% -9.80% -10.90% -19.59% Model 2 General TF -2.10% -6.54% -3.25% -10.23% -4.24% -11.43%
Paperless and cross-border paperless trade
N.A. N.A. -0.81% -1.42% -4.96% -7.38%
Source: United Nations, ESCAP (2017)
Figure 14: Impact of trade facilitation implementation on trade costs of ASEAN economies
Source: United Nations, ESCAP (2017)
-25%
-20%
-15%
-10%
-5%
0%
Viet Nam Cambodia Brunei Darussalam
Indonesia Lao PDR Philippines Malaysia Thailand Singapore
Effect of implementation of WTO TFA binding measures (full implementation)
Effect of implementation of WTO TFA binding + non-binding measures (full implementation)
Effect of implementation of WTO TFA binding + non-binding + other paperless trade measures (fullimplementation)

24
All ASEAN economies stand to make significant gains from accelerating trade facilitation implementation. As shown in Figure 14, the full implementation of the three different sets of trade facilitation measures in all economies results in trade costs reductions for all economies. As expected, the trade costs reductions are much larger when cross-border paperless trade is achieved, with even world-leading trade facilitation economies such as Singapore seeing its trade costs reduced by nearly 15%. Achieving such trade cost reductions will require closer cooperation between economies on developing interoperable paperless trade systems, however, as envisaged in the FA-CPT (see Box 1).
Box 1 – Overview of the Framework Agreement on Facilitation of Cross-border Paperless Trade in Asia and the Pacific
Developed by a diverse group of more than 25 Asian and Pacific countries at very different stages of development over 4 years, the Framework Agreement on Facilitation of Cross-border Paperless Trade in Asia and the Pacific (FA-CPT) was adopted at ESCAP in May 2016. It is designed as an inclusive and enabling platform that will benefit all participating countries regardless of where they stand in terms of trade facilitation implementation. The Framework is fully dedicated to the digitalization of trade processes and enabling the seamless electronic exchange and legal recognition of trade-related data and documents across borders, rather than only between stakeholders located in the same country. Full implementation of cross-border paperless trade will not only reduce transaction time and costs but also increase regulatory compliance and enable the more direct engagement of small and medium-size enterprise (SMEs) in international trade and cross-border e-commerce.
Achieving cross-border paperless trade across the region is expected to be a long and difficult process; And it cannot be achieved without close collaboration between countries. The Framework Agreement is expected to support that process by providing a dedicated institutional framework for countries with proven political will to develop legal and technical solutions for cross-border paperless trade, including through pilot projects, capacity building and technical assistance, based on existing international standards. The FA-CPT aims to facilitate cross-border trade data exchange between member States and enable mutual recognition of electronic trade data and documents, but does not make electronic data exchange mandatory among all Parties.
Some of the benefits for ESCAP member states who become parties to the FA-CPT include:
• (a) Accelerated progress towards a paperless trade environment at the national level on the basis of the political will demonstrated during the accession process to the FA-CPT; • (b) Opportunity to integrate emerging cross-border paperless trade considerations and best practices early in the development of national single window and other paperless trade systems to ensure they are interoperable and enabled for (future) cross-border data exchange, in particular through structured and regular sharing of lessons;
• (c) Reduction in overall investment costs and maximization of return from investments in paperless trade systems, through concurrent development of national paperless trade systems and environment for cross-border trade data exchange;
• (d) Ready access to potential counterpart countries interested to negotiate and achieve cross-border data exchange, avoiding or reducing needs for engaging in numerous and/or potentially incompatible bilateral initiatives;
• (e) Direct participation in the development of pragmatic solutions for the cross-border exchange of trade documents. For more advanced countries with relevant experience and existing practices, including many ASEAN economies, this will enable them to ensure that new regional systems and solutions will be harmonized and interoperable with what they have already achieved on a bilateral and/or subregional basis;
• (f) Compliance with commitments the party may have made through its bilateral and plurilateral trade agreements (RTAs) to collaborate on exchanging electronic data and documents (typically featured in “Paperless Trading” Articles in RTAs, or related provisions or agreements).
More details on the Framework Agreement, including a draft implementation roadmap, are available at: http://www.unescap.org/resources/framework-agreement-facilitation-cross-border-paperless-trade-asia-and-pacific


26
5. Conclusions and way forward
This report presented data on trade facilitation and paperless trade implementation collected from all ASEAN members and other 34 economies across the Asia-Pacific region covering 5 different sub-regions and 3 groups of countries with special needs, namely, lDCs, llDCs and SIDSs. The survey covered not only implementation of general trade facilitation measures, including most of those featured in the WTO TFA, but also more advanced ICT-based trade facilitation measures. Figure 15 confirms the strong relationship between Asia-Pacific countries international trade costs and their level of trade facilitation implementation.12
Based on a package of 31 trade facilitation measures included in the survey, regional average trade facilitation implementation is found to be approximately 50%, suggesting significant room for improvement. ASEAN performs much better than the regional average, with an average implementation of 65%.
12 A simple linear regression of trade costs against trade facilitation implementation – estimated using Ordinary Least Squares (OLS) - shows that trade facilitation implementation levels explain about 50% of the variations in trade costs; and that a 5% increase in the level of trade facilitation implementation is associated with a 17% decrease in trade costs.

27
13 See ESCAP (2014) at http://www.unescap.org/resources/estimating-benefits-cross-border-paperless-trade
Figure 15: Trade facilitation implementation and trade costs of Asia-Pacific economies
Notes: Countries’ trade costs are based on average comprehensive bilateral trade costs with Germany, China and the USA (2008-13) and expressed as ad valorem equivalents (%).Source: ESCAP-World Bank International Trade Cost Database (June 2017 Update) and United Nations (2017)
The assessment reveals that a large majority of countries in the region has been actively engaged in implementing measures to improve transparency, enhance inter-agency coordination and cooperation, and streamline fees and formalities associated with trade transactions. While Customs in essentially all countries have been actively developing paperless systems to speed up customs clearance while also improving control, more than 50% of the economies are now also engaged in implementation of more advanced national multi-agency paperless systems, such as national electronic single windows.
However, implementation of cross-border (bilateral, sub-regional or regional) paperless trade systems remains low. This is not surprising given that, on one hand, many less advanced countries in the region are at an early stage of development of national paperless systems and that, on the other hand, more advanced countries have paperless systems in place that are not fully interoperable with each other. In that regard, given the large potential benefits associated with the implementation of these “next generation” trade facilitation measures,13 it is in the interest of countries from all groups to work together and develop the legal and technical protocols needed for the seamless exchange of regulatory and commercial data and documents along the international supply chain.
Some work has already been done bilaterally as well as in several Asian sub-regions (e.g., in ASEAN as part of implementation of the ASWA). This work can be further leveraged at the regional level through adoption and implementation of the intergovernmental Framework Agreement for the Facilitation of Cross-border Paperless Trade. Negotiated as an inclusive and flexible intergovernmental platform to enable the electronic exchange of trade-related data and documents across borders among parties, the Framework Agreement is set to benefit all parties regardless of their current state of implementation of paperless trade. Therefore, all countries in the region are encouraged to become a party of the treaty as soon as possible to take advantage of what the agreement offers, especially in terms of access to capacity building and technical assistance.
22
Figure 15: Trade facilitation implementation and Trade Costs of Asia-Pacific economies
Notes: Countries’ trade costs are based on average comprehensive bilateral trade costs with Germany, China and the USA (2008-13) and expressed as ad valorem equivalents (%). Source: ESCAP-World Bank International Trade Cost Database (June 2017 Update) and United Nations (2017)
Based on a package of 31 trade facilitation measures included in the survey, regional average trade facilitation implementation is found to be approximately 50%, suggesting significant room for improvement. ASEAN performs much better than the regional average, with an average implementation of 65%.
The assessment reveals that a large majority of countries in the region has been actively engaged in implementing measures to improve transparency, enhance inter-agency coordination and cooperation, and streamline fees and formalities associated with trade transactions. While Customs in essentially all countries have been actively developing paperless systems to speed up customs clearance while also improving control, more than 50% of the economies are now also engaged in implementation of more advanced national multi-agency paperless systems, such as national electronic single windows.
However, implementation of cross-border (bilateral, sub-regional or regional) paperless trade systems remains low. This is not surprising given that, on one hand, many less advanced countries in the region are at an early stage of development of national paperless systems and that, on the other hand, more advanced countries have paperless systems in place that are not fully interoperable with each other. In that regard, given the large potential benefits associated with the implementation of these “next generation” trade facilitation measures,13 it is in the interest of countries from all groups to work together
13 See ESCAP (2014) at http://www.unescap.org/resources/estimating-benefits-cross-border-paperless-trade
y = -340.43x + 360.84R² = 0.4986
0%
50%
100%
150%
200%
250%
300%
350%
400%
450%
500%
0% 10% 20% 30% 40% 50% 60% 70% 80% 90% 100%
ffirat gnidulcxe ,stsoc edarT(t
ariff
equ
ival
ent)
Trade facilitation implementation

28
To further advance trade facilitation and paperless trade, Figure 16 shows implementation of trade facilitation as a step-by step process, based on the groups of measures included in this survey. Trade facilitation begins with the setting up of the Institutional arrangement needed to prioritize and coordinate implementation of trade facilitation measures. The next step is to make the trade processes more Transparent by sharing information on existing laws, regulations and procedures as widely as possible and consulting with stakeholders when developing new ones. Designing and implementing simpler and more efficient trade Formalities is the third step. The re-engineered and streamlined processes may first be implemented based on paper documents, but can then be further improved through ICT and the development of Paperless trade systems. The ultimate step is to enable the electronic trade data and documents exchange by traders, government and service providers within national (single window and other) systems to be used and re-used to provide stakeholders in partner countries with the information they need to speed up the movement of goods and reduce the overall costs of trade.14
Figure 16: Moving up the trade facilitation ladder towards seamless international supply chains
Note: The figure shows cumulative trade facilitation implementation scores of ASEAN for five groups of trade facilitation measures included in the survey. Full implementation of all measures = 100.Source: ESCAP, based on the UN Global Survey on Trade Facilitation and Paperless Trade Implementation (2017)
Going forward, the ASEAN members should consider accelerating their efforts towards digital trade facilitation. The impact analysis of trade facilitation measures on ASEAN trade costs strongly supports the need for ASEAN to implement paperless trade and the seamless electronic exchange of trade data and documents among themselves and with other trade partners, to boost trade competitiveness. Trade costs reductions from an ambitious digital trade facilitation strategy – in line with existing intra-ASEAN trade facilitation commitments set out in the ASEAN Single Window and other existing ASEAN Agreements –are estimated at 20% of existing trade costs, as opposed to only about 5% if the target is only to achieve basic compliance with WTO TFA.
14 This step-by-step process is inspired from and generally consistent with the UN/CEFACT step-by-step approach to trade facilitation towards a single window environment.
24
Figure 16: Moving up the trade facilitation ladder towards seamless international supply chains
Note: the figure shows cumulative trade facilitation implementation scores of ASEAN for five groups of trade facilitation measures included in the survey. Full implementation of all measures = 100. Source: ESCAP, based on the UN Global Survey on Trade Facilitation and Paperless Trade Implementation (2017)
Going forward, the ASEAN members should consider accelerating their efforts towards digital trade facilitation. The impact analysis of trade facilitation measures on ASEAN trade costs strongly supports the need for ASEAN to implement paperless trade and the seamless electronic exchange of trade data and documents among themselves and with other trade partners, to boost trade competitiveness. Trade costs reductions from an ambitious digital trade facilitation strategy – in line with existing intra-ASEAN trade facilitation commitments set out in the ASEAN Single Window and other existing ASEAN Agreements –are estimated at 20% of existing trade costs, as opposed to only about 5% if the target is only to achieve basic compliance with WTO TFA.
In this respect, the Framework Agreement on Facilitation of Cross-Border Paperless Trade in Asia and the Pacific will not only complement the WTO TFA but also provides a unique platform for the ESCAP member states, including all ASEAN countries, towards realization of cross-border electronic exchange of trade-related data and documents. In the short term, participation in the agreement can substantially boost the development of the ASEAN Single Window and prepare it for interoperability with similar paperless trade systems being developed in other parts of the word. It may also help ASEAN countries promote their
0
20
40
60
80
100
Performance Area
Frontier (full implementation)
Brunei Darussalam
Cambodia
Indonesia
Lao PDR
Malaysia
Myanmar
Philippines
Singapore
Thailand
Viet Nam
South-East Asia
Institutionalarrangement
and cooperation
Transparency
Formalities
Paperlesstrade
Cross-borderpaperless
trade

29
In this respect, the Framework Agreement on Facilitation of Cross-Border Paperless Trade in Asia and the Pacific will not only complement the WTO TFA but also provides a unique platform for the ESCAP member states, including all ASEAN countries, towards realization of cross-border electronic exchange of trade-related data and documents. In the short term, participation in the agreement can substantially boost the development of the ASEAN Single Window and prepare it for interoperability with similar paperless trade systems being developed in other parts of the world. It may also help ASEAN countries promote their already existing paperless trade solutions to other regions. Accordingly, all ASEAN countries are encouraged to become parties of the agreement to reap the benefits as early as possible.
In the context of 2030 Agenda for sustainable development, ASEAN countries are also encouraged to develop and introduce new measures so that trade facilitation systems can more directly benefit SMEs and the agricultural sector, and facilitate the participation of women in trade.

30
ReferencesArvis, J., Y. Duval, B. Shepherd, C. Utoktham and A. RAJ (2016). Trade Costs in the Developing World: 1996–2010. World Trade Review, 15(3), 451-474. doi:10.1017/S147474561500052X
Asian Development Bank / United Nations, Economic and Social Commission for Asia and the Pacific (2017). Trade Facilitation and Better Connectivity for an Inclusive Asia and Pacific. Manila: Asian Development Bank. doi:http://dx.doi.org/10.22617/TCS178988-2
Duval, Y., T. Wang and C. Utoktham. (2015). Trade Facilitation and Paperless Trade: State of Play and The Way Forward for Asia and the Pacific, Studies in Trade and Investment No. 85, Economic and Social Commission for Asia and the Pacific. United Nations.
United Nations (2017). Trade Facilitation and Paperless Trade Implementation Global Report 2017. UN Regional Commissions. Available from https://unnext.unescap.org/content/un-global-survey-trade-facilitation-and-paperless-trade-implementation-2017
United Nations, Economic and Social Commission for Asia and the Pacific (2017). Asia-Pacific Trade and Investment Report 2017: Channeling Trade and Investment into Sustainable Development. Available from http://www.unescap.org/publications/APTIR2017
United Nations, Economic and Social Commission for Asia and the Pacific (2017). Trade Facilitation and Paperless Trade Implementation Asia-Pacific Report 2017. United Nations. Forthcoming.

31
Annex 1: Definition of the different stages of implementation
Definition of stage of implementation Coding/ Scoring
Full implementation: the trade facilitation measure implemented is in full compliance with commonly accepted international standards, recommendations and conventions (such as the Revised Kyoto Convention, UN/CEFACT Recommendations, or the WTO Trade Facilitation Agreement); it is implemented in law and in practice; it is available to essentially all relevant stakeholders nationwide, supported by adequate legal and institutional framework, as well as adequate infrastructure and financial and human resources.
3
Partial implementation: a measure is considered to be partially implemented if at least one of the following is true: (1) the trade facilitation measure is not in full compliance with commonly accepted international standards, recommendations and conventions; (2) the country is still in the process of rolling out the implementation of measure; (3) the measure is practiced on an unsustainable, short-term or ad-hoc basis; (4) the measure is not implemented in all targeted locations (such as key border crossing stations); or (5) not all targeted stakeholders are fully involved.
2
Pilot stage of implementation: A measure is considered to be at the pilot stage of implementation if, in addition to meeting the general attributes of partial implementation, it is available only to (or at) a very small portion of the intended stakeholder group (location) and/or is being implemented on a trial basis. When a new trade facilitation measure is under pilot stage of implementation, the old measure is often continuously used in parallel to ensure the service is provided in case of disruption of new measure. This stage of implementation also includes relevant rehearsals and preparation for the full-fledged implementation.
1
Not implemented: simply means a trade facilitation measure has not been implemented. However, this stage does not rule out initiatives or efforts towards implementation of the measure. For example, under this stage, (pre)feasibility or planning of implementation can be carried out; and consultation with stakeholders on the implementation may be arranged.
0


United Nations publications may be obtained from bookstores and distributors throughout the world.Please consult your bookstore or write to any of the following: Customers in: America, Asia and the Pacific Email: [email protected]: shop.un.orgTel: +17036611571Fax: + 1 703 996 1010 Mail Orders to:United Nations PublicationsPO Box 960Herndon, Virginia 20172United States of America Customers in: Europe, Africa and the Middle East United Nations Publicationsc/o Eurospan GroupEmail: [email protected]: un.org/publicationsTel: +44 (0) 1767 604972Fax: +44(0) 1767 601640 Mail orders to:United Nations PublicationsPegasus Drive, Stratton Business ParkBigglewade, Bedfordshire SG 18 8TOUnited Kingdom For further information on this publication, please address your enquiries to: ChiefConference and Documentation Service SectionOffice of the Executive SecretaryEconomic and Social Commission for Asia and the Pacific (ESCAP)United Nations BuildingRajadamnern Nok AvenueBangkok 10200, ThailandTel: 66 2 288-1110Fax: 66 2 288-3018E-mail: [email protected]

United NationsEconomic and Social Commission for Asia and the PacificTrade, Investment and Innovation DivisionUnited Nations Building, Ratchadamnoen Nok AvenueBangkok 10200, ThailandEmail: [email protected] www.unescap.org