trade and investment at a glance 2017 -...
TRANSCRIPT

TRADE AND INVESTMENTAT A GLANCE
2017
ISSN 1839-1834 (Print) ISSN 1839-1842 (Online) ISBN 978-1-74322-367-3 (PDF document) ISBN 978-1-74322-368-0 (Web page)
CREATIVE COMMONS
With the exception of the Commonwealth Coat of Arms and where otherwise noted, this publication is licensed under a Creative Commons Attribution 3.0 Australia licence.
http://creativecommons.org/licenses/by/3.0/au/
The publication should be attributed as Trade and Investment at a Glance 2017.
USE OF THE COAT OF ARMSThe terms under which the Coat of Arms can be used are detailed on the It’s an Honour website: www.itsanhonour.gov.au/coat-arms/
DATAUnless otherwise specified, all data is for the financial year 2016-17, released by the Australian Bureau of Statistics in September 2017.
CURRENCYUnless otherwise specified, all amounts are in Australian dollars.
ENQUIRIESEnquiries regarding the licence and use of this booklet are welcome in writing to:
Assistant Secretary Trade and Investment Advocacy Branch Department of Foreign Affairs and Trade R. G. Casey Building John McEwen Crescent Barton ACT 0221 Australia
Phone: +61 2 6261 1111
www.dfat.gov.au/trade

TRADE AND INVESTMENT AT A GLANCE 2017 1
CONTENTS
Minister’s Foreword 3
The Australian Economy 5
Profile of Australia’s Trade 2016-17 10
Australia’s Exports 2016-17 13
Minerals and Fuels 18
Services 20
Manufactures 24
Agriculture 26
Australia’s Imports 2016-17 28
Australia’s Foreign Investment 2016 33
Foreign Direct Investment 2016 37
Australian Direct Investment Abroad 2016 41
Australia’s Trade and Investment Framework 44
Economic Diplomacy 44
Free Trade Agreements 46
Trade Negotiations 47
FTA Portal 48
Global Value Chains 48
Trade Facilitation 48
Tourism 49
Trade with Aid Partners 49
Market Access for Least Developed Countries 49
Global Value Chains in Action 50
International Trade and Investment Architecture 52
World Trade Organization (WTO) 52
Group of Twenty (G20) 53
Asia-Pacific Economic Cooperation (APEC) 54
Association of Southeast Asian Nations (ASEAN) 55
Organisation for Economic Cooperation and Development (OECD) 56

2 TRADE AND INVESTMENT AT A GLANCE 2017
Our economy, with the market-oriented values of openness and
flexibility at its core, has weathered global and regional recessions and
continued creating jobs and growth. Labour and capital have been freer to move from declining sectors to new sources of growth – and as a result,
we now have an economy that backs our strength as a nation.
STEVEN CIOBO, MINISTER FOR TRADE, TOURISM AND INVESTMENT
Speech: The Importance of Asia in the 21st Century,
23 January 2017
3
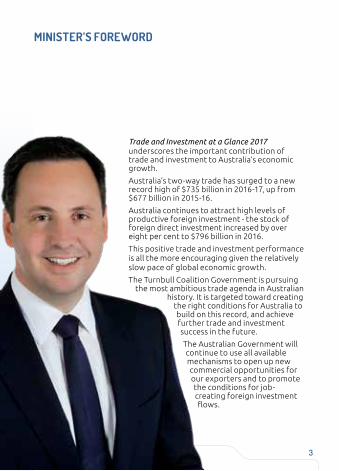
MINISTER’S FOREWORD
Trade and Investment at a Glance 2017 underscores the important contribution of trade and investment to Australia’s economic growth.
Australia’s two-way trade has surged to a new record high of $735 billion in 2016-17, up from $677 billion in 2015-16.
Australia continues to attract high levels of productive foreign investment - the stock of foreign direct investment increased by over eight per cent to $796 billion in 2016.
This positive trade and investment performance is all the more encouraging given the relatively slow pace of global economic growth.
The Turnbull Coalition Government is pursuing the most ambitious trade agenda in Australian
history. It is targeted toward creating the right conditions for Australia to build on this record, and achieve further trade and investment success in the future.
The Australian Government will continue to use all available mechanisms to open up new commercial opportunities for our exporters and to promote the conditions for job-creating foreign investment flows.
The Australian Government took a leadership role and concluded the Comprehensive and Progressive Agreement for Trans-Pacific Partnership. The Agreement will eliminate more than 98 per cent of tariffs in a trade zone with a combined GDP of $13.7 trillion and generate more Australian exports and create new Australian jobs.
Concluding more free trade agreements (FTAs) will remain a high priority – we recently concluded an FTA with Peru, one of the fastest growing economies in South America and the world. The Indonesian and Hong Kong markets remain priorities and engagement with India is ongoing. We also aim to launch negotiations with the European Union in 2018.
At the regional level, Australia is active in pressing for high quality outcomes in the Regional Comprehensive Economic Partnership (RCEP) negotiations and in Australia’s FTA negotiations with the Pacific Alliance.
At the multilateral and plurilateral level, Australia kick-started an initiative with Japan and Singapore towards future negotiations on electronic commerce to ensure international trade rules keep pace with technological change. Australia continues to lead efforts to address barriers impeding the expansion of Australia’s services exports, including through the proposed Trade in Services Agreement.
At the same time, we are working towards accession to the WTO’s Government Procurement Agreement to give Australian businesses certainty and recourse when bidding for government procurement contracts in markets worth nearly $2 trillion.
This agenda reflects the Turnbull Coalition Government’s strong commitment to open markets and to ensuring that trade and investment continue to fuel Australia’s growth and prosperity.
The Hon Steven Ciobo MP
4 TRADE AND INVESTMENT AT A GLANCE 2017

TRADE AND INVESTMENT AT A GLANCE 2017 5
THE AUSTRALIAN ECONOMY
In 2016-17 the Australian economy completed 26 continuous years of economic growth, the longest unbroken period of annual growth recorded by any major developed nation in modern times. Over the five years to 2022, Australia’s growth is forecast to exceed all major advanced economies.
Sources: various ABS catalogues, OECD Economic Outlook and UNCTAD database, 2016.
GDP GROWTH
OECD1.8%
INCREASE
AUSTRALIA2.5%
INCREASE
BUSINESS CONFIDENCE IN THE MANUFACTURING SECTOR
OECD0.1%
INCREASE
AUSTRALIA0.4%
INCREASE
GOODS AND SERVICESEXPORT VOLUMES GROWTH
OECD2.3%
INCREASE
AUSTRALIA7.4%
INCREASE
INWARD FDI - STOCKS (US$)
OECD5.2%
INCREASE
AUSTRALIA7.5%
INCREASE
6 TRADE AND INVESTMENT AT A GLANCE 2017
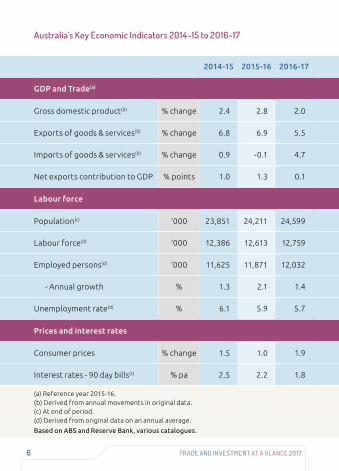
Australia’s Key Economic Indicators 2014-15 to 2016-17
2014-15 2015-16 2016-17
GDP and Trade(a)
Gross domestic product(b) % change 2.4 2.8 2.0
Exports of goods & services(b) % change 6.8 6.9 5.5
Imports of goods & services(b) % change 0.9 -0.1 4.7
Net exports contribution to GDP % points 1.0 1.3 0.1
Labour force
Population(c) ‘000 23,851 24,211 24,599
Labour force(d) ‘000 12,386 12,613 12,759
Employed persons(d) ‘000 11,625 11,871 12,032
- Annual growth % 1.3 2.1 1.4
Unemployment rate(d) % 6.1 5.9 5.7
Prices and interest rates
Consumer prices % change 1.5 1.0 1.9
Interest rates - 90 day bills(c) % pa 2.5 2.2 1.8
(a) Reference year 2015-16.(b) Derived from annual movements in original data.(c) At end of period.(d) Derived from original data on an annual average.
Based on ABS and Reserve Bank, various catalogues.

TRADE AND INVESTMENT AT A GLANCE 2017 7
The Australian Stock Exchange is the world's 16th largest - by
market capitalisation, 2016 WORLD FEDERATION OF EXCHANGES
The Australian dollar is the world’s 5th most traded
currency – 2016BANK OF INTERNATIONAL SETTLEMENTS
Australia has the largest pool of investment funds
under management in Asia, and 6th largest in the world
- 2016-17INVESTMENT COMPANY INSTITUTE
Australia has completed its 26th year of consecutive
economic growth – 2016-17
AUSTRALIAN BUREAU OF STATISTICS
Australia is the second wealthiest nation
in the world - per adult, 2016
GLOBAL WEALTH REPORT, CREDIT SUISSE
#5
$$$
Australia is estimated to have the world’s
13th highest GDP overall and 11th highest GDP
per capita – 2016
INTERNATIONAL MONETARY FUND

8 TRADE AND INVESTMENT AT A GLANCE 2017
Australia’s Industry Structure 2016-17
Gross value added(a) Employed persons(b)
$m % share(c) ‘000 % share
Agriculture, forestry & fishing 48,547 3.0 302.6 2.5
Mining 130,197 8.0 228.9 1.9
Manufacturing 100,836 6.2 904.6 7.5
Services 1,199,384 73.7 10,604.7 88.1
Electricity, gas, water & waste 42,145 2.6 132.6 1.1
Construction 131,258 8.1 1,080.5 9.0
Wholesale trade 67,633 4.2 377.1 3.1
Retail trade 76,836 4.7 1,224.0 10.2
Accommodation & food services 38,904 2.4 861.5 7.2
Transport, postal & warehousing 79,800 4.9 612.6 5.1
Information, media & telecommunications 43,858 2.7 209.2 1.7
Finance & insurance 150,819 9.3 431.6 3.6
Rental, hiring & real estate 52,567 3.2 208.7 1.7
Professional, scientific & technical 121,750 7.5 1,025.5 8.5
TRADE AND INVESTMENT AT A GLANCE 2017 9
Gross value added(a) Employed persons(b)
$m % share(c) ‘000 % share
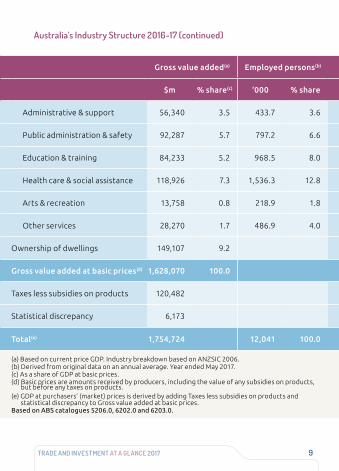
Administrative & support 56,340 3.5 433.7 3.6
Public administration & safety 92,287 5.7 797.2 6.6
Education & training 84,233 5.2 968.5 8.0
Health care & social assistance 118,926 7.3 1,536.3 12.8
Arts & recreation 13,758 0.8 218.9 1.8
Other services 28,270 1.7 486.9 4.0
Ownership of dwellings 149,107 9.2
Gross value added at basic prices(d) 1,628,070 100.0
Taxes less subsidies on products 120,482
Statistical discrepancy 6,173
Total(e) 1,754,724 12,041 100.0
(a) Based on current price GDP. Industry breakdown based on ANZSIC 2006.(b) Derived from original data on an annual average. Year ended May 2017.(c) As a share of GDP at basic prices.(d) Basic prices are amounts received by producers, including the value of any subsidies on products,
but before any taxes on products.(e) GDP at purchasers’ (market) prices is derived by adding Taxes less subsidies on products and
statistical discrepancy to Gross value added at basic prices.Based on ABS catalogues 5206.0, 6202.0 and 6203.0.
Australia’s Industry Structure 2016-17 (continued)

10 TRADE AND INVESTMENT AT A GLANCE 2017
Profile of Australia’s Trade 2016-17Australia’s two way trade in goods and services grew at a strong pace in 2016-17. Two-way trade recorded an 8.7 per cent rise to $735.5 billion, up from $676.6 billion in 2015-16, to reach a new record high. Australia’s top five trading partners were China, Japan, the United States, the Republic of Korea and the United Kingdom.
Australia’s Top 5 Two-Way Trading Partners 2016-17OTHER(a)
$25,722mAFRICA
$8,504m
OCEANIA $36,986m
AMERICAS $85,674m
EUROPE $110,522m
OTHER ASIA $85,429m
ASEAN $100,560m
REPUBLIC OF KOREA $38,766m
JAPAN $68,608m
CHINA $174,714m
OTHE
R 36
.4%
ASIA
63.
6%
3. USA
2. JAPAN
1. CHINA
5. UNITEDKINGDOM 4. REPUBLIC
OF KOREA

TRADE AND INVESTMENT AT A GLANCE 2017 11
Australia’s Two-Way Trade by Region 2016-17
OTHER(a)
$25,722mAFRICA
$8,504m
OCEANIA $36,986m
AMERICAS $85,674m
EUROPE $110,522m
OTHER ASIA $85,429m
ASEAN $100,560m
REPUBLIC OF KOREA $38,766m
JAPAN $68,608m
CHINA $174,714m
OTHE
R 36
.4%
ASIA
63.
6%
Regional breakdowns:
Asia includes Central Asia; Middle East; North Asia; South East Asia and Southern Asia.Europe includes Eastern Europe; Northern Europe; South Eastern Europe, Southern Europe and Western Europe.Americas includes North America; the Caribbean; Central America and South America.Oceania includes Antarctica and Pacific Island countries and territories.Africa includes Central and West Africa; North Africa and Southern and East Africa.(a) Includes confidential items of trade.
Based on ABS catalogues 5368.0 and 5368.0.55.004 and unpublished ABS data.
3. USA
2. JAPAN
1. CHINA
5. UNITEDKINGDOM 4. REPUBLIC
OF KOREA

12 TRADE AND INVESTMENT AT A GLANCE 2017
Australia’s Top 10 Two-Way Trading Partners(a)(b) 2016-17
($ billion)
Rank Country Goods Services Total % share
1 China 157.2 17.5 174.7 23.8
2 Japan 62.9 5.7 68.6 9.3
3 United States 42.7 23.8 66.5 9.0
4 Republic of Korea 35.5 3.3 38.8 5.3
5 United Kingdom 14.0 13.5 27.5 3.7
6 New Zealand 16.5 10.3 26.8 3.6
7 India 19.6 6.1 25.7 3.5
8 Singapore 14.1 10.5 24.7 3.4
9 Thailand 18.0 3.8 21.8 3.0
10 Germany 16.2 4.4 20.6 2.8
Total top 10 trading partners 396.8 98.9 495.6 67.4
Total two-way trade(c) 569.5 166.0 735.5
of which: APEC 428.1 100.6 528.7 71.9
ASEAN 72.7 27.9 100.6 13.7
EU28 67.9 31.6 99.5 13.5
OECD 240.4 80.9 321.3 43.7
(a) All data is on a balance of payments basis, except for goods by country which are on a recorded trade basis.
(b) May exclude selected confidential export and import commodities. Refer to the DFAT website (http://dfat.gov.au/about-us/ publications/trade-investment/Pages/dfat-adjustments-to-abs-official-trade-data.aspx) for more information and a list of the commodities excluded.
(c) Totals may not add due to rounding.
Based on ABS trade data on DFAT STARS database, ABS catalogue 5368.0.05.003 and unpublished ABS data.
TRADE AND INVESTMENT AT A GLANCE 2017 13
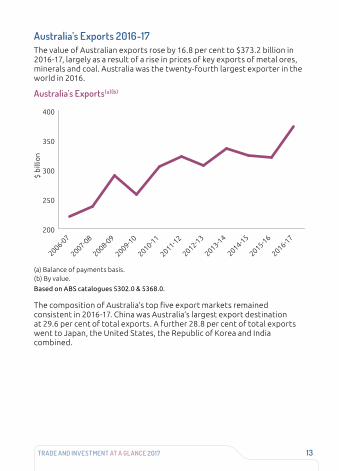
Australia’s Exports 2016-17The value of Australian exports rose by 16.8 per cent to $373.2 billion in 2016-17, largely as a result of a rise in prices of key exports of metal ores, minerals and coal. Australia was the twenty-fourth largest exporter in the world in 2016.
Australia’s Exports(a)(b)
(a) Balance of payments basis.(b) By value.
Based on ABS catalogues 5302.0 & 5368.0.
The composition of Australia’s top five export markets remained consistent in 2016-17. China was Australia’s largest export destination at 29.6 per cent of total exports. A further 28.8 per cent of total exports went to Japan, the United States, the Republic of Korea and India combined.
200
250
300
350
400
2016-17
2015-16
2014-15
2013-14
2012-13
2011-12
2010-11
2009-10
2008-09
2007-08
2006-07
$ b
illio
n

14 TRADE AND INVESTMENT AT A GLANCE 2017
Australia’s Top 10 Export Markets(a) (b) 2016-17
($ billion)
Rank Market Goods Services Total % share
1 China 95.7 14.7 110.4 29.6
2 Japan 42.2 2.5 44.6 12.0
3 Republic of Korea 20.5 2.3 22.8 6.1
4 United States 12.3 8.5 20.8 5.6
5 India 15.1 4.1 19.2 5.1
6 Hong Kong(c) 12.9 2.9 15.8 4.2
7 New Zealand 8.8 5.2 14.0 3.8
8 United Kingdom 7.3 5.3 12.6 3.4
9 Singapore 5.8 5.4 11.2 3.0
10 Taiwan 8.6 1.3 10.0 2.7
Total top 10 markets 229.4 52.0 281.4 75.4
Total exports(d) 291.6 81.6 373.2
of which: APEC 234.7 522.0 286.9 76.9
ASEAN 29.2 131.0 42.3 11.3
EU28 19.0 116.0 30.5 8.2
OECD 107.7 325.0 140.3 37.6
(a) All data is on a balance of payments basis, except for goods by country which are on a recorded trade basis.
(b) May exclude selected confidential export commodities. Refer to the DFAT website (http://dfat.gov.au/about-us/ publications/trade-investment/Pages/dfat-adjustments-to-abs-official-trade-data.aspx) for more information and a list of the commodities excluded.
(c) Special Administrative Region of China.(d) Totals may not add due to rounding.
Based on ABS trade data on DFAT STARS database, ABS catalogue 5368.0.55.003 and unpublished ABS data.

TRADE AND INVESTMENT AT A GLANCE 2017 15
Australia’s Global Export Ranking 2016
How we compare with the rest of the world (US$ billion)
Rank Country Goods(a) Services(b) Total exports % share
1 China 2,098 208 2,307 11.1
2 United States 1,455 752 2,207 10.6
3 Germany 1,340 273 1,612 7.7
4 Japan 645 174 819 3.9
5 Netherlands 570 180 749 3.6
6 France 501 237 738 3.5
7 United Kingdom 409 327 737 3.5
8 Hong Kong(c) 517 98 615 3.0
9 Republic of Korea 495 93 588 2.8
10 Italy 462 101 563 2.7
11 Belgium 396 111 507 2.4
12 Singapore 330 150 479 2.3
13 Canada 390 81 471 2.3
14 India 264 162 426 2.0
15 Switzerland 303 114 418 2.0
24 Australia 192 58 250 1.2
Total exports 15,955 4,879 20,834
(a) Goods on recorded trade basis.(b) Services on balance of payments basis.(c) Special Administrative Region of China.
Source: WTO online database.
16 TRADE AND INVESTMENT AT A GLANCE 2017
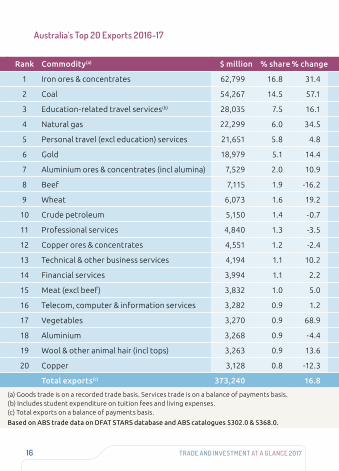
Australia’s Top 20 Exports 2016-17
Rank Commodity(a) $ million % share % change
1 Iron ores & concentrates 62,799 16.8 31.4
2 Coal 54,267 14.5 57.1
3 Education-related travel services(b) 28,035 7.5 16.1
4 Natural gas 22,299 6.0 34.5
5 Personal travel (excl education) services 21,651 5.8 4.8
6 Gold 18,979 5.1 14.4
7 Aluminium ores & concentrates (incl alumina) 7,529 2.0 10.9
8 Beef 7,115 1.9 -16.2
9 Wheat 6,073 1.6 19.2
10 Crude petroleum 5,150 1.4 -0.7
11 Professional services 4,840 1.3 -3.5
12 Copper ores & concentrates 4,551 1.2 -2.4
13 Technical & other business services 4,194 1.1 10.2
14 Financial services 3,994 1.1 2.2
15 Meat (excl beef) 3,832 1.0 5.0
16 Telecom, computer & information services 3,282 0.9 1.2
17 Vegetables 3,270 0.9 68.9
18 Aluminium 3,268 0.9 -4.4
19 Wool & other animal hair (incl tops) 3,263 0.9 13.6
20 Copper 3,128 0.8 -12.3
Total exports(c) 373,240 16.8
(a) Goods trade is on a recorded trade basis. Services trade is on a balance of payments basis.(b) Includes student expenditure on tuition fees and living expenses.(c) Total exports on a balance of payments basis.
Based on ABS trade data on DFAT STARS database and ABS catalogues 5302.0 & 5368.0.
TRADE AND INVESTMENT AT A GLANCE 2017 17
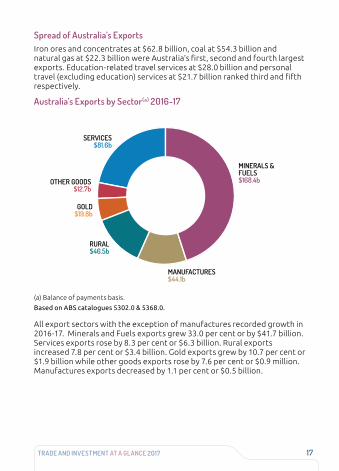
Spread of Australia’s ExportsIron ores and concentrates at $62.8 billion, coal at $54.3 billion and natural gas at $22.3 billion were Australia’s first, second and fourth largest exports. Education-related travel services at $28.0 billion and personal travel (excluding education) services at $21.7 billion ranked third and fifth respectively.
Australia’s Exports by Sector(a) 2016-17
(a) Balance of payments basis.
Based on ABS catalogues 5302.0 & 5368.0.
All export sectors with the exception of manufactures recorded growth in 2016-17. Minerals and Fuels exports grew 33.0 per cent or by $41.7 billion. Services exports rose by 8.3 per cent or $6.3 billion. Rural exports increased 7.8 per cent or $3.4 billion. Gold exports grew by 10.7 per cent or $1.9 billion while other goods exports rose by 7.6 per cent or $0.9 million. Manufactures exports decreased by 1.1 per cent or $0.5 billion.
SERVICES$81.6b
OTHER GOODS$12.7b
GOLD$19.8b
MANUFACTURES$44.1b
MINERALS & FUELS$168.4b
RURAL$46.5b
Rank Commodity(a) $ million % share % change
1 Iron ores & concentrates 62,799 16.8 31.4
2 Coal 54,267 14.5 57.1
3 Education-related travel services(b) 28,035 7.5 16.1
4 Natural gas 22,299 6.0 34.5
5 Personal travel (excl education) services 21,651 5.8 4.8
6 Gold 18,979 5.1 14.4
7 Aluminium ores & concentrates (incl alumina) 7,529 2.0 10.9
8 Beef 7,115 1.9 -16.2
9 Wheat 6,073 1.6 19.2
10 Crude petroleum 5,150 1.4 -0.7
11 Professional services 4,840 1.3 -3.5
12 Copper ores & concentrates 4,551 1.2 -2.4
13 Technical & other business services 4,194 1.1 10.2
14 Financial services 3,994 1.1 2.2
15 Meat (excl beef) 3,832 1.0 5.0
16 Telecom, computer & information services 3,282 0.9 1.2
17 Vegetables 3,270 0.9 68.9
18 Aluminium 3,268 0.9 -4.4
19 Wool & other animal hair (incl tops) 3,263 0.9 13.6
20 Copper 3,128 0.8 -12.3
Total exports(c) 373,240 16.8
(a) Goods trade is on a recorded trade basis. Services trade is on a balance of payments basis.(b) Includes student expenditure on tuition fees and living expenses.(c) Total exports on a balance of payments basis.
Based on ABS trade data on DFAT STARS database and ABS catalogues 5302.0 & 5368.0.

18 TRADE AND INVESTMENT AT A GLANCE 2017
Minerals and FuelsMinerals and Fuels exports reached $168.4 billion and accounted for over 45 per cent of total exports in 2016-17.
Australia’s Minerals and Fuels Exports (a)(b)
(a) Balance of payments basis.(b) By value.
Based on ABS catalogues 5302.0 & 5368.0.
60
90
120
150
180
2016-17
2015-16
2014-15
2013-14
2012-13
2011-12
2010-11
2009-10
2008-09
2007-08
2006-07
$ b
illio
n
Rank Commodity(a)(b) $ million % share % change
1 Iron ores & concentrates 62,799 37.3 31.4
2 Coal 54,267 32.2 57.1
3 Natural gas 22,299 13.2 34.5
4 Aluminium ores & conc (incl alumina) 7,529 4.5 10.9
5 Crude petroleum 5,150 3.1 -0.7
6 Copper ores & concentrates 4,551 2.7 -2.4
7 Other ores & concentrates(c) 2,601 1.5 -24.7
8 Refined petroleum 2,347 1.4 20.3
9 Precious metal ores & conc (excl gold) 1,673 1.0 3.1
10 Non-ferrous waste & scrap 1,110 0.7 11.7
11 Crude minerals, nes 739 0.4 83.8
12 Ferrous waste & scrap 675 0.4 23.2
13 Liquefied propane & butane 630 0.4 15.1
14 Nickel ores & concentrates 241 0.1 -62.4
15 Stone, sand & gravel 126 0.1 10.1
16 Natural abrasives 85 0.1 -16.0
17 Residual petroleum products, nes 19 0.0 47.5
18 Petroleum gases 15 0.0 177.4
19 Crude fertilisers 12 0.0 1.3
20 Uranium or thorium ores & conc 2 0.0 9.1
Total minerals & fuels exports(d) 168,396 33.0
(a) Recorded trade basis.(b) Excludes confidential items of trade.(c) Mainly Zinc ores & concentrates, Manganese ores & concentrates and Lead ores & concentrates.(d) Total minerals and fuels exports on a balance of payments basis.
Based on ABS trade data on DFAT STARS database and ABS catalogues 5302.0 & 5368.0.

TRADE AND INVESTMENT AT A GLANCE 2017 19
Australia’s Top 20 Minerals and Fuels Exports 2016-17
Rank Commodity(a)(b) $ million % share % change
1 Iron ores & concentrates 62,799 37.3 31.4
2 Coal 54,267 32.2 57.1
3 Natural gas 22,299 13.2 34.5
4 Aluminium ores & conc (incl alumina) 7,529 4.5 10.9
5 Crude petroleum 5,150 3.1 -0.7
6 Copper ores & concentrates 4,551 2.7 -2.4
7 Other ores & concentrates(c) 2,601 1.5 -24.7
8 Refined petroleum 2,347 1.4 20.3
9 Precious metal ores & conc (excl gold) 1,673 1.0 3.1
10 Non-ferrous waste & scrap 1,110 0.7 11.7
11 Crude minerals, nes 739 0.4 83.8
12 Ferrous waste & scrap 675 0.4 23.2
13 Liquefied propane & butane 630 0.4 15.1
14 Nickel ores & concentrates 241 0.1 -62.4
15 Stone, sand & gravel 126 0.1 10.1
16 Natural abrasives 85 0.1 -16.0
17 Residual petroleum products, nes 19 0.0 47.5
18 Petroleum gases 15 0.0 177.4
19 Crude fertilisers 12 0.0 1.3
20 Uranium or thorium ores & conc 2 0.0 9.1
Total minerals & fuels exports(d) 168,396 33.0
(a) Recorded trade basis.(b) Excludes confidential items of trade.(c) Mainly Zinc ores & concentrates, Manganese ores & concentrates and Lead ores & concentrates.(d) Total minerals and fuels exports on a balance of payments basis.
Based on ABS trade data on DFAT STARS database and ABS catalogues 5302.0 & 5368.0.

20 TRADE AND INVESTMENT AT A GLANCE 2017
ServicesServices exports reached $81.6 billion and accounted for 21.9 per cent of Australia’s total exports in 2016-17. The sector continued its growth trend of the past five years.
Australia’s Services Exports(a)(b)
(a) Balance of payments basis.(b) By value.
Based on ABS catalogues 5302.0 & 5368.0.
40
60
80
100
2016-17
2015-16
2014-15
2013-14
2012-13
2011-12
2010-11
2009-10
2008-09
2007-08
2006-07
$ b
illio
n
Growth in services exports will be one of the driving forces that fuels
Australia’s economy beyond our current 26 years of continuous growth.
STEVEN CIOBO, MINISTER FOR TRADE, TOURISM AND INVESTMENT Media Release: Australia’s Booming Trade in Services, 11 August 2017
$ million % share % change
Manufactured services on physical inputs owned by others 21 0.0 23.5
Maintenance & repair 61 0.1 -15.3
Transport 7,533 9.2 8.7
Passenger(b) 2,833 3.5 3.3
Freight 296 0.4 3.9
Other 2,884 3.5 7.1
Postal & courier services 1,520 1.9 25.6
Travel 52,745 64.6 10.5
Business 3,059 3.7 4.9
Personal 49,686 60.9 10.9
Education-related 28,035 34.3 16.1
Other personal(c) 21,651 26.5 4.8
Other business services 21,282 26.1 3.2
Construction 393 0.5 142.6
Insurance & pension 516 0.6 -7.2
Financial 3,994 4.9 2.2
Intellectual property charges 1,247 1.5 17.2
Telecommunications, computer & information 3,282 4.0 1.2
Other business services 9,927 12.2 2.0
Personal, cultural and recreational 861 1.1 -8.4
Government services 1,062 1.3 4.1
Total services exports 81,642 8.3
(a) Balance of payments basis.(b) Passenger services include air transport-related agency fees & commissions.(c) Inbound tourism for mainly recreational purposes.
Based on ABS catalogues 5302.0 & 5368.0.

TRADE AND INVESTMENT AT A GLANCE 2017 21
Australia’s Services Exports(a) 2016-17
$ million % share % change
Manufactured services on physical inputs owned by others 21 0.0 23.5
Maintenance & repair 61 0.1 -15.3
Transport 7,533 9.2 8.7
Passenger(b) 2,833 3.5 3.3
Freight 296 0.4 3.9
Other 2,884 3.5 7.1
Postal & courier services 1,520 1.9 25.6
Travel 52,745 64.6 10.5
Business 3,059 3.7 4.9
Personal 49,686 60.9 10.9
Education-related 28,035 34.3 16.1
Other personal(c) 21,651 26.5 4.8
Other business services 21,282 26.1 3.2
Construction 393 0.5 142.6
Insurance & pension 516 0.6 -7.2
Financial 3,994 4.9 2.2
Intellectual property charges 1,247 1.5 17.2
Telecommunications, computer & information 3,282 4.0 1.2
Other business services 9,927 12.2 2.0
Personal, cultural and recreational 861 1.1 -8.4
Government services 1,062 1.3 4.1
Total services exports 81,642 8.3
(a) Balance of payments basis.(b) Passenger services include air transport-related agency fees & commissions.(c) Inbound tourism for mainly recreational purposes.
Based on ABS catalogues 5302.0 & 5368.0.

22 TRADE AND INVESTMENT AT A GLANCE 2017
TourismTourism is Australia’s largest services industry export. In 2016-17, the number of international visitors to Australia increased by 9 per cent to 8.6 million, pushing up international tourism expenditure by 7 per cent to $40.6 billion.
(a) Department of Immigration and Border Protection. (b) Tourism Research Australia.
In 2016-17:• Tourism’s direct contribution to GDP rose 6.1 per cent to $55 billion
(3.2 per cent of national GDP).• Tourism industry exports rose 7.6 per cent to $37.2 billion
(10 per cent of total Australian exports).• Tourism directly employed 598 200 people or 4.9 per cent of
Australia’s total employment: one in 20 jobs. Source: National Tourism Satellite Accounts 2016-17.
Rank Country Number of visitors (‘000) % change
1 New Zealand 1,353 2.1
2 China 1,259 9.9
3 United States 759 14.2
4 United Kingdom 727 3.2
5 Singapore 432 3.1
6 Malaysia 406 13.1
7 Japan 429 12.7
8 Republic of Korea 289 12.7
9 India 280 15.0
10 Hong Kong(a) 259 10.3
(a) Special Administrative Region of China.
Source: Department of Immigration and Border Protection.
Visitor numbers8.6 million(a)
Visitor expenditure$40.6 billion(b)
9%INCREASE
▲
$$$$$$$$$$$$$$$$$$$$$$$$$$$$$$$$$$$$$$$$$$$$$$$$$$$$$$$$$$$$$$$$$$$$$$$$$$$$$$$$$$$$$$$$$$$$$$$$$$$$$$$$$$$$$$$$$$$$$$$$$$$$$$
7%INCREASE
▲

TRADE AND INVESTMENT AT A GLANCE 2017 23
Australia’s International Visitors 2016-17
Rank Country Number of visitors (‘000) % change
1 New Zealand 1,353 2.1
2 China 1,259 9.9
3 United States 759 14.2
4 United Kingdom 727 3.2
5 Singapore 432 3.1
6 Malaysia 406 13.1
7 Japan 429 12.7
8 Republic of Korea 289 12.7
9 India 280 15.0
10 Hong Kong(a) 259 10.3
(a) Special Administrative Region of China.
Source: Department of Immigration and Border Protection.
Australia’s Top 10 International Visitor Expenditure Sources 2016-17
Rank Country Total trip spend ($ million) % change
1 China 9,780 9.8
2 United States 3,776 4.0
3 United Kingdom 3,531 -8.3
4 New Zealand 2,666 0.3
5 Japan 1,752 14.7
6 Republic of Korea 1,515 0.1
7 Singapore 1,462 0.5
8 India 1,431 29.5
9 Malaysia 1,335 11.2
10 Hong Kong(a) 1,118 9.7
(a) Special Administrative Region of China.
Source: Tourism Research Australia International visitors in Australia.

24 TRADE AND INVESTMENT AT A GLANCE 2017
Intellectual PropertyAustralian royalties for intellectual property (IP) services reached $1.4 billion in exports and $5.9 billion in imports in 2016-17, with Australia a net exporter of IP to non-OECD countries. Australia supports international arrangements for the effective and balanced protection and use of intellectual property.
ManufacturesManufactures exports fell by 1.1 per cent or $0.5 billion to $44.1 billion in 2016-17. Manufacturing accounted for over 900,000 jobs in Australia.
Australia’s Manufactures Exports(a)(b)
(a) Balance of payments basis.(b) By value.
Based on ABS catalogues 5302.0 & 5368.0.
In 2016-17, Australia’s top five manufacturing exports were aluminium, copper, medicaments, aircraft, spacecraft and parts, and telecom equipment and parts.
30
35
40
45
50
2016-17
2015-16
2014-15
2013-14
2012-13
2011-12
2010-11
2009-10
2008-09
2007-08
2006-07
$ b
illio
n

TRADE AND INVESTMENT AT A GLANCE 2017 25
Australia’s Top 20 Manufactures Exports 2016-17
Rank Commodity(a)(b) $ million % share % change
1 Aluminium 3,268 7.4 -4.4
2 Copper 3,128 7.1 -12.3
3 Medicaments (incl veterinary) 2,183 4.9 11.3
4 Aircraft, spacecraft & parts 1,802 4.1 -11.6
5 Telecom equipment & parts 1,750 4.0 2.9
6 Medical instruments (incl veterinary) 1,601 3.6 14.6
7 Passenger motor vehicles 1,590 3.6 -18.8
8 Pharm products (excl medicaments) 1,317 3.0 27.5
9 Zinc 1,267 2.9 2.7
10 Lead 1,260 2.9 18.6
11 Misc manufactured articles, nes 1,001 2.3 -0.3
12 Measuring & analysing instruments 935 2.1 -1.2
13 Paper & paperboard 889 2.0 1.8
14 Pigments, paints & varnishes 856 1.9 10.4
15 Specialised machinery & parts 805 1.8 10.9
16 Computers 773 1.8 23.0
17 Vehicle parts & accessories 754 1.7 0.7
18 Pearls & gems 733 1.7 -12.3
19 Civil engineering equipment & parts 723 1.6 -11.5
20 Perfumery & cosmetics (excl soap) 694 1.6 22.0
Total manufactures exports(c) 44,121 -1.1
(a) Recorded trade basis.(b) Excludes confidential items of trade.(c) Total manufactures exports on a balance of payments basis.
Based on ABS trade data on DFAT STARS database and ABS catalogues 5302.0 & 5368.0.
26 TRADE AND INVESTMENT AT A GLANCE 2017
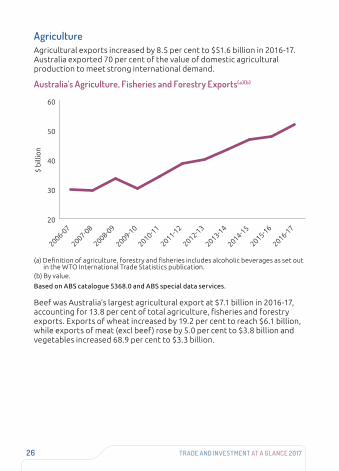
AgricultureAgricultural exports increased by 8.5 per cent to $51.6 billion in 2016-17. Australia exported 70 per cent of the value of domestic agricultural production to meet strong international demand.
Australia’s Agriculture, Fisheries and Forestry Exports(a)(b)
(a) Definition of agriculture, forestry and fisheries includes alcoholic beverages as set out in the WTO International Trade Statistics publication.
(b) By value.
Based on ABS catalogue 5368.0 and ABS special data services.
Beef was Australia’s largest agricultural export at $7.1 billion in 2016-17, accounting for 13.8 per cent of total agriculture, fisheries and forestry exports. Exports of wheat increased by 19.2 per cent to reach $6.1 billion, while exports of meat (excl beef) rose by 5.0 per cent to $3.8 billion and vegetables increased 68.9 per cent to $3.3 billion.
20
30
40
50
60
2016-17
2015-16
2014-15
2013-14
2012-13
2011-12
2010-11
2009-10
2008-09
2007-08
2006-07
$ b
illio
n
TRADE AND INVESTMENT AT A GLANCE 2017 27
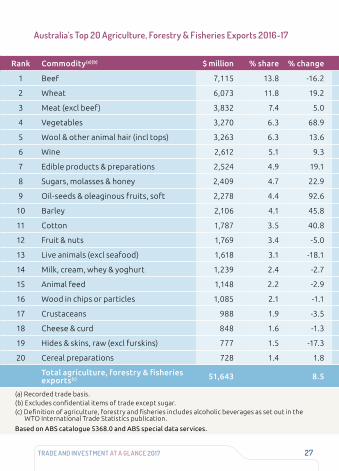
Australia’s Top 20 Agriculture, Forestry & Fisheries Exports 2016-17
Rank Commodity(a)(b) $ million % share % change
1 Beef 7,115 13.8 -16.2
2 Wheat 6,073 11.8 19.2
3 Meat (excl beef) 3,832 7.4 5.0
4 Vegetables 3,270 6.3 68.9
5 Wool & other animal hair (incl tops) 3,263 6.3 13.6
6 Wine 2,612 5.1 9.3
7 Edible products & preparations 2,524 4.9 19.1
8 Sugars, molasses & honey 2,409 4.7 22.9
9 Oil-seeds & oleaginous fruits, soft 2,278 4.4 92.6
10 Barley 2,106 4.1 45.8
11 Cotton 1,787 3.5 40.8
12 Fruit & nuts 1,769 3.4 -5.0
13 Live animals (excl seafood) 1,618 3.1 -18.1
14 Milk, cream, whey & yoghurt 1,239 2.4 -2.7
15 Animal feed 1,148 2.2 -2.9
16 Wood in chips or particles 1,085 2.1 -1.1
17 Crustaceans 988 1.9 -3.5
18 Cheese & curd 848 1.6 -1.3
19 Hides & skins, raw (excl furskins) 777 1.5 -17.3
20 Cereal preparations 728 1.4 1.8
Total agriculture, forestry & fisheries exports(c) 51,643 8.5
(a) Recorded trade basis.(b) Excludes confidential items of trade except sugar.(c) Definition of agriculture, forestry and fisheries includes alcoholic beverages as set out in the
WTO International Trade Statistics publication.
Based on ABS catalogue 5368.0 and ABS special data services.
28 TRADE AND INVESTMENT AT A GLANCE 2017
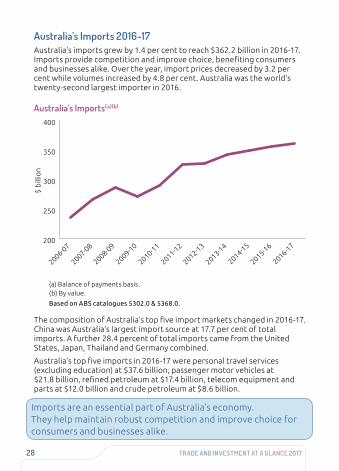
Australia’s Imports 2016-17Australia’s imports grew by 1.4 per cent to reach $362.2 billion in 2016-17. Imports provide competition and improve choice, benefiting consumers and businesses alike. Over the year, import prices decreased by 3.2 per cent while volumes increased by 4.8 per cent. Australia was the world’s twenty-second largest importer in 2016.
Australia’s Imports(a)(b)
(a) Balance of payments basis. (b) By value.
Based on ABS catalogues 5302.0 & 5368.0.
The composition of Australia’s top five import markets changed in 2016-17. China was Australia’s largest import source at 17.7 per cent of total imports. A further 28.4 percent of total imports came from the United States, Japan, Thailand and Germany combined.
Australia’s top five imports in 2016-17 were personal travel services (excluding education) at $37.6 billion, passenger motor vehicles at $21.8 billion, refined petroleum at $17.4 billion, telecom equipment and parts at $12.0 billion and crude petroleum at $8.6 billion.
200
250
300
350
400
2016-17
2015-16
2014-15
2013-14
2012-13
2011-12
2010-11
2009-10
2008-09
2007-08
2006-07
$ b
illio
n
Imports are an essential part of Australia’s economy. They help maintain robust competition and improve choice for consumers and businesses alike.

TRADE AND INVESTMENT AT A GLANCE 2017 29
Australia’s Top 10 Import Sources (a)(b) 2016-17
($ billion)
Rank Country Goods Services Total % share
1 China 61.5 2.8 64.3 17.7
2 United States 30.4 15.3 45.7 12.6
3 Japan 20.7 3.3 24.0 6.6
4 Thailand 14.1 2.6 16.7 4.6
5 Germany 13.6 2.7 16.3 4.5
6 Republic of Korea 15.0 1.0 16.0 4.4
7 United Kingdom 6.7 8.2 14.8 4.1
8 Singapore 8.3 5.2 13.5 3.7
9 New Zealand 7.6 5.1 12.8 3.5
10 Malaysia 10.4 0.9 11.3 3.1
Total top 10 sources 188.3 47.1 235.4 65.0
Total imports(c) 277.9 84.3 362.2
of which: APEC 193.4 48.4 241.7 66.7
ASEAN 43.5 14.8 58.3 16.1
EU28 49.0 20.0 69.0 19.1
OECD 132.5 48.4 180.8 49.9
(a) All data is on a balance of payments basis, except for goods by country which are on a recorded trade basis.
(b) May exclude selected confidential import commodities. Refer to the DFAT website (http://dfat.gov.au/about-us/ publications/trade-investment/Pages/dfat-adjustments-to-abs-official-trade-data.aspx) for more information and a list of the commodities excluded.
(c) Totals may not add due to rounding.
Based on ABS trade data on DFAT STARS database, ABS catalogue 5368.0.05.003 and unpublished ABS data.

30 TRADE AND INVESTMENT AT A GLANCE 2017
Australia’s Global Import Ranking 2016
How we compare with the rest of the world (US$ billion)
Rank Country Goods(a) Services(b) Total imports % share
1 United States 2,251 503 2,754 13.1
2 China 1,587 453 2,040 9.7
3 Germany 1,055 312 1,367 6.5
4 United Kingdom 636 199 834 4.0
5 France 573 236 809 3.8
6 Japan 607 185 792 3.8
7 Netherlands 503 169 673 3.2
8 Hong Kong(c) 547 74 622 3.0
9 Republic of Korea 406 110 517 2.5
10 Canada 417 97 514 2.4
11 Italy 404 104 508 2.4
12 India 359 134 493 2.3
13 Belgium 367 107 475 2.3
14 Singapore 283 156 439 2.1
15 Mexico 398 32 429 2.0
22 Australia 189 62 251 1.2
Total imports 15,955 4,879 21,022
(a) Goods on recorded trade basis.(b) Services on balance of payments basis.(c) Special Administrative Region of China.
Source: WTO online database.
TRADE AND INVESTMENT AT A GLANCE 2017 31
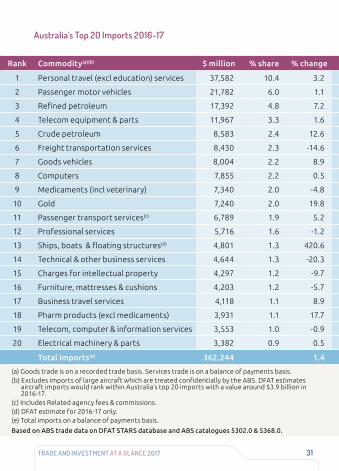
Australia’s Top 20 Imports 2016-17
Rank Commodity(a)(b) $ million % share % change
1 Personal travel (excl education) services 37,582 10.4 3.2
2 Passenger motor vehicles 21,782 6.0 1.1
3 Refined petroleum 17,392 4.8 7.2
4 Telecom equipment & parts 11,967 3.3 1.6
5 Crude petroleum 8,583 2.4 12.6
6 Freight transportation services 8,430 2.3 -14.6
7 Goods vehicles 8,004 2.2 8.9
8 Computers 7,855 2.2 0.5
9 Medicaments (incl veterinary) 7,340 2.0 -4.8
10 Gold 7,240 2.0 19.8
11 Passenger transport services(c) 6,789 1.9 5.2
12 Professional services 5,716 1.6 -1.2
13 Ships, boats & floating structures(d) 4,801 1.3 420.6
14 Technical & other business services 4,644 1.3 -20.3
15 Charges for intellectual property 4,297 1.2 -9.7
16 Furniture, mattresses & cushions 4,203 1.2 -5.7
17 Business travel services 4,118 1.1 8.9
18 Pharm products (excl medicaments) 3,931 1.1 17.7
19 Telecom, computer & information services 3,553 1.0 -0.9
20 Electrical machinery & parts 3,382 0.9 0.5
Total imports(e) 362,244 1.4
(a) Goods trade is on a recorded trade basis. Services trade is on a balance of payments basis.(b) Excludes imports of large aircraft which are treated confidentially by the ABS. DFAT estimates
aircraft imports would rank within Australia’s top 20 imports with a value around $3.9 billion in 2016-17.
(c) Includes Related agency fees & commissions.(d) DFAT estimate for 2016-17 only.(e) Total imports on a balance of payments basis.
Based on ABS trade data on DFAT STARS database and ABS catalogues 5302.0 & 5368.0.

32 TRADE AND INVESTMENT AT A GLANCE 2017
Australia’s Imports by Sector(a) 2016-17
(a) Balance of payments basis.
Based on ABS catalogues 5302.0 & 5368.0
Intermediate and other goods remained Australia’s main import sector, increasing by 0.8 per cent to $106.5 billion in 2016-17. Imports of gold rose by 23.3 per cent or by $1.2 billion while capital goods imports grew by 6.1 per cent or $3.9 billion.
SERVICES$84.3b
GOLD $6.1b
CAPITAL GOODS $68.1b
CONSUMPTION GOODS $97.2b
INTERMEDIATE & OTHER$106.5b

TRADE AND INVESTMENT AT A GLANCE 2017 33
SERVICES$84.3b
GOLD $6.1b
CAPITAL GOODS $68.1b
CONSUMPTION GOODS $97.2b
INTERMEDIATE & OTHER$106.5b
Australia’s Foreign Investment 2016Two-way investment between Australia and other countries increased by 4.8 per cent to $5.4 trillion in 2016. The composition of Australia’s top five two-way investment partners changed in 2016, as China has become a growing source of investment into Australia. The United States, the United Kingdom, Japan, Belgium and China were Australia’s top five two-way investment partners. Foreign investment supports higher rates of economic growth, employment and living standards than domestic savings alone can achieve.
Australia’s Top 5 Two-Way Investment Partners 2016
The stock of foreign investment in Australia reached $3.2 trillion in 2016. The major sources of inwards investment into Australia were the United States, the United Kingdom, Belgium, Japan and Hong Kong. China was Australia’s seventh largest investor.
1. USA
3. JAPAN
4. BELGIUM
5. CHINA2. UNITEDKINGDOM

34 TRADE AND INVESTMENT AT A GLANCE 2017
Australia’s Top 10 Investment Sources (a) 2016
($ million)
Rank(b) Country Direct investment Total investment(c)
1 United States 195,012 860,918
2 United Kingdom 67,892 515,522
3 Belgium(d) 4,026 270,067
4 Japan 90,880 213,500
5 Hong Kong(e) 12,089 100,922
6 Singapore 31,242 98,908
7 China 41,880 87,246
8 Netherlands 50,362 74,701
9 Luxembourg 5,913 74,035
10 Switzerland 9,471 59,113
Total all countries 796,072 3,192,422
of which: APEC 423,849 1,515,688
ASEAN 43,892 126,946
EU28 164,822 1,072,240
OECD 500,704 2,318,454
(a) Foreign investment in Australia: level of investment (stocks) as at 31 December 2016.(b) Ranked on level of total investment in Australia.(c) Includes portfolio investment.(d) The majority of total investment from Belgium is portfolio investment liabilities in the form of
debt securities (Belgium hosts a major clearing house and despository for euro-denominated bonds and other securities, Euroclear).
(e) Special Administrative Region of China.
Source: ABS catalogue 5352.0.

TRADE AND INVESTMENT AT A GLANCE 2017 35
Australia’s Top 10 Investment Destinations (a) 2016
($ million)
Rank(b) Country Direct investment Total investment(c)
1 United States 118,912 617,435
2 United Kingdom 73,173 350,523
3 Japan np 108,309
4 New Zealand 66,604 106,905
5 China 13,336 87,861
6 Germany np 65,813
7 Singapore 19,772 61,523
8 France 2,653 55,057
9 Cayman Islands np 53,227
10 Hong Kong(d) 4,270 52,942
Total all countries 554,874 2,170,810
of which: APEC 267,203 1,163,489
ASEAN 37,750 97,482
EU28 104,911 610,978
OECD 303,300 1,508,395
(a) Australian investment abroad: level of investment (stocks) as at 31 December 2016.(b) Ranked on total Australian investment abroad.(c) Includes portfolio investment.(d) Special Administrative Region of China.np = not published.
Source: ABS catalogue 5352.0.

36 TRADE AND INVESTMENT AT A GLANCE 2017
Australia’s Top 5 Total Foreign Investment Sources 2016
(a) Special Administrative Region of China.
Based on ABS catalogue 5352.0.
Australia’s Top 5 Total Investment Abroad Destinations 2016
Based on ABS catalogue 5352.0.
0
200
400
600
800
1000
HONG KONG(a)JAPANBELGIUMUNITEDKINGDOM
UNITEDSTATES
0
100
200
300
400
500
600
700
CHINANEW ZEALAND
JAPANUNITED KINGDOM
UNITED STATES
$ b
illio
n$
bill
ion
0
200
400
600
800
1000
HONG KONG(a)JAPANBELGIUMUNITEDKINGDOM
UNITEDSTATES
0
100
200
300
400
500
600
700
CHINANEW ZEALAND
JAPANUNITED KINGDOM
UNITED STATES
$ b
illio
n$
bill
ion
Foreign Direct Investment 2016Foreign investment in Australia (FDI) in 2016 comprised $796.1 billion worth of foreign direct investment, $1.7 trillion of portfolio investment and $736.5 billion of financial derivatives and other investment.
Foreign Investment in Australia by Type 2016
(a) Includes loans, trade credit, currency, deposits and reserve assets.
Based on ABS catalogue 5352.0.
FDI occurs when an individual or entity from outside Australia establishes a new business or acquires ten per cent or more of an Australian enterprise and has some control over its operations. Australia’s FDI stock increased by 8.5 per cent in 2016.
0
500
1000
1500
2000
OTHER INVESTMENT(a)
FINANCIAL DERIVATIVES
PORTFOLIO INVESTMENT
DIRECTINVESTMENT
$ b
illio
n

TRADE AND INVESTMENT AT A GLANCE 2017 37
Australia’s Top 5 Total Foreign Investment Sources 2016
(a) Special Administrative Region of China.
Based on ABS catalogue 5352.0.
Australia’s Top 5 Total Investment Abroad Destinations 2016
Based on ABS catalogue 5352.0.
0
200
400
600
800
1000
HONG KONG(a)JAPANBELGIUMUNITEDKINGDOM
UNITEDSTATES
0
100
200
300
400
500
600
700
CHINANEW ZEALAND
JAPANUNITED KINGDOM
UNITED STATES
$ b
illio
n$
bill
ion
0
200
400
600
800
1000
HONG KONG(a)JAPANBELGIUMUNITEDKINGDOM
UNITEDSTATES
0
100
200
300
400
500
600
700
CHINANEW ZEALAND
JAPANUNITED KINGDOM
UNITED STATES
$ b
illio
n$
bill
ion
Foreign Direct Investment 2016Foreign investment in Australia (FDI) in 2016 comprised $796.1 billion worth of foreign direct investment, $1.7 trillion of portfolio investment and $736.5 billion of financial derivatives and other investment.
Foreign Investment in Australia by Type 2016
(a) Includes loans, trade credit, currency, deposits and reserve assets.
Based on ABS catalogue 5352.0.
FDI occurs when an individual or entity from outside Australia establishes a new business or acquires ten per cent or more of an Australian enterprise and has some control over its operations. Australia’s FDI stock increased by 8.5 per cent in 2016.
0
500
1000
1500
2000
OTHER INVESTMENT(a)
FINANCIAL DERIVATIVES
PORTFOLIO INVESTMENT
DIRECTINVESTMENT
$ b
illio
n

38 TRADE AND INVESTMENT AT A GLANCE 2017
Australia’s Top 5 Foreign Direct Investment Sources 2016
Based on ABS catalogue 5352.0.
0
50
100
150
200
CHINANETHERLANDSUNITED KINGDOM
JAPANUNITED STATES
$ b
illio
n
How we compare with the rest of the world
Rank Country US$b % change % share
1 United States 6,391 14.7 23.9
2 Hong Kong(a) 1,591 -0.1 6.0
3 China 1,354 10.9 5.1
4 United Kingdom 1,197 -15.0 4.5
5 Singapore 1,096 1.3 4.1
6 Canada 956 25.7 3.6
7 Ireland 840 -3.1 3.1
8 Netherlands 801 11.4 3.0
9 Switzerland 793 -5.6 3.0
10 Germany 771 -2.0 2.9
11 France 698 1.3 2.6
12 British Virgin Islands 634 10.3 2.4
13 Brazil 626 33.5 2.3
14 Australia 576 7.5 2.2
15 Spain 557 -0.1 2.1
World inward stock 26,728 4.3
(a) Special Administrative Region of China.
Source: UNCTADstat database.
Foreign investment is an essential part of Australia’s economy, sustaining our regional
communities, and helping our small and medium sized businesses access the capital
and opportunities they need to grow. STEVEN CIOBO, MINISTER FOR TRADE, TOURISM AND INVESTMENT
Annual Investment Statement to the Parliament: Foreign Investment in Australia 2017: from Strength to Strength, 6 December 2017
TRADE AND INVESTMENT AT A GLANCE 2017 39
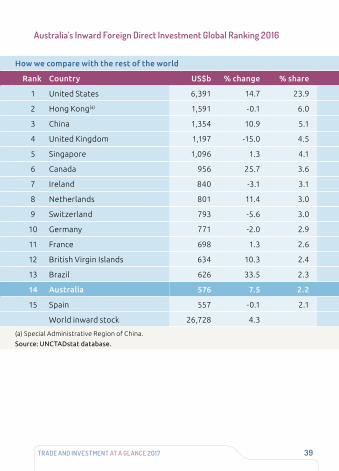
Australia’s Inward Foreign Direct Investment Global Ranking 2016
How we compare with the rest of the world
Rank Country US$b % change % share
1 United States 6,391 14.7 23.9
2 Hong Kong(a) 1,591 -0.1 6.0
3 China 1,354 10.9 5.1
4 United Kingdom 1,197 -15.0 4.5
5 Singapore 1,096 1.3 4.1
6 Canada 956 25.7 3.6
7 Ireland 840 -3.1 3.1
8 Netherlands 801 11.4 3.0
9 Switzerland 793 -5.6 3.0
10 Germany 771 -2.0 2.9
11 France 698 1.3 2.6
12 British Virgin Islands 634 10.3 2.4
13 Brazil 626 33.5 2.3
14 Australia 576 7.5 2.2
15 Spain 557 -0.1 2.1
World inward stock 26,728 4.3
(a) Special Administrative Region of China.
Source: UNCTADstat database.
40 TRADE AND INVESTMENT AT A GLANCE 2017
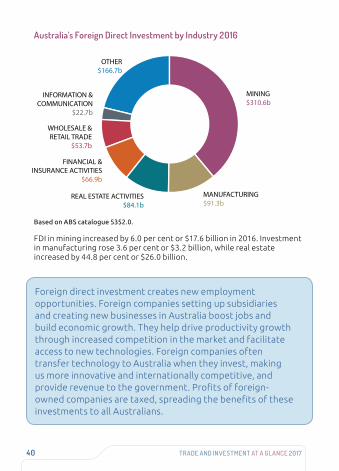
Australia’s Foreign Direct Investment by Industry 2016
Based on ABS catalogue 5352.0.
FDI in mining increased by 6.0 per cent or $17.6 billion in 2016. Investment in manufacturing rose 3.6 per cent or $3.2 billion, while real estate increased by 44.8 per cent or $26.0 billion.
OTHER $166.7b
INFORMATION & COMMUNICATION
$22.7b
WHOLESALE &RETAIL TRADE
$53.7b
FINANCIAL & INSURANCE ACTIVITIES
$66.9b
REAL ESTATE ACTIVITIES$84.1b
MANUFACTURING$91.3b
MINING$310.6b
0
20
40
60
80
100
120
PAPUANEW GUINEA
SINGAPORENEWZEALAND
UNITEDKINGDOM
UNITEDSTATES
$ b
illio
n
Foreign direct investment creates new employment opportunities. Foreign companies setting up subsidiaries and creating new businesses in Australia boost jobs and build economic growth. They help drive productivity growth through increased competition in the market and facilitate access to new technologies. Foreign companies often transfer technology to Australia when they invest, making us more innovative and internationally competitive, and provide revenue to the government. Profits of foreign-owned companies are taxed, spreading the benefits of these investments to all Australians.

TRADE AND INVESTMENT AT A GLANCE 2017 41
OTHER $166.7b
INFORMATION & COMMUNICATION
$22.7b
WHOLESALE &RETAIL TRADE
$53.7b
FINANCIAL & INSURANCE ACTIVITIES
$66.9b
REAL ESTATE ACTIVITIES$84.1b
MANUFACTURING$91.3b
MINING$310.6b
Australian Direct Investment Abroad 2016Australian direct investment abroad (ADI) increased by 3.9 per cent to $554.9 billion in 2016, making Australia the world’s seventeenth-largest direct investor. Australia’s major investment destinations were the United States, the United Kingdom, New Zealand and Singapore.
Australia’s Top 5 Direct Investment Abroad Destinations 2016
Based on ABS catalogue 5352.0.
0
20
40
60
80
100
120
PAPUANEW GUINEA
SINGAPORENEWZEALAND
UNITEDKINGDOM
UNITEDSTATES
$ b
illio
n

42 TRADE AND INVESTMENT AT A GLANCE 2017
Australia’s Direct Investment Abroad Global Ranking 2016
How we compare with the rest of the world
Rank Country US$b % change % share
1 United States 6,384 6.3 24.4
2 Hong Kong(a) 1,528 -0.2 5.8
3 United Kingdom 1,444 -7.3 5.5
4 Japan 1,401 14.2 5.4
5 Germany 1,365 -0.8 5.2
6 China 1,281 16.7 4.9
7 France 1,259 0.4 4.8
8 Netherlands 1,256 12.4 4.8
9 Canada 1,220 13.6 4.7
10 Switzerland 1,131 0.1 4.3
11 British Virgin Islands 867 12.3 3.3
12 Ireland 833 -6.2 3.2
13 Singapore 682 4.7 2.6
14 Spain 516 5.1 2.0
15 Italy 460 -1.5 1.8
17 Australia 402 2.9 1.5
World outward stock 26,160 2.9
(a) Special Administrative Region of China.
Source: UNCTADstat database.

TRADE AND INVESTMENT AT A GLANCE 2017 43
How we compare with the rest of the world
Rank Country US$b % change % share
1 United States 6,384 6.3 24.4
2 Hong Kong(a) 1,528 -0.2 5.8
3 United Kingdom 1,444 -7.3 5.5
4 Japan 1,401 14.2 5.4
5 Germany 1,365 -0.8 5.2
6 China 1,281 16.7 4.9
7 France 1,259 0.4 4.8
8 Netherlands 1,256 12.4 4.8
9 Canada 1,220 13.6 4.7
10 Switzerland 1,131 0.1 4.3
11 British Virgin Islands 867 12.3 3.3
12 Ireland 833 -6.2 3.2
13 Singapore 682 4.7 2.6
14 Spain 516 5.1 2.0
15 Italy 460 -1.5 1.8
17 Australia 402 2.9 1.5
World outward stock 26,160 2.9
(a) Special Administrative Region of China.
Source: UNCTADstat database.
Australia’s Direct Investment Abroad by Industry 2016
(a) Amounts either suppressed by confidentiality or not attributable to a specific category.
Based on ABS catalogue 5352.0.
Australian direct investment (ADI) abroad in mining increased 13.5 per cent or by $10.9 billion in 2016. Investment in financial and insurance activities grew by 3.1 per cent or $5.1 billion, while real estate increased 2.3 per cent or $0.4 billion.
OTHER $27.0b
UNALLOCATED & CONFIDENTIAL ITEMS(a)
$14.3b
CONSTRUCTION$9.0b
REAL ESTATE ACTIVITIES
$16.4b
MINING$92.1b
MANUFACTURING$96.6b
FINANCIAL & INSURANCE ACTIVITIES$170.6b

44 TRADE AND INVESTMENT AT A GLANCE 2017
AUSTRALIA’S TRADE AND INVESTMENT FRAMEWORK
Economic DiplomacyThe Australian Government’s economic diplomacy program uses Australia’s international diplomatic assets to advance our economic and commercial interests and facilitate the global engagement of Australian businesses. Economic diplomacy supports Australian prosperity by helping open new export markets and address trade and investment barriers; maximise flows of productive investment; increase science, technology and innovation links; and advance the global rules-based trading system.
The Department of Foreign Affairs and Trade leads implementation of the program, in partnership with portfolio agencies Austrade, the Australian Centre for International Agricultural Research, Efic and Tourism Australia. We work together with business and collaboratively with state and territory governments.
Prime Minister Malcolm Turnbull, Minister for Foreign Affairs Julie Bishop and Minister for Trade, Tourism and Investment Steven Ciobo launched the 2017 Foreign Policy White Paper on 23 November 2017. The White Paper delivers a comprehensive, long-term framework to secure Australia’s future prosperity and security at a time of uncertainty and change. It lays down Australia’s commitment to resisting protectionism and advocating for an open global economy, while at the same time working with partners and through global institutions to protect and shape rules that promote economic growth, trade liberalisation and free markets. The Australian Government will ensure the lowest possible barriers to trade and investment Australian businesses face overseas, including through modern free trade agreements, and will work with Australian businesses to advance our commercial interests in overseas markets. Other measures set out in the White Paper include the development of a stronger ‘nation brand’ for our commercial, educational and cultural credentials in a competitive global market. The White Paper is available at www.fpwhitepaper.gov.au/

TRADE AND INVESTMENT AT A GLANCE 2017 45
AUSTRALIA-CHILE Free Trade Agreement – 2009
ASEAN-AUSTRALIA-NEW ZEALAND Free Trade Agreement – 2010
MALAYSIA-AUSTRALIA Free Trade Agreement – 2013
KOREA-AUSTRALIA Free Trade Agreement – 2014
JAPAN-AUSTRALIA Economic Partnership Agreement – 2015
CHINA-AUSTRALIA Free Trade Agreement – 2015
AUSTRALIA-UNITED STATES Free Trade Agreement – 2005
THAILAND-AUSTRALIA Free Trade Agreement – 2005
AUSTRALIA-NEW ZEALAND Closer Economic Relations Trade Agreement – 1983
SINGAPORE-AUSTRALIA Free Trade Agreement – 2003
Australia has ten bilateral and regional trade agreements in force:

46 TRADE AND INVESTMENT AT A GLANCE 2017
Free Trade AgreementsAustralia has FTAs with sixteen countries through ten regional and bilateral agreements. FTAs secure improvements in access to overseas markets. By boosting their competitive position, FTAs help Australian businesses expand internationally. Lower import costs can also lead to the availability of a wider range of products at cheaper prices for consumers as well as businesses that need overseas inputs. Australian producers and consumers also benefit from a wider range and cheaper imports.
High-quality, comprehensive FTAs play an important role in supporting global trade liberalisation and are consistent with World Trade Organization rules. The Australian Government will not enter into any trade agreement that falls short of the benchmarks set by the WTO, or that falls short of our own standards of high quality, truly liberalising agreements that support global trade liberalisation.
Australian trade liberalisation over the period 1986 to 2016 has seen Australia become more integrated into the global economy, and more trade orientated. Economic modelling undertaken by the Center for International Economics in its 2017 report ‘Australian Trade Liberalisation: Analysis of the Economic Impacts’ finds lowering tariffs on goods imports entering Australia over the period 1986 to 2016 has benefitted the Australian economy, with Australia’s real Gross Domestic Product (GDP) 5.4 per cent higher in 2016 than it would have been without those reforms. The research also shows average Australian family incomes in 2016 were around $8400 higher than they would have been without freer trade in goods over the preceding 30 years. You can find the report at http://dfat.gov.au

TRADE AND INVESTMENT AT A GLANCE 2017 47
Trade NegotiationsAustralia’s FTAs under negotiation include:
• Australia-Hong Kong Free Trade Agreement
• Australia-India Comprehensive Economic Cooperation Agreement
• Indonesia-Australia Comprehensive Economic Partnership Agreement
• Pacific Alliance Free Trade Agreement
• Regional Comprehensive Economic Partnership
Australia, the European Council and the European Commission agreed in November 2015 to work towards negotiating a comprehensive, high quality FTA. A joint scoping exercise setting out the scope and ambition of a future FTA was completed in April 2017. Australia-European Union Free Trade Agreement negotiations are planned to start in 2018.
The Trans-Pacific Partnership Agreement was signed by Australia and 11 other TPP countries on 4 February 2016. On 30 January 2017, the United States advised that it would not proceed with TPP ratification, which meant the Agreement could not enter into force in that form. Given the many benefits of the Agreement, TPP ministers tasked officials to assess the options to bring the TPP into force expeditiously among the remaining signatories. In November 2017, TPP-11 countries agreed on the core elements of the Comprehensive and Progressive Agreement for Trans-Pacific Partnership (CPTPP). In January 2018, CPTPP countries finalised the deal. The agreement is expected to be signed in March 2018.
The Pacific Agreement on Closer Economic Relations Plus (PACER Plus) opened for signature in June 2017. To date, the Agreement has been signed by Australia, New Zealand and nine Pacific island countries.
Australia and Peru announced the conclusion of the Peru-Australia Free Trade Agreement (PAFTA) on 10 November 2017. Both countries are undertaking domestic treaty making processes to bring PAFTA into force.
The Australian Government is advocating strongly for the resumption of negotiations toward a high-quality FTA between Australia and the Gulf Cooperation Council, comprising the UAE, Saudi Arabia, Bahrain, Kuwait, Oman and Qatar.
Australia is negotiating accession to the WTO Government Procurement Agreement (GPA). This will put Australian companies on an equal footing to compete in the US$1.7 trillion government procurement markets of other GPA members.

48 TRADE AND INVESTMENT AT A GLANCE 2017
The Trade in Services Agreement (TiSA) is a services-only Agreement under negotiation between 23 WTO members, co-chaired by Australia, the EU and the US. Negotiations are well advanced, but have been on hold in 2017 pending clarity from the US Administration on its position. If concluded, the TiSA could create new export opportunities in key areas of interest to Australian services trade, including education, professional, and financial services.
FTA PortalDFAT’s FTA Portal enables businesses to explore the benefits under Australia’s FTAs with our trading partners. Goods exporters and importers will find tariff information, guidance on rules of origin and import market data that is comprehensive and easy to use on desktop, tablet or mobile.
The Portal will continue to be updated as new agreements come into force. For more information visit www.ftaportal.dfat.gov.au.
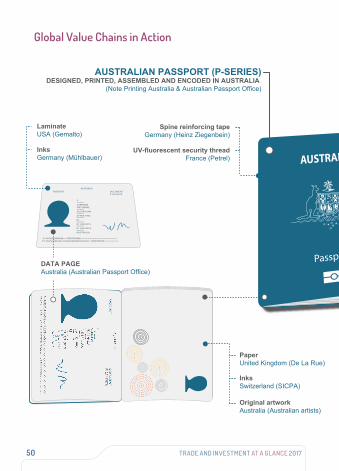
Global Value ChainsA ‘value chain’ is the full range of activities involved in designing, producing and delivering a good or service. The concept of GVCs is represented when one country utilises inputs from a number of countries around the globe to produce a good or service. Each process is carried out in a location where skills and materials are available at a competitive cost and high quality.
Trade FacilitationThe World Trade Organization Agreement on Trade Facilitation entered into force on 22 February 2017. It is the first global agreement to enter into force since the WTO was formed more than 20 years ago. For Australian businesses, exporting goods may become more streamlined, take less time to be cleared by Customs at foreign ports, and could result in lower costs in many markets.
The Australian passport is a good example of a GVC in action. Our passports are assembled in Australia from components sourced from around the world, as illustrated on pages 50 and 51.

TRADE AND INVESTMENT AT A GLANCE 2017 49
TourismThe Department of Foreign Affairs and Trade is advancing Australia’s bilateral tourism relationships with growing source markets such as China, India and Singapore as part of the Australian Government’s economic diplomacy agenda and priorities under Tourism 2020. DFAT engages closely in multilateral fora, including APEC’s Tourism Working Group and the OECD’s Tourism Committee, in pursuit of these priorities. In close partnership with Austrade and Tourism Australia, we are working across government to promote the competitiveness of tourism exports and increase the sector’s contribution to national prosperity.
Trade with Aid PartnersIn 2016-17, Australia’s two-way merchandise trade with our ongoing bilateral development partnership countries was valued at $36 billion. Over the past decade since 2006-07, two-way trade has increased by 2.9 per cent per annum. Australia’s exports to these countries grew by 3.5 per cent per annum while imports grew by 2.2 per cent per annum in the same period.
Market Access for Least Developed CountriesAustralia has provided Least Developed Countries (LCD) full duty-free and quota-free access since 2003. LDC exports to Australia increased markedly from $160.7 million in 2006-07 to $1.2 billion in 2016-17, averaging 27.2 per cent expansion every year.
An LDC Services Waiver allows WTO members to grant preferences to provide LDCs access to their markets with the objective of enhancing LDC participation in global services trade. Australia’s notification of preferential treatment for LDC service suppliers covers tourism, transport (maritime, air, rail, road and auxiliary services) and business services (computer, professional and other business services).
50 TRADE AND INVESTMENT AT A GLANCE 2017
Adhesive bondingSpain (Morchem)
Cover foilGermany (Kurz)
Spine reinforcing tapeGermany (Heinz Ziegenbein) ARRIVÉE
Polyethylene mounting & encapsulationJapan (Toppan)
Chip Germany (Infineon)
SoftwareJapan (Sharp)
Chip module & RFID antenna assemblyJapan (Toppan)
BIOMETRIC CHIP ASSEMBLYJapan (Sharp)
DATA PAGEAustralia (Australian Passport Office)
Cover materialUSA (Holliston)
AUSTRALIAN PASSPORT (P-SERIES)DESIGNED, PRINTED, ASSEMBLED AND ENCODED IN AUSTRALIA
(Note Printing Australia & Australian Passport Office)
LaminateUSA (Gemalto)
InksGermany (Mühlbauer)
UV-fluorescent security threadFrance (Petrel)
PaperUnited Kingdom (De La Rue)
Original artworkAustralia (Australian artists)
InksSwitzerland (SICPA)
Global Value Chains in Action

TRADE AND INVESTMENT AT A GLANCE 2017 51
Adhesive bondingSpain (Morchem)
Cover foilGermany (Kurz)
Spine reinforcing tapeGermany (Heinz Ziegenbein) ARRIVÉE
Polyethylene mounting & encapsulationJapan (Toppan)
Chip Germany (Infineon)
SoftwareJapan (Sharp)
Chip module & RFID antenna assemblyJapan (Toppan)
BIOMETRIC CHIP ASSEMBLYJapan (Sharp)
DATA PAGEAustralia (Australian Passport Office)
Cover materialUSA (Holliston)
AUSTRALIAN PASSPORT (P-SERIES)DESIGNED, PRINTED, ASSEMBLED AND ENCODED IN AUSTRALIA
(Note Printing Australia & Australian Passport Office)
LaminateUSA (Gemalto)
InksGermany (Mühlbauer)
UV-fluorescent security threadFrance (Petrel)
PaperUnited Kingdom (De La Rue)
Original artworkAustralia (Australian artists)
InksSwitzerland (SICPA)

52 TRADE AND INVESTMENT AT A GLANCE 2017
INDIASAUDI ARABIASOUTH AFRICARUSSIAN FEDERATIONTURKEYITALYGERMANYFRANCEUNITED KINGDOMTHE EUROPEAN UNION
MEXICOUNITED STATESCANADAJAPANREPUBLIC OF KOREACHINAINDONESIAARGENTINABRAZILAUSTRALIA
INTERNATIONAL TRADE AND INVESTMENT ARCHITECTURE
WTOThe World Trade Organization is an international organisation that manages the rules of trade between member states. Australia is a founding member of both the WTO and its predecessor the General Agreement on Tariffs and Trade. WTO members agree on legally binding trade rules that provide certainty for business while member states use the WTO’s dispute settlement system to uphold these rules. Australia is committed to the multilateral trading system and to opening and maintaining access to markets through trade negotiations in the WTO.
In order to create opportunities for business, Australia pursues international agreements on trade issues such as services, agriculture and e-commerce.
Australia also works through the WTO to promote trade capacity building in developing countries. For more information visit www.wto.org

TRADE AND INVESTMENT AT A GLANCE 2017 53
INDIASAUDI ARABIASOUTH AFRICARUSSIAN FEDERATIONTURKEYITALYGERMANYFRANCEUNITED KINGDOMTHE EUROPEAN UNION
MEXICOUNITED STATESCANADAJAPANREPUBLIC OF KOREACHINAINDONESIAARGENTINABRAZILAUSTRALIA
G20The G20 is the world’s premier forum for cooperation on international economic governance. The G20 consists of 19 countries and the European Union and represents around 86.4 per cent of global output, more than 75 per cent of global trade and almost two-thirds of the world’s population. The G20 has met as a leader-level forum since 2008 and in 2014 Australia held the G20 Presidency.
Australia worked closely with Germany as G20 President in 2017 to advance G20 actions that promote strong trade and economic growth. Australia will be actively engaged in the G20 under the Presidency of Argentina in 2018, and again with future hosts Japan in 2019 and Saudi Arabia in 2020. For more information see http://www.g20.org/

54 TRADE AND INVESTMENT AT A GLANCE 2017
AUSTRALIAINDONESIABRUNEI DARUSSALAMSINGAPOREMALAYSIATHAILANDCHINARUSSIA
USACANADA
JAPANMEXICO
PERUCHILE
REPUBLIC OF KOREACHINESE TAIPEIHONG KONG, CHINATHE PHILIPPINESNEW ZEALANDVIETNAMPAPUA NEW GUINEA
APECAs the leading economic forum in the Asia-Pacific, the Asia-Pacific Economic Cooperation forum has delivered substantial gains for businesses and consumers in Australia and throughout the region. APEC is pursuing an ambitious agenda of trade liberalisation, business facilitation, economic cooperation and technical assistance. The private sector engages closely with the APEC process, particularly through the APEC Business Advisory Council.
In 2016-17, eight of Australia’s 10 largest export markets were within APEC, including our top three export markets China, Japan and the Republic of Korea. In 2016-17, nearly 72 per cent of Australia’s trade was with APEC members. Peru was the APEC host in 2016, Vietnam in 2017, and Papua New Guinea will host in 2018. For more information see www.apec.org

TRADE AND INVESTMENT AT A GLANCE 2017 55
Australia’s trade with ASEAN in 2016-17
11.3% of Australia’s exports went to ASEAN
5 of Australia’s top 15 export markets were ASEAN countries (Singapore, Malaysia, Indonesia, Vietnam and Thailand).
16.1% of imports into Australia came from ASEAN
Two way trade was worth $101 billion
AUSTRALIAINDONESIABRUNEI DARUSSALAMSINGAPOREMALAYSIATHAILANDCHINARUSSIA
USACANADA
JAPANMEXICO
PERUCHILE
REPUBLIC OF KOREACHINESE TAIPEIHONG KONG, CHINATHE PHILIPPINESNEW ZEALANDVIETNAMPAPUA NEW GUINEA
ASEANThe Association of Southeast Asian Nations was formed in 1967 by Indonesia, Malaysia, the Philippines, Singapore and Thailand. The grouping later expanded to include Brunei Darussalam, Vietnam, Laos, Myanmar and Cambodia. Since its formation ASEAN has successfully promoted political, economic and social cooperation and regional stability. Australia became the first of ASEAN’s ten dialogue partners in 1974 and we entered into a Strategic Partnership in 2014 in recognition of the depth and breadth of Australia-ASEAN cooperation over many years.
On 17-18 March 2018, Prime Minister Malcolm Turnbull will welcome the Leaders of the Member States of ASEAN and the Secretary-General of ASEAN to the ASEAN-Australia Special Summit. This will be the first time Australia has hosted a Summit with ASEAN Leaders in Australia. A Business Summit will lead in to the Special Summit.
In 2016-17, total trade with ASEAN countries amounted to $101 billion, more than with the US and Japan and second only to China. The joint DFAT-Austrade publication ASEAN Now, released in November 2017 provides advice to Australian businesses on key drivers of growth in the region and profiles opportunities in each ASEAN market. You can find the report at www.austrade.gov.au/asean-now/
56 TRADE AND INVESTMENT AT A GLANCE 2017
OECDThe Organisation for Economic Co-Operation and Development, based in Paris, was established in 1961 to provide a forum for governments to share experiences and seek solutions to common problems. Australia has been an active member of the OECD since 1971.
The OECD provides independent and evidence-based analysis to help improve the economic and social well-being of citizens in its member countries and globally. The OECD relies on persuasion and derives its relevance from the high quality of its analysis. The OECD is a key contributor of information, policy advice and technical analysis to the G20. Australia supports the OECD’s efforts to reach out and engage with countries beyond its membership to support its ongoing relevance and influence. For more information visit www.oecd.org
DEPARTMENT OF FOREIGN AFFAIRS AND TRADE AUSTRALIAN OFFICE NETWORK
HEAD OFFICECanberra 02 6261 1111
AUSTRALIAN OFFICESNEW SOUTH WALES STATE OFFICE Sydney (DFAT switchboard: ask for NSW state office) 02 6261 1111
NORTHERN TERRITORY OFFICE Darwin 08 8982 4199
QUEENSLAND STATE OFFICE Brisbane 07 3405 4799
SOUTH AUSTRALIA STATE OFFICE Adelaide 08 8403 4899
TASMANIA STATE OFFICE Hobart 03 6238 4099
VICTORIA STATE OFFICE Melbourne 03 9221 5444
WESTERN AUSTRALIA STATE OFFICE Perth 08 9231 4499
To request additional copies of this publication or to enquire about its content, please contact [email protected]
www.dfat.gov.au/trade

w w w . d f a t . g o v . a u / t r a d e