trade and assistance review 2016-17 - pc.gov.au€¦ · web viewaustralian exporters can also...
TRANSCRIPT
Trade and Assistance Review 2016-17
Productivity Commission Annual Report Series

ã Commonwealth of Australia 2018
ISBN 978-1-74037-656-3
Except for the Commonwealth Coat of Arms and content supplied by third parties, this copyright work is licensed under a Creative Commons Attribution 3.0 Australia licence. To view a copy of this licence, visit http://creativecommons.org/licenses/by/3.0/au. In essence, you are free to copy, communicate and adapt the work, as long as you attribute the work to the Productivity Commission (but not in any way that suggests the Commission endorses you or your use) and abide by the other licence terms.
Use of the Commonwealth Coat of ArmsTerms of use for the Coat of Arms are available from the Department of the Prime Minister and Cabinet’s website: https://www.pmc.gov.au/government/commonwealth-coat-arms
Third party copyrightWherever a third party holds copyright in this material, the copyright remains with that party. Their permission may be required to use the material, please contact them directly.
AttributionThis work should be attributed as follows, Source: Productivity Commission, Trade and Assistance Review 2016-17.
If you have adapted, modified or transformed this work in anyway, please use the following, Source: based on Productivity Commission data, Trade and Assistance Review 2016-17.
An appropriate reference for this publication is:Productivity Commission 2018, Trade and Assistance Review 2016-17, Annual Report Series, Canberra.
Publications enquiriesMedia, Publications and Web, phone: (03) 9653 2244 or email: [email protected]
The Productivity Commission
The Productivity Commission is the Australian Government’s independent research and advisory body on a range of economic, social and environmental issues affecting the welfare of Australians. Its role, expressed most simply, is to help governments make better policies, in the long term interest of the Australian community.
The Commission’s independence is underpinned by an Act of Parliament. Its processes and outputs are open to public scrutiny and are driven by concern for the wellbeing of the community as a whole.
Further information on the Productivity Commission can be obtained from the Commission’s website (www.pc.gov.au).

Foreword
The Productivity Commission is required under its Act to report annually on industry assistance and its effects on the economy. The Trade & Assistance Review 2016-17 contains the Commission’s latest quantitative estimates of Australian Government assistance to industry.
The report comes at a challenging time for trade policy. While the USA has long been a reliable advocate for trade liberalisation, it has now turned more towards using its leverage to protect domestic industries.
This year’s Review explores how Australia should best respond. Protectionist populism can be fed here as readily as in the US, but with much greater capacity for self-harm. We do not have the leverage of the US and we are more internationally trade-exposed than it is.
The annual Review provides information on government arrangements that may be construed as assistance, including their target, size, and nature. Views inevitably differ on what constitutes industry assistance and whether it is warranted. This report is valuable because it offers full transparency of all support measures and provides a basis for considered assessment of the benefits and costs of the arrangements.
One of the biggest changes in this year’s Review is the inclusion of the small business tax cuts as sectoral assistance. While some may debate that it is assistance, it advantages one form of business over another. And if it persists over time it will skew growth and investment artificially.
In preparing this report, the Commission has received helpful advice and feedback from officials in Australian Government agencies. The Commission is very grateful for their assistance.
Peter HarrisChair
April 2018
FOREWORD iii

Contents
Foreword
Abbreviations and explanations
1 Key results and policy developments1.1 Industry assistance estimates 2
1.2 Concessional project financing is playing an increasing role as assistance 7
1.3 Rising protectionism: how should Australia respond? 8
1.4 Some trade and assistance implications of national security measures 16
2 Assistance estimates2.1 Tariff assistance 20
2.2 Australian Government budgetary assistance 25
2.3 Combined assistance and effective rates of assistance 34
2.4 Effective rates of assistance since 1970 39
3 National security measures: some trade and assistance implications3.1 Industry assistance for mandatory data retention 46
3.2 Restrictions on cross-border flow of data 49
3.3 Aviation security costs 53
3.4 Cost recovery of screening for low-value consignments 59
3.5 Towards better national security policy 60
4 Recent developments in industry assistance4.1 The Northern Australia Infrastructure Facility 64
4.2 The Defence Export Strategy 65
4.3 A new farm concessional loan scheme and water infrastructure facility 67
4.4 Domestic gas security and assistance 69
CONTENTS v

4.5 Lower taxes for small business 70
4.6 Film and television industry assistance 71
5 Trade policy developments5.1 Multilateral and plurilateral-agreements 74
5.2 Bilateral and regional agreements 78
A Detailed estimates of Australian Government assistance to industry
References
vi TRADE AND ASSISTANCE REVIEW 2016-17

Abbreviations and explanations
AbbreviationsERA Effective rate of assistance
GPA WTO Government Procurement Agreement
PC Productivity Commission
R&D Research and Development
TPP Trans Pacific Partnership
WTO World Trade Organization
ExplanationsBillion The convention used for a billion is a thousand million (109).
ABBREVIATIONS AND EXPLANATIONS vii

1 Key results and policy developments
Key points Global trade policy appears to be at dangerous cross-roads.
The US, having long led the drive to liberal world trade with positive effects on growth for almost all nations, is now moving to exploit its leverage to favour domestic industries.
New tariffs have been introduced and trade agreements are being renegotiated on less liberal terms. What was for two generations a question only of whether international trade grew slower or faster now must include the prospect that regulation may force it backwards.
Trade wars may be easy to initiate but winning is improbable, unless the benchmark is solely crude politics. Employment and living standards should form part of the calculation.
The Productivity Commission published estimates in 2017 of the damage that such initiatives impose on both the initiator and the rest of the world. These costs are serious.
The ability to resist this trend lies with major trading nations. Australia can still be an effective partner for growth and living standard improvement locally and globally by:
– negotiation of genuinely multilateral and plurilateral trade agreements
– reducing further our tariff and non-tariff barriers unilaterally
– not adding further to the ‘noodle bowl’ of rules-of-origin impediments to trade
– ceasing to view the anti-dumping regime as a cheap card to play every time an industry claims to be threatened by imports
– removing parallel import restrictions.
An open trade policy has contributed clearly to making our economy resilient to shocks over more than 25 years of uninterrupted growth.
Australia’s recent policy steps have been inconsistent and in many cases heading in the wrong direction.
New project finance vehicles have been established that have the potential to skew industry assistance to particular firms and projects with minimal public scrutiny until deals are done. Major shifts in tax have favoured a particular cohort of businesses. Bilateral trade agreements continue to be negotiated without publishing sound prior analysis to show where net benefit to Australia is being sought or to allow the Parliament to see if these objectives have been met. Opaque processes rarely make good policy.
The Commission estimates that gross assistance to industry provided by the Australian Government was $19.3 billion and that net assistance (after deducting the cost penalty of tariffs) was $13.4 billion in 2016 17. This was a substantial increase on last year’s estimate of $9.7 billion in net assistance. These estimates are conservative as they exclude harder-to-quantify assistance: favourable finance (loans, debt, equity, guarantees); local purchasing preferences, such as for defence equipment; and regulatory restrictions on competition.
KEY RESULTS AND POLICY DEVELOPMENT 1

1.1 Industry assistance estimates
The Productivity Commission has a statutory obligation to report on industry assistance arrangements each year. The Productivity Commission Act 1998 defines government assistance to industry as:
… any act that, directly or indirectly: assists a person to carry on a business or activity; or confers a pecuniary benefit on, or results in a pecuniary benefit to, a person in respect of carrying on a business or activity.
Assistance takes many forms. It extends beyond direct government subsidies to particular firms or industries and includes tariffs, quotas, regulatory restrictions on imported goods and services and tax concessions. Assistance can also arise from the provision of services below cost by government agencies, from government procurement policies and preferential treatment under trade agreements.
Although assistance benefits the firms or industries that receive it, it typically imposes costs on other sectors of the economy. For example, direct business subsidies increase returns to recipient firms and industries. However, to fund the subsidies, governments must increase taxes and charges, cut back on other spending, or borrow additional funds. Funding provided to a single firm also discriminates against its competitors.
Similarly, while tariffs provide some price support to domestic goods producers, they result in higher input costs for other local businesses, reducing their competitiveness. They also effectively tax consumers by imposing higher prices on the goods subject to the tariff, leaving them with less money to spend on other goods and services.
Governments provide assistance for many different reasons. Some types of assistance — such as for R&D and to meet environmental objectives — can overcome market failure and deliver net community benefits. Similarly, some policies that have industry assistance effects may be justified on other grounds, such as the achievement of social or equity objectives. However, the way in which such assistance is provided requires transparent and rigorous assessment to minimise its unintended impacts on resource allocation.
In view of the costs, as well as the potential benefits, that industry assistance can entail, government measures that provide assistance need to be monitored and regularly reviewed. To that end, the annual Trade & Assistance Review fulfils a transparency function of identifying existing government assistance and contemporary assistance issues, and allowing closer examination to be made when it is not obvious why such costs are being incurred.
The Trade and Assistance Review quantifies the assistance afforded by tariffs, direct government payments and taxation concessions with industry policy objectives. The Commission and its predecessor organisations have estimated effective rates of industry assistance since 1968-69. Budgetary assistance was incorporated into the effective rates of assistance estimates from 1996-97. While these estimates cover a broad range of measures
2 TRADE AND ASSISTANCE REVIEW 2016-17

that afford substantive support to industry and that can be readily quantified on a consistent basis annually, the estimates do not capture all Australian Government support for industry, nor State government assistance. They are therefore an underestimate of the total support to industry provided by government.
Total assistance was $19.3 billion in 2016-17, significantly higher than 2015-16
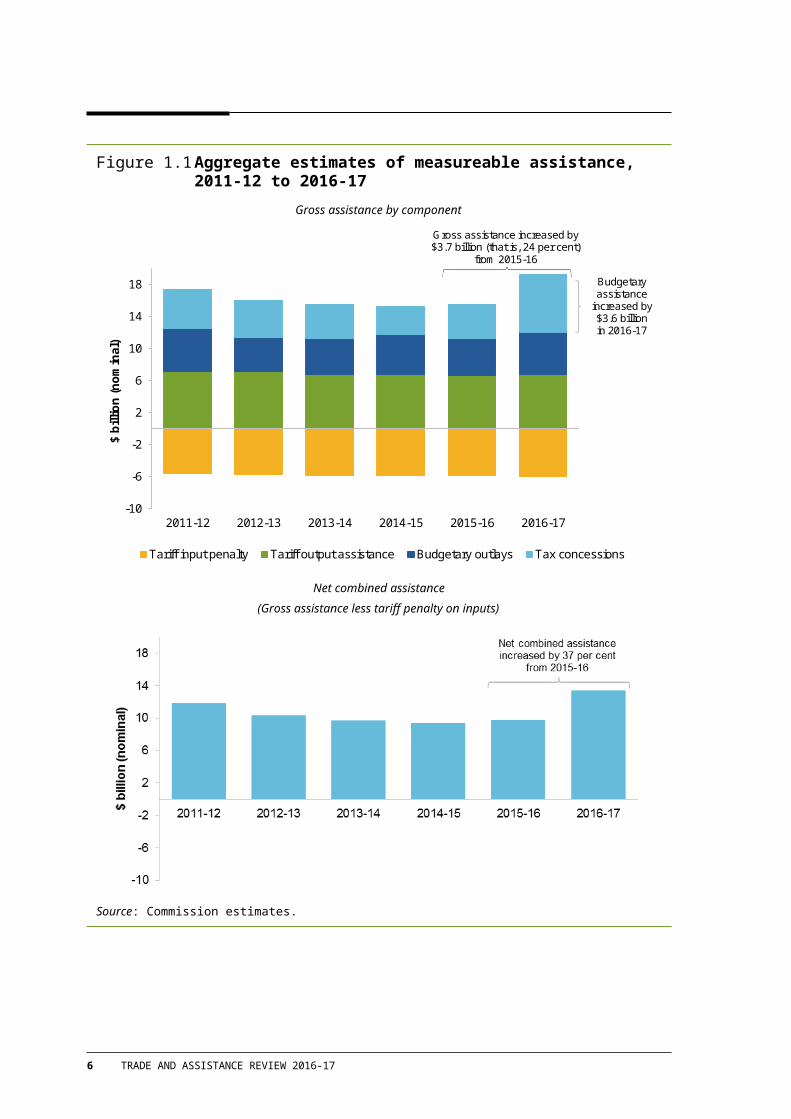
Readily distinguishable and quantified tariff and budgetary assistance to industry was around $19.3 billion in gross terms in 2016-17 — comprising $6.8 billion in gross tariff assistance, $5.3 billion of budgetary outlays, and $7.2 billion in tax concessions (figure 1.1, top panel). In these calculations, the tariff assistance estimate is the equivalent budget outlay to the industry that would be expected to have the same effect on Australian producer’s prices and volumes of production, rather than the amount of duty collected.
Estimated gross assistance increased by around $3.7 billion from 2015-16 or around 24 per cent in nominal terms (around 20 per cent in real terms). The increase primarily reflected taxation and depreciation concessions targeted at small businesses.
After allowing for the negative effects of tariff assistance on the cost of inputs (the input tariff penalty), total estimated net combined assistance amounted to around $13.4 billion in 2016-17, an increase of $3.6 billion in nominal terms (37 per cent) from 2015-16 levels (figure 1.1, bottom panel).
Around 35 per cent of the $19.3 billion is tariff assistance, which, as noted above, has negative impacts on consumers and Australian living standards, and does not increase overall employment.
The remainder of the $19.3 billion is budgetary assistance, which, while costly to the budget, is not inherently distortionary. As noted above, measures targeted at potential market failures (such as in R&D) and that genuinely induces ‘additional’ activity may deliver net benefits, including to industries beyond those directly assisted. However, some budgetary assistance has adverse economic impacts, such as non–competitive grants to a single firm or narrowly defined industry, which competes with firms outside this industry.
KEY RESULTS AND POLICY DEVELOPMENT 3

Figure 1.1 Aggregate estimates of measureable assistance, 2011-12 to 2016-17
Gross assistance by component
-10
-6
-2
2
6
10
14
18
2011-12 2012-13 2013-14 2014-15 2015-16 2016-17
$ bi
llion
(nom
inal
)
Tariff input penalty Tariff output assistance Budgetary outlays Tax concessions
Gross assistance increased by $3.7 billion (that is, 24 per cent)
from 2015-16
Budgetary assistance
increased by $3.6 billion in 2016-17
Net combined assistance (Gross assistance less tariff penalty on inputs)
Source: Commission estimates.
4 TRADE AND ASSISTANCE REVIEW 2016-17

Manufacturing receives around 50 per cent of gross and over 60 per cent of net assistance1
Manufacturing receives by far the highest net combined assistance by virtue of tariff assistance (figure 1.2). The services sector records much lower net assistance, as it incurs about two-thirds of the input cost penalty posed by manufacturing tariffs.
Figure 1.2 The incidence of assistance varies across industries, 2016-17
Components of assistance
-5
-3
-1
1
3
5
7
Primary production Mining Manufacturing Services
$ bi
llion
(nom
inal
)
Budgetary assistance Output tariff assistance Input tariff penalty
Services received the most budgetary assistance but this was partly outweighted by the input tariff penalty in 2016-17
Net combined assistance
-1
1
3
5
7
Primary production Mining Manufacturing Services
$ bi
llion
(no
min
al)
Manufacturing received the highest net combined assistance in 2016-17
Source: Commission estimates.
1 These are the shares of assistance that can be allocated to a sector, which is 77 per cent of net assistance and 84 per cent of gross assistance.
KEY RESULTS AND POLICY DEVELOPMENT 5

Support for R&D represents about 36 per cent of measured budgetary assistance
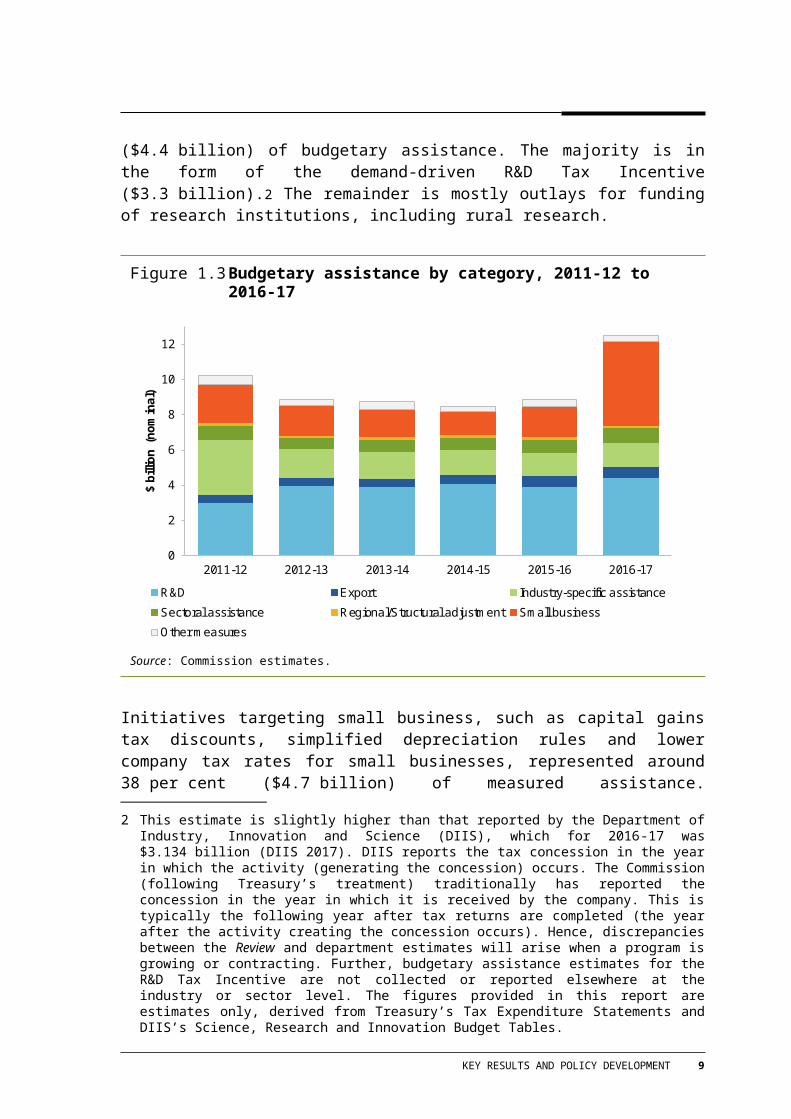
Support for business R&D continues to be one of the largest types of industry assistance delivered through budgetary measures (figure 1.3), representing just under 36 per cent ($4.4 billion) of budgetary assistance. The majority is in the form of the demand-driven R&D Tax Incentive ($3.3 billion).2 The remainder is mostly outlays for funding of research institutions, including rural research.
Figure 1.3 Budgetary assistance by category, 2011-12 to 2016-17
0
2
4
6
8
10
12
2011-12 2012-13 2013-14 2014-15 2015-16 2016-17
$ bi
llion
(no
min
al)
R&D Export Industry-specific assistance
Sectoral assistance Regional/Structural adjustment Small business
Other measures
Source: Commission estimates.
Initiatives targeting small business, such as capital gains tax discounts, simplified depreciation rules and lower company tax rates for small businesses, represented around 38 per cent ($4.7 billion) of measured assistance. Industry-specific assistance, such as a range of selective grants and concessions for the automotive, film, ethanol and finance industries, represents the third largest group of measured assistance.
2 This estimate is slightly higher than that reported by the Department of Industry, Innovation and Science (DIIS), which for 2016-17 was $3.134 billion (DIIS 2017). DIIS reports the tax concession in the year in which the activity (generating the concession) occurs. The Commission (following Treasury’s treatment) traditionally has reported the concession in the year in which it is received by the company. This is typically the following year after tax returns are completed (the year after the activity creating the concession occurs). Hence, discrepancies between the Review and department estimates will arise when a program is growing or contracting. Further, budgetary assistance estimates for the R&D Tax Incentive are not collected or reported elsewhere at the industry or sector level. The figures provided in this report are estimates only, derived from Treasury’s Tax Expenditure Statements and DIIS’s Science, Research and Innovation Budget Tables.
6 TRADE AND ASSISTANCE REVIEW 2016-17

Contributing to the $3.6 billion increase in aggregate budgetary assistance from 2015-16 to 2016-17 are:
an increase of $1.3 billion in assistance afforded by the Small Business Simplified Depreciation Rules – to enable small businesses (with a turnover less than $10 million in 2016-17; previously $2 million) to access concessional depreciation arrangements for certain business assets
an increase of $850 million in assistance afforded by the Lower Company Tax Rate — a rate of 27.5 per cent, accessible for companies with aggregated annual turnover of less than $10 million in 2016-17 (compared with a rate of 28.5 per cent in 2015-16 and turnover threshold of $2 million)
an increase of $550 million for the Unincorporated Small Business Tax Discount — an 8 per cent discount on tax payable, accessible for unincorporated small businesses with turnover less than $5 million in 2016-17 (compared with a 5 per cent discount in 2015-16 and a turnover threshold of $2 million)
an increase of $420 million in assistance afforded by the refundable part of the R&D Tax Incentive — which is a tax offset scheme for certain eligible entities whose aggregated annual turnover is less than $20 million
$120 million in assistance afforded by the newly introduced Data Retention Industry Grants program for eligible telecommunications service providers to meet upfront costs of implementing data retention obligations (with the remaining $8 million of outlay occurring in subsequent years).
Reductions in existing programs and cessations in 2016-17 totalled $372 million across 47 programs (some demand driven and some by government decision).
1.2 Concessional project financing is playing an increasing role as assistance
There has been a recent trend towards delivering industry assistance through government finance facilities that extend credit to businesses or provide guarantees for their commercial loans. These include the Northern Australia Infrastructure Facility, the dedicated Defence Export Facility to be delivered through the Export Finance and Insurance Corporation, the National Water Infrastructure Loan Facility and a new Farm Business Concessional Loans Scheme (both to be delivered through the Regional Investment Corporation). Together, these decisions will provide up to $12.8 billion in business finance. The Commission has not analysed their structure and decision-making processes in detail and has not formed an assessment of each program’s costs and benefits.
In general, though, Australia has relatively deep and liquid financial markets. The onus then is on proponents of taxpayer-funded financing of commercial projects to demonstrate how this would serve the public interest. Even where there is an in-principle argument for
KEY RESULTS AND POLICY DEVELOPMENT 7
government assistance, proponents should also explain why financing is the best policy option.
History has not been kind to previous efforts at government financing. For example, the Commission reviewed export credit arrangements in 2012 and found that, at that time, the majority of EFIC’s support was going to a small number of large corporations, for which there was no evidence of systemic failures of commercial loan markets. Similarly, the Commission reviewed drought support in 2008 and found that exceptional circumstance interest-rate subsidies were ineffective in achieving the stated objective of building farmers’ self-reliance to manage climate variability and preparedness for droughts, and instead can perversely encourage poor farm management practices. More broadly, the Commission has found that, in many cases where the government becomes a ‘co-investor,’ the governance and due-diligence fell short of best practice, particularly the merit of government involvement (PC 2015). The cornerstone of assessing the case for finance support should be a (finance) market failure test underpinned by evidence that financial support would lead to an improvement in community-wide outcomes (through additionality and viability).
In the face of past failures in these areas, it will be critical to review the various newly-introduced financing measures early in their operation to ensure that they genuinely make Australians better off, and that they do not merely benefit project proponents.
1.3 Rising protectionism: how should Australia respond?
The foremost current global trade policy issue is the uncertainty created by policy developments in the United States of America (USA). The USA has taken a number of trade policy decisions that are unsupportive of the predictable, liberal and rules-based world trading system that is in Australia’s interest (section 5.1). These include decisions to:
withdraw the USA from the Trans-Pacific Partnership (TPP)
renegotiate the North-American Free Trade Agreement and the United States-Korea Free Trade Agreement
impose tariffs on steel and aluminium imports into the USA from a range of countries, including Russia and China, on the grounds that these imports are considered a threat to US national security
impose further tariffs on imports from China citing concerns about intellectual property rights.
In this environment, it is hard to predict whether, or not, these steps will lead toward a cycle of tit for tat retaliation that will be detrimental to growth in world trade and international trade liberalisation negotiations. Were this to occur, and to spread further to other countries, it would weaken world economic growth, perhaps severely so.
8 TRADE AND ASSISTANCE REVIEW 2016-17

While these initial US policy changes have already triggered retaliatory action there have also been more positive indications. China has introduced tariffs on US pork, aluminium scrap and a range of agricultural products, but has also indicated a plan to lower investment barriers, reduce tariffs on certain goods (including motor vehicles) and strengthen intellectual property laws. Similarly, some recent US trade policy announcements have suggested opening a dialogue with China, though its position on the TPP has oscillated. These dramatic changes in direction have occurred in just a few weeks, inviting questions about where policy will ultimately land. Uncertainty can have its own negative impacts on economic growth.
Part of the uncertainty stems from the nature of WTO rules. The WTO members have committed to operate a non-discriminatory trading system that ensures that trade flows between countries will be treated fairly and consistently. However, many countries have the capacity to increase tariffs for some products without breaching their WTO commitments. Some currently applied tariff rates are well below the maximum or bound tariff rates that they have committed to, and this space (or ‘tariff water’ as it is sometimes called) could facilitate retaliation if nations desire (Achard, Rupp and Jomini 2008).
How would Australia be affected by any new swing towards protectionism? To answer this question, the Commission undertook modelling looking at the experience of the 1930s when the Great Depression led economies around the world to retreat behind protectionist walls (PC 2017a). Those policies ultimately contributed to the severity and duration of that era of weak growth and cruelly high unemployment rates. Were a similar policy response to unfold today, Australia would not go unscathed. Over one per cent of GDP would be lost and up to 5 per cent of our capital stock would be mothballed, leading close to 100 000 Australians to lose their jobs. The scenario modelled is the extreme end of probability, but emphasises the importance of Australia continuing to work towards freer markets and to maintain the rules-based trade system and, through its policy actions, to demonstrate its commitment.
In the event of a global rise in protection, Australia is likely to face intense pressure to lift its own barriers to international trade and investment. The Commission’s analysis shows there would be no economic justification to join such a trade war. Rather, Australia would still benefit from continuing to pursue freer markets and improve the functioning of the rules-based international trading system. This can be pursued through plurilateral negotiations. This is in line with the intent set out in the Australian Government’s Foreign Policy White Paper to work towards bringing major Indo-Pacific economies under a single set of trade and investment rules.
In international negotiations, Australia will be best served by continuing to work with like-minded countries to pursue freer markets and improve the functioning of the rules based international trading system by:
prioritising regional agreements that follow, or work directly towards, WTO ‘most favoured nation’ treatment (under which countries provide equal trade advantages to all their trading partners)
KEY RESULTS AND POLICY DEVELOPMENT 9

promoting the greater use of plurilateral sector specific agreements negotiated in the context of the World Trade Organization
pursuing only those bilateral trade agreements where there is a strong prior case that a clear net benefit to Australia will result
broadening negotiations over agreements to include parties capable of offering critical assessment, not just involving parties seeking an advantage or protecting a constituency
adopting better consultation processes in negotiating agreements, including widening the access of stakeholder groups to draft treaty text on a confidential basis during the negotiation
strengthening Australia’s reputation as an attractive destination for international investors through more consistent, transparent and predictable foreign investment approval processes while preserving our vital national security interests.
Box 1.1 Raising tariffs would harm Australia; benefits lie in liberalising
To illustrate the possible impacts on Australia were there significant international increases in protection, and of different Australian responses, the Commission has modelled a number of stylised scenarios (PC 2017b).
The results show that, once the dust had settled, Australia would be little affected by substantial increases in US tariffs on imports from China and Mexico, or by US adoption of border adjustments as part of a new corporate tax regime. On the other hand, economic growth and living standards in Australia would decline if there was a global increase in tariffs. All countries would be worse off and the purchasing power of almost all Australians would be lower as the availability of cheaper imported goods and services is limited.
A global increase in protection could cause a global recessiona,b,c
Percentage changes for select regions
-9
-8
-7
-6
-5
-4
-3
-2
-1
0
AUS CHN USA MEX CAN JPN KOR ASEAN EU REST
Economic activity Real income Purchasing power
Global GDP would fall by 2.9 per cent
a All countries are assumed to raise tariffs by 15 percentage points. b Real income is measured as real GNP adjusted for changes in the terms of trade. c ASEAN includes Brunei, Cambodia,
10 TRADE AND ASSISTANCE REVIEW 2016-17
Box 1.1 Raising tariffs would harm Australia; benefits lie in liberalising
Indonesia, Laos, Malaysia, Myanmar, Philippines, Singapore, Thailand and Vietnam.
Source: Commission estimates generated using the PC Global model.(continued next page)
KEY RESULTS AND POLICY DEVELOPMENT 11

12 TRADE AND ASSISTANCE REVIEW 2016-17

Box 1.1 (continued)
The Commission also modelled three scenarios, in which Australia, in the face of 15 percentage point tariff increases elsewhere:
maintained current levels of protection on its own
co-operated with the other participants in the Regional Comprehensive Economic Partnership (RCEP) — China, Japan, South Korea, India, New Zealand and the ASEAN countries — to maintain policies that support international trade
joined with RCEP in reducing tariffs, non-tariff barriers and barriers to services trade.
The results show that even in a world of much higher protection globally, Australia would be better off if it does not follow suit. Co-operating with a coalition of countries like RCEP in holding the line on freer markets would significantly amplify the positive economic effects for Australia of avoiding increases in protection. Further benefits would come with liberalisation of tariffs and other barriers to trade in RCEP countries. Living standards in Australia would be about 2.7 per cent higher than in a scenario in which all countries raised tariffs by 15 percentage points. And a household with the median weekly gross income of about $1600 a week would be better off by about $44 a week.
Removing tariffs and other barriers to trade would increase living standards in Australiaa,b
Percentage change for Australia in various scenarios
-2
-1.5
-1
-0.5
0
0.5
1
1.5
2
All countries increase tariffs
Australia does not increase
tariffs
RCEP does not increase tariffs
RCEP abolishes tariffs
RCEP abolishes tariffs and
reduces NTBs
Economic activity Real income Purchasing power
a This chart compares five scenarios — from left to right, in the first scenario, Australia, along with the rest of the world, raises tariffs by 15 percentage points. This scenario is discussed in detail in chapter 4. In the second scenario, Australia maintains existing tariff levels, while tariffs rise by 15 percentage points overseas. In the third scenario, RCEP countries are assumed to maintain exiting levels of protectionism, while all other countries raise tariffs by 15 percentage points. In the fourth scenario, RCEP countries are assumed to remove all tariffs applied to all countries. The fifth scenario extends the fourth to include decreases in non-tariff barriers and regulatory barriers to service trade. b Economic activity is defined as real GDP, real income is defined as real GNP and purchasing power is defined as gross national absorption adjusted for terms of trade effects.
Source: Commission estimates generated using the PC Global model.
KEY RESULTS AND POLICY DEVELOPMENT 13
Box 1.1 (continued)
The rise in protectionist sentiment around the world also emphasises the importance of domestic policies that build economic resilience. Changes in the economy — whether driven by changes in technology, tastes, skills or indeed trade policies — affect individuals differently. Policies that help the Australian economy adapt to changes, whether driven by protectionist policies in other countries or otherwise, will serve to lessen their disruptive impacts. This include education and training policies that aim to build foundational skills that enable participation in further education and training and reskilling of displaced workers, work force policies that influence how readily firms can adjust the size and composition of their workforce to remain viable in the face of change, and macroeconomic stability. By contrast, actions that seek to prevent or delay adaptation should be avoided, such as the increased proclivity to use trade remedies (such as anti-dumping duties and countervailing measures and safeguards). These impose costs on the community and may trigger reprisals abroad.
Australian exporters can also benefit from domestic policy reforms that lift the nation’s productivity and lower the cost of doing business. The Commission set out priorities that, if addressed, would shift the dial on Australian economic performance as part of the first five-yearly productivity review (PC 2017b). These include systemic changes that would raise the health of Australians and the quality of their education, improve the functioning of our cities and fix the problems in energy markets. Collaboration between Commonwealth, state and territory governments would offer the greatest prospect of success.
As set out below, the Australian Government could also undertake several positive trade policy changes at any time without requiring international or intergovernmental agreement. (These are areas that have been identified in previous Productivity Commission reviews and other inquiries and for which there is clear evidence of economic benefits.)
Unilateral tariff reductions should recommence
Unilateral tariff reductions to boost economic growth are not a new idea. The history of unilateral tariff reductions in Australia, undertaken progressively between 1973 and 1996, shows that opening Australian markets to trade and exposing Australian industry to competition drives businesses to embrace new technologies and work practices. This supports stronger economic growth, higher wages and the development of new export industries (PC 1999, pp. 83–112). Indeed, and contrary to mercantilist notions that focus on export promotion and market access and often cloud debates about trade policy, these improvements in domestic efficiency are the larger benefits of trade liberalisation (PC 2010).
The outcome of successive cycles of trade negotiations is that Australia retains a comprehensive and complex tariff regime that collects little revenue. Tariff revenue fell by around two-thirds, in real terms, between 2004-05 and 2016-17 and is forecast to fall further (figure 1.4). Compliance with the system, however, represents an ongoing nuisance for
14 TRADE AND ASSISTANCE REVIEW 2016-17
business, arguably getting worse due to the ‘noodle bowl’ of preferential trade agreement requirements. Moreover, aspects of the regime have not kept pace with changes in the Australian economy: tariffs continue to apply to motor vehicle imports (together with a ban on parallel imports of second-hand cars discussed below) despite the closure of car assembly plants.
Figure 1.4 Gross tariff revenue, 2005-06 to 2020-21a
Real 2016-17 dollars
0
1,000
2,000
3,000
4,000
5,000
6,000
7,000
2004-05 2008-09 2012-13 2016-17 2020-21
Textile, clothing and footwear Passenger motor vehicles Other imports
$ m
illio
n
Projections
a Annual refunds and drawbacks ranged from $212 million to $436 million from 2005-06 to 2016-17, with no discernible pattern. Sources: Commission calculations based on Final Budget Outcome (various years), 2017-18 Budget and Mid-Year Economic and Fiscal Outlook 2017-18. Nominal values delated by the GDP Implicit Price Deflator (ABS 2017).
It remains open to the Australian Government to unilaterally reduce remaining tariffs and relieve Australian businesses of the associated compliance costs as well as the budgetary cost of administering the system. While Australia imposes low tariff rates — a tariff rate of 5 per cent was imposed on about 35 per cent of Australian imports in 2015-16 — even at these rates, the application of tariffs continues to raise costs to Australian industry and consumers and erode export competitiveness.
Rules of Origin impose unnecessary burdens on business
RoO are a non-tariff barrier to trade. They require importers seeking to use preferential trade agreements to meet ‘transformation tests’ (such as requiring a local value-added threshold).3 The more stringent the transformation test, the harder it is for businesses to use
3 For example, in relation to chemical products the AUSFTA sets out separate ‘originating good’ tests in relation to transformation of imported inputs by chemical reaction, purification, mixing and blending,
KEY RESULTS AND POLICY DEVELOPMENT 15

tariff and quota preferences. In effect, a material portion of the benefits to Australian consumers of preferential trade agreements are lost through higher regulatory compliance costs. A recent paper (Crook and Gordon 2007) concluded:
Rules of Origin (RoO) have become a pernicious barrier to trade for Australian business. Their inherent protectionism is little known - well disguised in their daunting yet mind numbingly dull complexity.
RoO are insidious as they afford an impression of trade concessions, but instead their complexity and restrictiveness substantively erode the purported positive trade impacts of the PTA. (p. 3)
The literature on RoO focuses on the complexity of RoO, the cumbersome compliance procedures, the stringency of the production transformation rules, and the overall erosion of preference use. A number of international empirical studies suggest about one quarter to one third of available preferences go unused because of the stringency of the transformation rules (Anson et al. 2005; Cadot and Ing 2014)
Australia cannot control enforcement by other countries of RoO provisions in existing preferential trade agreements on Australian exports. However, it is open to the Australian Government to remove RoO restrictions for imports into Australia or alternatively to set all RoO restrictions equal to the least restrictive transformation test within and across Australian preferential trade agreements and to streamline evidence procedures. Arguably, the cumbersome task of complying with ‘preferential rules of origin’ presents an unnecessary barrier to businesses making use of preferential trade agreements (Mavroidis and Vermulst 2018).
Parallel import restrictions should be removed
Parallel import restrictions are blunt instruments. By banning outright certain imports they limit consumer choice, push up prices and support inefficient industries in Australia, resulting in lower overall living standards. For these reasons, as part of the broader microeconomic reform agenda through the 1980s and 1990s, most parallel import restrictions were removed.
However, restrictions remain in place on second-hand cars and books. These were introduced ostensibly to support an Australian car manufacturing industry and a publishing industry to support the creation of Australian literature. Times have moved on, but the policies remain and now provide perverse incentives. For example, higher second-hand car prices mean Australians pay higher prices for new cars and means that some Australians cannot afford to replace old and inefficient cars. Online ordering of both physical and electronic literature puts Australian book retailers at a competitive disadvantage compared with offshore retailers. There are reasonable grounds for supporting culturally significant Australian books, but direct support for authors is better targeted.
change in particle size or isomer separation, or for the production of standards materials.
16 TRADE AND ASSISTANCE REVIEW 2016-17

Anti-dumping taxes are unnecessary
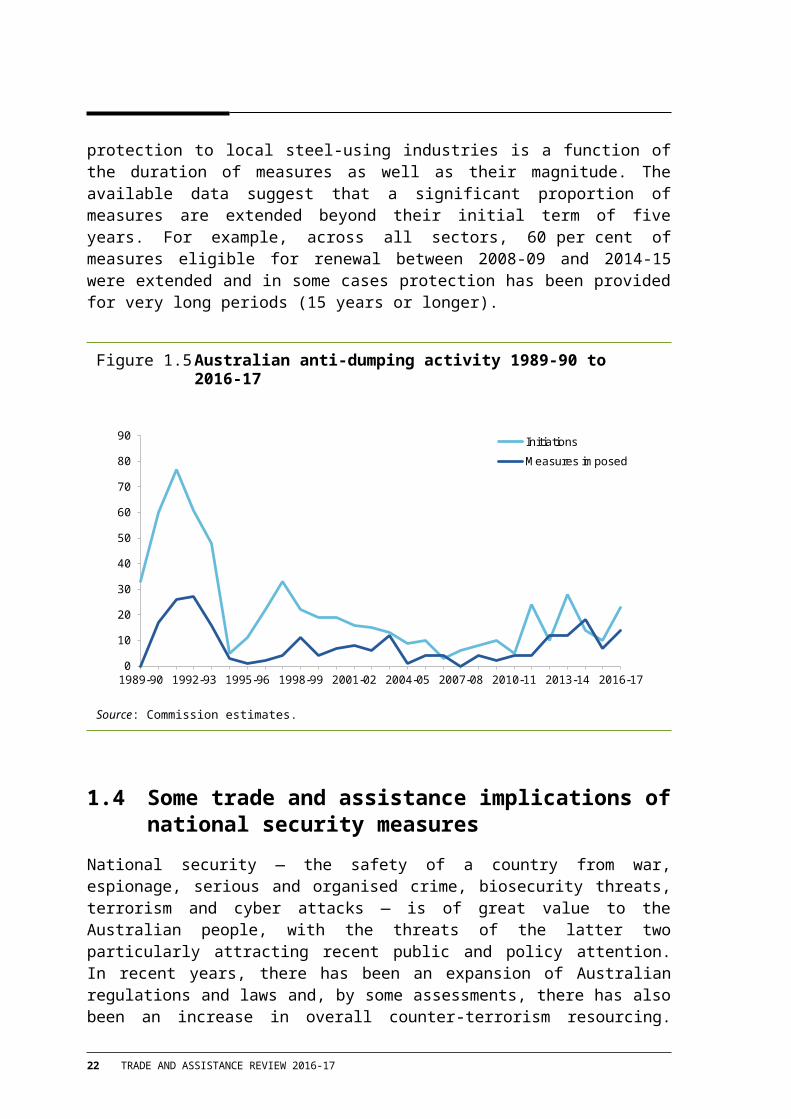
Notwithstanding the poor justification for anti-dumping measures (PC 2016), their use has been rising and the policy regime has made it easier for parties to seek protection (figure 1.5). For example, legislative changes in 2017 may have the effect of extending the anti-dumping duties that would previously have been reviewed and repealed after 12 months where dumping activity has stopped. While anti-dumping duties are small in value when compared with general tariffs or many forms of industry assistance, their incidence is highly concentrated and, therefore, highly inefficient.
Growth in Australian anti-dumping activity had been concentrated in the steel sector. In 2014-15 steel products accounted for 86 per cent of anti-dumping and countervailing investigations and 60 per cent of all the measures imposed in 2014-15. The average dumping duty imposed by Australia between 2009 and 2015 was 17 per cent. The cost of the protection to local steel-using industries is a function of the duration of measures as well as their magnitude. The available data suggest that a significant proportion of measures are extended beyond their initial term of five years. For example, across all sectors, 60 per cent of measures eligible for renewal between 2008-09 and 2014-15 were extended and in some cases protection has been provided for very long periods (15 years or longer).
Figure 1.5 Australian anti-dumping activity 1989-90 to 2016-17
0
10
20
30
40
50
60
70
80
90
1989-90 1992-93 1995-96 1998-99 2001-02 2004-05 2007-08 2010-11 2013-14 2016-17
Initiations
Measures imposed
Source: Commission estimates.
KEY RESULTS AND POLICY DEVELOPMENT 17

1.4 Some trade and assistance implications of national security measures
National security — the safety of a country from war, espionage, serious and organised crime, biosecurity threats, terrorism and cyber attacks — is of great value to the Australian people, with the threats of the latter two particularly attracting recent public and policy attention. In recent years, there has been an expansion of Australian regulations and laws and, by some assessments, there has also been an increase in overall counter-terrorism resourcing. These policies can also have trade and assistance effects by acting as barriers to international trade in goods or services, though to date it has only been possible to include budgetary outlays in the Commission’s assistance estimates.
Four recent policy developments in the trade and assistance arena that relate to national security are:
mandatory meta-data retention requirements for certain telecommunication businesses and the provision of $128 million industry assistance towards defraying the compliance costs
restrictions on the cross-border flow of data for security-related purposes, and the inclusion in trade agreements, notably the TPP, of provisions seeking to discipline unnecessary restrictions
aviation security regulation, which has involved significant costs to airport and airline operators, with some industry assistance provided to Australian airport operators to help defray these costs
cost recovery of security screening for low-value international consignments.
Like any area of government regulation, national security measures should be designed to be effective in reducing harm and efficient in their use of government funds and in the compliance costs they create. Poor policy design, precisely because national security is so important, can carry large economic costs. Estimates of the economic impact of (overly blunt) data localisation laws, for example, are large because security of data is fundamental to the Australian economy today.
There is little transparency of government spending in pursuit of national security objectives (such as airport security), nor the compliance costs that regulation imposes on Australian businesses and consumers. While security measures often necessitate secrecy, this should not preclude careful assessment of governments’ spending and regulatory measures aimed at averting terrorism or ameliorating its effects.
Some have also queried whether the overall system of counter-terrorism measures should be redesigned to achieve its objectives at lower cost to the community. National security policy would benefit from systemic periodic review by an agency with the appropriate security clearance and access to understand thoroughly the costs, benefits and risks inherent in the system. In addition, the development of a rigorous and publicly available framework for
18 TRADE AND ASSISTANCE REVIEW 2016-17

decision-making in security-related policy would provide a tool for good decision making, especially when decisions must be made quickly as the form and nature of threats change. Such a framework would also foster public understanding and support for national security decisions.
KEY RESULTS AND POLICY DEVELOPMENT 19

2 Assistance estimates
Key points For 2016-17, estimated gross assistance to industry provided by the Australian Government
was $19.3 billion, comprised of $6.8 billion in output tariff assistance, $5.3 billion in budgetary outlays and $7.2 billion in tax concessions. After deducting the cost penalty of tariffs on imported inputs ($5.9 billion, two-thirds incurred by services industries), net assistance to industry was $13.4 billion.
– The gross value of tariff output assistance increased marginally in 2016-17, while the input tariff penalty has risen slowly over time, leading to a fall in net tariff assistance but at a slower rate than in previous years.
Aggregate budgetary assistance is calculated to have increased in 2016-17. The main reason for the increase was the expansion of tax relief to small businesses through more generous depreciation allowances and a concessional company tax rate. Budgetary assistance to R&D also increased due to an increase in the reported level of eligible business expenditure.
The effective rates of combined assistance have continued to fall for most industries.
– Despite a small decline, higher rates continue in motor vehicles and parts (9.4 per cent). They have continued to fall in textiles, leather, clothing and footwear (3.6 per cent).
– Rates have fallen for dairy cattle farming (1.4 per cent) while sheep, beef cattle and grain farming rates have stabilised (4.2 per cent).
The incidence of assistance varies widely between sectors.
– Negative net tariff assistance has been rising for services and mining, while output tariff assistance is focused on manufacturing and input cost penalties fall on all sectors.
– The share of budgetary assistance to manufacturing and primary production is much higher than their share of the economy.
Over the past 45 years, assistance to the manufacturing and agricultural sectors has fallen dramatically, and significant disparities between industries within these sectors have narrowed.
The measured estimates are conservative as they exclude significant assistance that is difficult to quantify. This includes: favourable finance (loans, debt, equity, guarantees); local purchasing preferences for defence equipment; and regulatory restrictions on competition. It also excludes state and territory government support to industry.
ASSISTANCE ESTIMATES 21

Industry is assisted through a wide array of government programs, regulatory instruments and policies. Each year, the Commission updates and publishes estimates of the assistance provided by:
import tariffs, which raise the price of imported products (mainly manufactured goods) allowing competing domestic firms to charge higher prices. The tariff assistance estimate is the equivalent budget outlay to the industry that would be expected to have the same effect on Australian producer’s prices and volumes of production. The measure is not the amount of duty collected.
Australian Government budgetary measures — divided into government subsidies (predominantly grants and concessional loans) and tax concessions. This budgetary support advantages recipient firms and industries relative to those that do not receive support.4
The estimates cover a broad range of measures that afford substantive support to industry and that can be readily quantified on a consistent annual basis. However, they do not capture all Australian Government support for industry (box 2.1). For example, the assistance provided through government regulation is not included in the estimates, nor is assistance arising from government purchasing preferences. In large part this is because the extent of these forms of assistance is difficult to estimate. The estimates also do not include assistance from other government jurisdictions. This can be considerable. A detailed study for the 2009-10 Review indicated that State and Territory assistance to industry amounted to around $4 billion in identifiable assistance in 2008-09 (PC 2011). The reported estimates in this chapter, therefore, do not cover the full extent of assistance to industry and the gap between reported values and actual assistance is potentially large.
There are also government policies that can advantage businesses that are not considered industry assistance. This arises where activities to support social or other objectives increases demand for an industry’s products, or where it lowers the costs of production for some businesses (box 2.1). This chapter reports on government activities that constitute industry assistance and that can be readily measured.
4 The assistance estimates reported in this year’s Review cover the period 2011-12 to 2016-17. Further information on the assistance estimation methodology, program coverage and industry allocation is to be provided in a (forthcoming) Methodological Annex to this Review.
22 TRADE AND ASSISTANCE REVIEW 2016-17

Box 2.1 What is not included in the Commission’s assistance estimates
The Commission’s assistance estimates cover only those measures that selectively benefit particular firms, industries or activities, and that can be quantified given practical constraints in measurement and data availability. Consequently, there are some significant government programs which selectively confer industry assistance, but cannot be appropriately estimated. Conversely, certain businesses benefit significantly from some government arrangements, but the benefit is not classified as (preferential) industry assistance, generally because the purpose of the arrangement is a broader public objective.
Examples of industry assistance not included in the core estimates Regulatory restrictions on competition such as those relating to pharmacies, air services,
importation of books, media and broadcasting, and importation of second hand cars
Government purchasing preferences and local content arrangements, such as defence procurement
Concessional debt and equity finance
State and territory government support to industry
Anti dumping and countervailing duties
Access and pricing of resources (mining, forestry, fisheries and water), if on favourable economic terms
Support for professional sport (such as tax concessions for international tournaments in Australia and support for sporting venue redevelopment).
Some of these arrangements have been examined in detail in inquiries, research reports, and previous Reviews.
Examples of policies that provide a benefit to certain businesses that are not classified as industry assistance Superannuation concessions
Health insurance rebate
Government funding of private community service providers
Indigenous business support
Employment incentives to business
Remote housing concessions in mining regions
Differential tax rates in relation to excises, GST and Fringe Benefit Tax (and state payroll tax)
Improved transport infrastructure, for example, an upgraded road in a concentrated beef producing area would be expected to lower logistics costs for beef producers, but the road is not for the sole use of beef producers.
Although not classified as assistance, evaluations of these programs should include analysis of the differential effects on businesses in an industry and across industries.
ASSISTANCE ESTIMATES 23

The following sections present the 2016-17 assistance estimates at the sectoral level (primary production, mining, manufacturing and services), and for 34 detailed industry groupings. Detailed estimates are provided in appendix A. The estimates cover:
gross and net assistance provided by import tariffs, which mainly assist the manufacturing sector while raising costs to consumers and to industries that use manufactured and other tariff assisted inputs (section 2.1)
Australian Government budgetary measures — divided into government outlays and tax concessions, and then into eight categories (including R&D, export assistance and support to small business), which confer financial support to the recipient businesses (section 2.2)
the combined rate of assistance, and the effective rate of assistance, which indicates the extent to which assistance to an industry enables it to attract and hold economic resources relative to other industries (section 2.3)
trends in these sources of assistance over the four decades (section 2.4).
2.1 Tariff assistance
Tariffs have direct effects on the returns received by Australian producers. The Commission’s estimates of tariff assistance are divided into three categories — ‘output’ assistance, ‘input’ assistance and ‘net’ assistance.
Tariffs on imported goods increase the price at which those goods are sold on the Australian market and, thus, allow scope for domestic producers of competing products to increase their prices. These effects are captured by the Commission’s estimates of output assistance. Around 50 per cent of product items in Australia’s MFN tariff schedule (at the HS 8 digit level) have a 5 per cent import tariff.
On the other hand, tariffs also increase the price of local and imported goods that are used as inputs and thus penalise local user industries. This ‘penalty’ is reduced if tariff concessions are available to Australian producers. The penalties are reflected in the Commission’s estimates of input assistance.
Net tariff assistance represents the total net assistance provided through tariffs to industry, and is calculated as output tariff assistance less the input assistance, where input assistance is the cost penalty on business inputs imposed by tariffs (box 2.2).
24 TRADE AND ASSISTANCE REVIEW 2016-17
Box 2.2 Tariff assistance to the Food, Beverage and Tobacco products industry in 2016-17
As an example, the estimates of output tariff assistance, input tariff assistance (input tariff penalty) and net tariff assistance are provided for the Food, Beverage and Tobacco products industry.
Categories of tariff assistance
Food, Beverages and Tobacco products
Industry size Value of output $92 billion $65 billion
Output tariff assistance
$2.1 billion $0.73 billion $1.38 billion=
=
Value of input $66 billion
Input tariff penalty Net tariff assistance
Source: Commission estimates.
The gross value of output assistance increased in 2016-17 after falls in previous years
The gross value of tariff assistance to domestic production was around $6.8 billion in 2016-17, around $100 million higher than the previous year (table 2.1). The gross value of tariff assistance fell from 2011-12 to 2016-17. Changes in the gross value of tariff assistance over the period reflect both changes in tariffs and the size of industries. Tariffs for certain Textile, clothing and footwear items fell from 10 per cent to 5 per cent on 1 anuary 2015, while as part of the WTO Information Technology Agreement, tariffs for certain information technology products fell from 5 per cent to 3.75 per cent on 1 January 2017. The estimated fall in 2013-14 reflected lower output levels in tariff assisted activities (mainly Metal and fabricated metal products, and Petroleum, coal, chemical and rubber products).
Table 2.1 Tariff assistancea, 2011-12 to 2016-17$ million (nominal)
2011-12 2012-13 2013-14 2014-15 2015-16 2016-17
Output assistance 7 195.3 7 093.6 6 725.0 6 792.0 6 686.3 6 789.1Input penalty -5 584.7 -5 648.9 -5 838.1 -5 876.4 -5 827.2 -5 924.5Net tariff assistance 1 610.5 1 444.7 886.9 915.6 859.1 864.6a Nominal tariff assistance estimates are derived by re-indexing a reference series based on 2013-14 ABS input output data, using ABS Industry Gross Value Added and supporting data at current prices, for all industries except Mining. For Mining, in order to abstract from the effects of terms of trade changes, the estimates are re-indexed using the ABS Industry Gross Value Added, chain volume measures. This information is subject to periodic revision by the ABS (2017).
Source: Commission estimates.
ASSISTANCE ESTIMATES 25

Assistance to a few industries is making others less competitive
The estimated cost penalty on inputs to user industries (including primary, manufacturing and services industries) arising from tariffs was around $5.9 billion in 2016-17 (table 2.2). This compares with a penalty of around $5.6 billion in 2011-12. The estimated penalty has increased in nominal terms with the general growth in the economy and rising price levels. This increase was moderated in 2014-15 and 2015-16 by reductions in tariffs on certain Textiles, clothing and footwear (TCF) items in January 2015. The moderating impact of lower tariffs on the input penalty, however, is less obvious than for past tariff reductions as the majority of these TCF products are final consumption items.
Net tariff assistance levelled off in 2016-17 after falls in previous years
After deducting the tariff input penalty from the output assistance, net tariff assistance (for the Australian economy) was estimated to be around $0.9 billion in 2016-17, down from around $1.6 billion in 2011-12 (table 2.2). This fall reflects both high relative growth in the services sector (which incurs significant tariff penalties on inputs), especially relative to the manufacturing sector (a significant beneficiary of tariff assistance), together with some reductions in tariffs applied to manufactured products.
Table 2.2 Net tariff assistance by industry sectora, 2011-12 to 2016-17$ million (nominal)
2011-12 2012-13 2013-14 2014-15 2015-16 2016-17
Primary production 228.6 268.4 212.6 226.2 238.0 290.8
Mining -234.9 -257.2 -284.2 -295.9 -304.1 -307.8
Manufacturing 5 052.5 5 019.3 4 671.3 4 722.6 4 643.6 4 649.1Services -3 435.8 -3 585.9 -3 712.8 -3 737.2 -3 718.4 -3 767.6Total 1 610.5 1 444.7 886.9 915.6 859.1 864.6a Nominal tariff assistance estimates are derived by re-indexing a reference series based on 2013-14 ABS input output data, using ABS Industry Gross Value Added and supporting data at current prices for all industries except Mining. For Mining, in order to abstract from the effects of terms of trade changes, the estimates are re-indexed using the ABS Industry Gross Value Added, chain volume measures. This information is subject to periodic revision by the ABS (2017).
Source: Commission estimates.
Negative net tariff assistance has been rising for services and mining
The estimated value of net tariff assistance for the manufacturing sector has fallen by around 8 per cent since 2011-12, largely reflecting reductions in tariff assistance to the Textiles, clothing, footwear and leather, and changing activity levels in tariff assisted activities. At the same time, the net tariff penalty on the services sector has increased by 10 per cent (to nearly $4 billion), reflecting growth in the use of tariff assisted manufactures as the services sector has expanded. Similarly, the net tariff penalty on the mining sector also increased over the period (figure 2.1).
26 TRADE AND ASSISTANCE REVIEW 2016-17
Figure 2.1 Net tariff assistance by industry sector, 2016-17
-5
-3
-1
1
3
5
7
Primary production Mining Manufacturing Services
$ bi
llion
(nom
inal
)
Manufacturing received the highest net tariff
assistance in 2016-17
Source: Commission estimates.
The value of net tariff assistance to primary production trended higher over the period to 2012-13 but in 2013-14 fell to around that recorded in 2010-11. The upward trend continued in 2014-15 to 2016-17. While there has been year to year changes in the value of activity in the sector, the upward trends reflect the Horticulture and fruit growing and Forestry and logging industries (industries that receive positive net tariff assistance) growing more in absolute terms than other primary production industries (industries that, as a group, incur negative net tariff assistance).
Tariff assistance is focused on manufacturing, while input cost penalties fall on all industries
By value, most tariff assistance on outputs is directed towards the manufacturing sector, and in particular the Food, beverages and tobacco ($2.1 billion), Metal and fabricated metal products ($1 billion), Wood and paper products ($0.7 billion), and Petroleum, coal, chemical and rubber products ($0.6 billion) industry groups (table 2.3, left hand column).
Mining and primary production industries receive little tariff assistance on outputs, and tariffs are not levied on services. On the other hand, tariffs impose input cost penalties on all industries (because of their cost raising effects on inputs) (table 2.3, middle column). Around two-thirds of the input penalty on tariffs is incurred by services industries. All manufacturing industries are estimated to receive positive net tariff assistance, as the value of tariff assistance on outputs outweighs the cost impost of tariffs on inputs for each industry group (table 2.3, right hand column).
ASSISTANCE ESTIMATES 27
Table 2.3 Tariff assistance by industry grouping, 2016-17a,b
$ million (nominal)
Industry grouping Output assistance Input cost penalty Net tariff assistance
Primary production 488.5 -197.7 290.8Horticulture and fruit growing 179.8 -12.3 167.6Sheep, beef cattle and grain farming 256.8 -72.6 184.1Other crop growing 2.2 -9.0 -6.7Dairy cattle farming – -12.4 -12.4Other livestock farming – -25.2 -25.2Aquaculture and fishing 2.8 -10.9 -8.2Forestry and logging 19.5 -2.2 17.3Primary production support services 27.4 -53.0 -25.6Unallocated primary production – – –Mining 1.6 -309.4 -307.8Manufacturing 6 299.0 -1 649.9 4 649.1Food, beverages and tobacco 2 108.6 -732.2 1 376.4Textiles, leather, clothing and footwear 111.4 -29.3 82.1Wood and paper products 673.2 -113.6 559.5Printing and recorded media 109.4 -29.5 79.8Petroleum, coal, chemical and rubber prod. 617.0 -130.6 486.3Non-metallic mineral products 319.8 -53.8 265.9Metal and fabricated metal products 1 045.6 -167.8 877.8Motor vehicles and parts 475.1 -183.0 292.1Other transport equipment 231.4 -63.6 167.8Machinery and equipment manufacturing 394.2 -98.1 296.1Furniture and other manufacturing 213.5 -48.3 165.2Unallocated manufacturing – – –Services – -3 767.6 -3 767.6Electricity, gas, water and waste services – -69.9 -69.9Construction – -1 505.4 -1 505.4Wholesale trade – -228.9 -228.9Retail trade – -146.5 -146.5Accommodation and food services – -293.4 -293.4Transport, postal and warehousing – -203.5 -203.5Information, media and telecommunications – -71.3 -71.3Financial and insurance services – -16.0 -16.0Property, professional and admin. services – -406.1 -406.1Public administration and safety – -144.9 -144.9Education and training – -51.5 -51.5Health care and social assistance – -228.5 -228.5Arts and recreation services – -74.7 -74.7Other services – -327.1 -327.1Unallocated services – – –Unallocated other – – –Total 6 789.1 -5 924.5 864.6a See footnote (a) in table 2.1. b Totals may not add due to rounding.
Source: Commission estimates.
28 TRADE AND ASSISTANCE REVIEW 2016-17

Outside the manufacturing sector, the Sheep, beef cattle and grain farming, Horticulture and fruit growing and Forestry and logging industries are also estimated to have received positive net tariff assistance in 2016-17. This reflects the incidence of a 5 per cent tariff on certain imports such as nuts, grapes and softwood conifers which affords protection to local producers of these import competing products.
The Mining industry together with all of the services industries (and most primary production industries) incurred negative net tariff assistance in 2016-17.
2.2 Australian Government budgetary assistance
Budgetary assistance includes actual payments (outlays) and industry and sector-specific tax concessions that have industry policy objectives (figure 2.2). Some measures provide financial assistance directly to firms, such as the Automotive Transformation Scheme ($168 million in 2016-17) and the R&D Tax Incentive ($3.3 billion in 2016-17), while other budgetary support measures deliver benefits indirectly to an industry via intermediate organisations such as the Rural Research and Development Corporations ($280 million in 2016-17) and the CSIRO ($544 million in 2016-17).5
Figure 2.2 Forms of budgetary assistance
Direct financial• bounties, grants, subsidies• interest rate subsidies• credits, loans• loan guarantees, insurance • equity injections
Direct financial• exemptions• deductions• rebates• preferential tax rates• deferred tax
Funding to organisations that performservices of benefit to industry, such as CSIRO, CRCs, RRDCs and Austrade
Budgetary assistance
Budgetary outlays• Industry or sector specific
Tax concessions• Industry or sector specific
5 The Commission’s assistance estimates do not include the full government appropriation for CSIRO. Excluded are certain public research such as environmental R&D, some renewable energy R&D and general research towards expanding knowledge in various fields.
ASSISTANCE ESTIMATES 29

The budgetary assistance estimates are derived primarily from actual expenditures shown in departmental and agency annual reports, and the Tax Expenditures Statement (TES) compiled by the Australian Treasury. Industry and sectoral disaggregations are based primarily on supplementary information provided by relevant departments or agencies.6
Aggregate budgetary assistance increased significantly in 2016-17 after declining in previous years
The estimated gross value of budgetary assistance to Australian industry was around $12.5 billion in 2016-17, around 41 per cent higher than in 2015-16 (figure 2.3). Between 2011-12 and 2015-16 there had been a net fall in the real level of estimated assistance of around 13 per cent. The significant increase in assistance in 2016-17 has reversed this trend.
Figure 2.3 Budgetary assistance to industry, 2011-12 to 2016-17
0
2
4
6
8
10
12
2011-12 2012-13 2013-14 2014-15 2015-16 2016-17
Outlays Tax concessions
$ bi
llion
(nom
inal
)
Budgetary assistance
increased 41 per cent from 2015-16
Source: Commission estimates.
6 State and territory governments also provide substantial budgetary assistance to industry. The 2009-10 Review found that in 2008-09 subnational governments expended around $1.5 billion on programs that provided grants and services to the benefit of industry (and an additional $2.6 billion in administrative wages and expenses). This equated to around $184 per person. Programs relating to primary industries and resources accounted for around 60 per cent of estimated industry assistance (PC 2011).
30 TRADE AND ASSISTANCE REVIEW 2016-17
Contributing to the $3.6 billion increase in aggregate budgetary assistance from 2015-16 to 2016-17 are:
an increase of $1.3 billion in assistance afforded by the Small Business Simplified Depreciation Rules – to enable small businesses to access concessional depreciation arrangements for business assets
an increase of $850 million in assistance afforded by the Lower Company Tax Rate – accessible for companies with aggregated annual turnover of less than $10 million (up from $2 million in 2015-16)
$550 million for the Unincorporated Small Business Tax Discount — accessible for unincorporated small businesses with turnover less than $5 million
an increase of $420 million in assistance afforded by the refundable part of the R&D Tax Incentive — which is a tax offset scheme for certain eligible entities whose aggregated annual turnover is less than $20 million
$120 million in assistance afforded by the newly introduced Data Retention Industry Grants program for eligible telecommunications service providers to meet upfront costs of implementing data retention obligations (with the remaining $8 million of outlay occurring in subsequent years).
Reductions in existing programs and cessations in 2016-17 totalled $372 million across 47 programs (some demand driven and some by government decision) including:
a fall of around $54 million in assistance afforded by the Automotive Transformation Scheme to encourage competitive investment and innovation in the Australian automotive industry
a fall of $45 million in assistance afforded by the tax concession – Concessional rate of withholding tax
a fall of $45 million in assistance afforded through the Film Industry Offsets program.
The noticeable reduction in budgetary assistance from 2011-12 to 2012-13 (of $1.3 billion)reflects winding up of the Energy Security Fund ($1 billion), reduction in the Small Business and General Business Tax Break ($470 million), end of the one-off Coal sector jobs package ($219 million), end of the one-off Steel transformation plan ($164 million), reduced usage of the Farm Management Deposits scheme ($80 million), and reduced expenditure from the Green Car Innovation Fund ($78 million).
Manufacturing and primary production received a much higher share of assistance than their share of the economy
The Commission records the incidence of budgetary assistance by the initial benefiting industry. Estimates are presented for 34 industry groupings, while four ‘unallocated’ categories are used for programs where it has not been possible to confidently identify the
ASSISTANCE ESTIMATES 31

initial benefiting industry or sector from available information. Since 2011-12, an initial benefiting industry has been identified for around 90 per cent of budgetary assistance.
In 2016-17 most budgetary assistance was afforded through outlays for the primary production and manufacturing sectors while for mining and services sectors the majority of budgetary assistance was provided through tax concessions.
In 2016-17, the services sector received around 44 per cent of estimated budgetary assistance (figure 2.4 top panel), much lower than the sector’s share of economy wide value added (around 84 per cent) (figure 2.4 lower panel). In contrast, the manufacturing and primary production sectors, combined, received around 27 per cent of budgetary assistance while contributing around 9 per cent of economy wide value added.
The three industry groups receiving the largest levels of budgetary assistance accounted for around 30 per cent of estimated budgetary assistance to industry in 2016-17 (table 2.4).
Budgetary assistance was highest for the Property, professional and administrative services industry ($1.8 billion) consisting mainly of the R&D Tax Incentive scheme and the Small Business Simplified Depreciation Rules scheme.
Financial and insurance services was the next highest recipient ($1 billion), including through the Offshore Banking Unit tax concession and the Concessional rate of withholding tax concession.
Sheep, beef cattle and grain farming accounted for $758 million, mainly in the form of the Farm Management Deposits scheme, rural R&D support (through CSIRO and the Rural Research and Development Corporations), and income tax averaging provisions.
Although Motor vehicles and parts received the eleventh highest absolute level of support, accounting for $243 million in budgetary assistance in 2016-17, it has the highest effective rate of assistance (absolute assistance relative to unassisted value added) of all industry groups because of the relatively high level of assistance relative to the scale of operations.
Figure 2.4 Budgetary assistance and value-added shares by industry sector, 2011-12 to 2016-17
Budgetary assistance
32 TRADE AND ASSISTANCE REVIEW 2016-17

Figure 2.4 Budgetary assistance and value-added shares by industry sector, 2011-12 to 2016-17
0
2
4
6
8
10
12
2011-12 2012-13 2013-14 2014-15 2015-16 2016-17
$ bi
llion
(nom
inal
)
Primary industries Mining Manufacturing Services Unallocated other
Services received the
largest share of
budgetaryassistance in 2016-17
Industry value-added
0
200
400
600
800
1000
1200
1400
1600
2011-12 2012-13 2013-14 2014-15 2015-16 2016-17
$ bi
llion
(nom
inal
)
Primary industries Mining Manufacturing Services
Primary production and manufacturing
contributed 9 per cent of value added but
received 27 per cent of budgetary
assistance in 2016-17
Source: Commission estimates.
ASSISTANCE ESTIMATES 33

Table 2.4 Budgetary assistance by industry grouping, 2016-17$ million (nominal)
OutlaysTax
concessionsTotal budgetary
assistance
Primary production 879.9 759.9 1639.8Horticulture and fruit growing 95.5 79.5 175.1Sheep, beef cattle and grain farming 249.2 509.2 758.4Other crop growing 52.4 43.5 95.9Dairy cattle farming 31.9 33.6 65.5Other livestock farming 38.2 24.9 63.1Aquaculture and fishing 77.5 18.6 96.1Forestry and logging 16.0 18.4 34.4Primary production services 8.7 28.0 36.7Unallocated primary 310.6 4.1 314.7Mining 238.9 282.9 521.8Manufacturing 1179.2 550.5 1729.8Food, beverages and tobacco 83.0 51.7 134.7Textile, leather, clothing and footwear 23.8 14.1 37.9Wood and paper products 13.4 16.8 30.2Printing and recorded media 58.3 15.1 73.4Petroleum, coal, chemicals and rubber products 203.5 35.3 238.8Non-metallic mineral products 19.0 7.4 26.5Metal and fabricated metal products 125.2 138.6 263.8Motor vehicle and parts 207.1 36.3 243.4Other transport equipment 26.5 9.7 36.2Machinery and equipment 223.6 51.8 275.3Furniture and other products 25.4 6.4 31.9Unallocated manufacturing 170.4 167.4 337.8Services 2634.1 2843.9 5478.0Electricity, gas, water and waste services 120.5 28.8 149.3Construction 81.6 247.4 329.0Wholesale trade 103.2 115.1 218.2Retail trade 46.6 139.3 186.0Accommodation and food services 8.7 116.8 125.4Transport, postal and warehousing 79.8 108.6 188.5Information, media and telecommunications 350.9 52.9 403.8Financial and insurance services 135.4 820.0 955.3Property, professional and administrative services 1234.4 613.5 1847.9Public administration and safety 21.6 7.9 29.5Education and training 26.8 19.9 46.7Health care and social assistance 109.6 135.3 244.9Arts and recreation services 149.7 365.7 515.4Other services 22.9 72.7 95.6Unallocated services 142.4 0.0 142.4Unallocated other 359.1 2775.0 3134.1Total 5291.3 7212.2 12503.5
– Nil. a Aquaculture and fishing includes Hunting and trapping. b Unallocated includes programs for which details of the initial benefiting industry cannot be readily identified.
Source: Commission estimates.
34 TRADE AND ASSISTANCE REVIEW 2016-17

Budgetary assistance not assigned to an industry sector is reported in the Unallocated other category. That assistance accounted for around 25 per cent of total estimated budgetary assistance in 2016-17. The concessional taxation for small business ($1.1 billion), small business capital gains tax concession ($1.1 billion) and the unincorporated small business tax discount ($550 million) schemes, for which industry allocation data is currently not available through taxation statistics, account for nearly 90 per cent of the category. Other budgetary assistance not classified to industry included Austrade,7 Australian Renewable Energy Agency (ARENA) grants, and the TCF Corporate Wear Program.8
R&D remains the largest categories of budgetary assistance
Budgetary assistance is often designed to encourage particular activities (such as R&D or exports) or to support particular firms, industries or sectors. To facilitate more detailed assessments of changes in the composition and nature of assistance, the Commission categorises its estimates of Australian Government budgetary assistance into:
R&D measures, including that undertaken by CSIRO, Cooperative Research Centres and rural R&D corporations, as well as R&D taxation concessions.
Export measures, including through Export Market Development Grants, import duty drawback, TRADEX and Austrade.
Investment measures, including development allowances and several former investment attraction packages.
Industry specific measures, including the Automotive Transformation Scheme, Film industry offsets scheme and the Offshore Banking Unit Taxation Concession.
Sector wide measures, such as drought relief assistance and the tax concessions under the Farm Management Deposits Scheme, in the case of the primary sector.
Small business programs, such as the small business capital gains tax concessions, the Small Business Simplified depreciation rules scheme and concessional company taxation for small business.
Regional assistance, including the Tasmanian Freight Equalisation Scheme, Tasmanian Jobs and Investment Fund and various structural adjustment programs with a regional focus.
7 Up to 2009-10, Austrade provided the Commission with information on the industry incidence of Austrade appropriation funding. This information indicated that around two thirds of Austrade funding was directed towards the services sector, 20 per cent to manufacturing and the remainder split equally between primary production and mining. From 2010-11 Austrade allocated its resources on a market or geography basis which did not support the provision of information according to the Commission’s industry classifications.
8 The TCF Corporate Wear program allows businesses that employ staff who wear non-compulsory uniforms to avoid paying Fringe Benefits Tax on any subsides they make towards the uniform. Eligible uniforms are not confined to Australian production and therefore the program is not treated as assistance to the domestic TCF industry.
ASSISTANCE ESTIMATES 35

a residual ‘Other’ category, including the Textiles, Leather, Clothing and Footwear Corporate Wear Program, the Pooled Development Funds initiative, and the Enterprise Connect Innovation Centres Initiative.
The majority of budgetary assistance in 2016-17 was directed to:
small business ($4.7 billion or 38 per cent) — including $2 billion for the Small Business Capital Gains Tax schemes, where over 30 per cent of the concessions are claimed by the services sector with the Property, professional and administrative services industry being the single largest recipient of the schemes ($208 million), and $1.1 billion each for the Concessional taxation for small business and Small business simplified depreciation schemes
R&D ($4.4 billion or 36 per cent) — including $3.3 billion via the R&D Tax Incentive, $544 million for CSIRO research with most assistance going to the primary production sector ($170 million) (of which around half of this allocated to the Sheep, beef cattle and grain farming industry) followed by the services sector ($167 million), and $110 million for the Cooperative Research Centres program where around half was directed towards services
specific industries ($1.3 billion or 11 per cent) — including $325 million for the Offshore Banking Unit Tax Concession (allocated to Financial and insurance services), $280 million for the Film industry offsets scheme (allocated to Arts and recreation services), $168 million for the Automotive Transformation Scheme (allocated to Motor vehicles and parts) (figure 2.5).
Over the six year period 2011-12 to 2016-17, changes in the shares of budgetary assistance to different activities are largely accounted for by:
significant decreases in concessions under the Small Business and General Business Tax Break up to 2011-12 followed by significant increases in concessions under the Small Business – Simplified Depreciation Rules and Concessional taxation for small business schemes in 2016-17
an overall reduction in assistance from drought related programs over the period to 2012-13 following an easing in drought conditions, although in February 2014 the Government announced an expanded drought assistance package leading to an increase in drought related assistance from 2013-149
9 Australian Government funding under the Exceptional Circumstances program (both relief payments and interest rate subsidies) fell from a peak of $779 million in 2008-09 to around $1.6 million in 2012-13. In February 2014, the Australian Government announced a $320 million drought assistance package including, among other things, $280 million towards drought concessional loans and ‘more generous’ criteria for accessing income support through the Farm Household Allowance (PC 2015) .
36 TRADE AND ASSISTANCE REVIEW 2016-17

Figure 2.5 Budgetary assistance by category, 2011-12 to 2016-17
0
2
4
6
8
10
12
2011-12 2012-13 2013-14 2014-15 2015-16 2016-17
$ bi
llion
(nom
inal
)
R&D Export Industry-specific assistance
Sectoral assistance Regional/Structural adjustment Small business
Other measures
Source: Commission estimates.
a significant increase in transitional assistance in relation to the carbon pricing mechanism in 2011-12 and its subsequent winding down in 2012-13
an expansion in funding for R&D activities over the period while funding for the other significant categories including industry specific have fallen
an increase in concessions provided under the Small Business – Simplified Depreciation Rules scheme in 2013-14, followed by a subsequent fall in concessions in 2014-15 and 2015-16, followed once again by a significant increase in concessions in 2016-17.
Some caution is required when comparing categories over time as changing shares do not necessarily reflect a conscious effort on the part of government to emphasis or increase one category relative to any other. While assistance programs have been allocated to the industry to which the assistance first accrues based on the nature of the support and main activities assessed as receiving that support (the ‘initial benefiting industry’), some have characteristics that relate to more than one category. For example, the R&D category includes rural R&D, which could also be considered sector specific as it relates to agriculture or agricultural product processing activities.
Although there is no separate category, a number of budgetary measures included in the estimates also relate to carbon emissions reduction, renewable energy, and energy supply and use goals. These measures support a range of activities that span R&D, industry specific, sector specific and other measures. These measures amounted to $229 million
ASSISTANCE ESTIMATES 37

(1.8 per cent) of estimated budgetary assistance in 2016-17, up from $199 million in 2015-16.
2.3 Combined assistance and effective rates of assistance
This section presents the results for combined tariff and budgetary assistance by industry group. Combined assistance is reported in terms of the net value of assistance and its components (reported for broad industries in figure 2.1) and the effective rate of assistance.
Food, beverages and tobacco and Metal and fabricated products receive to most combined assistance
Table 2.5 summarises tariff and budgetary assistance at the industry level for 2016-17. The manufacturing division receives the highest level of net combined assistance because of tariff assistance on its outputs. Although services industries receive the most budgetary assistance (around $5.5 billion in identifiable support including tax concessions), such assistance is reduced significantly by the estimated input tariff penalty (around $3.8 billion). The primary production division received the majority of its support from budgetary assistance, although some tariff protection continues to be afforded to a range of horticultural, crop and forestry products. By value, the highest level of combined assistance is afforded to the manufacturing industry Food, beverages and tobacco mainly due to tariff assistance. The services industry, Property, professional and administration also receives a high level of combined assistance mainly in the form of tax concessions. The highest tariff penalty on inputs is born by the Construction and Property, professional and administration industries. A time series of net combined assistance (table 2.5, right hand column) by industry grouping for the period 2011-12 to 2016-17 is presented in appendix A.
The effective rates of combined assistance has continued to fall for most industries
As noted, the effective rate of assistance (ERA) measures the net combined assistance to a particular industry in proportion to that industry’s unassisted net output (value added). It provides an indication of the extent to which assistance to an industry enables it to attract and hold economic resources relative to other sectors.
For the manufacturing sector, the estimated effective rate of assistance was 3.9 per cent in 2016-17, unchanged since 2014-15 which was slightly down on earlier years (table 2.6). The effective rate for the primary sector in 2016-17 was 2.8 per cent, down from 3.7 per cent in 2011-12 — largely reflecting the decline in drought assistance afforded
38 TRADE AND ASSISTANCE REVIEW 2016-17

through Exceptional Circumstances payments. The estimated effective rate of assistance from tariff and budgetary assistance for mining is negligible.
Table 2.5 Combined assistance by industry grouping, 2016-17a
$ million (nominal)
Tariff output
assistance
Tariff input
penalty
Net tariff assistanc
eBudgetary outlays
Tax concess.
Net combined assistance
Primary production 488.5 -197.7 290.8 879.9 759.9 1930.6Horticulture and fruit growing 179.8 -12.3 167.6 95.5 79.5 342.6Sheep, cattle and grain farming 256.8 -72.6 184.1 249.2 509.2 942.5Other crop growing 2.2 -9.0 -6.7 52.4 43.5 89.1Dairy cattle farming – -12.4 -12.4 31.9 33.6 53.1Other livestock farming – -25.2 -25.2 38.2 24.9 37.9Aquaculture and fishing 2.8 -10.9 -8.2 77.5 18.6 87.9Forestry and logging 19.5 -2.2 17.3 16.0 18.4 51.6Primary production services 27.4 -53.0 -25.6 8.7 28.0 11.1Unallocated primary production – – – 310.6 4.1 314.7Mining 1.6 -309.4 -307.8 238.9 282.9 214.1Manufacturing 6299.0 -1649.9 4649.1 1179.2 550.5 6378.9Food, beverages and tobacco 2108.6 -732.2 1376.4 83.0 51.7 1511.1Textiles, clothing and footwear 111.4 -29.3 82.1 23.8 14.1 120.0Wood and paper products 673.2 -113.6 559.5 13.4 16.8 589.7Printing and recorded media 109.4 -29.5 79.8 58.3 15.1 153.2Petroleum, coal and chemicals 617.0 -130.6 486.3 203.5 35.3 725.1Non-metallic mineral products 319.8 -53.8 265.9 19.0 7.4 292.4Metal and fabricated products 1045.6 -167.8 877.8 125.2 138.6 1141.6Motor vehicles and parts 475.1 -183.0 292.1 207.1 36.3 535.4Other transport equipment 231.4 -63.6 167.8 26.5 9.7 204.0Machinery and equipment 394.2 -98.1 296.1 223.6 51.8 571.5Furniture and other products 213.5 -48.3 165.2 25.4 6.4 197.0Unallocated manufacturing – – – 170.4 167.4 337.8Services – -3767.6 -3767.6 2634.1 2843.9 1710.4Electricity, gas, water and waste – -69.9 -69.9 120.5 28.8 79.4Construction – -1505.4 -1505.4 81.6 247.4 -1176.4Wholesale trade – -228.9 -228.9 103.2 115.1 -10.7Retail trade – -146.5 -146.5 46.6 139.3 39.4Accommodation & food services – -293.4 -293.4 8.7 116.8 -167.9Transport, postal & warehousing – -203.5 -203.5 79.8 108.6 -15.1Information & communications – -71.3 -71.3 350.9 52.9 332.4Financial & insurance services – -16.0 -16.0 135.4 820.0 939.4Property, professional & admin. – -406.1 -406.1 1234.4 613.5 1441.9Public administration and safety – -144.9 -144.9 21.6 7.9 -115.4Education and training – -51.5 -51.5 26.8 19.9 -4.8Health care & social assistance – -228.5 -228.5 109.6 135.3 16.4Arts and recreation services – -74.7 -74.7 149.7 365.7 440.8Other services – -327.1 -327.1 22.9 72.7 -231.5Unallocated services – – – 142.4 – 142.4Unallocated other – – – 359.1 2775.0 3134.1
ASSISTANCE ESTIMATES 39

Table 2.5 Combined assistance by industry grouping, 2016-17a
$ million (nominal)
Tariff output
assistance
Tariff input
penalty
Net tariff assistanc
eBudgetary outlays
Tax concess.
Net combined assistance
Primary production 488.5 -197.7 290.8 879.9 759.9 1930.6Total 6789.1 -5924.5 864.6 5291.3 7212.2 13368.1
– Nil. a Read in conjunction with notes to tables 2.1 and 2.4.
Source: Commission estimates.
Table 2.6 Effective rate of combined assistance by industry grouping, 2011-12 to 2016-17a,b
Per cent
2011-12 2012-13 2013-14 2014-15 2015-16 2016-17
Primary productionb 3.7 3.0 3.0 2.9 2.9 2.8Horticulture and fruit growing 2.1 2.3 2.6 2.5 2.6 2.6Sheep, cattle and grain farming 4.2 3.3 4.0 3.8 4.0 4.2Other crop growing 1.8 1.6 1.8 1.3 1.2 0.9Dairy cattle farming 3.3 1.1 1.2 1.4 1.7 1.4Other livestock farming 1.1 0.8 0.7 0.7 0.7 0.5Aquaculture and fishing 3.5 2.8 3.0 3.1 2.8 2.8Forestry and logging 4.3 3.3 2.4 2.4 2.2 2.4Primary production services 0.4 1.4 0.2 0.1 0.1 0.2Mining 0.4 0.2 0.1 0.1 0.1 0.1Manufacturingb 4.1 4.3 4.0 3.9 3.9 3.9Food, beverages and tobacco 3.3 3.3 3.5 3.5 3.4 3.4Textiles, clothing and footwear 5.4 5.3 5.4 4.7 4.0 3.6Wood and paper products 5.0 5.1 5.0 5.0 5.0 5.1Printing and recorded media 2.1 2.8 2.8 2.9 3.1 3.4Petroleum, coal, & chemicals 3.3 3.3 2.9 2.8 2.5 2.5Non-metallic mineral products 2.9 2.9 3.1 3.0 2.9 3.0Metal and fabricated products 4.0 5.5 4.2 4.2 4.1 4.3Motor vehicles and parts 12.1 13.2 11.1 10.9 10.2 9.4Other transport equipment 3.1 3.1 3.2 3.3 3.5 3.4Machinery and equipment 2.5 2.9 2.8 3.0 3.1 3.3Furniture and other products 4.8 5.0 4.8 4.6 4.7 4.9a Combined assistance comprises tariff, budgetary, and agricultural pricing assistance. b Sectoral estimates include assistance to the sector that has not been allocated to specific industry groupings.
Source: Commission estimates.
40 TRADE AND ASSISTANCE REVIEW 2016-17

Higher rates continue in motor vehicles and parts but have fallen in Textiles, leather, clothing and footwear
The Motor vehicles and parts industry group continues to have higher effective rates of combined assistance than other manufacturing activities. The effective rate of assistance for the Motor vehicles and parts industry in 2016-17 was 9.4 per cent.
In contrast, assistance for the Textiles, leather, clothing and footwear industry fell to 3.6 per cent in 2016-17 following the reduction of remaining textiles, leather, clothing and footwear tariffs from 10 to 5 per cent in January 2015. Effective assistance for the industry has now declined to below the manufacturing average.
The estimated effective rates of assistance to both industry groups have fallen significantly over recent decades following substantial reductions in tariff rates and the removal of import quotas.10 More recently, effective rates of assistance for these industries have fallen significantly, from 12.1 per cent for Motor vehicles and parts and 5.4 per cent for Textiles, leather, clothing and footwear in 2011-12, following the legislated tariff cuts in January 2010 and for Textiles, leather, clothing and footwear in 2015 and net reductions in budgetary assistance for both industries.
Rates have fallen for the Dairy cattle farming
The estimated effective rate of assistance for Dairy cattle farming fell from 2011-12 to 2016-17 — from 3.3 per cent to 1.4 per cent. This largely reflects a decline in Exceptional Circumstances drought support. Prior to the dairy industry’s deregulation in July 2000, the effective rate of combined assistance was estimated to exceed 30 per cent.
Rates have returned to earlier levels for Sheep, beef cattle and grain farming
Reflecting lower claims for Exceptional Circumstances drought support largely following the easing of drought conditions to 2012-13, together with lower assistance afforded through the Farm Management Deposits and the Small Business and General Business Tax Break schemes, the effective rate of assistance for the Sheep, beef cattle and grain farming group declined from 4.2 per cent in 2011-12 to 3.3 per cent in 2012-13. This decline in effective assistance has been moderated by increased support from the Farm Management Deposits Scheme (an additional $576 million since 2012-13) and income tax averaging provisions (an additional $458 million).
Declines were also estimated over the period for some other agricultural industry groupings because of lower claims for drought support.
10 In the 1980s, tariffs on motor vehicles were 45 per cent and the highest estimated tariff rate for any one textiles, leather, clothing and footwear line item (inclusive of the effect of tariff quotas) was 125 per cent. In 1984-85 the effective rates of assistance for the Motor vehicles and parts industry and Textiles, leather, clothing and footwear industry was 140 per cent and 157 per cent respectively (PC 2000).
ASSISTANCE ESTIMATES 41
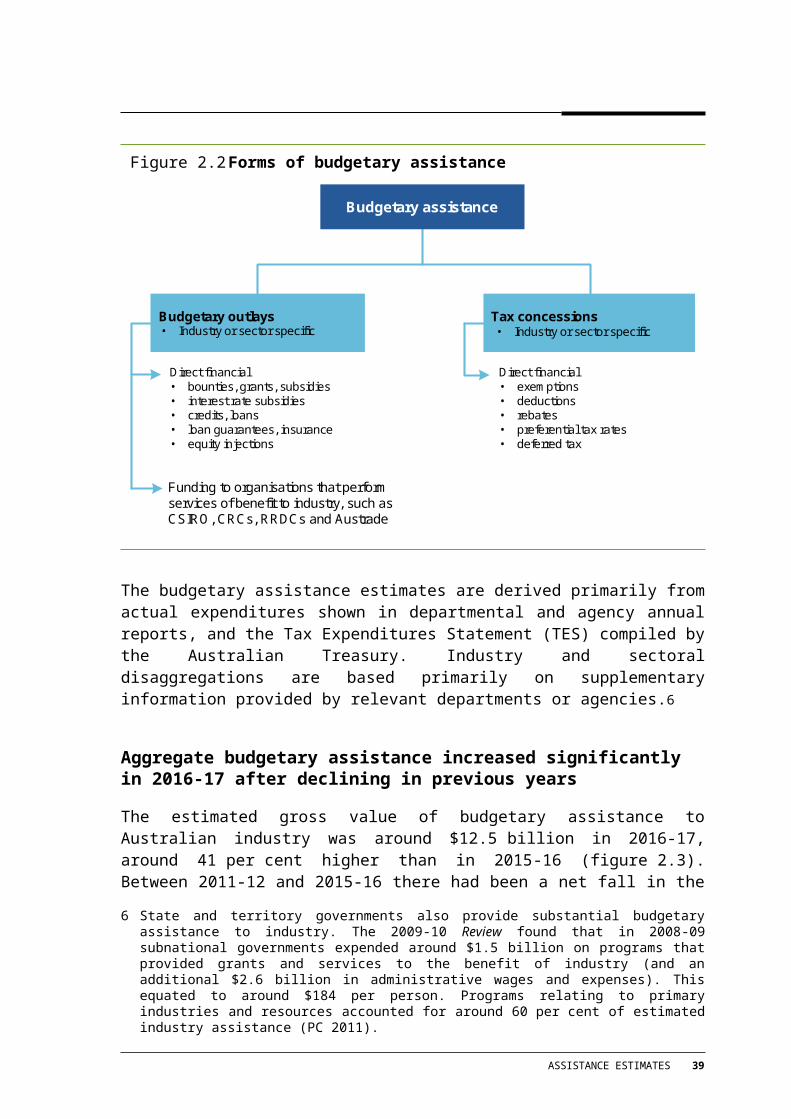
Rates have stabilised in forestry and logging
Effective rates of assistance to Forestry and logging have stabilised in more recent years at around 2.4 per cent. This reflects more stable levels of assistance provided through programs like, the small business capital gains tax concessions schemes, income tax averaging provisions and net tariff assistance to forestry and logging.
This contrasts with effective rates of assistance to the industry prior to 2010-11 where assistance levels changed markedly from year to year. The effective rate of assistance for Forestry and logging was 6.9 per cent in 2007-08, negative 1.3 per cent in 2008-09 and then back to 4.7 per cent in 2009-10. This volatility resulted from changes in the direction of accelerated write offs on forestry managed investments from positive assistance in 2007-08 (the acceleration stage) to increased taxation in 2008-09 (the pay back stage). The Forestry Managed Investment Scheme was terminated on 30 June 2008.
Higher effective rates at finer levels of analysis
While present effective rates for agriculture and manufacturing industries are at a historic low, the effective rate of assistance for an individual company or project can be substantial. This arises when a grant program is targeted at particular goods producing and services activities and provides a subsidy equivalent for the supported projects well above the industry average (box 2.3). Advantage conferred to a specific firm or activity in this way can be quite distortionary, both within an industry as well as at the economy-wide level.
42 TRADE AND ASSISTANCE REVIEW 2016-17
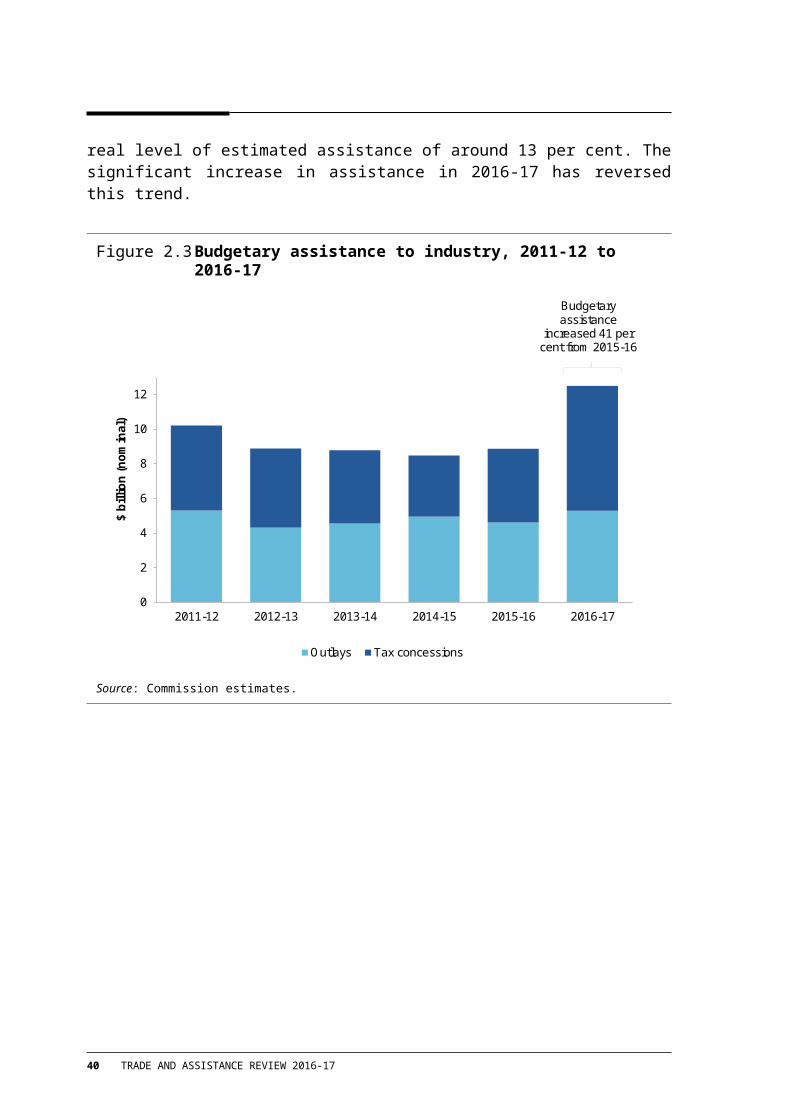
Box 2.3 Assistance measures that provide above average levels of support
The level of effective assistance that accrues to a company or project from a grant program is an empirical question. Unless all companies produce the same products using the same input mix, some will receive effective assistance above and some below average. So the key empirical question is how variable the rates of assistance are to companies and products within an industry. Unfortunately, the information on output, value added and inputs required to estimate effective assistance at the company level is not available on a consistent basis. However, all else equal, grant programs that afford matched funding or which target one or a small range of firms (or projects) will potentially confer higher levels of relative assistance. Some examples of government support with the potential to provide above industry average assistance levels include the following.
Film industry offsets — government support provided by the producer tax offset (part of the Australian Screen Production Incentive) amounted to $280 million in 2016-17. This assistance provided $1509 million for production budgets for the Australian film and television industry which amounted to nearly 20 per cent of production costs (SA 2017). (The comparable rates for 2013-14, 2014-15 and 2015-16 were 24 per cent, 16 per cent, and 29 per cent, respectively). The film industry also receives assistance from the state and territory government film support programs and Screen Australia.
Tasmanian Freight Equalisation Scheme (TFES) — around 50 per cent of the total amount claimed goes to 10 recipients (PC 2014).
Ethanol production subsidy — between 2003-04 and 2013-14, participants in the program ranged from between 1 and 5 firms, with a single firm receiving over 70 per cent of funding over the life of the program (ANAO 2015).
Co-investment grants — over the three years to 2013-14, nearly $50 million in co-investment grants was paid to four firms by the Australian Government. These payments can confer high levels of assistance at the individual firm or project level (PC 2015).
Regional business investment grants — payments have typically been up to 50 per cent of the project costs, conferring high effective rates of assistance to recipients.
Local submarine assembly — the effective rate of assistance for building the proposed submarines locally, at a reported premium of around 30 per cent more than an overseas assembly, has been estimated to be around 300 per cent, perhaps a record high (PC 2016).
2.4 Effective rates of assistance since 1970
The Commission has estimated effective rates of assistance to the manufacturing and agricultural sectors since the early 1970s. The estimates have been derived in several ‘series’, each spanning a number of consecutive years, with each series retaining a common methodology, coverage of measures and data sources across those years. While methodologies and data sources have changed between series, taken together, the series provide a broad indication of directions and trends in assistance at the sectoral level.
Figure 2.6 presents effective rate of assistance estimates from the different series from 1970-71 to the present. Breaks in the series are represented by gaps in the chart, and
ASSISTANCE ESTIMATES 43

overlaps are included to show the effects of the methodological and data changes made in moving between series. In figure 2.6, estimates of the effective rate of assistance for the previous 2008-09 benchmarked series are reported for the years 2006-07 to 2012-13. Estimates for the current 2013-14 benchmark series are reported for the years 2010-11 to 2016-17.
Figure 2.6 Effective rates of assistance to manufacturing and agriculture,a 1970-71 to 2016-17
0
5
10
15
20
25
30
35
40
1970
-71
1972
-73
1974
-75
1976
-77
1978
-79
1980
-81
1982
-83
1984
-85
1986
-87
1988
-89
1990
-91
1992
-93
1994
-95
1996
-97
1998
-99
2000
-01
2002
-03
2004
-05
2006
-07
2008
-09
2010
-11
2012
-13
2014
-15
2016
-17
per c
ent
Manufacturing
Agriculture
1973 25 per cent across the
board tariff cut
1987Commenced
phasing out of TCF quotas
1993TCF
quotas end
May 1988 Economic Statement 5 year tariff cuts
1991Building a
Competitive Australia initiative 4 year tariff cuts
2010Maximum
PMV tariff set at 5 per cent
2015Maximum TCF tariff set at 5 per cent
a Refers to selected agriculture activities up to and including the year 2000-01. From 2001-02, estimates refer to division A of the Australian and New Zealand Standard Industrial Classification which covers agriculture, forestry, fishing and hunting activities (ABS 2013).
Source: Commission estimate.
Assistance to manufacturing has fallen dramatically over the past 45 years
The estimates indicate a marked fall in measured assistance to the manufacturing sector over the past 45 years. The estimated effective rate of assistance for manufacturing as a whole (as calculated in the first series) was around 35 per cent in 1970-71. Since 2000, the rate has been around 5 per cent, declining to 3.9 per cent in more recent years.
Major influences on this fall over the past four decades have been the 25 per cent across the board tariff cut of 1973, the removal of all quantitative import restrictions (except for textiles, clothing and footwear) by 1988, and the broad programs of tariff reductions that commenced in the late 1980s. Under the May 1988 Economic Statement the Government
44 TRADE AND ASSISTANCE REVIEW 2016-17
introduced an across the board program to phase down all tariffs (except for passenger motor vehicles and textiles, clothing and footwear activities which had their own tariff reduction programs) to either 10 per cent or 15 per cent by 1992.
Reductions in general tariff rates were continued with the 1991 Building a Competitive Australia initiative which reduced general tariff rates from 15 and 10 per cent to a single rate of 5 per cent over the four years from 1992 to 1996. As part of the initiative, tariffs on passenger motor vehicles were reduced to 15 per cent by 2000. For textiles, clothing and footwear activities import quotas were abolished by 1993 and tariffs phased down to a maximum of 25 per cent by 2000.
Subsequent falls in effective assistance to manufacturing have been associated mainly with reductions in tariff assistance to the textile, clothing and footwear, and passenger motor vehicle industries. Tariffs on passenger motor vehicles were further reduced from the 15 per cent set in January 2000 to 10 per cent in January 2005 and 5 per cent in January 2010. After the termination of tariff quotas in 1993 and the phasing of tariffs to a maximum of 25 per cent by the year 2000, maximum TCF tariffs were reduced to 17.5 per cent in January 2005, 10 per cent in January 2010, and 5 per cent in January 2015.
Australia’s tariff schedule, which lists a 5 per cent general tariff for about 50 per cent of products (at the HS 8 digit level), continues to provide assistance (border protection) to many manufacturing activities, and an associated cost impost on consumers, input use and government administration. The Commission has long considered that the 5 per cent general tariff rate should be eliminated (PC 2000, 2017). In practice, the protective effect and cost impost of the remaining tariffs depends upon the pattern of imports and the operation of certain tariff concessions. For instance, the industry assistance effects of tariff reduction preferences under Australia’s preferential bilateral and regional trade agreements depends upon the degree to which tariff preferences flow through to reduced import prices or are ‘pocketed’ by the exporter/importer (box 2.5). Moreover, potential trade agreement tariff preferences may not be utilised because, to be eligible, the imports need to satisfy complex rules of origin (Crook and Gordon 2017).
ASSISTANCE ESTIMATES 45

Box 2.4 Treatment of trade agreement tariff preferences in assistance estimates
The tariff preferences provided under Australia’s preferential trading agreements (PTAs) need not result in any change in prices in the domestic market and, thus, in assistance to Australian industry provided by the general (Most Favoured Nation or MFN) tariff regime. This would be the case if producers in the partner country effectively ‘pocketed’ the tariff concessions, rather than reduced their prices below the prevailing (tariff inflated) price of rival imports.
However, to the extent that tariff concessions provided by PTAs reduce the prices of imported products in the Australian market, assistance to the relevant industry’s outputs would be lower than that implied by the MFN rate. At the same time though, where the price of imported inputs falls as a result of PTA preferences, the penalties (or negative assistance) on the industry’s inputs will also be lower than implied by the MFN rate. Whether this leads to a net overstatement or understatement of assistance to the Australian industry in question would depend on trade patterns with the PTA partner countries, which products are subject to price reductions, and their relative magnitudes.
Assistance to the agricultural sector hides significant disparities across agricultural activities
For agriculture, the estimated effective rate of assistance (as calculated in the first series) was over 25 per cent in 1970-71. By 1974-75 it had fallen to about 8 per cent. The subsequent volatility in the agricultural estimates, particularly through the 1970s and 1980s, reflects variation in domestic support prices and world prices (used for assistance benchmarks) as well as the impact of drought and other factors on output.
The agricultural sector average, however, hides enormous disparity across agricultural activities. For example, effective rates of assistance to tobacco growing exceeded 250 per cent in the early 1970s, subsequently falling to 24 per cent in 1986-87 and then increasing again to over 250 per cent between 1992-93 and 1994-95. Effective rates to eggs also exceeded 250 per cent through much of the 1970s and early 1980s, while effective rates to the dairy industry were over 200 per cent in 1986-87. In contrast, extensive cropping, excluding wheat, recorded relatively low effective rates of assistance over the entire period.
46 TRADE AND ASSISTANCE REVIEW 2016-17

3 National security measures: some trade and assistance implications
Key points Australian governments have undertaken major spending and regulatory initiatives aimed at
reducing terrorism and other national security risks over the past decade and a half in response to mounting concerns.
There is little question of the need for governments to reduce such risks. But a key challenge is to find the most effective measures and to balance the social, personal and economic benefits of mitigating such risks against the costs. Like any area of government regulation, measures should be designed to reduce harm at least cost.
As additional security measures are imposed, greater consideration of the national security regulations that are no longer required — the kind of trade-off that was once well-respected in regulation reform — would be a positive step.
In some cases, policies can act as a barrier to trade or skew investment. For example:
– While data localisation regulations in Australia are currently narrowly applied, the international trend is towards tougher regimes. These restrictions limit the global transfer of digital information, somewhat indiscriminately. They can undermine the global use of new platforms, and force businesses to use costly local data centres when lower cost alternatives exist elsewhere. The lesson for Australia is to avoid data nationalism and, instead, help craft higher confidence via international agreements and cooperation that address security and concerns, while making full use of data.
– Airport security regulations and government outlays that help promote aviation security are critical. However, such measures raise the costs of passenger travel and accordingly affect trade in services (such as tourism), and impose inconvenience — impacts that governments should consider when introducing security measures.
Unlike many other major areas of government activity, there is very little visibility of the costs created by national security measures.
Governments have no clear framework for deciding whether the costs of security should be directly met by taxpayers, businesses, or consumers, with significant variations across industries and activities.
The area would benefit from periodic systemic review by an agency without active involvement in security policy and with appropriate security clearance. Setting out a robust framework would guide decisions, whether made in response to a contemporary security event, or to better manage systemic risks, and foster public understanding and support.
NATIONAL SECURITY MEASURES 47

National security — the safety of a country from war, espionage, serious and organised crime, biosecurity threats, terrorism and cyber attacks — is of great value to the Australian people, with the threats of the latter two particularly attracting recent public and policy attention. Public concern about the risks of terrorism incidents has risen over the past two decades, though actual incidents have fortunately been rare (box 3.1). High-profile cyber attacks against both government and corporate targets have become a regular occurrence globally.
In recent years, there has been an expansion of Australian regulations and laws, for example, in relation to data retention and transport security. By some assessments, there has also been an increase in overall counter-terrorism resourcing (Barker 2016; Bergin 2015), though funding that is reported to be specifically dedicated to counter-terrorism increased from very little twenty years ago to a peak of around $800 million in 2008, before falling to just above $500 million in 2013-14 (PMC 2015, p. 9). The growth in spending up to 2008 reflected investments in new capabilities following greater awareness of security risks in Australia stemming from a series of major global incidents — 9/11 and bombings in Bali, Madrid and London.
There is little question of the need for government action to reduce national security risks. And, like any area of regulation, governments need to design the measures to be effective in reducing harm, efficient in their use of government funds, and minimise compliance and other costs. Governments act to protect human life in many fields — including health care, workplace health and safety and road safety — and are obliged to design policies carefully to achieve the best outcomes for the community at the lowest overall cost. National security should be no different.
Security measures often necessitate secrecy. This should not preclude careful assessment of governments’ spending and regulatory measures aimed at averting terrorism or mitigating its effects. Secrecy may mean they are subject to a lower level of transparency and external scrutiny. Some have questioned whether there is adequate consideration of costs of security measures:
The term ‘security’ has increasingly been appended or invoked in other policy areas — for example, water-security, energy-security, food-security and bio-security. There is a danger that the costs of policy proposals in these areas escape sufficient scrutiny because of the safety blanket of ‘security’. (Eslake 2016)
Others have queried whether the overall system of counter-terrorism measures, having grown over time in response to incidents and emerging threats, should be redesigned to achieve its objectives at lower cost to the community:
Australian departments and agencies were already very well-funded by Western standards, taking into account the level of terrorism threat, and there must be some doubt that all the additional funding put towards counterterrorism (CT) since 9/11 has been well utilised. … What Australia requires at this point is a thorough review of our CT efforts by someone from
48 TRADE AND ASSISTANCE REVIEW 2016-17

outside the system that would focus on desired outcomes and better-structured resourcing. (Williams 2017)
Box 3.1 Terrorism in AustraliaPublic concern about the risk of terrorism incidents has risen over the past two decades. Recent national survey evidence suggests that around 16 per cent of Australians were personally ‘very concerned’ about the prospect that they or their family would be a victim of terrorism and a further 29 per cent ‘somewhat concerned’ (Sheppard 2016, p. 5). More Australians say that terrorism is the ‘most important problem facing Australia today’ than other issues such as housing affordability, social services, alcohol and drug use and taxation (ibid, p. 17). In 2017, 49 per cent considered that terrorism represented the biggest threat to global stability and peace, significantly higher than any other threat (Essential Research 2017). And over the two year period from 2014 to 2016, nearly three quarters of Australians considered that the threat of terrorism had increased in Australia. However, depending on the survey, between half and three-quarters of Australians did not say that governments should spend more money (Essential Research 2017a; Sheppard 2016).
The existence of terrorist threat is clear, though the number of terrorist incidents and arrests in Australia remains limited. From January 2014 to June 2017, there were eight people killed in Australia in terrorism activities, three of which were the perpetrators. There have been few prosecutions and convictions for planning or undertaking terrorist acts — with 35 prosecutions and 26 convictions over the period from September 2001 up to 2015 (PMC 2015, p. iv). The implementation of additional security measures by Australian governments may have contributed to the small scale of terrorist activities, though it is hard to know the counterfactual with any confidence.
It can be difficult to separately identify genuinely increasing risk and a rise in detection associated with greater resourcing. This is partly a consequence of the necessary secrecy that surrounds intelligence on such risks. Nevertheless, there are indicators that suggest terrorism risks in Australia may be growing. For example, Suspicious Matter Reports assessed by AUSTRAC as related to terrorism financing increased from 31 in 2008-09 to 134 in 2013-14. Passport cancellations related to people who may engage in terrorist activities increased from 4 in 2011 to 65 in 2014 (PMC 2015, p. 18).
This chapter considers four recent developments in the trade and assistance arena that relate to national security:
mandatory meta-data retention requirements for certain telecommunication businesses and the provision of $128 million industry assistance towards defraying the compliance costs
restrictions on the cross-border flow of data, for security-related purposes, and the inclusion in trade agreements, notably the Trans-Pacific Partnership, of provisions seeking to discipline unnecessary restrictions
aviation security regulation, which has involved significant costs to airport and airline operators and the travelling public. These have affected trade in services and involved various kinds of budgetary outlays to Australian airport operators
cost recovery of screening parcels. While not yet implemented, the Australian Government has released a discussion paper on charging the importers of low-value
NATIONAL SECURITY MEASURES 49
parcels for the cost of security screening. (Currently, a range of screening costs are funded by charges only on high-value parcels). Any charges would add to the cost of importing such parcels, with associated impacts on international trade. Whether this comprises assistance depends on the nature and level of the charge.
These developments illustrate some of the broader questions that should be addressed in the national security area. For instance, are the objectives of, and risks associated with, security measures adequately specified and assessed? Are the full range of economic costs of security measures recognised, measured and given weight in making decisions? Do businesses have the scope to identify and adopt the most cost-effective and innovative approaches to meeting security objectives? Are the benefits and costs of security measures periodically reviewed? Which parties should bear any costs?
Failing to ask these questions through a considered and evidence-based process risks unproductive expenditure by businesses and others, potentially new forms of barriers to trade, and imposts on consumers and citizens.
3.1 Industry assistance for mandatory data retention
This case study focusses on the compliance costs to industry of mandatory data retention and the financial assistance provided to help defray these costs. The potential security benefits of these measures and the privacy risks (costs) are not assessed.11
Since October 2015, almost all telecommunications service providers have been required under the Telecommunications (Interception and Access) Act 1979 (TIA Act 1979) to retain certain telecommunications data for at least two years.12 The retained data can be requested by designated law enforcement and security agencies for investigation of serious criminal offences (which includes terrorism).
Prior to mandatory data retention, telecommunications companies voluntarily retained some data for commercial reasons. However, enforcement and security agencies argued that their investigation powers were being eroded as companies moved towards retaining less data and for shorter periods (PJCIS 2015, para. 2.63-2.77). In addition, commercially retained data was inconsistent — carriers retained different types of data and for different periods — and this was considered to impede the effectiveness of investigations (para. 2.78-2.86).
11 Such assessment was the focus of the inquiry by the Parliamentary Joint Committee on Intelligence and Security (PJCIS), Advisory Report on the Telecommunications (Interception and Access) Amendment (Data Retention) Bill 2014 (the ‘Data Retention Inquiry’), released February 2015.
12 Telecommunications service providers that use infrastructure in Australia to operate any of their services may be subject to data retention obligations. Service providers include: licenced carriers, carriage service providers and internet service providers. During the 18-month implementation period that ended on 13 April 2017, 310 providers submitted 402 Data Retention Implementation Plans for approval by AGD (AGD 2016, p. 58). Services excluded from the data retention obligations include broadcast services and internal networks of universities and corporations (p. 19).
50 TRADE AND ASSISTANCE REVIEW 2016-17

Analysis undertaken for the Australian Government in 2014-15 suggested that the initial cost of complying with data retention rules would be between $188.8 million and $319.1 million.13 This estimate strongly influenced the amount of industry assistance offered. The Parliamentary Joint Committee on Intelligence and Security in their 2015 report recommended that ‘the government make a substantial contribution to the up-front capital costs of service providers’ and provided guidance on the design of the assistance (recommendation 16, PJCIS 2015). It called for a particular focus on smaller service providers, which were seen at risk of struggling financially to implement data retention. It also explained why full compensation should not be provided:
complete re-imbursement for costs would provide an incentive for firms to gold plate their compliance activities
service providers should bear some of the costs associated with the harms that could arise from their services being used to ‘enable and facilitate serious criminal activity and threats to national security’ (para 5.124) (an issue explored further below).
In the May 2015 Budget, the Australian Government earmarked assistance of up to $128.4 million (less than the estimate of costs above), without indicating how these funds would be distributed to businesses. In the meanwhile, ahead of any assistance, businesses were required to have an approved implementation plan to meet the legal obligations for data retention.
Assistance guidelines were issued in December 2015 and applications for grants taken. Altogether 180 eligible applicants submitted anticipated costs of $198.5 million. These applications were assessed against a consultant’s modelling of costs to estimate grant amounts for each applicant. This methodology was complex and costly to undertake, and led to estimates that in most cases exceeded those of the applicants. Ultimately, the model results were adapted so that reimbursement was capped to a maximum of 80 per cent of the applicants’ submitted costs or a minimum of $10 000, but subject to the budget constraint of $128.4 million. All bar four applicants received 80 per cent of their estimated costs. Two small applications received $10 000 minimum payments and two applications that far exceeded the modelled costs received less than 80 per cent. The three largest grants accounted for $83.5 million of the awarded $128.4 million: Telstra ($39.9 million); Vodafone Huchinson ($28.8 million) and Singtel Optus ($14.8 million).
The ultimate industry assistance design had some positive features. There was a reasonable process for discovering the costs of implementing the measures (by building on the already in place approved Implementation Plans). Funding 80 per cent of estimated costs created
13 The figures were estimated by PricewaterhouseCoopers (PwC), though the basis for estimates is not publicly available due to cabinet confidentiality (PJCIS 2015), para. 5.103). The magnitude of compliance costs for industry and consumers was a controversial topic, and estimates changed and were subject to contest as the policy unfolded over the years from 2012 to 2016. The industry initially pointed to very large costs between $500 million and $700 million (PJCIS 2013), but this related to a policy that had yet to be clearly defined. There was, for example, uncertainty about whether retention of internet browsing data and URLs would be required (and indeed ultimately, the scope of the law was much narrower). The industry subsequently lowered its estimated impacts.
NATIONAL SECURITY MEASURES 51
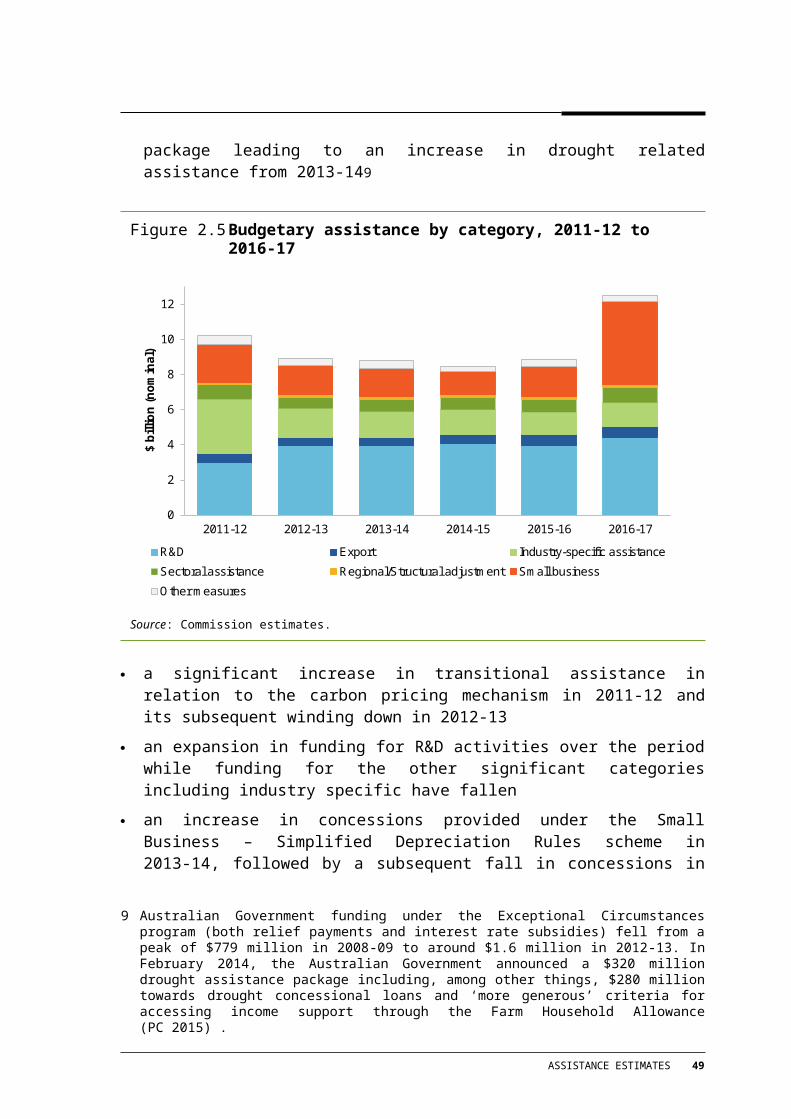
some incentives for the telecommunications companies to invest efficiently as they rolled out their infrastructure. The Australian Government could have chosen to regulate without assistance, which as noted below, has some potential efficiency advantages. However, a budgetary obligation does at least entail a greater level of scrutiny and transparency than regulation. It also has the potential to accelerate the uptake of the relevant technology given that industry will be more receptive to measures that allow more immediate cost recovery.
The option of no industry assistance
When governments introduce new regulation to require or prohibit behaviour they rarely compensate businesses for the costs of complying with the new regulations. Rather, governments normally require businesses to bear these costs, which are typically passed on to consumers through higher prices. For instance, airports and airlines bear the bulk of costs of aviation security, with budgetary support playing a lesser role (section 3.3).
Well-designed regulation is often a reasonably efficient alternative to achieve governments’ objectives compared with budgetary assistance.
Businesses have a very strong incentive to pursue the lowest cost manner of compliance. In the current example, the way in which the Australian Government reimbursed businesses provided weaker incentives for cost minimisation than a performance-based regulatory approach. There is a risk that some businesses may have ‘over engineered’ to provide capacity to grow in future years, though the approval of Implementation Plans is likely to have reduced such outcomes.
Regulation may be more administratively efficient. The need to administer new regulation creates costs, but these may be partly absorbed within agencies’ existing budgets. In contrast, a grant program typically requires new dedicated resources given the required processes for handling public money. Administration costs in the current grants program are unclear but material: the Attorney General’s Department received $2.9 million in additional funding for both approval of implementation plans and delivery of the grants program, though the relative apportionment between tasks is not known.
Regulations may avoid the substantial economic costs from taxation to fund assistance. For example, taxing labour income discourages employment resulting in less economic output. The welfare loss of increasing labour income tax is typically estimated to exceed 20 cents for every dollar of revenue raised (Cao et al. 2015).14
A regulatory approach generally gives equal treatment to incumbents and new entrants whereas budgetary assistance may only be available to incumbents at a point in time. In the case of data retention, this usual advantage of regulation does not appear to hold as
14 Of course, passing regulatory costs through to consumers also reduces economic output by discouraging legitimate users of telecommunications services, which is an offsetting factor. In this case, the price elasticity of demand for telecommunications is low (Goel et al. 2006) and so the effect would be similarly very small.
52 TRADE AND ASSISTANCE REVIEW 2016-17

the Commission understands that the incremental cost of meeting the data retention requirements for any new entrant would be negligible.
Indeed, in the case of aviation security discussed below, while the Australian Government provided some funding, it was significantly less than the overall compliance costs of security regulations.
The Parliamentary Joint Committee on Intelligence and Security will review the data retention legislation in 2019, with the focus expected to be on the security benefits and privacy risks. Given the atypical use of industry compensation for a regulatory measure, the review would desirably examine the need for and effectiveness of the grant scheme, as well as the overall costs and benefits of the data retention regime. The Australian National Audit Office is also due to report on administration of the Data Retention Industry Grants Program in May 2018, which will shed light on the effectiveness of the design and its operation.
3.2 Restrictions on cross-border flow of data
Governments around the world are increasingly mandating local data storage and introducing restrictions on data transfers across borders. This entails concerns about the costs of doing business, but may also create new forms of border protection.15
The main rationales advanced for regulation in this area, all of which are relevant to Australia, are to:
protect their citizens’ privacy (general personal information, as well as specific categories such as health records) and, in a national security context, avoiding the use of sensitive personal data for coercion, blackmailing and identity theft
protect government data (such as defence, national security and general administration)
protect the operation of critical local infrastructure (such as electricity grids)
facilitate access to data by local enforcement agencies (such as telecommunications metadata and content)
develop (or protect) a local data storage industry — digital mercantilism.
By 2011, over 60 countries had enacted data privacy laws that regulate cross-border data flows (Kuner 2011). Globally, data localisation measures have been strongly increasing over time, especially since 2010 (Bauer et al. 2016, p. 8; Reinsch 2018). Examples of restrictions on data flows for reasons other than privacy appear to be less numerous, but are still significant (Bauer et al. 2014; Cory 2017; Peng and Liu 2017). Restrictions across
15 The focus in this section is much more concentrated than regulations affecting international e-commerce and information flows. It does not cover regulation of ‘data’ in the form of an ‘electronic product’, such as geo-blocking a streamed movie. The chapter is also not concerned with control or censorship of the internet for political and social reasons, though this can be a motivation for data localisation.
NATIONAL SECURITY MEASURES 53
countries vary from the minor to the extreme, with Australia currently at the less restrictive end of the spectrum.
Some Australian examples of data regulations, guidelines and restrictions include:
Under Australian Privacy Principle 8, no entity (private or public) is allowed to disclose personal information to an overseas recipient unless reasonable steps (such as enforceable contracts) are taken to ensure that an overseas recipient is governed by a law ‘substantially similar’ to the Australian Privacy Principles (chapter 8 of OAIC 2015). Privacy laws do not, however, preclude storage of data offshore (DTA 2017, p. 20).
The Personally Controlled Electronic Health Records Act (2012) requires MyHealth records to be stored in Australia.
Foreign investment into Australia has been subject to data flow restrictions. For example, the approval of the 99-year lease of TransGrid to an international consortium was contingent on the requirement that electricity supply data and personal information be held and accessed solely within Australia (FIRB 2017, p. 26).
While the Australian Government does not prohibit government agencies from using offshore cloud services or foreign-owned services in Australia, controls are in place for highly classified information, and agencies must assess risk for other data. The Department of Defence (2017, p. 19) notes that:
Cloud services located offshore may be subject to lawful and covert collection, without the information owner’s knowledge. Additionally, use of offshore cloud services introduces jurisdictional risks as foreign countries’ laws could change with little warning. Further, foreign-owned cloud service providers operating in Australia may be subject to a foreign government’s lawful access. A comprehensive risk assessment is essential in identifying and managing jurisdictional, governance, privacy, technical and security risks.
The New South Wales Government, in privatising the titling and registry services of Land and Property Information, required that ‘electronic forms of the Register are stored on dedicated physical infrastructure located in Australia’, though the rationale for this is unclear (NSW Government 2017 and the Land and Property Information NSW [Authorised Transaction] Act 2016, clause 13(2)(b))).
The economic costs are likely to be substantial if there is over-reach
While such restrictions may be warranted on privacy and national security grounds, the concern is that, if the regulations go beyond those required, they will create unnecessary barriers to cross-border trade. For example, this could occur where restrictions:
impose additional costs on firms to store or process data onshore where lower-cost services are available offshore. For instance, a foreign supplier that used advanced technology to remotely analyse MRI scans from another country’s healthcare system would need access to the scanning data. Absent that, either the costs of analysis could be higher, or its quality lower (Cory 2017, p. 8). In some instances, a restriction on data
54 TRADE AND ASSISTANCE REVIEW 2016-17

portability across borders can preclude the supply of a service altogether. For example, Russian data localisation laws have meant that LinkedIn is not permitted to offer its services to citizens of that country (Reinsch 2018). Similarly, the development of new tradeable goods and services for improved treatments of rare diseases can require big data sets, which can only be created through unencumbered cross-border data flows (Cory 2017, p. 7)
act as a barrier to competition for data storage and processing services, potentially providing local firms with a degree of market power
reduce the capacity of firms to participate in global value chains by hampering collaboration between a multinational firm’s multiple locations or with partners across borders, increasing the cost of their operations and limiting innovation.
The impacts of such data restrictions can be magnified if inconsistencies arise between international agreements and a country’s own regulations. The European Union’s General Data Privacy Regulation (which favours a relatively open approach to data sharing) conflicts with a number of regulations at the member state level (Reinsch 2018).
The magnitude of the costs associated with data regulations are hard to estimate precisely. The costs of duplicating data centres are sizeable given that building data centres can cost tens of millions of dollars (PC 2015, p. 138). However, the effects on data flows and the services that use them constitute the biggest impacts, with the few estimates available suggesting these are non-trivial. For instance, liberalisation of existing data localisation measures in the European Union (EU) is estimated to directly increase the gross domestic product (GDP) of most member states by around between 0.01 and 1.1 per cent depending on the country, with the typical effect being around 0.05 per cent (Bauer et al. 2016, p. 11). Liberalisation would have even larger impacts if countries were prevented from adopting more restrictive forms of data localisation, with benefits from avoiding ‘data nationalism’ estimated at around 0.4 per cent of GDP for EU members. Other estimates suggest that foreign data flow restrictions cost the United States between 0.10 and 0.36 per cent of GDP and 0.55 per cent in China (Bauer, Ferracane and van der Marel 2016; Cory 2017).
The above effects are large compared with many other regulatory imposts. In part, this reflects that the losses are greatest in the communications sector and that reduced productivity in that sector percolate throughout the economy because communications is an essential input into nearly all industries. However, the results should be interpreted as only indicative. The accuracy of the results depends on the measure of the regulatory severity of data localisation used and the degree to which the statistical analysis of the link between that measure and industry productivity growth rates is sound.
While some of the costs of data restrictions will be offset by benefits, the critical point is that the potential size of the economic costs strongly point to a targeted approach to data localisation.
NATIONAL SECURITY MEASURES 55

Regulation should be proportional to data security risks and assess the scope for business flexibility
The economic costs involved with data localisation policies suggest that the way regulations and restrictions are designed is crucial. In general, restrictions that set minimum standards and allow businesses flexibility to meet those standards will mitigate costs better than blunt instruments.
For example, domestic data storage is not necessarily more secure than storage overseas. Security will depend upon the physical security of the location, the quality of cyber security (robustness to hacking) in place, and the appropriate rule of law in the host country. In some cases, international businesses running large-scale international data centres may offer greater security than a smaller business running a local venture. Quality cyber security, for example, requires a large, ongoing cost in assessing vulnerabilities and taking remedial action. Of course, a nuanced approach would ideally differentiate between ‘safe and secure’ countries and others where the risks were greater. This would apply, for example, to a country with lax or weakly enforceable privacy laws, or where a foreign government was able to compel a business to provide data. A blanket restriction on offshore data storage would be unnecessarily costly.
Similarly, government regulation of businesses’ storage and processing of data is only necessary where there is a material risk that the business does not have a strong incentive or ability to address security problems itself. Firms have a strong commercial incentive to meet their customers’ (government, business and consumer) expectations about data security. Many companies have adopted binding corporate rules to regulate the movement of data within their own firms and developed standard contractual clauses to seek consent for clients on their use of third party data services (BIAC 2017, p. 3).
However, in some instances there may be additional national security or public welfare concerns (such as the operation of critical infrastructure), or government agencies may have access to better information on security risks. It is only in such cases that it may be necessary for domestic regulations to overrule firms’ data storage and transfer decisions.
International cooperation to control restrictions on data flows
International agreements have started to recognise the substantial economic costs that result from unnecessary restrictions on data flows.
The Korea-US Free Trade Agreement (2011) appears to be the first international agreement with binding rules on cross-border data flows, requiring that the signatories endeavour to refrain from ‘imposing or maintaining unnecessary barriers to electronic information flows across borders’ (Meltzer 2013, p. 17).
The original 2016 Trans-Pacific Partnership Agreement, which has been renegotiated after the withdrawal of the United States, was the first multi-party preferential trade
56 TRADE AND ASSISTANCE REVIEW 2016-17

agreement seeking to reduce protectionism arising from data residency requirements (box 3.2).
The European Union’s General Data Protection Regulation aims to bring consistency in the regulatory environment for data protection and privacy for international businesses processing data of European citizens. It is due to be enforceable in mid-2018.
Agreements could go further. For example, agreements on the protection of privacy that establish common international protocols and protections could provide greater confidence in foreign service providers and reduce the cost of international data commerce. There are already some approaches — most notably in Australia’s region, the Asia Pacific Economic Cooperation (APEC) Privacy Principles and APEC’s Cross Border Privacy Rules (CBPR) system — that could be adapted and used more broadly (Panday 2017; PC 2015, p. 137).
Box 3.2 The data localisation clause in the TPP-11The data localisation clause for the TPP-11 — The Comprehensive and Progressive Agreement for Trans-Pacific Partnership states the following:
Article 14.13: Location of Computing Facilities
1. The Parties recognise that each Party may have its own regulatory requirements regarding the use of computing facilities, including requirements that seek to ensure the security and confidentiality of communications.
2. No Party shall require a covered person to use or locate computing facilities in that Party’s territory as a condition for conducting business in that territory.
3. Nothing in this Article shall prevent a Party from adopting or maintaining measures inconsistent with paragraph 2 to achieve a legitimate public policy objective, provided that the measure:
(a) is not applied in a manner which would constitute a means of arbitrary or unjustifiable discrimination or a disguised restriction on trade; and
(b) does not impose restrictions on the use or location of computing facilities greater than are required to achieve the objective.
The provision for an exclusion based on ‘a legitimate public policy objective’ reduces the requirement for countries to immediately remove data localisation measures that were already in place. For example, localised storage of health records may be an important element in gaining public confidence about the privacy of a national database. On the other hand, some analysts are concerned that the legitimacy of any exception could be picked over by trade lawyers who have ‘no particular expertise in privacy or human rights’, and have suggested other policy remedies to facilitate useful data flows, such as internationally agreed de-identification methods and thresholds for informed consent (Panday 2017).
Source: DFAT (2017).
NATIONAL SECURITY MEASURES 57

3.3 Aviation security costs
High-profile terrorist attacks on aviation and mass transit systems have accounted for the majority of terrorist-related deaths and injuries in developed countries over the past two decades. Against that background, airport security remains a high priority for Australian governments.
Fortunately, there has not been a successful terrorist attack in Australia involving aviation, but it remains a credible threat. The attempt to bomb an Etihad plane in Sydney in 2017 is an example. The Australian Security Intelligence Organisation has indicated that ‘civilian aviation will remain a high-value terrorist target for the foreseeable future’ (ASIO 2015, p. 2).
In response to international attacks, newly identified security vulnerabilities and other indicators of heightened risk, there have been multiple reviews of aviation security in Australia since 2002.16 The result has been that regulations have strengthened over time to address these risks.17 However, such regulations have been accompanied by costs to the Australian community and have increased the cost of movement of people, for business, study and tourism.
The costs of aviation security measures
Aviation security is costly and these costs are ultimately borne by consumers, taxpayers or shareholders.
Business expenditure
Airlines and airports would, absent government directives, still invest in security to deliver a quality service to their customers, protect their assets, and to maintain reputation and sales. While it is unclear how much they would undertake in the absence of government regulations, security costs for business, both airlines and airports, are substantial. Qantas alone spent $260 million on security in 2013-14 and employed around 800 contractors dedicated to security services (Qantas 2015, p. 6). Overall, there are around 260 airports and aerodromes nationally (AAA 2015) which to a greater or lesser extent, must invest in security services. One survey of 20 airports — 5 capital city, 4 major, 10 regional and 2 small regional — found that over the previous five years, respondents had spent around $170 million on security-related investments (AAA 2015). This included screening
16 An overview of reports and reforms is provided in SRRATRC (2017).17 Some airline carry-on baggage restrictions imposed since 9/11 have been relaxed (such as allowance for
blunt small scissors and knitting needles). However, other debatable baggage restrictions remain. Badminton racquets are not permitted given the potential to strike someone. Cable ties are prohibited because they could be used to restrain someone, and while matches, cigarette lighters and lighter fuel are permitted, toy caps are not. A duty free glass bottle of alcoholic beverage is permitted — despite the risks of ‘bottling’ — while other less sharp objects are not.
58 TRADE AND ASSISTANCE REVIEW 2016-17
equipment, building alterations, access control, perimeter fencing and information technology systems and total annual security staff costs of $64 million. As this was only a small sample, total security-related airport costs would be considerably higher. In the survey, screening costs represented more than 30 per cent of the annual budgets of regional airports, and comprised the greatest share for the smallest regional airports (p. 8).
Given private incentives to invest in security, only a share of any security-related costs imposed by government regulation is genuinely ‘additional’. One of the lessons from this is that governments should try to avoid paying for security measures that the aviation sector would take anyway, and resist excessive prescription about security approaches where the sector can find better ways of achieving the same security goal.
Airport cost recovery
Airports are permitted to levy per passenger charges to airlines for government-mandated security requirements. These are monitored by the Australian Competition and Consumer Commission for the four largest airports — Sydney, Melbourne, Brisbane and Perth (ACCC 2017, pp. 49, 81, 113, 141). The charges vary considerably. For example, the domestic security charge in Melbourne was around $3.90 per passenger in 2015-16, and around $2.70 in Brisbane. All airports charged around $4 per passenger for international security cost recovery. Given the tens of millions of passengers flying each year, the cumulative costs are high.
Domestic security costs for regional airports are proportionately higher, which reflects less passenger throughput and the high fixed-cost nature of security expenditures (AAA 2015, p. 8). Security mandates and airport-specific charging may inefficiently penalise regional airports. The security measures undertaken by smaller airports contribute to safety across the airport network, including for onward flights.
Intangible costs for passengers
Waiting times for passengers also represent a cost of many security measures, albeit intangible and hard to measure accurately. As pointed out by the Director General of the Association of Asia Pacific Airlines (Chong 2017, p. 1):
The security and security processes always rank amongst the least-pleasant parts of the travel experience according to passengers and this year we have seen a number of initiatives which have further complicated life for passengers going through airport security. … Our concern is people very rarely sit down and work out what the overall costs of security are. If they did, they might not embark on some of these initiatives, they’d question the cost-benefit analysis which is what we do with safety all the time.
The economic cost is the lost employment time or enjoyment that flows from people leaving earlier than necessary to travel to the airport. The time spent clearing security varies from less than one minute to more than ten minutes, but given the costs of being late to a flight are much more than the costs of being early, passengers tend to act on the worst rather than the average delay. With around 60 million domestic and 40 million
NATIONAL SECURITY MEASURES 59

international passenger trips per year (BITRE 2018a, 2018b), delays in security require people to spend up to 17 million more hours in airports than otherwise, whose cost in dollars depends on how much that time is valued.18 Clearly, it would not be trivial.
Government funding for aviation security
Notwithstanding private incentives to invest in security, governments still regulate and provide funding because national security measures generate gains beyond those accruing to passengers (for instance, due to broader impacts on the economy and people’s sense of public safety). Commercial protections may also be lower than customers expect, for example, because companies are limited in their liability or because both airlines and airports have a degree of market power.
There is no easily accessible figure for Australian Government spending on aviation security. By one estimate, the Government spent $1.2 billion on aviation security measures between 2001 and 2007, with a further $57.2 million of spending initiatives announced in 2007 (Vaile 2007). This included spending to address other unlawful activities, such as drug importation and violations of biosecurity. In 2010, the Government pledged $200 million of further funding for aviation security, with a foiled attack on a US airline acting as its trigger:
On Christmas Day 2009, Nigerian national Umar Farouk Abdulmutallab attempted to detonate an improvised explosive device onboard North West Airlines flight 253 (NW253). In response to this incident, the Government will invest $200 million over four years to further enhance and strengthen Australia’s aviation and border security regime. (Australian Government 2010, p. 40)
The measures included expansion of the Australian Federal Police and Customs presence at major airports, an increase in the use of closed circuit TV and screening of airport staff, introduction of explosives detection, and new technology for passenger, baggage and cargo screening.
Three measures earmarked funding to industry, and accounted for around half of the total spending (Albanese 2010). These involved $28.5 million to assist the industry to introduce a range of new screening technologies at passenger screening points; $32 million to bring forward screening at a number of additional regional airports served by larger passenger turbo-prop aircraft; and $54.2 million to assist industry to install cargo x-ray screening and explosive trace detection technology at selected locations. Two programs established after the package was announced — the Optimal Technologies at International Gateway Airports Program and the Regional and Domestic Aviation Security Program — appear to be the implementation of the first two announcement elements above, and involved spending of $38.6 million over the three years from 2011-12, less than the announced $60.5 million (DIRD 2014, p. 48; DIT 2013, p. 51; DIT 2012, p. 52).
18 This calculation assumes clearing security causes people to arrive at the airport 10 minutes earlier than they otherwise would. Given the uncertainty around how long it will take, some people would plan more conservatively.
60 TRADE AND ASSISTANCE REVIEW 2016-17

State Governments also contribute to aviation security. For example, Western Australia has provided grants for regional and remote airports throughout the state, including for security upgrades (EISC 2017, p. 83).
Government funding should not necessarily be characterised as assistance in its traditional form. It could be so if it favoured security provision in one part of the travel industry over others. However, the capacity of people to choose alternative forms of medium distance transport is lower in Australia than in many other countries.
The most important questions in relation to aviation security support relate to its level and form, the processes used to determine the right balance of costs and benefits, and who pays.
Finding the balance of benefits and costs in aviation security
There are clear benefits from implementing security measures that reduce the risk of terrorist attacks and, if they occur, their impacts. A successful terrorist act in the aviation sector would have major personal and social ramifications. The evidence also suggests large impacts on some economic activities, such as tourism (Bergin and Khosa 2008).
The likelihood of being killed or injured in a terrorist act is very low compared to most other causes of death, such as automotive accidents, but media attention and the emotional resonance of terrorism mean that perceived risks are higher (Newell, Donkin and Navarro 2017; Stevens et al. 2009; Sunstein 2002). Even if perceptions of risk are biased, policy still needs to consider these because such perceptions drive people’s behaviour. (This finding also suggests that in some instances, policy initiatives might consist of providing the public with reassurance about the low probability and impact of terrorist activities compared with other security risks.)
Given the size, array and incidence of costs, it is particularly important to analyse the effectiveness and value-for-money of security interventions. Some have undertaken such analysis, and found contrary evidence about the cost-effectiveness of some aviation security measures in Australia, and to a greater extent, globally (Gillen and Morrison 2015; Mueller and Stewart 2011, 2014). This highlights the need for an analytical framework and benefit-cost assessment. Such frameworks exist in other areas where the benefits comprise both lives saved and economic benefits. The challenges are substantial (though surmountable). This reflects that:
the events concerned can have a low probability and a high impact
the responses to new government measures by terrorists and others posing security risks are unclear (such as substitution to other methods of harming people or assets and diversion to other countries)
harms from any event include public perceptions of safety and not just safety per se
the incremental benefits of additional measures are hard to assess
NATIONAL SECURITY MEASURES 61
counterfactuals are hard to estimate.
The costs are easier to calculate.
To ensure value for money for Australian passengers and taxpayers, it is important that the money spent on airport security is worthwhile, not just in aggregate, but for each incremental strengthening of arrangements. For example, full body scanners are now used in a number of Australian airports. They are costly and some argue not technically effective (Mowery et al. 2014; Stewart and Mueller 2011), though the technology may improve in accuracy over time. Even more fundamental doubts have been expressed about the net benefits of air marshals on planes in the US, noting Australia also employs ‘Air Security Officers’ on some flights (AFP nd).
… the Transport Security Administration’s Federal Air Marshal Service and its full body scanner technology together are nearly as costly as the entire FBI counterterrorism budget, but their risk reduction over the alternatives appears to be negligible (Mueller and Stewart 2011; Stewart and Mueller 2011, 2013a, 2013b). Moreover, the body scanner technology only deals with specific threats associated with hijacking and body-borne bombs on aircraft. (Mueller & Stewart 2014, p. 246)
One hindrance to the development of sound long-term policy making is the sense of urgency that often surrounds decision-making. As in many areas of public policy, a crisis is often the trigger for substantial regulatory changes and the allocation of additional government funding. The resulting policies often remain in place for some time. In the national security arena, ‘crisis’ events perhaps occur more frequently — certainly more prominently — than in some other areas. Indeed, at times, policymaking appears to be reactive and perhaps appropriately so. Just one incident — the attempt to deploy an improvised device on a 2017 Etihad flight from Sydney — precipitated immediate additional security measures in domestic terminals and calls for much tougher restrictions.19
A critical ingredient in the development of sound policy is consultation (and often collaboration) with industry, particularly to develop feasible solutions, identify risks in their implementation, and help identify the lowest cost ways of achieving government objectives. The Australian Office of Transport Security found, in a survey of its own performance, that 36 per cent of industry respondents ‘did not agree’ that it ‘collaborated with industry to ensure that policy and regulatory frameworks were efficient and effective.’(DIRD 2016) On the other hand, some recent policy announcements clearly show regard for compliance costs: biometric approaches to identification (a development likely to be implemented) offer the possibility of preserving self-service arrangements in airports, while still allowing identity checks quickly (DIRD 2017b).
19 There have also been examples of security reactions to incidents that have then been quickly wound back. For instance, the fence constructed around the Melbourne Cricket Ground for cricket events in 2015 was removed for the subsequent 2016 Australian Football League season following several ‘logistical challenges, and concerns with the robustness of the fencing solution’(Cherny 2016).
62 TRADE AND ASSISTANCE REVIEW 2016-17

A test of the reasonableness of costs imposed by regulation might ask whether similar costs are incurred across differing transport modes and locations for any given reduction in risks. Regional airlines in particular have expressed concerns that the costs of security measures they face provide lower reductions in risks than occur elsewhere. As noted by Rex Airlines:
More devastation could be achieved with a bomb in a crowded train than on a regional aircraft. It would be self defeating to implement security measures that are so cost prohibitive at regional airports as to actually kill off essential regional air services when the potential terrorist would just as easily achieve the desired outcome by targeting soft targets like a grocery store, a cafe or an office. Therefore all security measures should be a careful balance of the cost of such measures against the threat levels derived from intelligence sources. (Rex Airlines 2017, p. 2)
The 2017 review of aviation security by the Senate Rural and Regional Affairs and Transport References Committee appeared not to be convinced that risk and costs have been sufficiently assessed, as it recommended:
… that any future reviews of and amendments to aviation security regulation be risk-based and fit for purpose, with consideration given to the unique challenges faced by regional and rural airports and the overall diversity of Australian airports.(Recommendation 1, para. 2.62 in SRRATRC 2017)
Moreover, the 2016 ANAO audit of Passenger Security Screening at Domestic Airports found that the Department of Infrastructure was unable to measure the outcomes and effectiveness of its screening approach:
The Department has implemented a regulatory framework that establishes minimum standards for passenger screening and a program of compliance activities at security controlled airports. However, the Department is unable to provide assurance that passenger screening is effective, or to what extent screening authorities comply with the Regulations, due to poor data and inadequate records. The Department does not have meaningful passenger screening performance targets or enforcement strategies and does not direct resources to areas with a higher risk of non-compliance. (ANAO 2016, p. 7)
On the other hand, it is clear that cost-effectiveness is not ignored in aviation policy making. Not every security proposal gets the green light solely on the grounds of security benefits — fortification of the vulnerable perimeter of any Australian major international airport is seen by most to be prohibitively expensive (AIPA 2015) pp. 3-4).
A review of the aviation security system as a whole, including costs, effectiveness and trade-offs for each measure, may be warranted, as has been recommended in the United States.20
20 The United States Government Accounting Office (2017) recommended that the US Transportation Security Administration systematically evaluate the potential cost and effectiveness tradeoffs across aviation security countermeasures.
NATIONAL SECURITY MEASURES 63
3.4 Cost recovery of screening for low-value consignments
In recent years, the number of low-value consignments entering Australia has grown far more than high-value (over $1000) items. For instance, while high-value consignments increased by just 3 per cent from 2015-16 to 2016-17, low-value consignments increased by 22 per cent, with this trend expected to continue (DHA and DAWR 2018). Currently, the costs of screening parcels and other security measures are cross-subsidised by charges on high-value items, with no contribution from low-value consignments.
On face value, current arrangements are at odds with standard cost-recovery principles, and would justify some kind of charge levied on low-value items. However, there are several important counter-considerations:
Some of the costs of screening and the security are fixed costs, with investments that would need to be made regardless of the volume of consignments. Where that is the case, cost recovery should generally be focused on those goods where the charge has the least impact on demand. A small dollar charge on low-value goods would represent a significant increase in price that discourages Australian consumers from importing those goods. This kind of ‘simple’ method for recovering fixed costs based on a per package basis could therefore incidentally provide assistance to local industries.
As is the case for collecting goods and services tax on low-value imports, any proposal to set security cost recovery charges for low-value goods has to consider the practicalities of revenue collection (PC 2017). The Government’s approach appears mindful of those practicalities, but these will need to be tested. An inefficient method for collecting the revenue can also act as a non-tariff barrier.
The security activities that are being funded by the charge need to be justified.
So far, the Australian Government has not committed to a given approach and there has been significant consultation and transparency about the kinds of approaches that might be used to recover costs.
3.5 Towards better national security policy
One of the key challenges for governments is that addressing one source of security vulnerability leads to the exploitation of others. Hence, there has been a shift towards traffic-based terrorism attacks in Europe.
In many other policy areas, a system-wide cost-benefit framework provides guidance to support good decision making. We have a ‘tax system’, a ‘health system’ and an ‘education system.’ None of these systems work perfectly, but there is ongoing research and policy making that, over time, realigns effort towards the most valuable activities and away from those that are more marginal or even detrimental. In national security, given the
64 TRADE AND ASSISTANCE REVIEW 2016-17

aggressive efforts opponents take to penetrate defences, arguably a systemic approach is even more important.
At times, national security policy making can appear to be reactive in an urgent effort to plug a leak, and rightly so. For example, across the world, aviation attacks are rare and have used different approaches. While it may be difficult to know how best to respond when an attack reveals a longstanding weakness, the option of doing nothing and allowing that weakness to be exploited by other attackers is untenable.
Nevertheless, a succession of policy changes made on the go, or primarily in reaction to specific events, is unlikely to result in an efficient security system. This is all the more so, because urgent decisions are usually taken behind closed doors (to avoid divulging security vulnerabilities), which means that they are not subject to the same external scrutiny as are other areas of public policy.21 While operational issues require secrecy on security measures, even basic information is difficult to obtain on the level of government expenditure, the precise goals of the expenditure and effectiveness in achieving goals. This creates a barrier to impartial analysis and policy improvement over time. Secrecy places an additional onus on good internal processes. If the public cannot directly observe the security evidence and regulatory deliberations, it is necessary that the public has confidence that the unseen process is robust.
Where to from here?
This chapter presented several case studies. Together, they suggest five areas for policy attention.
First, precisely because national security is so important, poor policy carries large economic costs. Estimates of the economic impact of (overly blunt) data localisation laws, for example, are large because security of data is fundamental to the Australian economy today. Policies need to be designed carefully to meet national security concerns at lowest cost.
Second, national security regulations aim to improve the wellbeing of the Australian people in the same way as regulation in other areas. It should not ordinarily be necessary to pay businesses or citizens to comply with the law and it may be inefficient to do so. Future security regulation should clearly justify the provision of assistance, including how assistance provision enhances achievement of the security objective.
Third, there is relatively little divulgence of government spending devoted to national security objectives, nor the compliance costs that regulation imposes on Australian businesses and consumers. Consideration should be given to publication of aggregated non-defence expenditure on national security, perhaps as part of the annual budget papers.
21 In respect of transport, DIRD indicates that the Australian Government targets security measures at the areas of highest risks, and decisions reflect ‘informed policy advice and design’ and ‘domestic and international partnerships’ (DIRD 2017a) p. 1).
NATIONAL SECURITY MEASURES 65

While operational issues will necessarily require secrecy, over time better policy and recognition of trade-offs will flow from greater transparency on how tax dollars are being spent. This would complement recent initiatives by the Department of Prime Minister and Cabinet to publish a selection of real-time metrics of counter-terrorism effectiveness.
Fourth, national security policy can change quickly because of the need to respond to emerging threats. The policy area would benefit, from time to time, from a systemic review by an agency without active involvement in security policy, but with appropriate security clearance and access to understand thoroughly the costs, benefits and risks inherent in the system. While there have been many public reviews of policy proposals that have provided opportunity for views to be aired, it is less clear what risk assessment and cost-effectiveness heuristics are used in the initial formulation of proposals (that may go on to formal review) and how the information from reviews is ‘weighed’ up in formulating the Government’s final policy. Regular reviews that allow a public articulation of a systemic framework may act as a tool for good decision making in a hurry, or as future circumstances require, and foster public understanding and support for national security decisions.
Finally, security issues are a global problem that prompt disparate measures from different governments. Some of these measures, if undertaken independently, can create potentially adverse effects on trade and economic efficiency, and may erode the effectiveness of any one country’s security solutions. In some cases, most notably data retention laws, global consistency could help achieve security goals without damaging trade and innovation. In addition, some countries pursue their security goals more efficiently than others, providing lessons that can be widely diffused. The United States, for instance has introduced ‘Trusted Travel’ arrangements where pre-screening allows people to go through US Customs with negligible delays. Different countries have varying approaches to terrorism prevention (some, for example, promote engagement with communities and groups that can reduce the risk of someone becoming a terrorist). Given the relatively nascent developments and evaluations of prevention policies, this is an attractive area for sharing lessons. There is a growing awareness globally that there are ‘better’ (if not best) practices for responding to national security risks.
66 TRADE AND ASSISTANCE REVIEW 2016-17

4 Recent developments in industry assistance
Key points The wide range of new policy developments this year illustrates the diversity of industry
assistance: establishing new project financing vehicles; a mechanism to impose gas export controls; and expansion of tax concessions to small business.
There has been a move towards government provision of project finance as a form of industry assistance. The Australian Government has established a series of funds to make loans on concessional terms including the Northern Australia Infrastructure Facility (NAIF), the National Water Infrastructure Loan Facility and a new farm business concessional loan scheme.
A Defence Export Facility has also been established to provide export finance to Australian defence manufacturers; given the stated rationale is to fill a ‘market gap’ this would necessarily be on terms more favourable than available from commercial lenders. But the justification for assistance appears to be simply about a desire to sustain and grow an industry that has historically been an expensive failure in Australia.
Australia has relatively deep and liquid financial markets. The onus should be on proponents of taxpayer-funded financing of commercial projects to provide rigorous justification of the public interest and the gap in funding markets that necessitates this kind of support. Project selection is critical, but also fraught. Some projects serve private interests and would have gone ahead anyway, and some potential projects may produce very low (social) rates of return and should not go ahead.
The transformation of the East Coast gas market into an export industry has affected availability of gas to domestic commercial and industrial users. This concern has attracted government intervention in the form of the Australian Domestic Gas Security Mechanism to manage export demand. The Mechanism was not activated in 2018 following an agreement by LNG exporters to supply additional gas to the domestic market. The Mechanism appears designed to deal with medium-term market disruption.
In the long run, Australian gas users will be best served by development of new gas supplies in southern states, supported by state government approvals. Reservation of gas for domestic users is not a sound long-term policy: it would deter investment in new supply and also reduce the benefit to Australians of exporting gas.
Small business tax concessions have been the main contributor to the increase in the Commission’s estimates of total industry assistance this year through lower tax rates and more generous depreciation arrangements. These are treated as assistance because they give preferential treatment to some business and not others. If the measures persist over time, they will skew growth and investment artificially. However, was the lower tax rate also to be enacted for large companies, then this component would not be treated as assistance in future Reviews.
RECENT DEVELOPMENTS 67
The Trade & Assistance Review selectively reports on recent developments in industry assistance, particularly with a focus on announcements of prospective assistance that in time may be included in the Commissions’ measured assistance (chapter 2). Notable developments in industry assistance this year include:
the $5 billion Northern Australia Infrastructure Facility
the $4 billion Defence Export Strategy, including $3.8 billion for a Defence Export Facility to be administered by the Export Finance and Insurance Corporation
the $2 billion National Water Infrastructure Loan Facility and a new $2 billion farm business concessional loan scheme to be delivered through the Regional Investment Corporation
the Australian Domestic Gas Security Mechanism and Gas Acceleration Program
lower taxes for small business, totalling around $2.75 billion in 2016-17 (including lower tax rates, offsets and accelerated depreciation) and projected to grow
recommendations by a Parliamentary Committee to expand assistance for the film and television industry.
4.1 The Northern Australia Infrastructure Facility
The Northern Australia Infrastructure Facility (NAIF) Act 2016 was passed by the Commonwealth Parliament on 3 May 2016. As discussed in the 2015-16 Trade and Assistance Review, the NAIF offers up to $5 billion over five years in concessional finance for the construction of Northern Australian economic infrastructure. Decision making on whether to providing funding in support of a particular project is made by the NAIF Board under the condition that funding would not be provided were a state or territory government to recommend that the project not go ahead, and subject to a veto by the relevant Commonwealth minister.
The NAIF Board has been given an investment mandate in the form of a ministerial direction. The investment mandate requires that the Board, in making investment decisions, will only provide financial assistance if it is satisfied that:
the project would not otherwise have received sufficient financing from other financiers
there is an expectation that the Commonwealth will be repaid, or that the investment can be refinanced
that any return will cover at least the Facility’s administrative costs and the Commonwealth’s cost of borrowing.
Within these parameters, the Board is able to agree a level of concessionality sufficient for the project to proceed. Compared with commercial financiers, this may include longer terms, lower interest rates and fee structures, deferred repayments and a lower ranking in the event of liquidation.
68 TRADE AND ASSISTANCE REVIEW 2016-17

The Board has developed a Risk Appetite Statement as a guide to its investment decisions, which has not been made public. The investment mandate provides that the Board may have a high tolerance for risks unique to investing in Northern Australian infrastructure, such as distance, remoteness and climate.
There has been significant interest in the governance of the NAIF. On 14 June 2017, the Senate referred an inquiry into the governance and operation of the NAIF to the Senate Economics References Committee for inquiry and report by 7 December 2017 (subsequently extended to 24 April 2018). The Committee is considering the adequacy and transparency of NAIF’s governance framework, including project assessment, risk appetite, public interest tests used and a range of other matters.
The NAIF has ambitious early targets to fund 3 to 5 projects in 2017-18 worth up to $1 billion (NAIF 2017, p. 14); a risk here is whether suitable projects can be identified and scrutinised so rapidly. As at February 2018 NAIF had received 194 project enquiries across a range of sectors — energy (23 per cent), transport (22 per cent), resources (18 per cent), agriculture and manufacturing (16 per cent), and other (21 per cent) (NAIF 2018b). Of these enquiries, 82 remain active including 17 projects in due diligence and execution phases. It has approved one project so far, agreeing to provide $16.8 million towards development of the $125 million Onslow Marine Support Base (box 4.1).
Box 4.1 Onslow Marine Support Base, Western Australia titleOn 29 September 2017, the NAIF Board offered a $16.8 million loan to Onslow Marine Support Base Pty Ltd to develop a marine supply facility at Beadon Creek, Western Australia. The marine supply facility will provide supply and support services for onshore and offshore businesses such as logistics, fuel suppliers, waste management, and construction and maintenance companies in the Carnarvon Basin (NAIF 2018a).
The NAIF loan is financing Stage 2 (capital dredging). The privately funded stage one of the project involved the construction of a berth pocket in Beadon Creek to form a land-based wharf facility. The Western Australian Government assisted the project by providing improved infrastructure such as roads, services and a laydown area (Saffioti 2017). The CEO of the NAIF reported that there is a forecasted direct economic benefit of over $100 million and more than 220 job opportunities over the 10-year life of NAIF’s loan (Walker 2018).
4.2 The Defence Export Strategy
In January 2018, the Australian Government released a Defence Export Strategy (Department of Defence 2018). The stated intent of the strategy is to strengthen the partnership between the Australian Government and defence manufacturing industry to pursue export opportunities, sustain industrial capabilities through peaks and troughs of Australian Government demand, support innovation and productivity in the industry and maintain Australian Defence Force capability.
RECENT DEVELOPMENTS 69

The Strategy includes:
$20 million in additional annual funding from 2018-19 including to establish the Australian Defence Export Office, develop strategic multi-year export campaigns ($6.3 million), expand the existing Global Supply Chain program ($3.2 million), and grants to help build the capability of SMEs to compete internationally ($4.1 million).
$3.8 billion for a Defence Export Facility administered by the Export Finance and Insurance Corporation (Efic).
The Strategy estimated that Australia’s current defence exports were between $1.5 billion and $2.5 billion, with about half being to the United States, the United Kingdom, Canada and New Zealand (box 4.2).
Box 4.2 Australian defence exportsA goal of the Defence Export Strategy is for Australia to become a top ten global exporter of defence equipment.
While there are no definitive statistics on Australia’s defence exports, the Department of Defence estimates that Australia’s defence industry is currently exporting somewhere between $1.5 billion and $2.5 billion (DoD 2018, p. 34).
The lower estimate is based on data from export permits for 2016. Such permits are required for exports of certain defence products under Australia’s Defence Export Controls. There has been consistent growth in export permits for military goods, with the value of permits issued increasing by an average 44 per cent annually over between 2013 and 2016. Over the three years to 2016, nearly half of the permits issued were for export to the United States, the United Kingdom, Canada and New Zealand. The Indo-Pacific region was Australia’s second largest destination market, with over a quarter of the value of the permits.
The Department of Defence also noted that there were around 2700 businesses in Australia’s defence industrial base. Research undertaken to support the development of the Defence Industrial Capability Plan revealed that those businesses reported a total of $7.65 billion dollars of exports in 2013-14. Only a fraction of these exports are of defence materiel, but on the basis of this information, the Department of Defence estimated that defence exports might amount to as much as $2.5 billion
The rationale given for the finance facility is a potential ‘market gap’ in private finance for defence exports (DoD 2018, p. 71). The policy will expand Efic’s balance sheet with a dedicated mechanism for defence export finance to be written on its ‘National Interest Account’, meaning that risks will be borne by the Commonwealth. The National Interest Account allows Efic to undertake transactions that would normally be too large or have risks that would be imprudent to accept on their Commercial Account. The Australian Government expects that National Interest Account transactions are normally on a commercial basis (Ciobo 2017).
70 TRADE AND ASSISTANCE REVIEW 2016-17

4.3 A new farm concessional loan scheme and water infrastructure facility
In May 2017, the Australian Government announced that it would establish a Regional Investment Corporation (RIC) to deliver up to $2 billion in farm business concessional loans and the $2 billion National Water Infrastructure Loan Facility (Turnbull and Joyce 2017) The RIC will be located in Orange (Joyce 2017). Legislation to establish the RIC was passed in February 2018, making it a Commonwealth corporate entity with an independent board. The May 2017 Budget earmarked $28.5 million for the RIC’s administrative establishment (Australian Government 2017).
In establishing the RIC, the Australian Government aimed to deliver concessional loans in a nationally consistent manner and to identify and implement efficiencies to streamline delivery of loans. The RIC replaces the previous arrangement by which state and territory governments, and their respective delivery agencies, separately delivered loan schemes on behalf of the Commonwealth. The Regional Investment Corporation Act 2018 provides that the RIC will determine the terms and conditions on which farm business loans are provided within classes of loans established by Ministerial direction. The RIC will also advise the Commonwealth Minister about water infrastructure projects.
The design of the new farm concessional loan scheme
The design of the scheme has not yet been announced. The intent is to ‘support the long-term strength, resilience and profitability of Australian farms’ (DAWG 2017c, p. 1). Loans are to be focused on farm businesses in financial need that are considered viable in the long term. A discussion paper was circulated in October 2017 seeking public feedback on key loan settings including what characterises ‘financial need’ and ‘viability’, what evidence could be used to demonstrate eligibility, and what should be considered as eligible loan uses. The discussion paper suggests that eligibility may be broader than the existing concessional loan schemes (box 4.3).
[T]he new scheme will now help farm businesses build and maintain diversity in the markets they supply and take advantage of new and emerging opportunities across Australia and overseas. This means loans will be targeted to farm businesses that mainly supply, or intend to supply, products into supply chains that are interstate or overseas. This is in addition to loans continuing to be available to help farm businesses prepare for, manage through, and recover from periods of drought. (DAWG 2017c, p. 1)
Farmers are in the best position to decide what loan uses are likely to be most beneficial for their individual business. We anticipate that, where possible, loans will be available for a broad range of purposes under the RIC’s new scheme to help farm businesses improve their strength, resilience and profitability. (DAWG 2017c, p. 3)
RECENT DEVELOPMENTS 71

Box 4.3 Current and previous farm concessional loan schemesThere have been a number of changes to farm finance assistance over the past decade. The long-running Exceptional Circumstances Interest Rate Subsidy (ECIRS) provided business support to farms that were considered to be viable in the long term, but were in financial difficulties due to an exceptional event. This program was reviewed a number of times, including by the (PC 2009). Those reviews found that the scheme, in providing concessional interest rates, created a number of perverse incentives and unintended outcomes that made it ineffective in achieving its stated objective of building farmers’ self-reliance to manage climate variability and preparedness for droughts. These included:
there was no evidence that farmers’ access to capital differed significantly from that faced by other small businesses and, in particular, given the average recipient had an equity level of over 80 per cent of asset value they would have been able to access commercial carry-on finance in the event of a drought
it provided a windfall gain to farms receiving the subsidy and an unjustifiable competitive advantage to recipient farmers compared with non-recipients
it created an incentive to build debt or not reduce debt
the value of the subsidy may have been capitalised into farm prices creating a barrier to entry of new farmers who wish to purchase land
it may have created a disincentive to diversify income sources off-farm.
For these reasons, the ECIRS was closed on 30 June 2012. In July 2014, a Farm Household Allowance was introduced to provide support to households in financial hardship. It provides support normally at the standard Newstart rate, but with an asset test designed to suit farming households and a maximum eligibility of three years.
Since 2013, a number of concessional loan schemes have been introduced. Loans are available for up to $1 million for a maximum of 10 years at a variable concessional interest rate, currently 3.09 per cent (as at 1 February 2018). There are currently loans available under three schemes:
Business Improvement Concessional loans to assist with debt restructuring for farming families that have exhausted access to the Farm Household Allowance (from 1 July 2017).
Dairy Recovery Concessional Loans for viable dairy farm businesses affected by the 2016 reductions in farm gate milk prices.
Drought Assistance Concessional Loans for viable farms that are experiencing financial difficulty due to the effects of drought.
At 30 June 2017, the balance of these concessional loans was $696.5 million (DAWG 2017a, p. 155). There has been no public review of the effectiveness of these schemes.
National Water Infrastructure Loan Facility
The $2 billion National Water Infrastructure Loan Facility (NWILF) will provide concessional loans to co-fund the construction of water infrastructure to support irrigated agriculture and regional industry. This may include dams, weirs, pipelines, aquifer recharge, water treatment and reuse.22
22 Unlike the NAIF, which can also lend to water infrastructure, project decisions made under the NWILF and NWIDF include National Water Initiative compliance within their eligibility criteria.
72 TRADE AND ASSISTANCE REVIEW 2016-17
The stated investment priorities are (DAWG 2017b, p. 3) for water infrastructure that, if developed, will provide affordable and secure water supplies to support the growth of regional economies and that:
is economically viable over its proposed operational life
is not for urban or potable use
has at least a 51 per cent funding commitment approved by the relevant state government.
Preference is to be given to water storage infrastructure that delivers benefits to regional communities, rather than individuals or groups. Decisions are to be taken by the Commonwealth Minister for Infrastructure on advice from their department, an independent panel and the RIC.
Separately, a $500 million National Water Infrastructure Development Fund (NWIDF) has been established to provide funding for feasibility studies and direct capital contributions. Decisions are to be taken by the Commonwealth Minister for Infrastructure on advice from their department.
4.4 Domestic gas security and assistance
On 20 June 2017, the Australian Government announced that it would implement the Australian Domestic Gas Security Mechanism (ADGSM) (DIIR 2018c). The objective of the ADGSM is to ensure there is a sufficient supply of natural gas to meet the forecast needs of Australian consumers. The ADGSM gives the Government the power, when there is a forecast shortfall in domestic supply, to require LNG producers that are drawing gas from the domestic market, to limit exports or find new offsetting sources of gas (Department of Industry 2018a). The ADGSM will sunset on 1 January 2023.
In reaching a decision as to whether a period has a forecast shortfall in domestic supply, the Minister can take advice from relevant gas market agencies. The Australian Energy Market Operator and the Australian Competition and Consumer Commission jointly forecast that the East Coast gas market is facing an expected shortfall of 54 petajoules in 2018 and 48 petajoules in 2019, while also noting the possibility that the shortfall could prove to be larger in both years (ACCC 2017).
Rather than activate the Mechanism, the Australian Government reached a Heads of Agreement with the LNG producers on 3 October 2017. In the Heads of Agreement, the LNG producers agreed that, to ensure the security of supply of gas to Australian users, they would offer sufficient gas to the domestic market on reasonable terms to meet the forecast supply shortfall in 2018 and 2019. This will assist domestic manufacturers and electricity generators. The LNG exporters’ compliance with these requirements will be monitored by reporting to the ACCC on sales, offers to sell, and bids declined.
RECENT DEVELOPMENTS 73
The Australian Government has also committed $26 million to a Gas Acceleration Program (GAP) intended to accelerate the development of known onshore Australian gas resources in order to improve supplies to domestic gas consumers (DIIR 2018a). The GAP grant guidelines favour projects with the greatest likelihood of securing new and significant volumes of gas for domestic gas consumers within 36 months (30 June 2020). (DIIR 2018b). Successful applicants were announced on 28 March 2018. The four new projects will supply 12.4 petajoules of gas to the East Coast market by 30 June 2020 and 27.6 petajoules over five years (DIIR 2018a). Gas Acceleration Program funding will be considered as assistance to the gas extraction industry in future Trade and Assistance Reviews.
4.5 Lower taxes for small business
In May 2016, the Australian Government announced a policy of reducing the company tax rate on all companies to 25 per cent (from the current 30 per cent) by 2026-27 (Morrison 2016).
However, as amended and passed by the Parliament, the law provides for a reduction for small and medium sized corporations only. Over a number of years, the scope of corporations eligible for the lower tax rate will expand and the applicable tax rate will reduce (table 4.1). Treasury estimated that the tax concession for small companies would benefit claimants by $250 million in the first year, rising to $1.6 billion in 2018-19.
Table 4.1 Small business company tax reductionsYear Turnover threshold Reduced rate applying
under the turnoverEstimated tax
expenditure $ million % $ million
2015-16 2 28.5 2502016-17 10 27.5 11002017-18 25 27.5 13002018-19 50 27.5 16002019-20 to 2023-24 50 27.5 n.a.2024-25 50 27.0 n.a.2025-26 50 26.0 n.a.2026-27 50 25.0 n.a.
Sources: ATO (2018) and Treasury (2018 Item B49).
In this form, the law provides a preferential pecuniary benefit to some business and not others, and this difference is included in measured assistance. Reductions for large companies above the turnover threshold have been drafted, but legislation has not been passed by Parliament. Were the general company tax rate to decline in line with the rate applying to small businesses then this would no longer be treated as assistance.
74 TRADE AND ASSISTANCE REVIEW 2016-17

Unincorporated small businesses also received a tax reduction via a non-refundable tax offset. In 2015-16, unincorporated businesses with turnover below $2 million were eligible for an 8 per cent discount on tax payable. For 2016-17, the turnover threshold was raised to $5 million. The discount will be progressively raised to 16 per cent in 2026-27. The benefit to claimants was estimated to be $550 million in 2016-17, $750 million in 2017-18 and $800 million in each of 2018-19 to 2020-21 (Treasury 2018 Item B59).
4.6 Film and television industry assistance
In December 2017, the House of Representatives Standing Committee on Communications and the Arts’ Inquiry into the Australian Film and Television Industry recommended more generous tax offsets for screen production, estimated to cost around an additional $35 million per year for the next decade (HRSCCA 2017). The Committee also made two recommendations in relation to Australian content quotas that would reduce competition from non-Australian content. First, the Committee recommended a change in the regulatory definition of ‘first release’ that would act to limit New Zealand programs currently qualifying as quota-compliant. Second, the Committee also recommended local content regulations be extended to subscription video-on-demand services. The Australian Government is yet to respond.
The Australian film and television industry currently receives assistance via numerous arrangements, including:
three tax offsets — production, location, and post, digital and visual effects — ranging from 16.5 to 40 per cent of qualifying expenditure ($342 million in 2016-17)
Screen Australia support for Australian screen content ($84 million in 2016-17)
Australian Government payments to international producers to make movies in Australia (over $100 million since 2011-12 for six movies)
State government assistance to local screen productions as well as support for international producers to make movies locally (such as, Dora the Explorer in Queensland and the Great Gatsby in NSW)
free to air television quotas for Australian content (such as not less than 55 per cent of programming is Australian, sub-quotas for documentary, drama and children’s content, and minimum production expenditure per hour for drama)
international co-production treaties between Australia and 12 other countries allowing projects to qualify for ‘Australian’ treatment, such as access to tax offsets and contributing to content quotas.
RECENT DEVELOPMENTS 75
5 Trade policy developments
Key points The liberal rules-based global trading system that developed in the second half of the
Twentieth Century has served Australia’s interests well. It provided Australian businesses with predictable treatment and low costs of doing business abroad that supported investment in Australian industry and high-wage jobs.
The system is facing challenges. The Doha round of WTO negotiations is effectively finished as a single undertaking and the 11th biennial WTO Ministerial Conference (Buenos Aires, December 2017) passed without agreement on any substantial matter. The USA had been a key driver of multilateral trade agreements over many decades but, as reported in chapter 1, has recently taken a more protectionist posture.
The greatest benefits from trade liberalisation come about through multilateral agreements. With WTO negotiations unable to advance, the best prospect for further liberalisation is likely to be through plurilateral or ‘mega-regional’ agreements, which may expand over time.
The economic benefits of bilateral trade agreements are more questionable. The ‘noodle bowl’ of agreements, each with their own detailed conditions such as Rules-of-Origin, creates complexity for businesses and compliance costs to access trade preferences. Some Australian importers find it easier to pay the general tariff rate than comply with these legalistic requirements. While they sometimes produce economic benefits, including as awkwardly-placed stepping stones to broader trade agreements, their formulation and impacts are often not transparently reported.
Two developments in Australian trade policy this year were:
– the signing of the revised Trans-Pacific Partnership (TPP-11)
– negotiation and signing of a bilateral trade agreement with Peru.
Trade policy does not always require ‘give and take’ in market access negotiations. Unilateral reductions in trade barriers (chapter 1) would send a strong signal of Australia’s commitment to a liberal global trading system.
This chapter reports on trade policy developments since the 2015-16 Trade & Assistance Review (published in July 2017).
It is widely acknowledged that the benefits of trade liberalisation are greatest when undertaken on a multilateral, ‘most favoured nation’ basis. However, multilateral negotiations at the WTO have proven increasingly difficult and it is clear that a comprehensive outcome to the Doha Round will not be achieved as originally formulated. The Commission considers there is value in Australia (and other like-minded countries) continuing to intensify trade liberalisation efforts, with an emphasis on large-scale plurilateral agreements, covering one or many trade topics (PC 2017).
TRADE POLICY DEVELOPMENTS 77

In the past 12 months Australia has followed this course (section 5.1). Following the withdrawal of the USA from the Trans-Pacific Partnership Agreement (TPP), Australia worked with the remaining 10 partners to sign the Comprehensive and Progressive Agreement for Trans-Pacific Partnership (TPP-11) on 23 January 2018. Plurilateral negotiations provide the greatest prospect to reduce trade costs today and, over time, there may be scope to broaden their geographic coverage.
However, Australia also continues to expend considerable effort in negotiating bilateral trade agreements (section 5.2). The Commission has previously noted that bilateral agreements, with their associated ‘Rules-of-Origin’ prescriptions, create administrative costs for businesses seeking relief from tariffs that reduce their beneficial effects. With bilateral agreements now in place with Australia’s largest trade partners, future bilateral agreements would cover smaller portions of Australian trade and would also add to the ‘noodle bowl’ of administrative burden for Australian businesses seeking to conform to the detail of each agreement. The comparative benefits and costs of each bilateral and plurilateral agreement require case-by-case transparent prior assessment. While some see bilateral agreements as stepping stones towards multilateral trade liberalisation (Griswold 2003), others see them as stumbling blocks to negotiations (Bhagwati 2008). A proliferation of small bilateral agreements, to the extent that they were inconsistent with each other, would not be the surest path to freer trade and greater market access for Australian exporters. Their economic benefits may be marginal.
5.1 Multilateral and plurilateral-agreements
The World Trade Organisation (WTO) is facing challenges. It has more than 160 members at very different levels of economic development and with different policy priorities. The Doha Round that commenced in November 2001 will not be achieved in the form originally formulated as a single undertaking. DFAT concluded after the 10th Ministerial Conference in December 2015:
As such the Round is effectively over. Australia has argued that new approaches are necessary if we are to achieve meaningful outcomes on the outstanding Doha issues (DFAT 2016)
Since that time, the 11th Ministerial Conference in December 2017 discussed several topics, but was unable to reach any substantive agreements. Rather, programs of ongoing work and engagement were agreed in relation to fisheries subsidies negotiations, electronic commerce, small economies and the treatment of non-violation complaints under the TRIPS agreement. Australia’s Trade Minister reaffirmed Australia’s support for the WTO and Australia’s multilateral liberalisation priorities, such as addressing agriculture support and regulation of services (box 5.1).
The absence of substantial conference outcomes was a disappointing step back from successes at the 9th and 10th Ministerial Conferences. In particular:
A centrepiece of the 10th Ministerial Conference was a Ministerial Decision on Export Competition, which included a commitment to eliminate subsidies for farm exports.
78 TRADE AND ASSISTANCE REVIEW 2016-17

Under the decision, developed country members have committed to remove export subsidies immediately, except for a handful of agriculture products, and developing countries would do so by 2018.
The 9th Ministerial Conference reached an Agreement on Trade Facilitation (ATF) aimed at simplification and harmonisation of international trade procedures to assist the movement of goods. The Agreement reduces red tape by streamlining customs processes and improving transparency about rules affecting international trade, making it easier for businesses to enter overseas markets.
Box 5.1 Statement by Australia’s Trade Minister at the WTO’s 11th Ministerial Conference, 13 December 2017
The Australian Government’s articulation of trade policy remains largely consistent with the general principles underlying the long accepted liberal rules-based global trading system. For instance, the Trade Minister has noted:
The WTO is the bedrock of the global trading system that has helped deliver prosperity and trade growth since its inception. It has helped lift millions out of poverty and improve the living standards for many millions more. It creates opportunities for business and, of course, it creates jobs.
In recent years the WTO has shown that international agreements with real economic impact are possible – such as the Trade Facilitation Agreement at MC9 and the outcome on agricultural export subsidies at MC10.
Agriculture is a major priority for Australia. There is a clear need for us to address problems with the existing rules on domestic support and to reduce the trade-distorting impact of some of these domestic support policies.
On services, Australia is advocating for improvements in the area of domestic regulation – improvements that would result in real world benefits for all service suppliers.
We need to make sure that WTO rules address the opportunities and challenges of the 21st century. Today’s world is dominated by digital innovation and we should be thinking about how the trading system can support businesses trading in a digital environment.
In addition, we must all take responsibility for ensuring the benefits of international trade are shared across the entire WTO membership, particularly those on lower income levels.
Australia is committed to helping developing countries, particularly least developed countries, better integrate into the multilateral trading system.
Source: Selected extracts from Ciobo (2017).
Against this background, the Australian Government set out in its 2017 Foreign Policy White Paper the importance of advancing regional trade and investment integration (Australian Government 2017). This includes a long-term goal that brings major Indo-Pacific economies under a single set of trade and investment rules, with the RCEP and TPP-11 trade agreement seen as potential steps towards that goal (figure 5.1). It noted Australia can contribute by ensuring our bilateral and regional FTAs are broadly compatible with each other and over time link as many economies as possible.
TRADE POLICY DEVELOPMENTS 79

Figure 5.1 Current and prospective FTA groupingsa
a APEC members are discussing a future free trade area of the Asia-Pacific.
Source: Australian Government (2017 Figure 3).
Signing of the Trans-Pacific Partnership (TPP-11) Agreement
The TPP-11 is a regional trade agreement between the governments of Australia, Brunei Darussalam, Canada, Chile, Japan, Malaysia, Mexico, New Zealand, Peru, Singapore, and Vietnam. Following withdrawal by the USA from the original 12-party TPP, the agreement was renegotiated and the remaining countries signed the Comprehensive and Progressive Agreement for Trans-Pacific Partnership (TPP-11). The text of the TPP-11 is similar to the original TPP but includes a list of suspended clauses that will not have application under international law.
80 TRADE AND ASSISTANCE REVIEW 2016-17

Australia’s Trade Minister said the key features of the TPP-11 included:
new reductions in Japan’s tariffs on beef (where Australian exports are worth $2.1 billion in 2016-17)
new access for dairy products into Japan, Canada and Mexico, including the elimination of a range of cheese tariffs into Japan covering over $100 million of trade
new access for sugar into the Japanese, Canadian and Mexican markets
tariff reductions and new market access for cereals and grains into Japan, including new access for rice products
elimination of all tariffs on sheep meat, cotton and wool
elimination of tariffs on seafood, horticulture and wine
elimination of all tariffs on manufactured goods
guaranteed levels of access for services
liberalised and improved regulatory regimes for investment, notably in mining and resource industries, telecommunications and financial services (Ciobo 2018).
Australia agreed to remove tariffs on imports from TPP-11 members, with 93 per cent of tariff lines set to zero at entry into force of the agreement and phased reduction of almost all remaining tariffs over the following three to four years. Foreign investment screening thresholds in non-sensitive sectors will also be increased.
Each signatory is now working towards securing the entry into force of the Agreement as soon as practicable. In Australia, the Agreement and a National Interest Analysis will be reviewed by the Joint Standing Committee on Treaties.
Regional Comprehensive Economic Partnership negotiations continue
The Regional Comprehensive Economic Partnership (RCEP) is an ASEAN-centred proposal for a regional free trade area. It would initially include the ten ASEAN member states and those countries which have existing FTAs with ASEAN — Australia, China, India, Japan, Republic of Korea and New Zealand. The 16 RCEP participating countries account for almost half of the world’s population, almost 30 per cent of global GDP and over a quarter of world exports.
RCEP negotiations commenced in 2012. Trade Ministers met to discuss progress in March 2018 following the 21st Round of Negotiations amongst officials in February 2018. Ministers reaffirmed their commitment to intensify efforts through 2018 and noted progress on the draft text (DFAT 2018a) However, Ministers also recognised the divergence in the levels of ambition in some areas, such as transition periods and capacity building assistance.
TRADE POLICY DEVELOPMENTS 81
Australia’s accession bid to the Government Procurement Agreement
Australia has been negotiating its accession with the WTO Committee on Government Procurement since September 2015, with its bid progressively revised in response to member concerns. The Government Procurement Agreement (GPA) is a WTO plurilateral agreement that opens government procurement markets between its members.23 The Agreement’s main principles are transparency and non-discrimination. It requires GPA members to provide other members’ suppliers conditions ‘no less favourable’ than domestic suppliers. In addition, the GPA provides for domestic review procedures to enable aggrieved firms to seek a review of procurement decisions.
When the Committee met in June 2017 it noted that all members considered Australia’s bid at that time to be strong (WTO 2017, p. 6), but some expressed outstanding concerns about the coverage of sub-national government entities (on the proposed list of entities whose procurements would be open for competition), preferences to benefit small- and medium-size enterprises (SMEs) and high thresholds (minimum values of contracts whereby GPA provisions would apply).
Australia presented its final bid to the Committee on 7 March 2018. A clear majority of Committee members signalled their readiness in-principle to accept the market access offer (WTO 2018a). The Committee will consider the bid further when it next meets in June 2018.
5.2 Bilateral and regional agreementsAustralia is party to 10 bilateral and 2 regional preference agreements (figure 5.2). The most recent, signed with Peru in February 2018, was completed quickly as an adjunct to the TPP that both parties had been negotiating. Negotiations on the Pacific Agreement on Closer Economic Relations (PACER) Plus — between Australia, New Zealand, the Cook Islands, Kiribati, Nauru, Niue, Samoa, Solomon Islands, Tonga, Tuvalu and Vanuatu — commenced in 2009 and concluded in 2017.
Australia is currently in negotiation (or preparation) on five other agreements (table 5.1). Australia is undertaking scoping of an EU free trade agreement. The Pacific Alliance proposal involves countries with which Australia already has bilateral and multiparty agreements, which DFAT considered conducive to quick settlement of the new agreement:
An FTA would complement and support our goal of capturing the benefits of the TPP, and strengthen our economic relationship with Latin America. A Pacific Alliance FTA could be negotiated relatively quickly, based on our shared negotiating history with three of the four Pacific Alliance members (Chile, Mexico and Peru) in the TPP. It is not unusual for Australia to pursue multiple agreements with the same FTA partners: having multiple processes supports our goal of opening new trade and investment opportunities for Australia. (DFAT 2018b)
23 The Government Procurement Agreement currently has 19 parties comprising 47 WTO members. Another 31 WTO members participate in the GPA Committee as observers, of which 10 are currently seeking accession to the GPA (WTO 2018b).
82 TRADE AND ASSISTANCE REVIEW 2016-17
Figure 5.2 Australia’s bilateral and regional trade agreements
The Commission’s research report into Bilateral and Regional Trade Agreements (PC 2010) noted that they have brought benefits for some Australia businesses, particularly goods exporters. For example, some agricultural industries have received greater market access. On the other hand, they are costly to negotiate, are complex and place an administrative burden on businesses seeking to use them. Another concern is that they may be difficult to extend to large-scale plurilateral or multilateral agreements in the future where there is inconsistency between provisions in different agreements. In some cases, they also include clauses (such as intellectual property law changes driven by the AUSFTA, or investor-state dispute settlement procedures) that may not produce clear benefits for Australians, but carry significant risk.
Table 5.1 Bilateral and regional negotiations in progress
Status Share of Australian
merchandise exports
Share of merchandis
e Imports into
Share of Australian
service
Share of Australian
service
TRADE POLICY DEVELOPMENTS 83

Table 5.1 Bilateral and regional negotiations in progress
Australia exports imports
Per cent Per cent Per cent Per cent
Australia-Hong Kong Free Trade Agreement
Launched 16 May 2017, 4.4 0.3 3.5 3.5
European Union Agreed in November 2015 to start the process. Joint scoping exercise completed and submissions called.
6.5 17.6 14.2 23.7
Australia-India Comprehensive Economic Partnership Agreement
Launched May 2011. 9th Round September 2015.
5.2 1.6 5.0 2.4
Indonesia-Australia Comprehensive Economic Partnership Agreement
Launched in 2010. 9th Round October 2017.
2.3 1.6 2.0 4.3
Pacific Alliance Free Trade Agreement (Australia, Chile, Columbia, Mexico and Peru)
Launched 30 June 2017. 0.3 1.3 1.0 0.8
Sources: ABS (2017) and DFAT (2018c).
Overall, the Commission concluded in 2010 that the economic benefits of bilateral trade agreements have generally been oversold and the risks have been understated. The Commission recommended that agreements should be reached only when they provide outcomes that are in Australia’s interest and they are the most cost-effective way of achieving those outcomes. The Commission further recommended that there should be more transparent and rigorous assessments of such agreements. This should encompass two elements. To ensure agreements are in the Australia’s interest, before negotiations commence, modelling should include realistic scenarios and be overseen by an independent body. After negotiations have concluded and prior to signing of the agreement, a full and public assessment should be undertaken covering all of the actual negotiated provisions. As with all areas of policy, trade agreements need to be considered on a case-by-case basis, and the balance of benefits and costs for future agreements may be different, for example because they cover a smaller share of Australian trade.
84 TRADE AND ASSISTANCE REVIEW 2016-17

A Detailed estimates of Australian Government assistance to industry
Chapter 2 provides an overview of the Commission’s estimates of Australian Government assistance to industry. This appendix provides supporting details of those estimates for the period 2011-12 to 2016-17.
Tables A.1 to A.3 provide estimates of net tariff assistance, budgetary assistance and net combined assistance by industry grouping. Tables A.4 to A.7 provide estimates of output tariff assistance, input tariff penalties, budgetary outlays and tax concessions by industry grouping. Tables A.8 and A.9 provide estimates of the nominal rate of combined assistance on outputs and the nominal rate of combined assistance on materials, respectively.
The budgetary assistance estimates are derived primarily from actual expenditures shown in departmental and agency annual reports, and the Australian Treasury’s Tax Expenditures Statement. Industry and sectoral disaggregations are based primarily on supplementary information provided by relevant departments or agencies.
Estimates prior to 2016-17 may differ from those originally published, due to revisions.
Further information on the assistance estimation methodology, program coverage (including new programs), industry allocation and implementation of the current input-output series is provided in a (forthcoming) Methodological Annex to this Review.
Tables in this appendix are also available on the Commission’s website (http://www.pc.gov.au/research/recurring/trade-assistance).
DETAILED ESTIMATES 85

Table A.1 Net tariff assistance by industry grouping, 2011-12 to 2016-17a
$ million (nominal)
Industry grouping 2011-12 2012-13 2013-14 2014-15 2015-16 2016-17
Primary production 228.6 268.4 212.6 226.2 238.0 290.8Horticulture and fruit growing 93.2 122.6 101.1 106.3 123.3 167.6Sheep, beef cattle and grain farming 161.3 172.7 155.3 168.6 163.2 184.1Other crop growing -3.7 -4.0 -4.0 -4.1 -4.8 -6.7Dairy cattle farming -7.0 -11.5 -12.9 -13.9 -12.1 -12.4Other livestock farming -15.4 -13.7 -13.7 -16.6 -18.7 -25.2Aquaculture and fishing -4.8 -6.3 -5.9 -6.5 -7.3 -8.2Forestry and logging 16.1 14.8 12.9 13.5 15.7 17.3Primary production support services -11.1 -6.3 -20.2 -21.1 -21.3 -25.6Unallocated primary productionb – – – – – – Mining -234.9 -257.2 -284.2 -295.9 -304.1 -307.8Manufacturing 5052.5 5019.3 4671.3 4722.6 4643.6 4649.1Food, beverages and tobacco 1273.5 1292.2 1314.5 1317.7 1303.1 1376.4Textiles, leather, clothing and footwear 111.9 109.4 111.3 100.2 84.1 82.1Wood and paper products 545.1 533.3 542.3 569.3 573.6 559.5Printing and recorded media 77.1 75.4 76.7 80.8 81.8 79.8Petroleum, coal, chemical and rubber 747.8 636.0 506.8 490.9 483.4 486.3Non-metallic mineral products 258.6 253.0 257.3 270.4 272.7 265.9Metal and fabricated metal products 903.5 1127.6 890.1 911.8 877.9 877.8Motor vehicles and parts 456.2 292.3 343.6 311.8 306.6 292.1Other transport equipment 168.2 204.7 131.1 178.7 176.3 167.8Machinery & equipment manufacturing 329.8 336.3 331.4 315.8 311.0 296.1Furniture and other manufacturing 180.9 159.1 166.3 175.2 173.1 165.2Unallocated manufacturingb – – – – – –
Services -3435.8 -3585.9 -3712.8 -3737.2 -3718.4 -3767.6Electricity, gas, water & waste services -65.2 -74.0 -73.3 -70.1 -68.2 -69.9Construction -1329.5 -1410.7 -1479.7 -1500.7 -1489.6 -1505.4Wholesale trade -229.7 -237.6 -236.2 -228.0 -226.7 -228.9Retail trade -138.3 -141.4 -141.9 -140.3 -142.3 -146.5Accommodation & food services -266.1 -275.1 -280.1 -292.6 -302.3 -293.4Transport, postal & warehousing -187.5 -196.7 -197.3 -202.3 -204.2 -203.5Information & telecommunications -71.8 -72.2 -73.3 -73.0 -71.7 -71.3Financial and insurance services -12.6 -13.2 -13.8 -14.6 -15.1 -16.0Property, professional & admin. -340.0 -356.2 -365.3 -372.5 -375.7 -406.1Public administration and safety -136.2 -140.4 -145.2 -140.9 -143.1 -144.9Education and training -43.6 -45.7 -47.9 -48.6 -49.4 -51.5Health care and social assistance -209.2 -220.7 -232.0 -228.8 -217.4 -228.5Arts and recreation services -68.1 -68.4 -72.9 -74.0 -75.0 -74.7Other services -338.0 -333.7 -353.8 -350.9 -337.6 -327.1Unallocated servicesb – – – – – – Unallocated otherb – – – – – – Total 1610.5 1444.7 886.9 915.6 859.1 864.6
– Nil. Figures may not add to totals due to rounding. a Tariff assistance estimates are derived using ABS Industry Gross Value Added and other supporting data. b Unallocated includes budgetary measures where details of beneficiaries are unknown. These categories are not applicable for tariff assistance. Source: Commission estimates.
86 TRADE AND ASSISTANCE REVIEW 2016-17

Table A.2 Budgetary assistance by industry grouping, 2011-12 to 2016-17$ million (nominal)
Industry grouping 2011-12 2012-13 2013-14 2014-15 2015-16 2016-17
Primary production 1553.1 1243.6 1300.8 1372.3 1374.3 1639.8Horticulture and fruit growing 136.3 130.3 131.5 126.0 146.1 175.1Sheep, beef cattle and grain farming 662.7 526.2 606.5 603.9 632.0 758.4Other crop growing 94.1 94.4 102.6 81.9 91.2 95.9Dairy cattle farming 78.0 51.5 60.9 74.4 77.4 65.5Other livestock farming 66.2 46.4 42.6 51.5 57.5 63.1Aquaculture and fishing 67.2 70.4 72.1 83.8 87.5 96.1Forestry and logging 72.3 46.6 26.9 27.6 27.8 34.4Primary production support services 21.9 27.1 29.5 27.2 28.0 36.7Unallocated primary productiona 354.3 250.6 228.1 296.1 226.7 314.7Mining 745.6 483.3 515.6 524.6 515.7 521.8Manufacturing 1851.5 1934.4 1836.9 1778.7 1680.9 1729.8Food, beverages and tobacco 108.5 126.7 184.5 173.0 149.0 134.7Textiles, leather, clothing and footwear 61.0 57.2 61.6 56.2 51.6 37.9Wood and paper products 17.3 29.0 22.0 19.6 17.3 30.2Printing and recorded media 16.3 45.7 45.4 52.0 59.7 73.4Petroleum, coal, chemical and rubber 279.2 334.4 333.9 315.7 236.6 238.8Non-metallic mineral products 16.7 23.7 34.1 26.4 24.3 26.5Metal and fabricated metal products 288.7 362.2 298.7 255.8 208.8 263.8Motor vehicles and parts 625.4 458.6 399.9 351.8 299.4 243.4Other transport equipment 22.0 24.3 22.3 30.7 42.5 36.2Machinery & equipment manufacturing 154.0 234.7 206.9 236.7 243.0 275.3Furniture and other manufacturing 32.3 34.7 29.8 23.0 22.4 31.9Unallocated manufacturinga 230.0 203.2 197.9 237.7 326.2 337.8Services 5083.0 4252.9 3965.0 4105.8 4227.5 5478.0Electricity, gas, water & waste services 1106.1 142.9 166.5 231.5 157.7 149.3Construction 210.6 197.6 157.6 131.7 113.0 329.0Wholesale trade 285.6 202.6 175.6 189.5 161.5 218.2Retail trade 136.2 128.8 112.0 120.7 112.1 186.0Accommodation & food services 67.7 70.8 76.9 82.2 69.0 125.4Transport, postal & warehousing 245.7 181.0 130.7 105.6 95.9 188.5Information & telecommunications 293.6 390.8 233.5 233.4 232.6 403.8Financial and insurance services 1036.4 834.8 919.9 947.7 1060.3 955.3Property, professional & admin. 859.1 1217.3 1098.6 1306.9 1309.2 1847.9Public administration and safety 15.9 16.6 13.7 18.2 20.1 29.5Education and training 32.7 35.1 27.8 32.4 28.5 46.7Health care and social assistance 184.4 183.8 194.2 197.2 187.4 244.9Arts and recreation services 362.0 413.5 446.6 328.6 495.6 515.4Other services 68.0 66.4 54.6 41.4 40.6 95.6Unallocated servicesa 179.0 170.8 156.8 138.9 144.1 142.4Unallocated othera 972.5 972.1 1160.6 700.1 1080.9 3134.1Total 10205.7 8886.3 8779.0 8481.5 8879.3 12503.5– Nil. Figures may not add to totals due to rounding. a Unallocated includes budgetary measures where details of beneficiaries are unknown.
Source: Commission estimates.
DETAILED ESTIMATES 87

Table A.3 Net combined assistance by industry grouping, 2011-12 to 2016-17a
$ million (nominal)Industry grouping 2011-12 2012-13 2013-14 2014-15 2015-16 2016-17
Primary production 1781.7 1512.0 1513.3 1598.5 1612.3 1930.6Horticulture and fruit growing 229.5 252.9 232.6 232.3 269.3 342.6Sheep, beef cattle and grain farming 824.0 699.0 761.8 772.5 795.3 942.5Other crop growing 90.4 90.5 98.5 77.7 86.4 89.1Dairy cattle farming 71.0 40.0 48.0 60.5 65.3 53.1Other livestock farming 50.8 32.7 28.9 34.9 38.9 37.9Aquaculture and fishing 62.3 64.1 66.2 77.2 80.2 87.9Forestry and logging 88.4 61.4 39.8 41.1 43.5 51.6Primary production support services 10.9 20.8 9.3 6.1 6.8 11.1Unallocated primary productionb 354.3 250.6 228.1 296.1 226.7 314.7Mining 510.7 226.2 231.4 228.7 211.6 214.1Manufacturing 6904.0 6953.7 6508.2 6501.2 6324.6 6378.9Food, beverages and tobacco 1382.0 1418.9 1498.9 1490.8 1452.1 1511.1Textiles, leather, clothing and footwear 172.8 166.6 172.9 156.4 135.7 120.0Wood and paper products 562.5 562.3 564.4 588.9 591.0 589.7Printing and recorded media 93.4 121.1 122.0 132.9 141.5 153.2Petroleum, coal, chemical and rubber 1027.0 970.4 840.7 806.6 720.1 725.1Non-metallic mineral products 275.3 276.7 291.4 296.7 296.9 292.4Metal and fabricated metal products 1192.2 1489.9 1188.8 1167.6 1086.7 1141.6Motor vehicles and parts 1081.7 750.9 743.5 663.6 606.0 535.4Other transport equipment 190.2 229.0 153.3 209.4 218.8 204.0Machinery & equipment manufacturing 483.8 571.1 538.3 552.5 554.0 571.5Furniture and other manufacturing 213.2 193.8 196.1 198.2 195.6 197.0Unallocated manufacturingb 230.0 203.2 197.9 237.7 326.2 337.8Services 1647.3 667.0 252.3 368.6 509.1 1710.4Electricity, gas, water & waste services 1040.9 68.9 93.2 161.4 89.5 79.4Construction -1118.9 -1213.1 -1322.1 -1369.0 -1376.6 -1176.4Wholesale trade 55.9 -35.1 -60.5 -38.5 -65.3 -10.7Retail trade -2.1 -12.6 -29.9 -19.7 -30.2 39.4Accommodation & food services -198.4 -204.3 -203.2 -210.4 -233.3 -167.9Transport, postal & warehousing 58.2 -15.6 -66.6 -96.7 -108.4 -15.1Information & telecommunications 221.8 318.7 160.2 160.4 160.9 332.4Financial and insurance services 1023.7 821.6 906.0 933.0 1045.2 939.4Property, professional & admin. 519.1 861.0 733.3 934.4 933.5 1441.9Public administration and safety -120.3 -123.8 -131.5 -122.8 -123.0 -115.4Education and training -10.9 -10.5 -20.1 -16.2 -21.0 -4.8Health care and social assistance -24.8 -36.9 -37.8 -31.6 -30.0 16.4Arts and recreation services 293.9 345.2 373.7 254.6 420.6 440.8Other services -270.0 -267.3 -299.2 -309.5 -296.9 -231.5Unallocated servicesb 179.0 170.8 156.8 138.9 144.1 142.4Unallocated otherb 972.5 972.1 1160.6 700.1 1080.9 3134.1Total 11816.2 10331.0 9665.9 9397.1 9738.4 13368.1
– Nil. Figures may not add to totals due to rounding. a Tariff assistance estimates are derived using ABS Industry Gross Value Added and other supporting data. b Unallocated includes budgetary measures where details of beneficiaries are unknown.
Source: Commission estimates.
88 TRADE AND ASSISTANCE REVIEW 2016-17
Table A.4 Output tariff assistance by industry grouping, 2011-12 to 2016-17a,b
$ million (nominal)Industry grouping 2011-12 2012-13 2013-14 2014-15 2015-16 2016-17Primary production 360.9 400.9 364.4 391.1 404.9 488.5Horticulture and fruit growing 103.6 133.4 109.8 115.3 132.9 179.8Sheep, beef cattle and grain farming 225.3 241.3 217.0 235.2 227.4 256.8Other crop growing 1.2 1.3 1.3 1.3 1.6 2.2Dairy cattle farming – – – – – – Other livestock farming – – – – – – Aquaculture and fishing 1.6 2.0 1.7 2.2 2.6 2.8Forestry and logging 18.2 16.7 14.5 15.2 17.7 19.5Primary production support services 11.0 6.2 20.0 21.7 22.8 27.4Unallocated primary productionb – – – – – – Mining 1.1 1.2 1.4 1.5 1.6 1.6Manufacturing 6833.2 6691.4 6359.3 6399.5 6279.9 6299.0Food, beverages and tobacco 1948.6 1974.1 2014.6 2022.4 1996.6 2108.6Textiles, leather, clothing and footwear 146.3 143.1 145.6 133.0 114.1 111.4Wood and paper products 656.8 642.5 653.4 685.4 690.1 673.2Printing and recorded media 106.7 104.4 106.2 111.4 112.1 109.4Petroleum, coal, chemical and rubber 908.0 776.8 648.9 624.4 613.3 617.0Non-metallic mineral products 312.0 305.2 310.4 325.6 327.8 319.8Metal and fabricated metal products 1095.0 1322.4 1073.2 1090.8 1045.9 1045.6Motor vehicles and parts 745.9 477.9 561.7 508.6 499.0 475.1Other transport equipment 234.3 285.2 182.7 247.7 243.0 231.4Machinery & equipment manufacturing 442.2 450.9 444.3 422.0 414.0 394.2Furniture and other manufacturing 237.4 208.8 218.3 228.2 223.9 213.5Unallocated manufacturingb – – – – – – Services 0.0 0.0 0.0 0.0 0.0 0.0 Electricity, gas, water & waste services – – – – – – Construction – – – – – – Wholesale trade – – – – – – Retail trade – – – – – – Accommodation & food services – – – – – – Transport, postal & warehousing – – – – – – Information & telecommunications – – – – – – Financial and insurance services – – – – – – Property, professional & admin. – – – – – – Public administration and safety – – – – – – Education and training – – – – – – Health care and social assistance – – – – – – Arts and recreation services – – – – – – Other services – – – – – – Unallocated servicesb – – – – – – Unallocated otherb – – – – – – Total 7195.3 7093.6 6725.0 6792.0 6686.3 6789.1– Nil. Figures may not add to totals due to rounding. a Tariff assistance estimates are derived using ABS Industry Gross Value Added and other supporting data. b Unallocated includes budgetary measures where details of beneficiaries are unknown. These categories are not applicable for tariff assistance.
Source: Commission estimates.
DETAILED ESTIMATES 89

Table A.5 Input tariff penalty by industry grouping, 2011-12 to 2016-17a
$ million (nominal)
Industry grouping 2011-12 2012-13 2013-14 2014-15 2015-16 2016-17
Primary production -132.3 -132.5 -151.8 -164.9 -166.9 -197.7Horticulture and fruit growing -10.5 -10.7 -8.7 -9.0 -9.6 -12.3Sheep, beef cattle and grain farming -64.1 -68.6 -61.7 -66.6 -64.1 -72.6Other crop growing -4.8 -5.2 -5.3 -5.5 -6.4 -9.0Dairy cattle farming -7.0 -11.5 -12.9 -13.9 -12.1 -12.4Other livestock farming -15.4 -13.7 -13.7 -16.6 -18.7 -25.2Aquaculture and fishing -6.4 -8.3 -7.7 -8.8 -9.9 -10.9Forestry and logging -2.1 -1.9 -1.6 -1.7 -2.0 -2.2Primary production support services -22.0 -12.5 -40.2 -42.8 -44.0 -53.0Unallocated primary productionb – – – – – – Mining -236.0 -258.4 -285.6 -297.4 -305.7 -309.4Manufacturing -1780.7 -1672.1 -1688.0 -1676.9 -1636.2 -1649.9Food, beverages and tobacco -675.1 -682.0 -700.1 -704.7 -693.5 -732.2Textiles, leather, clothing and footwear -34.5 -33.7 -34.3 -32.9 -30.0 -29.3Wood and paper products -111.6 -109.2 -111.1 -116.1 -116.5 -113.6Printing and recorded media -29.7 -29.0 -29.5 -30.5 -30.3 -29.5Petroleum, coal, chemical and rubber -160.2 -140.8 -142.2 -133.6 -129.8 -130.6Non-metallic mineral products -53.4 -52.2 -53.1 -55.2 -55.2 -53.8Metal and fabricated metal products -191.6 -194.8 -183.1 -179.0 -168.0 -167.8Motor vehicles and parts -289.6 -185.6 -218.1 -196.8 -192.4 -183.0Other transport equipment -66.2 -80.5 -51.6 -69.0 -66.7 -63.6Machinery & equipment manufacturing -112.4 -114.6 -112.9 -106.1 -103.1 -98.1Furniture and other manufacturing -56.6 -49.8 -52.0 -53.1 -50.8 -48.3Unallocated manufacturingb – – – – – – Services -3435.8 -3585.9 -3712.8 -3737.2 -3718.4 -3767.6Electricity, gas, water & waste services -65.2 -74.0 -73.3 -70.1 -68.2 -69.9Construction -1329.5 -1410.7 -1479.7 -1500.7 -1489.6 -1505.4Wholesale trade -229.7 -237.6 -236.2 -228.0 -226.7 -228.9Retail trade -138.3 -141.4 -141.9 -140.3 -142.3 -146.5Accommodation & food services -266.1 -275.1 -280.1 -292.6 -302.3 -293.4Transport, postal & warehousing -187.5 -196.7 -197.3 -202.3 -204.2 -203.5Information & telecommunications -71.8 -72.2 -73.3 -73.0 -71.7 -71.3Financial and insurance services -12.6 -13.2 -13.8 -14.6 -15.1 -16.0Property, professional & admin. -340.0 -356.2 -365.3 -372.5 -375.7 -406.1Public administration and safety -136.2 -140.4 -145.2 -140.9 -143.1 -144.9Education and training -43.6 -45.7 -47.9 -48.6 -49.4 -51.5Health care and social assistance -209.2 -220.7 -232.0 -228.8 -217.4 -228.5Arts and recreation services -68.1 -68.4 -72.9 -74.0 -75.0 -74.7Other services -338.0 -333.7 -353.8 -350.9 -337.6 -327.1Unallocated servicesb – – – – – – Unallocated otherb – – – – – – Total -5584.7 -5648.9 -5838.1 -5876.4 -5827.2 -5924.5– Nil. Figures may not add to totals due to rounding. a Tariff assistance estimates are derived using ABS Industry Gross Value Added and other supporting data. b Unallocated includes budgetary measures where details of beneficiaries are unknown. These categories are not applicable for tariff assistance.
Source: Commission estimates.
90 TRADE AND ASSISTANCE REVIEW 2016-17

Table A.6 Budgetary outlays by industry grouping, 2011-12 to 2016-17$ million (nominal)
Industry grouping 2011-12 2012-13 2013-14 2014-15 2015-16 2016-17
Primary production 946.6 755.0 793.5 853.5 776.0 879.9Horticulture and fruit growing 85.9 80.5 82.5 74.3 85.4 95.5Sheep, beef cattle and grain farming 253.1 216.7 285.2 275.2 245.4 249.2Other crop growing 48.8 45.5 53.5 53.4 57.0 52.4Dairy cattle farming 41.4 29.7 36.2 35.5 33.8 31.9Other livestock farming 41.2 32.4 27.4 36.3 39.3 38.2Aquaculture and fishing 53.8 59.7 60.1 65.5 70.9 77.5Forestry and logging 64.1 37.1 15.2 13.3 14.0 16.0Primary production support services 5.7 7.5 7.9 6.9 7.9 8.7Unallocated primary productiona 352.5 245.8 225.5 293.0 222.4 310.6Mining 398.1 201.7 252.0 234.8 206.1 238.9Manufacturing 1376.1 1250.3 1266.0 1291.8 1176.8 1179.2Food, beverages and tobacco 27.4 64.1 106.9 100.2 95.2 83.0Textiles, leather, clothing and footwear 50.4 48.4 52.4 49.5 44.1 23.8Wood and paper products 5.6 18.5 12.0 12.7 8.5 13.4Printing and recorded media 6.1 36.7 36.8 46.0 48.4 58.3Petroleum, coal, chemical and rubber 220.1 262.9 282.5 277.2 200.3 203.5Non-metallic mineral products 7.3 16.2 26.7 21.4 19.9 19.0Metal and fabricated metal products 205.4 70.2 67.3 79.4 87.8 125.2Motor vehicles and parts 580.4 420.3 366.1 320.6 264.4 207.1Other transport equipment 13.4 19.1 17.5 23.5 26.2 26.5Machinery & equipment manufacturing 71.0 135.4 144.4 194.2 202.8 223.6Furniture and other manufacturing 25.9 29.2 23.6 20.6 20.6 25.4Unallocated manufacturinga 163.0 129.4 129.8 146.4 158.6 170.4Services 2247.6 1816.1 1806.6 2153.7 2170.1 2634.1Electricity, gas, water & waste services 1072.2 106.6 139.3 212.7 137.2 120.5Construction 18.3 54.7 55.5 71.6 65.9 81.6Wholesale trade 38.6 66.5 61.0 80.8 84.8 103.2Retail trade 32.2 30.3 24.5 34.0 37.2 46.6Accommodation & food services 4.6 6.5 5.9 8.5 9.1 8.7Transport, postal & warehousing 57.9 49.7 53.3 63.0 66.4 79.8Information & telecommunications 88.0 172.0 173.9 203.0 197.8 350.9Financial and insurance services 137.2 85.2 84.5 114.0 129.5 135.4Property, professional & admin. 328.6 761.7 733.3 948.6 1019.8 1234.4Public administration and safety 10.6 10.4 8.5 15.8 16.8 21.6Education and training 18.6 21.7 19.8 22.5 22.9 26.8Health care and social assistance 113.5 122.9 133.7 110.1 111.5 109.6Arts and recreation services 128.8 131.3 134.0 112.2 107.0 149.7Other services 19.4 25.9 22.6 18.1 20.0 22.9Unallocated servicesa 179.0 170.8 156.8 138.9 144.1 142.4Unallocated othera 337.1 297.5 436.0 415.7 281.3 359.1Total 5305.5 4320.5 4554.2 4949.5 4610.3 5291.3
– Nil. Figures may not add to totals due to rounding. a Unallocated includes budgetary measures where details of beneficiaries are unknown.
Source: Commission estimates.
DETAILED ESTIMATES 91

Table A.7 Budgetary tax concessions by industry grouping, 2011-12 to 2016-17$ million (nominal)
Industry grouping 2011-12 2012-13 2013-14 2014-15 2015-16 2016-17
Primary production 606.5 488.6 507.3 518.8 598.3 759.9Horticulture and fruit growing 50.4 49.7 49.0 51.7 60.7 79.5Sheep, beef cattle and grain farming 409.7 309.5 321.3 328.7 386.6 509.2Other crop growing 45.2 48.9 49.0 28.5 34.2 43.5Dairy cattle farming 36.6 21.8 24.7 38.9 43.7 33.6Other livestock farming 25.0 14.0 15.2 15.1 18.2 24.9Aquaculture and fishing 13.4 10.8 12.0 18.2 16.7 18.6Forestry and logging 8.2 9.5 11.7 14.3 13.8 18.4Primary production support services 16.2 19.5 21.6 20.3 20.2 28.0Unallocated primary productiona 1.8 4.8 2.7 3.0 4.3 4.1Mining 347.5 281.6 263.7 289.8 309.6 282.9Manufacturing 475.4 684.1 570.9 486.9 504.1 550.5Food, beverages and tobacco 81.1 62.6 77.5 72.8 53.8 51.7Textiles, leather, clothing and footwear 10.5 8.8 9.2 6.7 7.4 14.1Wood and paper products 11.7 10.5 10.1 6.9 8.8 16.8Printing and recorded media 10.3 9.1 8.6 6.0 11.3 15.1Petroleum, coal, chemical and rubber 59.0 71.4 51.5 38.4 36.3 35.3Non-metallic mineral products 9.4 7.5 7.4 5.0 4.4 7.4Metal and fabricated metal products 83.4 292.1 231.4 176.4 121.0 138.6Motor vehicles and parts 45.0 38.3 33.8 31.2 35.1 36.3Other transport equipment 8.6 5.2 4.8 7.3 16.4 9.7Machinery & equipment manufacturing 83.0 99.3 62.5 42.5 40.2 51.8Furniture and other manufacturing 6.5 5.5 6.2 2.4 1.8 6.4Unallocated manufacturinga 67.0 73.8 68.0 91.3 167.6 167.4Services 2835.4 2436.8 2158.4 1952.1 2057.4 2843.9Electricity, gas, water & waste services 33.9 36.3 27.2 18.8 20.6 28.8Construction 192.3 143.0 102.1 60.2 47.1 247.4Wholesale trade 246.9 136.1 114.6 108.7 76.7 115.1Retail trade 104.1 98.5 87.5 86.6 74.9 139.3Accommodation & food services 63.2 64.3 71.0 73.7 59.9 116.8Transport, postal & warehousing 187.8 131.3 77.3 42.6 29.4 108.6Information & telecommunications 205.5 218.9 59.6 30.4 34.7 52.9Financial and insurance services 899.1 749.6 835.4 833.7 930.8 820.0Property, professional & admin. 530.5 455.6 365.3 358.3 289.4 613.5Public administration and safety 5.2 6.2 5.2 2.3 3.3 7.9Education and training 14.1 13.5 8.0 9.8 5.5 19.9Health care and social assistance 70.9 60.9 60.5 87.1 75.9 135.3Arts and recreation services 233.2 282.2 312.6 216.5 388.6 365.7Other services 48.6 40.5 32.1 23.3 20.6 72.7Unallocated servicesa – – – – – – Unallocated othera 635.4 674.7 724.6 284.3 799.5 2775.0Total 4900.2 4565.8 4224.8 3532.0 4269.0 7212.2
– Nil. Figures may not add to totals due to rounding. a Unallocated includes budgetary measures where details of beneficiaries are unknown.
Source: Commission estimates.
92 TRADE AND ASSISTANCE REVIEW 2016-17

Table A.8 Nominal rate of combined assistance on outputs by industry grouping, 2011-12 to 2016-17a
Per cent
Industry grouping 2011-12 2012-13 2013-14 2014-15 2015-16 2016-17
Primary Productionb 0.5 0.6 0.5 0.5 0.5 0.5Horticulture and fruit growing 0.7 0.9 0.9 0.9 1.0 1.1Sheep, beef cattle and grain farming 0.7 0.7 0.7 0.7 0.7 0.7Other crop growing 0.0 0.0 0.0 0.0 0.0 0.0Dairy cattle farming 0.0 0.0 0.0 0.0 0.0 0.0Other livestock farming 0.0 0.0 0.0 0.0 0.0 0.0Aquaculture and fishing 0.2 0.2 0.2 0.2 0.2 0.2Forestry and logging 0.7 0.7 0.7 0.7 0.7 0.7Primary production support services 0.2 0.2 0.2 0.2 0.2 0.2Mining 0.0 0.0 0.0 0.0 0.0 0.0Manufacturingb 2.0 2.1 2.0 2.0 1.9 1.9Food, beverages and tobacco 2.2 2.2 2.2 2.2 2.2 2.2Textiles, leather, clothing and footwear 2.9 2.9 2.9 2.5 2.2 2.2Wood and paper products 3.7 3.7 3.7 3.7 3.7 3.7Printing and recorded media 1.8 1.8 1.8 1.8 1.8 1.8Petroleum, coal, chemical and rubber 1.4 1.2 1.1 1.0 0.9 0.9Non-Metallic mineral products 2.0 2.0 2.0 2.0 2.0 2.0Metal and fabricated metal products 1.4 2.2 1.5 1.6 1.6 1.6Motor vehicles and parts 3.8 3.8 3.8 3.8 3.8 3.8Other transport equipment 2.2 2.2 2.2 2.2 2.2 2.2Machinery and equipment manufacturing 1.6 1.6 1.6 1.6 1.6 1.6Furniture and other manufacturing 3.1 3.2 3.1 3.2 3.1 3.1
– Nil. Figures may not add to totals due to rounding. a Combined assistance comprises tariff and budgetary assistance. b Sectoral estimates include assistance to the sector that has not been allocated to specific industry groupings.
Source: Commission estimates.
DETAILED ESTIMATES 93

Table A.9 Nominal rate of combined assistance on materials by industry grouping, 2011-12 to 2016-17a
Per cent
Industry grouping 2011-12 2012-13 2013-14 2014-15 2015-16 2016-17
Primary Productionb 0.5 0.5 0.6 0.6 0.5 0.5Horticulture and fruit growing 0.3 0.3 0.3 0.3 0.3 0.3Sheep, beef cattle and grain farming 0.6 0.6 0.6 0.6 0.6 0.6Other crop growing 0.3 0.3 0.3 0.3 0.2 0.3Dairy cattle farming 0.5 0.6 0.6 0.6 0.5 0.5Other livestock farming 0.8 0.8 0.8 0.8 0.8 0.8Aquaculture and fishing 0.8 0.8 0.8 0.7 0.7 0.7Forestry and logging 0.2 0.2 0.2 0.2 0.2 0.2Primary production support services 0.8 0.8 0.8 0.8 0.8 0.8Mining 0.7 0.7 0.7 0.6 0.6 0.6Manufacturingb 0.9 0.9 0.9 0.9 0.8 0.8Food, beverages and tobacco 1.5 1.5 1.5 1.5 1.5 1.5Textile, leather, clothing and footwear 1.5 1.5 1.5 1.3 1.2 1.2Wood and paper products 1.8 1.8 1.8 1.8 1.8 1.8Printing and recorded media 1.8 1.8 1.8 1.8 1.7 1.7Petroleum, coal, chemical and rubber 0.3 0.3 0.3 0.3 0.3 0.3Non-Metallic mineral products 0.9 0.9 0.9 0.9 0.8 0.8Metal and fabricated metal products 0.4 0.6 0.4 0.4 0.4 0.4Motor vehicle and parts 2.4 2.3 2.3 2.3 2.2 2.2Other transport equipment 1.5 1.5 1.5 1.4 1.4 1.4Machinery and equipment manufacturing 1.2 1.2 1.2 1.2 1.2 1.2Furniture and other manufacturing 1.7 1.7 1.7 1.6 1.6 1.6
– Nil. Figures may not add to totals due to rounding. a Combined assistance comprises tariff and budgetary assistance. b Sectoral estimates include assistance to the sector that has not been allocated to specific industry groupings.
Source: Commission estimates.
94 TRADE AND ASSISTANCE REVIEW 2016-17

Table A.10 Australian Government budgetary assistance to primary industry, 2011-12 to 2016-17a
$ million (nominal)
2011-12 2012-13 2013-14 2014-15 2015-16 2016-17
Horticulture and fruit growing
Industry-specific measuresAustralian Wine Industry Support – 0.5 0.5 – – –Premium Fresh Tasmania - assistance – 0.5 – – – –Wine Australia Corporation 2.8 2.7 2.9 – – –Tax deductions for grape vines -7.0 -6.0 -6.0 -6.0 -5.0 -4.0Tax Deduction for horticultural plantations 6.0 6.0 – – – –
Sector-specific measuresCarbon Farming Futures 0.3 0.2 5.2 4.1 1.9 1.5Drought Assistance Package - concessional loans – – – <0.1 <0.1 <0.1Exceptional Circumstances - interest rate subsidies 8.7 – – – – –Exceptional Circumstances - relief payments 0.8 – – – – –Farm Finance - concessional loans – – 0.7 0.1 0.1 <0.1Farm Help <0.1 – – – – –Improved Access to Agricultural and Veterinary Chemicals – – – – – 1.4Interim Income Support <0.1 – – – – –Rural Financial Counselling Service 2.3 2.1 2.3 2.2 1.7 1.3Farm Management Deposits Scheme 20.4 18.2 17.8 19.9 26.8 26.1Income tax averaging provisions 12.8 15.3 19.1 18.4 19.3 17.5Tax deduction for conserving or conveying water 5.0 5.2 4.6 0.1 1.3 5.3
Rural R&D measuresGrape and Wine R&D 10.3 9.7 11.9 12.1 12.1 12.0Horticulture Australia Limited R&D 42.0 41.4 41.9 29.2 41.7 45.5Rural Industries R&D Corporation 3.4 2.2 2.3 1.6 1.2 1.5
General export measuresExport Market Development Grants Scheme 1.0 1.0 0.8 1.0 1.0 0.9
General R&D measuresCommercialisation Australia 0.3 <0.1 – 0.8 <0.1 –CSIRO 9.7 7.3 2.5 7.2 7.8 9.1R&D Tax Incentive - refundable tax offset – 11.7 11.3 15.2 16.1 19.5R&D tax offsets - Refundable 3.4 – – – – –R&D tax concession 3.3 1.5 0.5 0.1 – –R&D Tax Incentive - non-refundable tax offset – 0.9 1.6 4.4 4.2 3.6
(continued next page)
DETAILED ESTIMATES 95

Table A.10 (continued)
2011-12 2012-13 2013-14 2014-15 2015-16 2016-17
Other measuresAustralian Government Innovation and Investment Fund - Tasmania – – – 0.8 0.8 0.5Enterprise Connect Innovation Centres 0.1 <0.1 <0.1 <0.1 – –Entrepreneurs’ Infrastructure Programme - Business Management Skills – – – <0.1 <0.1 0.1South East South Australia Innovation and Investment Fund 0.5 0.9 – – – –Tasmanian Innovation and Investment Fund 0.4 0.3 0.1 – – –Tasmanian Jobs and Investment Fund – – – – 0.7 2.2Small business capital gains tax rollover deferral 0.5 0.6 0.7 1.2 1.1 1.8The Small Business and General Business Tax Break 1.1 0.4 <0.1 – – –Small Business - Simplified depreciation rules 0.1 -0.7 2.5 -1.2 -2.2 11.4Small business capital gains tax 15-year asset exemption 2.2 2.2 2.6 5.0 5.3 6.8Small business capital gains tax retirement exemption 2.2 2.2 2.3 4.0 4.4 4.0Small business capital gains tax 50 per cent reduction 3.2 3.4 3.4 5.9 5.5 7.025 per cent entrepreneurs' tax offset 0.5 0.5 – – – –
Total 136.3 130.3 131.5 126.0 146.1 175.1Sheep, beef cattle and grain farming
Industry-specific measuresBeef Australia 2015 – – 2.5 – – –Northern Australia Beef Industry Strategy Indigenous Pastoral Project 0.5 – – – – –
Sector-specific measuresCarbon Farming Futures 13.4 10.3 40.5 30.2 4.4 3.6Carbon Farming Initiative – – 0.2 – 0.8 –Drought Assistance Package - concessional loans – – 2.0 1.3 1.7 1.5Exceptional Circumstances - interest rate subsidies 15.8 – – – – –Exceptional Circumstances - relief payments 4.1 – – – – –Farm Finance - concessional loans – – 7.2 1.0 1.0 0.6Improved Access to Agricultural and Veterinary Chemicals – – – – – 0.2Interim Income Support <0.1 – – – – –Managing Farm Risk Program – – – – <0.1 0.1Rural Financial Counselling Service 6.7 7.8 11.3 11.0 10.0 10.0Farm Management Deposits Scheme 168.3 103.7 100.4 120.2 175.8 179.5Income tax averaging provisions 93.4 86.7 108.3 104.4 109.9 135.7Tax deduction for conserving or conveying water 33.7 40.0 35.0 2.4 5.0 10.4
(continued next page)
96 TRADE AND ASSISTANCE REVIEW 2016-17

Table A.10 (continued)
2011-12 2012-13 2013-14 2014-15 2015-16 2016-17
Rural R&D measuresWool R&D 12.5 13.3 13.0 12.5 13.4 14.7Grains R&D Corporation 55.9 62.8 68.6 68.0 70.2 73.3Meat and Livestock Australia R&D 37.1 38.3 46.7 46.5 44.0 52.1Rural Industries R&D Corporation 1.0 2.6 3.8 4.0 3.2 3.8
General export measuresExport Market Development Grants Scheme 0.4 0.4 0.5 0.8 0.5 0.7
General R&D measuresCooperative Research Centres 6.1 3.7 0.2 3.3 4.8 4.9CSIRO 81.9 70.7 81.4 90.7 85.0 76.0R&D Tax Incentive - refundable tax offset – 3.5 3.4 4.6 4.9 5.9R&D tax offsets - Refundable 3.4 – – – – –R&D tax concession 2.4 1.1 0.4 0.1 – –R&D Tax Incentive - non-refundable tax offset – 4.4 6.4 2.2 0.5 1.4
Other measuresEnterprise Connect Innovation Centres <0.1 <0.1 0.1 <0.1 – –Entrepreneurs’ Infrastructure Programme - Accelerating Commercialisation – – – <0.1 0.3 0.5Entrepreneurs’ Infrastructure Programme - Business Management Skills – – – – – <0.1Live Animal Exports Business Assistance 13.3 2.3 3.1 0.3 – –Temporary Assistance for Tasmanian Exporters 0.1 – – – – –Tasmanian Freight Equalisation Scheme 0.8 0.9 0.9 0.9 1.1 1.2Small business capital gains tax rollover deferral 7.8 9.2 9.7 16.9 16.3 25.4The Small Business and General Business Tax Break 57.7 20.0 2.4 – – –Small Business - Simplified depreciation rules 0.5 -2.8 10.3 -5.1 -9.8 51.7Small business capital gains tax 15-year asset exemption 13.3 13.8 15.8 30.5 32.4 42.1Small business capital gains tax retirement exemption 12.2 12.5 12.8 22.5 24.6 22.4Small business capital gains tax 50 per cent reduction 18.8 19.8 19.8 34.6 32.0 40.725 per cent entrepreneurs' tax offset 1.6 1.3 – – – –
Total 662.7 526.2 606.5 603.9 632.0 758.4Other crop growing
Sector-specific measuresCarbon Farming Futures 3.0 2.3 3.7 3.0 5.4 4.1Drought Assistance Package - concessional loans – – – 0.2 0.2 0.4Exceptional Circumstances - interest rate subsidies 2.1 – – – – –Exceptional Circumstances - relief payments <0.1 – – – – –
(continued next page)
DETAILED ESTIMATES 97

Table A.10 (continued)
2011-12 2012-13 2013-14 2014-15 2015-16 2016-17
Sector-specific measures (continued)Farm Finance - concessional loans – – 1.0 0.2 0.2 0.2Improved Access to Agricultural and Veterinary Chemicals – – – 0.3 1.7 0.7Interim Income Support <0.1 – – – – –Rural Financial Counselling Service 0.9 0.6 0.8 0.8 0.8 1.0Farm Management Deposits Scheme 11.9 9.0 10.1 11.8 17.1 17.4Income tax averaging provisions 5.7 6.3 7.9 6.8 7.2 5.8Tax deduction for conserving or conveying water 22.1 28.9 25.2 2.1 2.4 6.1
Rural R&D measuresCotton R&D Corporation 9.5 11.8 11.2 7.3 6.1 6.1Rural Industries R&D Corporation 0.8 0.7 0.6 0.6 0.6 0.7Sugar R&D Corporation 5.4 4.3 6.7 6.1 6.6 7.6
General export measuresExport Market Development Grants Scheme 0.5 0.6 0.6 0.8 0.8 0.9
General R&D measuresCommercialisation Australia – 0.1 0.1 – – –Cooperative Research Centres 3.0 – – – – –Clean Business Australia - Climate Ready Program <0.1 – – – – –CSIRO 23.0 23.2 27.0 31.6 31.9 27.5R&D Tax Incentive - refundable tax offset – 1.8 1.8 2.4 2.5 3.1R&D tax offsets - Refundable 0.6 – – – – –R&D tax concession 0.7 0.3 0.1 <0.1 – –R&D Tax Incentive - non-refundable tax offset – – 0.4 0.3 0.6 0.7
Other measuresAustralian Government Innovation and Investment Fund - Tasmania – – – 0.2 0.2 0.1Entrepreneurs’ Infrastructure Programme - Business Management Skills – – – – – <0.1Small business capital gains tax rollover deferral 0.5 0.5 0.6 1.0 1.0 1.5The Small Business and General Business Tax Break 0.7 0.3 <0.1 – – –Small Business - Simplified depreciation rules <0.1 -0.2 0.8 -0.4 -0.8 4.0Small business capital gains tax 15-year asset exemption 0.6 0.6 0.7 1.3 1.4 1.8Small business capital gains tax retirement exemption 0.7 0.7 0.7 1.3 1.4 1.3Small business capital gains tax 50 per cent reduction 2.3 2.4 2.4 4.2 3.9 4.925 per cent entrepreneurs' tax offset 0.1 0.1 – – – –
Total 94.1 94.4 102.6 81.9 91.2 95.9
(continued next page)
98 TRADE AND ASSISTANCE REVIEW 2016-17

Table A.10 (continued)
2011-12 2012-13 2013-14 2014-15 2015-16 2016-17
Dairy cattle farmingSector-specific measures
Carbon Farming Futures 2.5 1.9 6.5 4.3 2.3 2.3Drought Assistance Package - concessional loans – – – <0.1 0.1 0.1Exceptional Circumstances - interest rate subsidies 2.9 – – – – –Exceptional Circumstances - relief payments 0.8 – – – – –Farm Finance - concessional loans – – 0.7 0.2 0.2 0.8Improved Access to Agricultural and Veterinary Chemicals – – – – – 0.1Interim Income Support <0.1 – – – – –Rural Financial Counselling Service 1.0 1.6 1.6 1.4 2.3 3.9Farm Management Deposits Scheme 15.4 9.5 9.9 10.7 14.5 11.6Income tax averaging provisions 10.1 6.1 7.7 21.8 23.0 7.3Tax deduction for conserving or conveying water 6.6 2.2 1.9 0.1 0.5 1.4
Rural R&D measuresDairy Australia R&D 18.6 19.3 20.4 21.0 22.7 21.6
General export measuresExport Market Development Grants Scheme – – 0.1 0.1 0.1 0.1TRADEX 0.3 0.4 0.4 0.4 0.4 0.4
General R&D measuresCooperative Research Centres 4.8 4.8 4.8 4.0 1.6 –CSIRO 10.7 1.8 1.7 4.1 4.1 2.6R&D Tax Incentive - refundable tax offset – 0.4 0.3 0.5 0.5 0.6R&D tax offsets - Refundable <0.1 – – – – –
Other measuresEntrepreneurs’ Infrastructure Programme - Business Management Skills – – – – – <0.1Small business capital gains tax rollover deferral 0.4 0.5 0.5 0.9 0.8 1.3The Small Business and General Business Tax Break 0.4 0.1 <0.1 – – –Small Business - Simplified depreciation rules 0.1 -0.3 1.1 -0.5 -1.0 5.3Small business capital gains tax retirement exemption 0.9 1.0 1.0 1.7 1.9 1.7Small business capital gains tax 50 per cent reduction 2.1 2.2 2.2 3.9 3.6 4.625 per cent entrepreneurs' tax offset 0.2 0.1 – – – –
Total 78.0 51.5 60.9 74.4 77.4 65.5
(continued next page)
DETAILED ESTIMATES 99

Table A.10 (continued)
2011-12 2012-13 2013-14 2014-15 2015-16 2016-17
Other livestock farmingSector-specific measures
Carbon Farming Futures 6.6 5.1 1.1 0.7 0.6 0.5Drought Assistance Package - concessional loans – – – <0.1 <0.1 <0.1Exceptional Circumstances - interest rate subsidies 0.4 – – – – –Exceptional Circumstances - relief payments 0.1 – – – – –Farm Finance - concessional loans – – 0.1 <0.1 <0.1 <0.1Improved Access to Agricultural and Veterinary Chemicals – – – – – 0.1Interim Income Support <0.1 – – – – –Rural Financial Counselling Service 0.3 0.7 0.8 0.5 0.4 0.3Farm Management Deposits Scheme 12.3 4.8 4.2 4.4 6.5 6.3Income tax averaging provisions 4.9 4.2 5.3 7.0 7.3 7.6Tax deduction for conserving or conveying water 1.1 1.0 0.8 0.1 0.7 1.3
Rural R&D measuresEgg Research and Development 1.9 1.8 1.9 1.5 1.7 1.9Pig Research and Development 4.6 4.5 4.8 4.9 5.3 5.1Rural Industries R&D Corporation 4.4 4.8 3.8 3.1 3.2 3.8
General export measuresExport Market Development Grants Scheme 0.2 0.6 0.4 0.3 0.3 0.3
General R&D measuresCooperative Research Centres 6.8 7.2 7.0 6.6 6.6 5.1CSIRO 15.3 3.1 3.0 12.4 14.6 13.1R&D Tax Incentive - refundable tax offset – 4.7 4.5 6.1 6.5 7.8R&D tax offsets - Refundable 0.7 – – – – –R&D tax concession 4.1 1.8 0.6 0.1 – –R&D Tax Incentive - non-refundable tax offset – 0.1 1.4 0.5 1.1 1.4
Other measuresAustralian Government Innovation and Investment Fund - Tasmania – – – 0.1 0.2 0.1Enterprise Connect Innovation Centres – <0.1 – – – –Entrepreneurs’ Infrastructure Programme - Business Management Skills – – – – – <0.1Small business capital gains tax rollover deferral 0.2 0.2 0.2 0.4 0.4 0.6The Small Business and General Business Tax Break 0.6 0.2 <0.1 – – –Small Business - Simplified depreciation rules <0.1 -0.3 0.9 -0.4 -0.8 4.4Small business capital gains tax retirement exemption 0.7 0.7 0.8 1.3 1.5 1.3
(continued next page)
100 TRADE AND ASSISTANCE REVIEW 2016-17
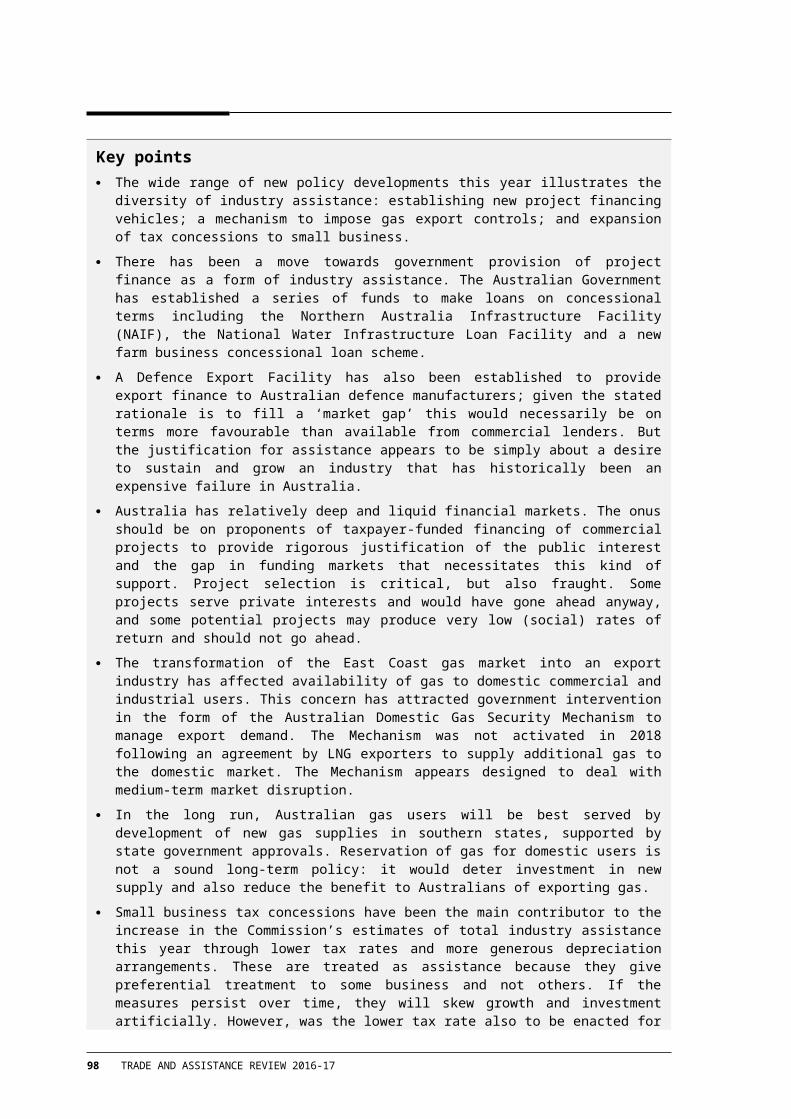
Table A.10 (continued)
2011-12 2012-13 2013-14 2014-15 2015-16 2016-17
Other measures (continued)Small business capital gains tax 50 per cent reduction 1.0 1.0 1.0 1.7 1.6 2.125 per cent entrepreneurs' tax offset 0.2 0.3 – – – –
Total 66.2 46.4 42.6 51.5 57.5 63.1
Aquaculture and fishingSector-specific measures
Exceptional Circumstances - interest rate subsidies <0.1 – – – – –Exceptional Circumstances - relief payments <0.1 – – – – –Interim Income Support <0.1 – – – – –Rural Financial Counselling Service 0.1 0.1 0.1 0.1 0.2 0.4Income tax averaging provisions 6.6 7.0 8.7 13.8 14.5 9.9Tax deduction for conserving or conveying water 0.6 0.3 0.3 <0.1 <0.1 0.2
Rural R&D measuresFisheries R&D Corporation 16.6 17.2 17.9 18.7 20.0 21.8Fisheries Resources Research Fund 0.1 2.1 2.0 0.3 0.4 1.0
General export measuresExport Market Development Grants Scheme 0.4 0.4 0.3 0.3 0.2 0.6TRADEX <0.1 <0.1 <0.1 <0.1 <0.1 <0.1
General R&D measuresCommercialisation Australia 1.1 1.7 2.1 0.7 <0.1 –Commercial Ready Program <0.1 – – – – –Cooperative Research Centres 5.4 5.1 4.8 – – –CSIRO 21.0 13.9 15.0 22.3 24.4 22.8R&D Tax Incentive - refundable tax offset – 14.4 13.9 18.6 19.8 24.0R&D tax offsets - Refundable 4.1 – – – – –Premium R&D tax concession 1.5 0.4 0.2 – – –R&D tax concession 2.8 1.3 0.4 0.1 – –R&D Tax Incentive - non-refundable tax offset – 0.2 0.5 2.6 0.8 2.6
Other measuresAustralian Government Innovation and Investment Fund - Tasmania – – – 0.3 0.3 0.5Enterprise Connect Innovation Centres <0.1 <0.1 <0.1 <0.1 – –Entrepreneurs’ Infrastructure Programme - Accelerating Commercialisation – – – <0.1 0.4 0.8Entrepreneurs’ Infrastructure Programme - Business Management Skills – – – <0.1 0.1 <0.1South East South Australia Innovation and Investment Fund 0.1 – – – – –
(continued next page)
DETAILED ESTIMATES 101
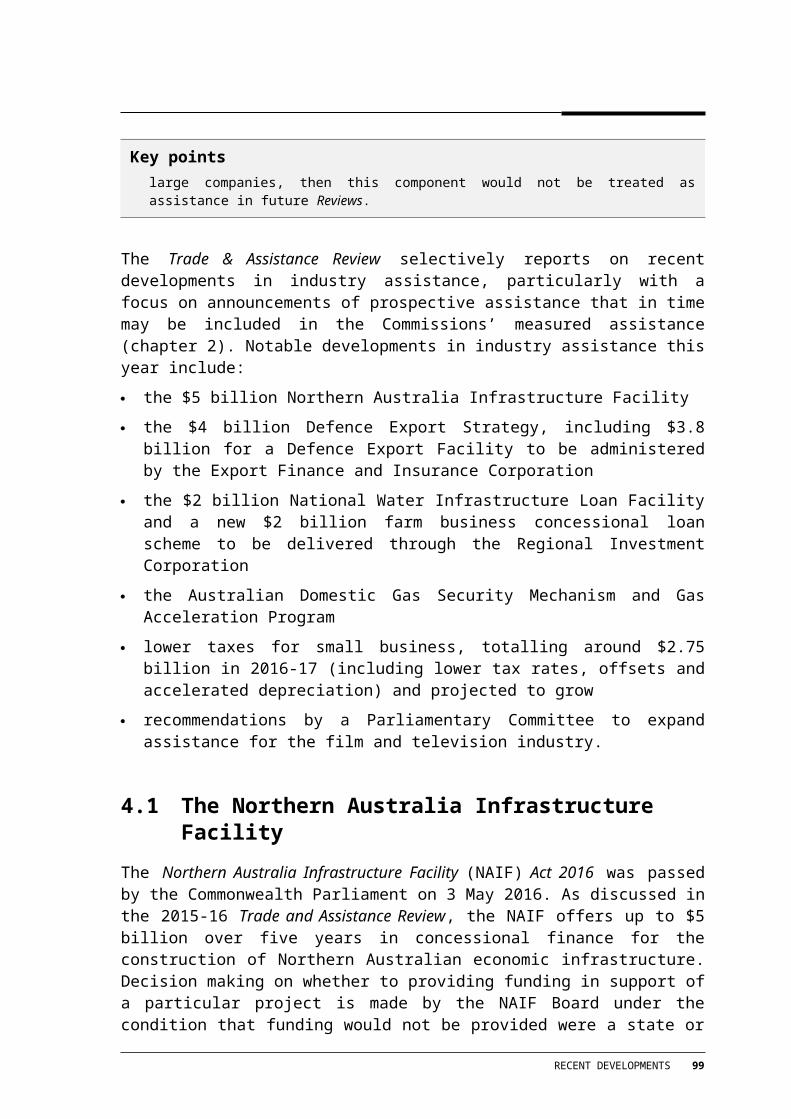
Table A.10 (continued)
2011-12 2012-13 2013-14 2014-15 2015-16 2016-17
Other measures (continued)Temporary Assistance for Tasmanian Exporters 0.5 – – – – –Tasmanian Freight Equalisation Scheme 3.5 4.1 3.8 4.1 4.8 5.1Tasmanian Innovation and Investment Fund 0.8 0.7 0.2 – – –Tasmanian Jobs and Investment Fund – – – – 0.3 0.6Small business capital gains tax rollover deferral 0.2 0.2 0.2 0.3 0.3 0.5Small Business - Simplified depreciation rules <0.1 -0.2 0.7 -0.3 -0.7 3.4Small business capital gains tax retirement exemption 0.1 0.1 0.2 0.3 0.3 0.3Small business capital gains tax 50 per cent reduction 0.8 0.8 0.8 1.5 1.3 1.725 per cent entrepreneurs' tax offset 0.7 0.7 – – – –
Total 67.2 70.4 72.1 83.8 87.5 96.1Forestry and logging
Industry-specific measuresTasmanian Forests Agreement - Implementation Package – 20.3 – – – –Tasmanian Forest Industry Adjustment Package 42.4 0.3 – – – –
Sector-specific measuresCarbon Farming Futures 1.1 0.8 – – – –Carbon Farming Initiative – – <0.1 – 0.1 –Exceptional Circumstances - interest rate subsidies <0.1 – – – – –Farm Finance - concessional loans – – <0.1 – – –Rural Financial Counselling Service 0.1 <0.1 <0.1 <0.1 <0.1 0.1Income tax averaging provisions 1.9 3.2 4.0 3.8 4.0 3.6Tax deduction for conserving or conveying water 0.2 0.3 0.3 <0.1 <0.1 <0.1
Rural R&D measuresForest and Wood Products R&D 2.4 1.8 2.2 2.0 2.3 2.8
General export measuresExport Market Development Grants Scheme 0.1 – 0.2 0.2 0.2 0.1
General R&D measuresCooperative Research Centres 3.2 – – – – –CSIRO 10.5 8.5 7.8 5.4 4.8 5.9R&D Tax Incentive - refundable tax offset – 1.2 1.1 1.5 1.6 2.0R&D tax offsets - Refundable 0.4 – – – – –
(continued next page)
102 TRADE AND ASSISTANCE REVIEW 2016-17

Table A.10 (continued)
2011-12 2012-13 2013-14 2014-15 2015-16 2016-17
General R&D measures (continued)R&D tax concession 0.3 0.1 <0.1 <0.1 – –R&D Tax Incentive - non-refundable tax offset – – 0.7 0.3 – 0.1
Other measuresEntrepreneurs’ Infrastructure Programme - Business Management Skills – – – <0.1 <0.1 <0.1Temporary Assistance for Tasmanian Exporters 0.5 – – – – –Tasmanian Freight Equalisation Scheme 3.5 4.2 3.9 4.2 4.9 5.2Tasmanian Jobs and Investment Fund – – – – 0.1 –Small business capital gains tax rollover deferral 0.9 1.1 1.1 2.0 1.9 3.0Small Business - Simplified depreciation rules <0.1 -0.2 0.7 -0.3 -0.5 2.3Small business capital gains tax retirement exemption 1.8 1.8 1.9 3.3 3.6 3.2Small business capital gains tax 50 per cent reduction 2.8 3.0 3.0 5.2 4.8 6.125 per cent entrepreneurs' tax offset 0.3 0.2 – – – –
Total 72.3 46.6 26.9 27.6 27.8 34.4Primary production support services
Sector-specific measuresCarbon Farming Futures – – 2.5 – – –Carbon Farming Initiative 2.0 1.8 – – – –Exceptional Circumstances - interest rate subsidies 1.8 – – – – –Exceptional Circumstances - relief payments 0.3 – – – – –Interim Income Support <0.1 – – – – –Income tax averaging provisions 9.6 11.2 14.0 14.0 14.8 12.6Tax deduction for conserving or conveying water 0.7 2.2 1.9 0.1 0.1 0.3
General export measuresExport Market Development Grants Scheme 0.3 0.4 0.6 0.8 0.8 0.7TRADEX <0.1 <0.1 <0.1 <0.1 <0.1 <0.1
General R&D measuresCommercialisation Australia 0.1 0.4 0.3 <0.1 0.1 –COMET Program <0.1 – – – – –Clean Business Australia – Climate Ready Program <0.1 – – – – –R&D Tax Incentive - refundable tax offset – 4.6 4.5 6.0 6.4 7.7R&D tax offsets - Refundable 1.2 – – – – –R&D tax concession 1.9 0.9 0.3 0.1 – –
(continued next page)
DETAILED ESTIMATES 103
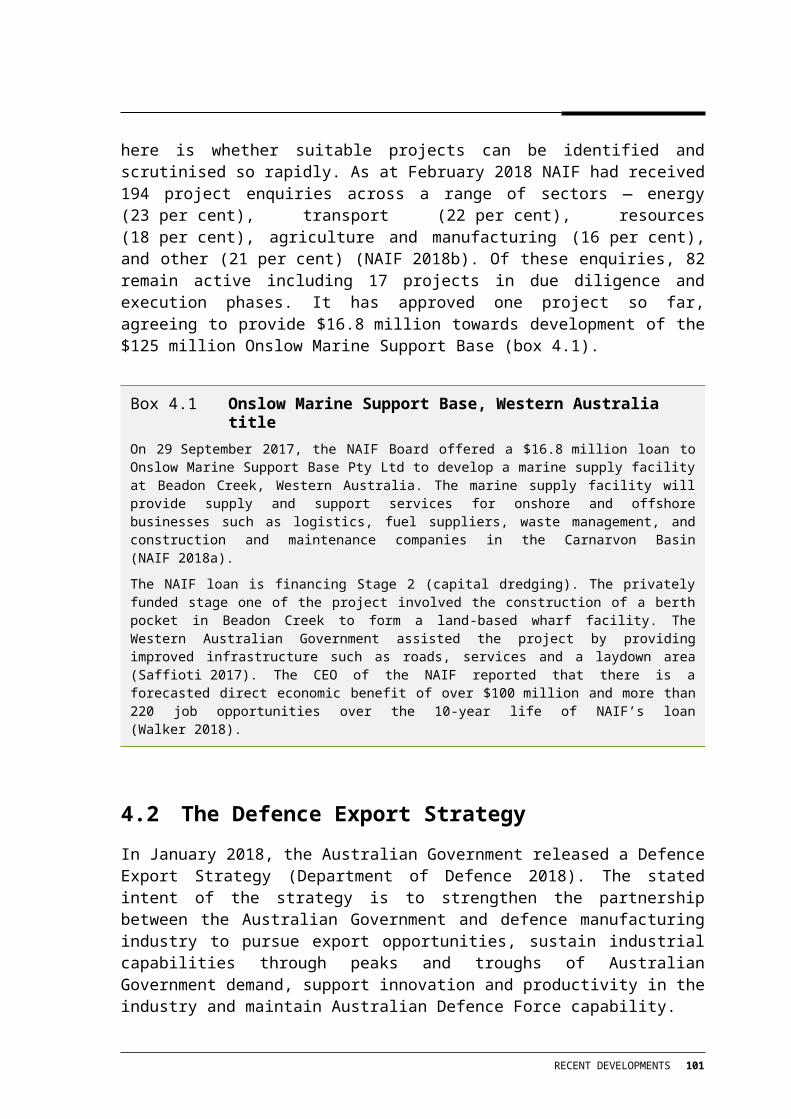
Table A.10 (continued)
2011-12 2012-13 2013-14 2014-15 2015-16 2016-17
General R&D measures (continued)R&D Tax Incentive - non-refundable tax offset – 1.1 1.0 1.3 1.4 1.8
Other measuresEnterprise Connect Innovation Centres <0.1 – <0.1 <0.1 – –Entrepreneurs’ Infrastructure Programme - Accelerating Commercialisation – – – <0.1 0.3 <0.1Entrepreneurs’ Infrastructure Programme - Business Management Skills – – – <0.1 0.1 <0.1Illawarra Region Innovation and Investment Fund – 0.3 – – – –Tasmanian Jobs and Investment Fund – – – – 0.2 0.2Small business capital gains tax rollover deferral 0.8 1.0 1.0 1.8 1.7 2.7Small Business - Simplified depreciation rules 0.1 -0.3 1.3 -0.6 -1.2 6.6Small business capital gains tax retirement exemption 0.4 0.5 0.5 0.8 0.9 0.8Small business capital gains tax 50 per cent reduction 1.5 1.6 1.6 2.8 2.6 3.325 per cent entrepreneurs' tax offset 1.2 1.5 – – – –
Total 21.9 27.1 29.5 27.2 28.0 36.7Unallocated primary production
Industry-specific measuresAustralian Animal Health Laboratory 7.4 7.5 7.7 7.8 7.9 8.0Exotic Disease Preparedness Program 0.6 0.6 – – – –Other Exotic Disease Preparedness Program – – – 0.6 0.6 0.6
Sector-specific measuresClimate Change Adjustment Program 16.2 0.6 – – – –Caring for our country - Landcare 36.8 35.1 17.2 11.9 5.9 3.5Drought assistance - Murray Darling Basin grants to irrigators – 0.1 – 0.1 – –Drought assistance - professional advice 1.9 <0.1 – – – –Drought assistance - re-establishment assistance 16.4 2.2 – – – –Drought Assistance Package - concessional loans – – – <0.1 <0.1 –Exceptional Circumstances - interest rate subsidies <0.1 – – – – –Exceptional Circumstances - relief payments 0.3 1.6 <0.1 – – –Environmental Stewardship Program 13.2 11.0 14.0 11.3 10.3 9.9Farm Business Concessional Loans Scheme – – – – – 3.6Farm Co-operatives and Collaboration Pilot - Stronger Farmers, Stronger Economy – – – – 0.7 6.9Farm Finance - concessional loans – – – <0.1 <0.1 –
(continued next page)
104 TRADE AND ASSISTANCE REVIEW 2016-17

Table A.10 (continued)
2011-12 2012-13 2013-14 2014-15 2015-16 2016-17
Sector-specific measures (continued)Interim Income Support <0.1 – – – – –Rural Financial Counselling Service 1.9 0.6 0.5 0.8 0.6 0.5Support for Small Exporters - A Competitive Agricultural Sector
– – – 1.3 2.3 2.3
Sustainable Rural Water Use and Infrastructure Program
191.8 140.5 143.7 192.3 121.6 214.7
Farm Management Deposits Scheme 1.8 4.8 2.7 3.0 4.3 4.1
Rural R&D measuresBoosting Farm Profits Through Rural R&D - A Competitive Agricultural Sector – – – 19.3 29.3 18.4Climate Change Adaption Partnerships Program 8.5 – – – – –Climate Change and Productivity Research Program 6.2 – – – – –National Weeds and Productivity Research Program 4.0 – – – – –Rural Industries R&D Corporation 5.4 4.4 4.2 3.5 3.7 4.4
General R&D measuresCooperative Research Centres 9.5 9.3 6.9 8.8 4.6 4.8CSIRO 17.1 15.5 15.2 18.9 15.8 12.8
Other measuresIndigenous Carbon Farming Fund – 0.9 1.5 0.4 0.4 0.4Temporary Assistance for Tasmanian Exporters 2.0 – – – – –Tasmanian Freight Equalisation Scheme 13.3 15.9 14.6 16.0 18.6 19.7
Total 354.3 250.6 228.1 296.1 226.7 314.7
Total outlays 946.6 755.0 793.5 853.5 776.0 879.9
Total tax concessions 606.5 488.6 507.3 518.8 598.3 759.9
Total budgetary assistance 1553.1 1243.6 1300.8 1372.3 1374.3 1639.8
– Nil. Figures may not add to totals due to rounding. a The estimates are derived primarily from Australian Government departmental annual reports and Treasury’s Tax Expenditure Statements and unpublished information provided by relevant agencies.
Source: Commission estimates.
DETAILED ESTIMATES 105

Table A.11 Australian Government budgetary assistance to mining, 2011-12 to 2016-17a
$ million (nominal)
2011-12 2012-13 2013-14 2014-15 2015-16 2016-17
Industry-specific measuresCoal Mining Abatement Support Package – 1.0 24.0 14.0 – –Coal Sector Jobs Package 218.8 – – – – –National Low Emissions Coal Initiative 25.6 22.4 43.8 31.6 4.4 0.6
Sector-specific measuresIndustry Growth Centres – – – 0.6 4.3 7.3Capital expenditure deduction for mining 2.0 2.0 2.0 2.0 2.0 –Exploration Development Incentive – – – 21.1 13.7 13.3
General export measuresExport Market Development Grants Scheme 1.8 1.2 2.0 2.4 1.8 1.8TRADEX 0.3 0.3 0.3 0.3 0.4 0.4
General R&D measuresCommercialisation Australia 0.9 1.9 2.5 0.8 – –COMET Program <0.1 – – – – –Cooperative Research Centres 11.3 10.7 11.3 8.8 8.6 13.6Clean Business Australia - Climate Ready Program 0.3 – – – – –CSIRO 71.2 80.7 87.3 68.2 71.7 75.6R&D Tax Incentive - refundable tax offset – 83.3 80.7 107.9 114.7 138.8R&D tax offsets - Refundable 67.7 – – – – –Premium R&D tax concession 88.8 24.2 10.1 – – –R&D tax concession 252.5 112.7 38.3 6.8 – –R&D Tax Incentive - non-refundable tax offset – 138.5 208.5 258.1 293.1 262.9
(continued next page).
106 TRADE AND ASSISTANCE REVIEW 2016-17

Table A.11 (continued)
2011-12 2012-13 2013-14 2014-15 2015-16 2016-17
Others measuresEnterprise Connect Innovation Centres 0.1 0.2 0.2 0.1 <0.1 –Entrepreneurs’ Infrastructure Programme - Accelerating Commercialisation – – – <0.1 0.2 0.9Entrepreneurs’ Infrastructure Programme - Business Management Skills – – – 0.1 0.3 0.1South East South Australia Innovation and Investment Fund – 0.1 – – – –Temporary Assistance for Tasmanian Exporters <0.1 – – – – –Tasmanian Freight Equalisation Scheme 0.2 0.2 0.2 0.2 0.3 0.3Small business capital gains tax rollover deferral – – – 0.6 0.1 0.1The Small Business and General Business Tax Break 0.1 <0.1 <0.1 – – –Small Business - Simplified depreciation rules <0.1 -0.2 0.7 -0.4 -0.7 3.7Small business capital gains tax 15-year asset exemption – – – 0.3 <0.1 <0.1Small business capital gains tax retirement exemption 0.9 0.9 0.9 0.3 0.1 0.5Small business capital gains tax 50 per cent reduction 2.6 2.8 2.8 0.7 0.9 1.925 per cent entrepreneurs' tax offset 0.2 0.3 – – – –
Total 745.6 483.3 515.6 524.6 515.7 521.8
Total outlays 398.1 201.7 252.0 234.8 206.1 238.9
Total tax concessions 347.5 281.6 263.7 289.8 309.6 282.9
Total budgetary assistance 745.6 483.3 515.6 524.6 515.7 521.8
– Nil. Figures may not add to totals due to rounding. a The estimates are derived primarily from Australian Government departmental annual reports and Treasury’s Tax Expenditure Statements and unpublished information provided by relevant agencies.
Source: Commission estimates.
DETAILED ESTIMATES 107

Table A.12 Australian Government budgetary assistance to manufacturing, 2011-12 to 2016-17a
$ million (nominal)
2011-12 2012-13 2013-14 2014-15 2015-16 2016-17
Food, beverages and tobaccoIndustry-specific measures
Australian Wine Industry Support – 0.5 0.5 – – –Bindaree Beef assistance – – – 0.4 11.1 –Clean Technology Investment - Food and Foundries Program 1.2 20.8 61.1 35.7 17.1 0.1Regional Food Producers' Innovation and Productivity Program 0.4 – – – – –Assistance for upgrade of Simplot Processing Plant (Tasmania) 1.0 – – – – –Wine Australia Corporation 2.8 2.7 2.9 – – –Brandy preferential excise rate 4.0 4.0 4.0 5.0 5.0 4.0
Sector-specific measuresClean Technology Investment - General Program – – 0.2 – – –Industry Growth Centres – – – 0.6 4.3 7.3Manufacturing Transition Grants Programme – – – 0.2 1.5 0.2Next Generation Manufacturing Investment Programme – – – – 0.6 1.3Victorian Innovation and Investment Fund - Ford Assistance – – – 2.0 1.8 6.0
General export measuresExport Market Development Grants Scheme 8.1 6.6 4.9 7.6 6.3 7.1TRADEX 0.5 0.5 0.5 0.5 0.6 0.6
General R&D measuresCommercialisation Australia 0.4 1.4 3.0 2.3 0.1 –Clean Business Australia - Climate Ready Program 0.3 – – – – –CSIRO 5.1 3.1 2.6 11.7 10.9 12.5Manufacturing Technology Innovation Centre – – 4.0 1.7 – –R&D Tax Incentive - refundable tax offset – 27.6 26.7 35.7 38.0 46.0R&D tax offsets - Refundable 6.9 – – – – –Premium R&D tax concession 15.6 4.2 1.8 – – –R&D tax concession 40.8 18.2 6.2 1.1 – –R&D Tax Incentive - non-refundable tax offset – 22.2 53.6 56.5 39.0 31.1
(continued next page)
108 TRADE AND ASSISTANCE REVIEW 2016-17

Table A.12 (continued)
2011-12 2012-13 2013-14 2014-15 2015-16 2016-17
Other measuresAustralian Government Innovation and Investment Fund - Tasmania – – – 1.5 1.5 0.6Enterprise Connect Innovation Centres 0.8 0.6 0.7 0.7 <0.1 –Entrepreneurs’ Infrastructure Programme - Accelerating Commercialisation – – – <0.1 0.4 0.5Entrepreneurs’ Infrastructure Programme - Business Management Skills – – – 0.2 0.8 0.9Illawarra Region Innovation and Investment Fund – 0.2 – – – –South East South Australia Innovation and Investment Fund – <0.1 – – – –Tasmanian Innovation and Investment Fund 0.5 0.5 0.3 – – –Tasmanian Jobs and Investment Fund – – – – 0.8 0.6Small business capital gains tax rollover deferral 1.3 1.5 1.6 2.9 2.4 2.5The Small Business and General Business Tax Break 10.9 3.8 0.5 – – –Small Business - Simplified depreciation rules 0.1 -0.3 1.2 -0.6 -1.1 6.5Small business capital gains tax retirement exemption 3.3 3.4 3.5 3.7 3.8 3.8Small business capital gains tax 50 per cent reduction 4.6 4.8 4.8 3.6 4.1 3.225 per cent entrepreneurs' tax offset 0.2 0.3 – – – –
Total 108.5 126.7 184.5 173.0 149.0 134.7
Textile, leather, clothing and footwearIndustry-specific measures
Clothing and Household Textile Building Innovative Capability Program 22.6 22.3 22.0 21.8 21.2 –TCF Strategic Capability Program 8.7 7.2 7.2 2.6 – –TCF Structural Adjustment Scheme 6.2 1.3 1.3 1.0 – –TCF Small Business Program 2.0 1.8 2.5 2.3 – –
Sector-specific measuresClean Technology Investment - General Program – 0.3 4.3 1.0 0.2 –Next Generation Manufacturing Investment Programme – – – – 0.4 1.1
General export measuresExport Market Development Grants Scheme 4.6 6.4 5.6 7.6 7.2 8.3TRADEX 3.7 3.9 3.9 4.2 4.8 4.4
(continued next page)
DETAILED ESTIMATES 109

Table A.12 (continued)
2011-12 2012-13 2013-14 2014-15 2015-16 2016-17
General R&D measuresCommercialisation Australia 0.1 0.1 0.1 – – –CSIRO 3.1 4.1 3.9 7.2 8.7 6.9Manufacturing Technology Innovation Centre – – 1.2 – – –R&D Tax Incentive - refundable tax offset – 4.4 4.2 5.7 6.0 7.3R&D tax offsets - Refundable 2.6 – – – – –Premium R&D tax concession 0.9 0.3 0.1 – – –R&D tax concession 2.4 1.1 0.4 0.1 – –R&D Tax Incentive - non-refundable tax offset – 1.2 2.7 1.4 1.8 5.2
Other measuresAustralian Government Innovation and Investment Fund - Tasmania – – – 0.1 0.1 0.1Enterprise Connect Innovation Centres 0.4 0.4 0.2 0.2 <0.1 –Entrepreneurs’ Infrastructure Programme - Business Management Skills – – – <0.1 0.1 0.1Tasmanian Jobs and Investment Fund – – – – <0.1 –Small business capital gains tax rollover deferral 0.1 0.1 0.2 0.3 0.2 0.3The Small Business and General Business Tax Break 1.2 0.4 0.1 – – –Small Business - Simplified depreciation rules <0.1 -0.2 0.7 -0.3 -0.6 3.2Small business capital gains tax retirement exemption 0.6 0.6 0.6 0.7 0.7 0.7Small business capital gains tax 50 per cent reduction 0.6 0.6 0.6 0.4 0.5 0.425 per cent entrepreneurs' tax offset 0.9 0.7 – – – –
Total 61.0 57.2 61.6 56.2 51.6 37.9Wood and paper products
Industry-specific measuresAustralian Paper's Maryville Pulp and Paper - Assistance – 4.2 2.9 2.4 – –
Sector-specific measuresClean Technology Investment - General Program – 8.0 3.7 2.8 0.1 –Next Generation Manufacturing Investment Programme – – – – 0.5 2.3Victorian Innovation and Investment Fund – Ford Assistance – – – 0.8 0.8 2.8
(continued next page)
110 TRADE AND ASSISTANCE REVIEW 2016-17

Table A.12 (continued)
2011-12 2012-13 2013-14 2014-15 2015-16 2016-17
Rural R&D measuresForest and Wood Products R&D 1.5 0.9 0.7 1.3 1.5 1.7
General export measuresExport Market Development Grants Scheme 0.4 0.3 0.3 0.2 0.2 0.3TRADEX 0.4 0.4 0.4 0.4 0.5 0.4
General R&D measuresCSIRO 0.9 0.7 0.7 0.7 0.8 0.9R&D Tax Incentive - refundable tax offset – 3.1 3.0 4.0 4.2 5.1R&D tax offsets - Refundable 1.7 – – – – –Premium R&D tax concession 0.1 <0.1 <0.1 – – –R&D tax concession 7.4 3.3 1.1 0.2 – –R&D Tax Incentive - non-refundable tax offset – 2.2 4.3 3.3 5.4 10.0
Other measuresAustralian Government Innovation and Investment Fund - Tasmania – – – 0.1 0.1 <0.1Enterprise Connect Innovation Centres 0.4 0.4 0.4 0.4 0.1 –Entrepreneurs’ Infrastructure Programme - Business Management Skills – – – 0.1 0.2 0.1South East South Australia Innovation and Investment Fund 0.3 0.6 – – – –Tasmanian Innovation and Investment Fund 0.4 0.3 0.1 – – –Tasmanian Jobs and Investment Fund – – – – 0.2 0.1Small Business - Simplified depreciation rules <0.1 -0.2 0.6 -0.3 -0.5 3.2Small business capital gains tax retirement exemption 1.6 1.7 1.7 1.8 1.9 1.9Small business capital gains tax 50 per cent reduction 1.9 2.0 2.0 1.5 1.7 1.325 per cent entrepreneurs' tax offset 0.3 1.1 – – – –
Total 17.3 29.0 22.0 19.6 17.3 30.2Printing and recorded media
Sector-specific measuresClean Technology Investment - General Program – 1.9 3.1 0.5 – –
General export measuresExport Market Development Grants Scheme 0.2 0.1 0.2 0.6 0.7 0.8TRADEX 0.1 0.1 0.1 0.2 0.2 0.2
(continued next page)
DETAILED ESTIMATES 111

Table A.12 (continued)
2011-12 2012-13 2013-14 2014-15 2015-16 2016-17
General R&D measuresR&D Tax Incentive - refundable tax offset – 34.5 33.4 44.6 47.4 57.4R&D tax offsets - Refundable 2.6 – – – – –Premium R&D tax concession 1.1 0.3 0.1 – – –R&D tax concession 2.1 0.9 0.3 0.1 – –R&D Tax Incentive - non-refundable tax offset – 1.3 1.5 1.0 6.1 7.2
Other measuresEnterprise Connect Innovation Centres 0.2 0.2 0.2 0.2 <0.1 –Entrepreneurs’ Infrastructure Programme - Business Management Skills – – – 0.1 0.2 0.1Illawarra Region Innovation and Investment Fund 2.9 – – – – –Tasmanian Innovation and Investment Fund 0.1 <0.1 <0.1 – – –The Small Business and General Business Tax Break 1.1 0.4 <0.1 – – –Small Business - Simplified depreciation rules <0.1 -0.2 0.6 -0.3 -0.5 3.0Small business capital gains tax retirement exemption 2.2 2.3 2.3 2.5 2.6 2.6Small business capital gains tax 50 per cent reduction 3.3 3.5 3.5 2.6 3.0 2.325 per cent entrepreneurs' tax offset 0.2 0.4 – – – –
Total 16.3 45.7 45.4 52.0 59.7 73.4
Petroleum, coal, chemical and rubber productsIndustry-specific measures
Australian Tropical Medicine Commercialisation Grants – – – – 7.0 –CSL - Commonwealth assistance 10.6 8.0 2.1 – – –Clean Technology Investment - Food and Foundries Program – – <0.1 – – –Ethanol production subsidy 115.3 108.9 102.5 103.5 – –Product Stewardship for Oil Program 36.0 33.4 40.0 49.0 63.0 72.0Small scale mammalian cell production facility 4.0 4.0 – – – –
Sector-specific measuresClean Technology Investment - General Program – 8.0 19.2 6.4 1.7 –Manufacturing Transition Grants Programme – – – 0.5 4.1 2.9Next Generation Manufacturing Investment Programme – – – – 3.4 3.5Victorian Innovation and Investment Fund - Ford Assistance – – – 0.1 0.1 0.2
(continued next page)
112 TRADE AND ASSISTANCE REVIEW 2016-17
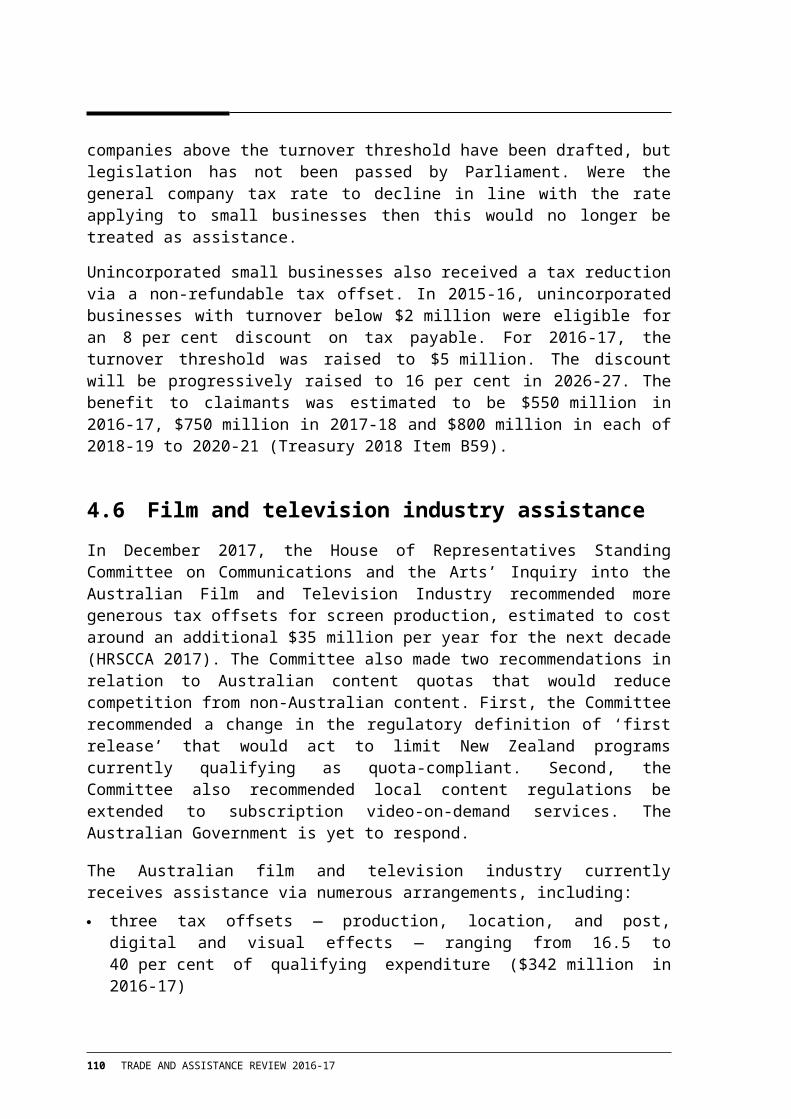
Table A.12 (continued)
2011-12 2012-13 2013-14 2014-15 2015-16 2016-17
General export measuresExport Market Development Grants Scheme 5.3 6.2 5.4 6.5 5.4 5.5TRADEX 1.4 1.4 1.4 1.5 1.8 1.6
General R&D measuresCommercialisation Australia 2.5 3.5 2.3 2.5 0.2 –COMET Program <0.1 – – – – –Commercial Ready Program 0.1 – – – – –Cooperative Research Centres 7.0 2.6 10.0 4.1 3.7 1.2Clean Business Australia - Climate Ready Program 0.2 – – – – –CSIRO 16.6 33.2 44.6 33.5 34.0 26.0Clean Technology Innovation Program – – 1.4 0.9 – –Innovation Investment Fund 1.2 1.4 1.6 1.6 3.2 2.3Manufacturing Technology Innovation Centre – – 2.4 – – –R&D Tax Incentive - refundable tax offset – 52.2 50.5 67.6 71.9 87.0R&D tax offsets - Refundable 20.7 – – – – –Premium R&D tax concession 14.2 3.9 1.6 – – –R&D tax concession 40.6 18.1 6.2 1.1 – –R&D Tax Incentive - non-refundable tax offset – 46.1 40.7 35.3 34.1 30.3
Other measuresAustralian Government Innovation and Investment Fund - Tasmania – – – 0.3 0.3 –Enterprise Connect Innovation Centres 0.6 0.8 0.5 0.5 <0.1 –Entrepreneurs’ Infrastructure Programme - Accelerating Commercialisation – – – 0.2 1.7 2.5Entrepreneurs’ Infrastructure Programme - Business Management Skills – – – 0.1 0.4 0.3Illawarra Region Innovation and Investment Fund – 0.8 – – – –Tasmanian Innovation and Investment Fund <0.1 <0.1 – – – –Tasmanian Jobs and Investment Fund – – – – 0.1 0.1The Small Business and General Business Tax Break 1.7 0.6 0.1 – – –Small Business - Simplified depreciation rules <0.1 -0.1 0.5 -0.2 -0.4 2.7Small business capital gains tax 50 per cent reduction 1.0 1.0 1.0 0.8 0.9 0.725 per cent entrepreneurs' tax offset 0.1 0.4 – – – –
Total 279.2 334.4 333.9 315.7 236.6 238.8
(continued next page)
DETAILED ESTIMATES 113

Table A.12 (continued)
2011-12 2012-13 2013-14 2014-15 2015-16 2016-17
Non-Metallic mineral productsSector-specific measures
Clean Technology Investment - General Program – 5.7 16.8 6.2 1.0 –Manufacturing Transition Grants Programme – – – 0.5 3.7 2.0Next Generation Manufacturing Investment Programme – – – – 0.6 1.5Victorian Innovation and Investment Fund - Ford Assistance – – – 0.4 0.4 –
General export measuresExport Market Development Grants Scheme 0.4 0.3 0.6 0.6 0.9 0.5TRADEX 0.1 0.2 0.2 0.2 0.2 0.2
General R&D measuresCommercialisation Australia 0.3 0.6 0.3 1.7 0.1 –CSIRO 1.5 1.9 1.8 2.4 2.9 2.7Clean Technology Innovation Program – 0.1 – – – –R&D Tax Incentive - refundable tax offset – 7.3 7.0 9.4 10.0 12.1R&D tax offsets - Refundable 5.0 – – – – –Premium R&D tax concession 0.2 <0.1 <0.1 – – –R&D tax concession 6.6 2.9 1.0 0.2 – –R&D Tax Incentive - non-refundable tax offset – 3.0 5.4 4.5 4.1 5.3
Other measuresAustralian Government Innovation and Investment Fund - Tasmania – – – – – 0.1Enterprise Connect Innovation Centres 0.1 0.1 0.2 0.1 <0.1 –Entrepreneurs’ Infrastructure Programme - Accelerating Commercialisation – – – <0.1 <0.1 <0.1Entrepreneurs’ Infrastructure Programme - Business Management Skills – – – <0.1 0.2 0.1Illawarra Region Innovation and Investment Fund – 0.1 – – – –South East South Australia Innovation and Investment Fund – 0.2 – – – –Tasmanian Innovation and Investment Fund <0.1 – <0.1 – – –The Small Business and General Business Tax Break 1.9 0.7 0.1 – – –Small Business - Simplified depreciation rules <0.1 -0.1 0.3 -0.1 -0.3 1.7Small business capital gains tax 50 per cent reduction 0.4 0.4 0.4 0.3 0.3 0.325 per cent entrepreneurs' tax offset 0.2 0.4 – – – –
Total 16.7 23.7 34.1 26.4 24.3 26.5
(continued next page)
114 TRADE AND ASSISTANCE REVIEW 2016-17

Table A.12 (continued)
2011-12 2012-13 2013-14 2014-15 2015-16 2016-17
Metal and fabricated metal productsIndustry-specific measures
Alcoa Portland Assistance – – – – – 30.0Clean Technology Investment - Food and Foundries Program – 0.9 1.0 0.7 – –Steel Transformation Plan 164.0 – – – – –
Sector-specific measuresClean Technology Investment - General Program – 3.1 2.4 1.6 0.1 –Manufacturing Transition Grants Programme – – – 0.6 4.7 1.8Next Generation Manufacturing Investment Programme – – – – 2.7 4.0Victorian Innovation and Investment Fund - Ford Assistance – – – 0.5 0.5 1.2
General export measuresExport Market Development Grants Scheme 2.2 2.2 2.6 2.6 2.7 2.0TRADEX 1.1 1.2 1.2 1.3 1.5 1.3
General R&D measuresCommercialisation Australia 1.1 2.4 1.6 0.8 0.1 –Cooperative Research Centres 5.5 – – – – –CSIRO 22.5 31.9 31.9 36.4 37.6 39.6Clean Technology Innovation Program – 0.1 0.2 0.1 – –Innovation Investment Fund 0.2 0.3 0.3 0.3 0.6 0.4R&D Tax Incentive - refundable tax offset – 26.9 26.0 34.8 37.0 44.8R&D tax offsets - Refundable 8.0 – – – – –Premium R&D tax concession 24.8 6.8 2.8 – – –R&D tax concession 50.4 22.5 7.6 1.3 – –R&D Tax Incentive - non-refundable tax offset – 256.9 215.5 171.9 118.3 126.8
Other measuresAustralian Government Innovation and Investment Fund - Tasmania – – – <0.1 <0.1 0.3Enterprise Connect Innovation Centres 0.9 1.0 1.1 0.8 <0.1 –Entrepreneurs’ Infrastructure Programme - Accelerating Commercialisation – – – 0.1 0.5 0.1Entrepreneurs’ Infrastructure Programme - Business Management Skills – – – 0.2 0.7 0.5Illawarra Region Innovation and Investment Fund – 0.1 – – – –
(continued next page)
DETAILED ESTIMATES 115

Table A.12 (continued)
2011-12 2012-13 2013-14 2014-15 2015-16 2016-17
Other measures (continued)South East South Australia Innovation and Investment Fund 0.1 0.5 – – – –Tasmanian Innovation and Investment Fund 0.8 0.7 0.1 – – –Tasmanian Jobs and Investment Fund – – – – 0.5 0.4Small business capital gains tax rollover deferral 0.2 0.3 0.3 0.5 0.4 0.4The Small Business and General Business Tax Break 3.5 1.2 0.1 – – –Small Business - Simplified depreciation rules 0.1 -0.4 1.5 -0.7 -1.4 8.0Small business capital gains tax retirement exemption 1.0 1.0 1.0 1.1 1.1 1.1Small business capital gains tax 50 per cent reduction 1.2 1.3 1.3 1.0 1.1 0.825 per cent entrepreneurs' tax offset 1.0 1.4 – – – –
Total 288.7 362.2 298.7 255.8 208.8 263.8Motor vehicles and parts
Industry-specific measuresAutomotive Transformation Scheme 381.0 334.4 332.8 269.4 222.7 168.5Automotive Industry Structural Adjustment Program 16.8 – – – – –Automotive Market Access Program 0.5 – – – – –Automotive New Markets Initiative – 2.9 6.3 3.8 0.3 –Automotive Supply Chain Development Program 5.4 4.4 – – – –Automotive Diversification Programme – – – 2.2 8.8 4.3Ford Australia Assistance 34.0 – – – – –Green Car Innovation Fund 125.5 47.4 6.0 0.1 – –Toyota Major Facelift Vehicle and Supplier Grant – – – 15.5 2.1 1.0
Sector-specific measuresClean Technology Investment - General Program – 0.8 1.8 0.4 – –Manufacturing Transition Grants Programme – – – 0.1 1.1 0.3Next Generation Manufacturing Investment Programme – – – – 1.2 1.2Victorian Innovation and Investment Fund - Ford Assistance – – – 1.4 1.2 1.2
General export measuresExport Market Development Grants Scheme 0.9 1.0 0.9 0.9 0.7 0.4TRADEX 24.4 25.6 25.4 27.1 31.3 28.7
General R&D measuresCommercialisation Australia 1.2 0.8 0.1 <0.1 – –COMET Program <0.1 – – – – –
(continued next page)
116 TRADE AND ASSISTANCE REVIEW 2016-17
Table A.12 (continued)
2011-12 2012-13 2013-14 2014-15 2015-16 2016-17
General R&D measures (continued)Cooperative Research Centres 5.0 10.7 1.1 6.1 4.4 3.6Clean Business Australia - Climate Ready Program 0.2 – – – – –CSIRO 4.4 2.2 1.8 – – –R&D Tax Incentive - refundable tax offset – 15.7 15.2 20.4 21.7 26.2R&D tax offsets - Refundable 5.3 – – – – –Premium R&D tax concession 3.7 1.0 0.4 – – –R&D tax concession 15.5 6.9 2.3 0.4 – –R&D Tax Incentive - non-refundable tax offset – 3.3 4.0 2.7 2.8 5.2
Other measuresEnterprise Connect Innovation Centres 0.2 0.1 0.1 0.1 <0.1 –Entrepreneurs’ Infrastructure Programme - Accelerating Commercialisation – – – – – 0.2Entrepreneurs’ Infrastructure Programme - Business Management Skills – – – <0.1 0.1 0.1Small Business - Simplified depreciation rules <0.1 -0.1 0.2 -0.1 -0.2 1.5Small business capital gains tax 50 per cent reduction 1.4 1.4 1.4 1.1 1.2 0.925 per cent entrepreneurs' tax offset 0.1 0.1 – – – –
Total 625.4 458.6 399.9 351.8 299.4 243.4Other transport equipment
Sector-specific measuresVictorian Innovation and Investment Fund - Ford Assistance
– – – 1.3 1.2 0.5
General export measuresExport Market Development Grants Scheme 1.1 1.0 0.5 1.0 0.8 1.1TRADEX 0.1 0.1 0.1 0.1 0.1 0.1
General R&D measuresCommercialisation Australia 0.6 0.5 0.3 0.3 0.1 –Cooperative Research Centres 5.1 6.0 5.3 5.3 6.7 6.6CSIRO 3.1 3.5 3.5 4.6 4.6 3.8R&D Tax Incentive - refundable tax offset – 7.9 7.6 10.2 10.9 13.1R&D tax offsets - Refundable 3.6 – – – – –Premium R&D tax concession 1.2 0.3 0.1 – – –R&D tax concession 5.2 2.3 0.8 0.1 – –R&D Tax Incentive – non-refundable tax offset – 1.0 2.7 6.6 15.9 7.4
(continued next page)
DETAILED ESTIMATES 117

Table A.12 (continued)
2011-12 2012-13 2013-14 2014-15 2015-16 2016-17
Other measuresAustralian Government Innovation and Investment Fund - Tasmania – – – 0.6 0.6 –Enterprise Connect Innovation Centres <0.1 0.1 0.1 0.1 <0.1 –Entrepreneurs’ Infrastructure Programme - Accelerating Commercialisation – – – 0.1 1.1 1.2Entrepreneurs’ Infrastructure Programme - Business Management Skills – – – <0.1 0.2 0.1Tasmanian Jobs and Investment Fund – – – – <0.1 –The Small Business and General Business Tax Break 0.9 0.3 <0.1 – – –Small Business - Simplified depreciation rules <0.1 -0.1 0.3 -0.2 -0.3 1.6Small business capital gains tax 50 per cent reduction 0.7 0.7 0.7 0.5 0.6 0.525 per cent entrepreneurs' tax offset 0.4 0.4 – – – –
Total 22.0 24.3 22.3 30.7 42.5 36.2Machinery and equipment manufacturing
Sector-specific measuresClean Technology Investment - General Program – 1.3 1.9 1.6 0.2 –Manufacturing Transition Grants Programme – – – 0.5 4.0 1.4Next Generation Manufacturing Investment Programme – – – – 1.8 7.2Victorian Innovation and Investment Fund - Ford Assistance – – – 1.5 1.4 0.2
General export measuresExport Market Development Grants Scheme 9.7 8.1 8.9 11.7 10.0 9.3TRADEX 3.0 3.1 3.1 3.3 3.8 3.5
General R&D measuresCommercialisation Australia 11.4 12.6 12.4 6.2 0.9 –COMET Program 0.1 – – – – –Commercial Ready Program <0.1 – – – – –Cooperative Research Centres 2.0 – – 3.3 6.2 –Clean Business Australia - Climate Ready Program 2.9 – – – – –CSIRO 3.7 5.0 6.9 25.5 23.6 18.0Clean Technology Innovation Program – 0.8 10.3 4.3 1.1 –R&D Tax Incentive - refundable tax offset – 106.5 103.1 137.8 146.6 177.4R&D tax offsets - Refundable 39.3 – – – – –Premium R&D tax concession 19.1 5.2 2.2 – – –R&D tax concessions 54.5 24.3 8.3 1.5 – –
(continued next page)
118 TRADE AND ASSISTANCE REVIEW 2016-17

Table A.12 (continued)
2011-12 2012-13 2013-14 2014-15 2015-16 2016-17
General R&D measures (continued)R&D Tax Incentive - non-refundable tax offset – 63.5 46.6 37.2 36.2 42.2
Other measuresEnterprise Connect Innovation Centres 1.1 0.9 0.9 0.7 0.1 –Entrepreneurs’ Infrastructure Programme - Accelerating Commercialisation – – – 0.7 6.1 9.4Entrepreneurs’ Infrastructure Programme - Business Management Skills – – – 0.3 0.9 0.5Illawarra Region Innovation and Investment Fund 0.7 0.1 – – – –Tasmanian Innovation and Investment Fund 0.1 <0.1 <0.1 – – –Tasmanian Jobs and Investment Fund – – – – – 0.2The Small Business and General Business Tax Break 4.9 1.7 0.2 – – –Small Business - Simplified depreciation rules <0.1 -0.2 0.9 -0.4 -0.9 5.2Small business capital gains tax 50 per cent reduction 1.2 1.2 1.2 0.9 1.0 0.825 per cent entrepreneurs' tax offset 0.3 0.4 – – – –
Total 154.0 234.7 206.9 236.7 243.0 275.3Furniture and other manufacturing
Sector-specific measuresClean Technology Investment - General Program – 0.1 1.1 0.3 – –Manufacturing Transition Grants Programme – – – 0.1 1.0 1.1Next Generation Manufacturing Investment Programme – – – – 0.3 0.3Victorian Innovation and Investment Fund - Ford Assistance – – – 0.5 0.5 –
General export measuresExport Market Development Grants Scheme 6.0 6.1 4.5 6.0 4.6 4.3TRADEX 1.2 1.2 1.2 1.3 1.5 1.4
General R&D measuresCommercialisation Australia 2.1 3.0 2.2 0.9 – –COMET Program <0.1 – – – – –Cooperative Research Centres 6.8 6.8 2.1 – – –CSIRO 6.7 4.5 4.4 1.9 1.5 5.8Manufacturing Technology Innovation Centre – – 1.2 – – –R&D Tax Incentive – refundable tax offset – 8.1 7.8 10.5 11.1 13.5
(continued next page)
DETAILED ESTIMATES 119

Table A.12 (continued)
2011-12 2012-13 2013-14 2014-15 2015-16 2016-17
General R&D measures (continued)R&D tax offsets - Refundable 3.4 – – – – –Premium R&D tax concession 0.4 0.1 0.1 – – –R&D tax concession 2.3 1.0 0.3 0.1 – –R&D Tax Incentive - non-refundable tax offset – 1.1 2.8 0.7 0.2 0.4
Other measuresEnterprise Connect Innovation Centres 0.3 0.2 0.2 0.3 <0.1 –Entrepreneurs’ Infrastructure Programme - Accelerating Commercialisation – – – 0.1 1.2 0.2Entrepreneurs’ Infrastructure Programme - Business Management Skills – – – 0.1 0.3 0.2Illawarra Region Innovation and Investment Fund 0.3 0.2 – – – –Tasmanian Innovation and Investment Fund 0.2 0.1 <0.1 – – –Tasmanian Jobs and Investment Fund – – – – – <0.1The Small Business and General Business Tax Break 1.0 0.3 <0.1 – – –Small Business - Simplified depreciation rules <0.1 -0.2 0.8 -0.4 -0.7 4.0Small business capital gains tax 50 per cent reduction 0.9 1.0 1.0 0.7 0.8 0.625 per cent entrepreneurs' tax offset 0.7 0.9 – – – –
Total 32.3 34.7 29.8 23.0 22.4 31.9Unallocated manufacturing
Industry-specific measuresIndustry Skilling Program Enhancement 1.2 0.2 0.2 0.2 – 0.7New Aircraft Combat Capability 3.3 2.0 2.0 0.9 2.8 2.7Priority Industry Capability Innovation Program 13.3 10.4 – – – –Skilling Australian Defence Industry 14.6 16.9 12.2 6.6 5.5 –
Sector-specific measuresClean Technology Investment - General Program <0.1 – – – – –Industry Growth Centres – – – 2.1 15.0 21.6Clean Business Australia - Re-tooling for Climate Change 4.2 – – – – –
General export measuresDuty Drawback 62.5 69.1 62.7 86.4 161.3 161.3
General R&D measuresCentre for Defence Industry Capability Program – – – – – 0.4Cooperative Research Centres – – – 3.2 5.6 12.6CSIRO 12.8 12.3 12.0 10.8 11.7 15.1Defence Materials Technology Centre 5.4 6.8 6.8 4.5 6.1 7.0Energy Innovation Fund 32.7 – – – – –Manufacturing Technology Innovation Centre – 2.8 1.2 2.6 – –
(continued next page)
120 TRADE AND ASSISTANCE REVIEW 2016-17

Table A.12 (continued)
2011-12 2012-13 2013-14 2014-15 2015-16 2016-17
Other measuresEnterprise Connect Innovation Centres 0.1 <0.1 – – – –Illawarra Region Innovation and Investment Fund – – – – 0.8 –Melbourne's North Innovation and Investment Fund – – 18.8 6.2 – –Temporary Assistance for Tasmanian Exporters 9.9 – – – – –Tasmanian Freight Equalisation Scheme 65.5 78.0 71.4 78.5 91.1 96.6Tasmanian Jobs and Growth Package – – 5.1 30.9 19.4 13.8Tasmanian Jobs and Investment Fund – – – – 0.5 –Small business capital gains tax 15-year asset exemption 4.5 4.6 5.3 4.9 6.3 6.1
Total 230.0 203.2 197.9 237.7 326.2 337.8
Total outlays 1376.1 1250.3 1266.0 1291.8 1176.8 1179.2
Total tax concessions 475.4 684.1 570.9 486.9 504.1 550.5
Total budgetary assistance 1851.5 1934.4 1836.9 1778.7 1680.9 1729.8
– Nil. Figures may not add to totals due to rounding. a The estimates are derived primarily from Australian Government departmental annual reports and Treasury’s Tax Expenditure Statements and unpublished information provided by relevant agencies.
Source: Commission estimates.
DETAILED ESTIMATES 121

Table A.13 Australian Government budgetary assistance to services, 2011-12 to 2016-17a
$ million (nominal)
2011-12 2012-13 2013-14 2014-15 2015-16 2016-17
Electricity, gas, water and waste servicesIndustry-specific measures
Carbon Capture and Storage Flagships Program 6.8 13.8 27.1 61.1 44.1 24.5Diamond Energy Assistance – – 0.3 0.3 – –Energy Brix Australia Corporation – 9.1 36.0 61.4 – –Energy Security Fund - transitional assistance 1000.0 – – – – –Solar Flagships Programs 3.8 – – – – –
General export measuresExport Market Development Grants Scheme 0.3 0.3 0.4 0.4 0.7 0.7TRADEX 0.1 0.1 0.1 0.1 0.1 0.1
General investment measuresInfrastructure bonds scheme 0.3 – – – – –
General R&D measuresCommercialisation Australia 0.9 0.4 2.3 0.9 0.3 –Clean Business Australia - Climate Ready Program <0.1 – – – – –CSIRO 48.6 52.0 39.7 50.4 47.8 43.9Clean Technology Innovation Program – 0.2 4.3 0.3 0.3 –Innovation Investment Fund 2.8 3.3 3.9 3.8 7.7 5.4R&D Tax Incentive - refundable tax offset – 26.1 25.3 33.8 36.0 43.6R&D tax offsets - Refundable 8.6 – – – – –Premium R&D tax concession 13.5 3.7 1.5 – – –R&D tax concession 19.3 8.6 2.9 0.5 – –R&D Tax Incentive - non-refundable tax offset – 23.2 21.6 14.7 15.3 20.8
Other measuresEnterprise Connect Innovation Centres 0.3 0.2 0.1 0.2 <0.1 –Entrepreneurs’ Infrastructure Programme - Accelerating Commercialisation – – – <0.1 0.1 1.2Entrepreneurs’ Infrastructure Programme - Business Management Skills – – – <0.1 0.2 <0.1Illawarra Region Innovation and Investment Fund 0.2 1.2 – – – –South East South Australia Innovation and Investment Fund – 0.1 – – – –Tasmanian Jobs and Investment Fund – – – – – 1.2
(continued next page)
122 TRADE AND ASSISTANCE REVIEW 2016-17

Table A.13 (continued)
2011-12 2012-13 2013-14 2014-15 2015-16 2016-17
Other measures (continued)Small business capital gains tax rollover deferral – – – 0.8 1.8 0.6Small Business - Simplified depreciation rules <0.1 -0.1 0.5 -0.3 -0.5 3.1Small business capital gains tax 15-year asset exemption – – – 0.2 0.6 0.5Small business capital gains tax retirement exemption – – – 0.9 0.9 1.2Small business capital gains tax 50 per cent reduction 0.5 0.5 0.5 1.8 2.3 2.525 per cent entrepreneurs' tax offset 0.2 0.4 – – – –
Total 1106.1 142.9 166.5 231.5 157.7 149.3Construction
Sector-specific measuresClean Technology Investment - General Program – 4.0 1.8 0.6 – –
General export measuresExport Market Development Grants Scheme 0.9 0.3 0.9 1.5 1.1 0.8TRADEX <0.1 <0.1 <0.1 <0.1 <0.1 <0.1
General R&D measuresCommercialisation Australia – 0.3 2.9 1.8 0.2 –Commercial Ready Program 0.5 – – – – –Cooperative Research Centres – 2.0 2.8 8.6 1.7 4.5Clean Business Australia - Climate Ready Program <0.1 – – – – –CSIRO 2.8 2.6 3.0 – – –Clean Technology Innovation Program – – 0.1 <0.1 – –R&D Tax Incentive - refundable tax offset – 44.9 43.5 58.1 61.8 74.8R&D tax offsets - Refundable 13.7 – – – – –Premium R&D tax concession 15.0 4.1 1.7 – – –R&D tax concession 41.2 18.4 6.2 1.1 – –R&D Tax Incentive – non-refundable tax offset – 30.5 31.7 39.7 39.4 34.7
Other measuresAustralian Government Innovation and Investment Fund - Tasmania – – – 0.1 0.1 –Enterprise Connect Innovation Centres 0.5 0.5 0.5 0.7 <0.1 –Entrepreneurs’ Infrastructure Programme - Accelerating Commercialisation – – – <0.1 0.1 0.8Entrepreneurs’ Infrastructure Programme - Business Management Skills – – – 0.2 0.9 0.8South East South Australia Innovation and Investment Fund – <0.1 – – – –
(continued next page)
DETAILED ESTIMATES 123

Table A.13 (continued)
2011-12 2012-13 2013-14 2014-15 2015-16 2016-17
Other measures (continued)Tasmanian Jobs and Investment Fund – – – – 0.1 <0.1Small business capital gains tax rollover deferral 1.2 1.5 1.5 6.3 4.3 3.8The Small Business and General Business Tax Break 58.2 20.2 2.4 – – –Small Business - Simplified depreciation rules 1.6 -9.0 32.5 -16.4 -33.0 182.6Small business capital gains tax 15-year asset exemption 2.9 3.0 3.4 2.9 6.6 6.0Small business capital gains tax retirement exemption 6.2 6.4 6.6 10.2 12.5 10.4Small business capital gains tax 50 per cent reduction 15.1 16.0 16.0 16.3 17.3 9.925 per cent entrepreneurs' tax offset 50.8 52.0 – – – –
Total 210.6 197.6 157.6 131.7 113.0 329.0Wholesale trade
Industry-specific measuresTCF Small Business Program <0.1 <0.1 – – – –
Sector-specific measuresNext Generation Manufacturing Investment Programme – – – – – 0.5Victorian Innovation and Investment Fund - Ford Assistance – – – 0.2 0.2 –
General export measuresExport Market Development Grants Scheme 10.3 10.6 8.6 10.9 10.8 11.0TRADEX 1.8 1.9 1.9 2.0 2.3 2.1
General R&D measuresCommercialisation Australia 1.8 0.8 0.5 0.1 – –Clean Business Australia - Climate Ready Program 0.1 – – – – –R&D Tax Incentive - refundable tax offset – 53.3 51.6 69.0 73.4 88.8R&D tax offsets - Refundable 25.9 – – – – –Premium R&D tax concession 31.5 8.6 3.6 – – –R&D tax concession 91.7 41.0 13.9 2.5 – –R&D Tax Incentive – non-refundable tax offset – 27.1 59.7 75.4 47.2 49.0
Other measuresAustralian Government Innovation and Investment Fund - Tasmania – – – 0.2 0.2 <0.1Enterprise Connect Innovation Centres 0.3 0.3 0.3 0.3 <0.1 –
(continued next page)
124 TRADE AND ASSISTANCE REVIEW 2016-17

Table A.13 (continued)
2011-12 2012-13 2013-14 2014-15 2015-16 2016-17
Other measures (continued)Entrepreneurs’ Infrastructure Programme - Accelerating Commercialisation – – – – – 1.3Entrepreneurs’ Infrastructure Programme - Business Management Skills – – – 0.1 0.3 1.2South East South Australia Innovation and Investment Fund 0.1 1.5 – – – –Tasmanian Jobs and Investment Fund – – – – – 0.3Small business capital gains tax rollover deferral – – – 5.0 2.7 2.8The Small Business and General Business Tax Break 96.9 33.7 4.0 – – –Small Business - Simplified depreciation rules 0.3 -1.7 6.3 -3.1 -6.1 37.1Small business capital gains tax 15-year asset exemption 3.2 3.3 3.8 3.1 4.7 5.2Small business capital gains tax retirement exemption 7.6 7.8 8.0 10.0 11.5 9.1Small business capital gains tax 50 per cent reduction 12.8 13.5 13.5 13.8 14.3 9.725 per cent entrepreneurs' tax offset 1.2 1.1 – – – –
Total 285.6 202.6 175.6 189.5 161.5 218.2Retail trade
Industry-specific measuresLPG Vehicle Scheme 18.8 5.2 – – – –TCF Small Business Program – <0.1 – – – –
Sector-specific measuresVictorian Innovation and Investment Fund - Ford Assistance – – – 0.7 0.6 1.8
General export measuresExport Market Development Grants Scheme 1.2 1.0 1.6 2.6 3.4 5.3TRADEX 2.3 2.4 2.4 2.6 2.9 2.7
General R&D measuresCommercialisation Australia 0.1 0.6 0.2 0.6 0.4 –R&D Tax Incentive - refundable tax offset – 23.2 22.5 30.1 32.0 38.7R&D tax offsets - Refundable 11.9 – – – – –Premium R&D tax concession 3.4 0.9 0.4 – – –R&D tax concession 14.0 6.2 2.1 0.4 – –R&D Tax Incentive - non-refundable tax offset – 22.4 11.1 7.9 8.3 8.5
(continued next page)
DETAILED ESTIMATES 125

Table A.13 (continued)
2011-12 2012-13 2013-14 2014-15 2015-16 2016-17
Other measuresEnterprise Connect Innovation Centres 0.2 0.1 0.2 0.1 <0.1 –Entrepreneurs’ Infrastructure Programme - Accelerating Commercialisation – – – 0.1 0.6 0.2Entrepreneurs’ Infrastructure Programme - Business Management Skills – – – <0.1 0.1 0.5South East South Australia Innovation and Investment Fund – 0.2 – – – –Tasmanian Jobs and Investment Fund – – – – 0.1 0.1Small business capital gains tax rollover deferral 5.6 6.6 6.9 15.4 10.7 9.8The Small Business and General Business Tax Break 26.6 9.2 1.1 – – –Small Business - Simplified depreciation rules 0.6 -3.3 11.8 -5.7 -11.1 64.2Small business capital gains tax 15-year asset exemption 2.2 2.3 2.6 11.1 8.7 8.1Small business capital gains tax retirement exemption 17.0 17.5 17.9 20.5 19.8 16.7Small business capital gains tax 50 per cent reduction 29.6 31.2 31.2 34.5 35.6 29.325 per cent entrepreneurs' tax offset 2.8 3.1 – – – –
Total 136.2 128.8 112.0 120.7 112.1 186.0Accommodation and food services
General export measuresExport Market Development Grants Scheme 3.2 3.3 2.8 4.3 4.1 3.4
General R&D measuresCommercialisation Australia 0.1 <0.1 – – – –R&D Tax Incentive - refundable tax offset – 2.9 2.8 3.7 4.0 4.8R&D tax offsets - Refundable 1.3 – – – – –R&D tax concession 0.8 0.3 0.1 <0.1 – –R&D Tax Incentive - non-refundable tax offset – 3.3 1.4 0.8 0.6 0.8
Other measuresAustralian Government Innovation and Investment Fund - Tasmania – – – 0.2 0.2 <0.1Enterprise Connect Innovation Centres <0.1 0.3 0.3 0.2 <0.1 –Entrepreneurs’ Infrastructure Programme - Business Management Skills – – – <0.1 0.1 0.1Tasmanian Jobs and Investment Fund – – – – 0.8 0.3Small business capital gains tax rollover deferral 10.3 12.1 12.7 13.6 9.2 12.9The Small Business and General Business Tax Break 4.6 1.6 0.2 – – –
(continued next page)
126 TRADE AND ASSISTANCE REVIEW 2016-17

Table A.13 (continued)
2011-12 2012-13 2013-14 2014-15 2015-16 2016-17
Other measures (continued)Small Business - Simplified depreciation rules 0.4 -2.1 7.8 -4.0 -8.1 45.8Small business capital gains tax 15-year asset exemption 0.8 0.9 1.0 9.9 8.5 5.4Small business capital gains tax retirement exemption 13.0 13.4 13.7 18.7 16.8 14.1Small business capital gains tax 50 per cent reduction 32.3 34.1 34.1 34.8 32.9 37.925 per cent entrepreneurs' tax offset 1.0 0.8 – – – –
Total 67.7 70.8 76.9 82.2 69.0 125.4Transport, postal and warehousing
Industry-specific measuresPayment scheme for Airservices Australia's en route charges 4.2 1.0 1.0 1.3 1.3 1.5Bass Straight Passenger Vehicle Equalisation 34.6 34.5 37.5 40.9 44.1 47.8
Sector-specific measuresExceptional Circumstances - interest rate subsidies 0.3 – – – – –Exceptional Circumstances - relief payments <0.1 – – – – –Interim Income Support <0.1 – – – – –
General export measuresExport Market Development Grants Scheme 2.7 2.6 2.1 3.0 2.3 1.9TRADEX 0.3 0.3 0.3 0.3 0.4 0.3
General investment measuresInfrastructure bonds scheme 0.2 – – – – –
General R&D measuresCommercialisation Australia 0.7 0.6 <0.1 <0.1 – –COMET Program <0.1 – – – – –CSIRO 5.3 1.4 3.5 4.8 4.7 12.6R&D Tax Incentive - refundable tax offset – 9.2 8.9 12.0 12.7 15.4R&D tax offsets - Refundable 3.9 – – – – –Premium R&D tax concession 14.0 3.8 1.6 – – –R&D tax concession 22.8 10.2 3.5 0.6 – –R&D Tax Incentive - non-refundable tax offset – 51.7 42.5 24.5 18.1 12.3
Other measuresAustralian Government Innovation and Investment Fund - Tasmania – – – 0.3 0.4 –Enterprise Connect Innovation Centres 0.1 0.1 0.3 0.5 0.1 –Entrepreneurs’ Infrastructure Programme - Accelerating Commercialisation – – – – – 0.1Entrepreneurs Infrastructure Programme – Business Management Skills – – – 0.2 0.6 0.2
(continued next page)
DETAILED ESTIMATES 127

Table A.13 (continued)
2011-12 2012-13 2013-14 2014-15 2015-16 2016-17
Other measures (continued)Illawarra Region Innovation and Investment Fund – <0.1 – – – –Temporary Assistance for Tasmanian Exporters 5.9 – – – – –Tasmanian Innovation and Investment Fund 0.2 0.2 <0.1 – – –Tasmanian Jobs and Investment Fund – – – – 0.3 0.4Small business capital gains tax rollover deferral – – – 3.3 2.5 2.2The Small Business and General Business Tax Break 126.4 43.9 5.3 – – –Small Business - Simplified depreciation rules 0.6 -3.4 12.3 -6.2 -12.4 70.9Small business capital gains tax 15-year asset exemption 1.9 1.9 2.2 3.4 5.6 4.9Small business capital gains tax retirement exemption 1.3 1.4 1.4 7.0 6.0 6.9Small business capital gains tax 50 per cent reduction 7.9 8.3 8.3 9.6 9.3 11.225 per cent entrepreneurs' tax offset 12.3 13.3 – – – –
Total 245.7 181.0 130.7 105.6 95.9 188.5Information, media and telecommunications
Industry-specific measuresCommunity Broadcasting Program <0.1 14.9 18.2 29.1 16.7 15.5Data Retention Industry Grants Programme – – – – – 120.1Vodafone Hutchison Australia - Tasmania Call Centre Expansion – 4.0 – – – –Rebate for broadcasting licence fees 130.0 155.0 – – – –Regional Equalisation Plan 1.1 1.0 4.7 4.6 1.0 1.0
Sector-specific measuresIndustry Growth Centres – – – – – 4.2
General export measuresExport Market Development Grants Scheme 19.2 18.2 17.0 17.3 18.5 17.0
General R&D measuresCommercialisation Australia 8.1 9.3 11.1 8.2 1.0 –COMET Program <0.1 – – – – –Cooperative Research Centres 4.4 4.4 4.4 – – –CSIRO 12.1 17.0 21.9 23.1 24.9 56.0Clean Technology Innovation Program – 0.8 1.1 0.1 – –ICT centre of excellence 25.0 23.8 22.5 21.4 21.0 –Innovation Investment Fund 0.1 0.1 0.2 0.1 0.3 0.2R&D Tax Incentive - refundable tax offset – 79.3 76.8 102.7 109.2 132.2R&D tax offsets - Refundable 18.9 – – – – –Premium R&D tax concession 28.9 7.9 3.3 – – –R&D tax concession 39.2 17.5 5.9 1.0 – –
(continued next page)
128 TRADE AND ASSISTANCE REVIEW 2016-17
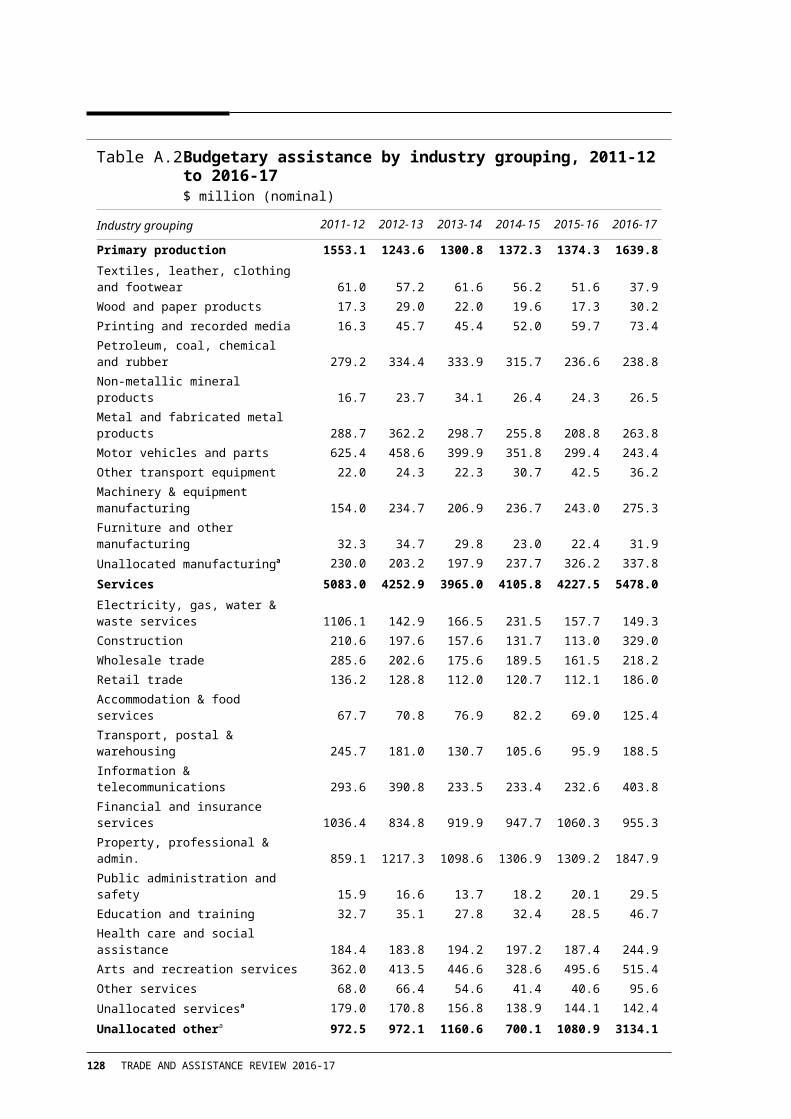
Table A.13 (continued)
2011-12 2012-13 2013-14 2014-15 2015-16 2016-17
General R&D measures (continued)R&D Tax Incentive - non-refundable tax offset – 32.3 42.3 22.4 28.5 33.6
Other measuresEnterprise Connect Innovation Centres 0.1 0.1 0.1 0.2 <0.1 –Entrepreneurs’ Infrastructure Programme - Accelerating Commercialisation – – – 0.6 5.8 5.6Entrepreneurs’ Infrastructure Programme - Business Management Skills – – – 0.1 0.4 <0.1Illawarra Region Innovation and Investment Fund – 0.1 – – – –Tasmanian Economic Diversification Projects - OfficeMax – – 0.6 – – –Small business capital gains tax rollover deferral – – – 0.4 1.3 1.7The Small Business and General Business Tax Break 3.5 1.2 0.1 – – –Small Business - Simplified depreciation rules 0.1 -0.5 1.8 -0.9 -1.8 10.2Small business capital gains tax 15-year asset exemption – – – 0.1 0.9 0.2Small business capital gains tax retirement exemption – – – 0.8 1.1 1.1Small business capital gains tax 50 per cent reduction 1.4 1.5 1.5 1.9 3.8 5.025 per cent entrepreneurs' tax offset 1.4 3.0 – – – –
Total 293.6 390.8 233.5 233.4 232.4 403.8Financial and insurance services
Industry-specific measuresHigh Costs Claims Scheme 20.3 33.4 30.1 47.2 49.9 47.7Offshore banking unit tax concession 140.0 185.0 200.0 250.0 295.0 325.0Venture capital limited partnerships 11.5 11.5 11.5 11.5 11.5 11.5
General export measuresExport Market Development Grants Scheme 0.2 0.8 1.1 1.2 1.0 1.2TRADEX <0.1 <0.1 <0.1 <0.1 <0.1 <0.1
General R&D measuresCommercialisation Australia 0.9 1.1 1.2 0.5 0.1 –CSIRO 2.2 – 2.3 1.8 1.8 3.1Innovation Investment Fund 6.9 8.1 9.5 9.2 18.8 13.2R&D Tax Incentive - refundable tax offset – 41.7 40.3 53.9 57.4 69.4R&D tax offsets - Refundable 106.7 – – – – –Premium R&D tax concession 71.7 19.6 8.2 – – –R&D tax concession 182.5 81.5 27.9 4.9 – –R&D Tax Incentive - non-refundable tax offset – 177.6 192.1 120.9 64.1 42.8
(continued next page)
DETAILED ESTIMATES 129

Table A.13 (continued)
2011-12 2012-13 2013-14 2014-15 2015-16 2016-17
Other measuresEnterprise Connect Innovation Centres – <0.1 – <0.1 – –Entrepreneurs’ Infrastructure Programme - Accelerating Commercialisation – – – <0.1 0.4 0.3Entrepreneurs’ Infrastructure Programme - Business Management Skills – – – <0.1 <0.1 0.1Tasmanian Jobs and Investment Fund – – – – – 0.4Concessional rate of withholding tax 195.0 140.0 295.0 220.0 300.0 255.0Pooled development funds 40.0 0.5 – – – –Small business capital gains tax rollover deferral 11.2 13.1 13.8 31.5 19.1 14.8The Small Business and General Business Tax Break 182.6 63.4 7.6 – – –Small Business - Simplified depreciation rules 0.8 -4.5 16.9 -8.8 -18.1 98.8Small business capital gains tax 15-year asset exemption 5.6 5.8 6.7 35.4 70.1 10.9Small business capital gains tax retirement exemption 27.7 28.4 29.2 76.3 90.5 24.3Small business capital gains tax 50 per cent reduction 25.1 26.5 26.5 92.0 98.6 36.925 per cent entrepreneurs' tax offset 5.5 1.2 – – – –
Total 1036.4 834.8 919.9 947.7 1060.3 955.3Property, professional and administrative servicesIndustry-specific measures
TCF Small Business Program 0.3 0.6 0.3 0.3 – –
Sector-specific measuresClean Technology Investment - General Program – 0.2 – – – –Manufacturing Transition Grants Programme – – – 0.2 1.3 0.8Next Generation Manufacturing Investment Programme – – – – 1.8 0.4Victorian Innovation and Investment Fund - Ford Assistance – – – 0.2 0.2 –
General export measuresExport Market Development Grants Scheme 27.1 25.7 22.5 26.9 25.1 24.9TRADEX 0.2 0.2 0.2 0.2 0.3 0.3
General R&D measuresCommercialisation Australia 13.6 18.7 16.3 5.9 1.2 –COMET Program <0.1 – – – – –Commercial Ready Program 0.1 – – – – –Cooperative Research Centres 11.9 12.4 7.9 7.8 11.5 21.6Clean Business Australia - Climate Ready Program 0.6 – – – – –CSIRO 2.1 1.8 1.9 – – –Clean Technology Innovation Program – 0.3 2.2 0.4 – –
(continued next page)
130 TRADE AND ASSISTANCE REVIEW 2016-17
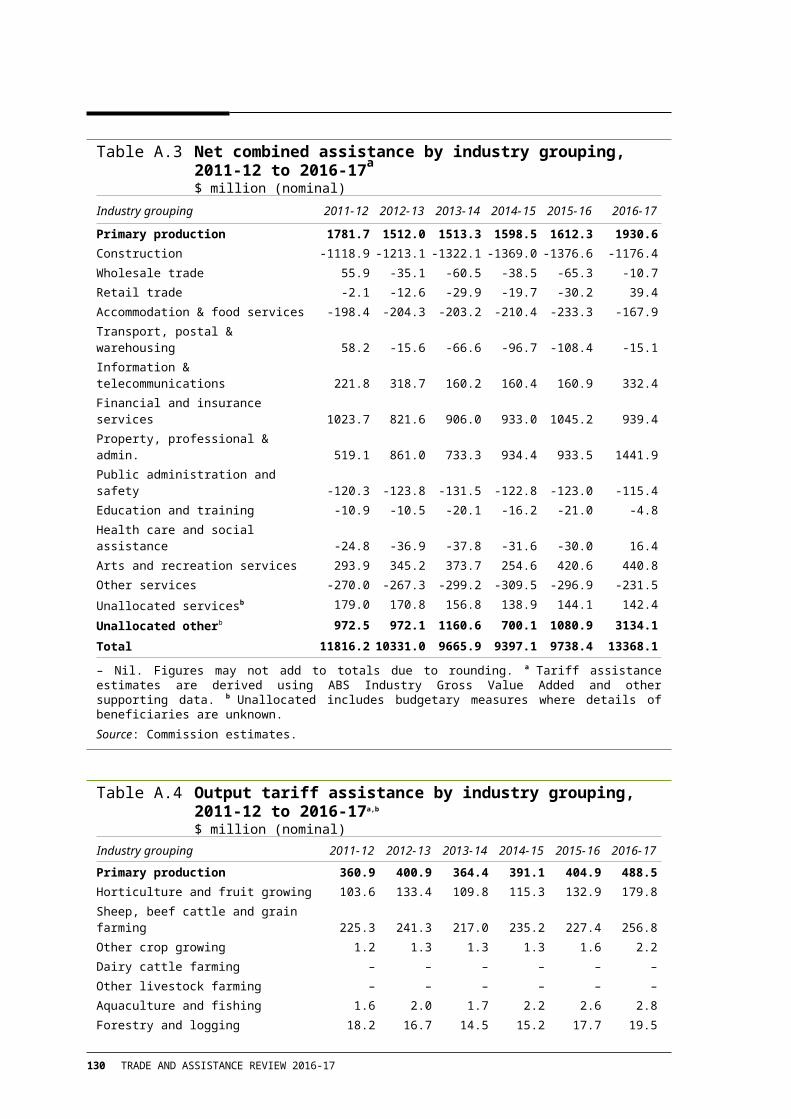
Table A.13 (continued)
2011-12 2012-13 2013-14 2014-15 2015-16 2016-17
General R&D measures (continued)Innovation Investment Fund 3.0 3.6 4.1 4.0 8.2 5.8Manufacturing Technology Innovation Centre – – 2.0 – – –National Enabling Technologies Strategy 0.3 0.5 – – – –R&D Tax Incentive - refundable tax offset – 694.7 672.6 899.4 956.4 1157.8R&D tax offsets - Refundable 265.5 – – – – –Premium R&D tax concession 84.9 23.2 9.6 – – –R&D tax concession 196.0 87.5 29.7 5.2 – –R&D Tax Incentive - non-refundable tax offset – 148.9 125.1 106.5 88.6 106.8
Other measuresAustralian Government Innovation and Investment Fund - Tasmania – – – 0.1 0.1 –Enterprise Connect Innovation Centres 3.7 2.4 3.3 1.7 0.1 –Entrepreneurs’ Infrastructure Programme - Accelerating Commercialisation – – – 1.4 12.2 20.7Entrepreneurs’ Infrastructure Programme - Business Management Skills – – – 0.5 1.8 2.0Illawarra Region Innovation and Investment Fund 0.3 0.8 – – – –South East South Australia Innovation and Investment Fund – 0.1 – – – –Tasmanian Innovation and Investment Fund 0.1 – <0.1 – – –Tasmanian Jobs and Investment Fund – – – – – 0.5Small business capital gains tax rollover deferral 16.5 19.5 20.4 39.9 35.4 34.7The Small Business and General Business Tax Break 78.1 27.1 3.3 – – –Small Business - Simplified depreciation rules 2.7 -14.8 54.3 -27.4 -55.0 298.5Small business capital gains tax 15-year asset exemption 12.6 13.1 15.0 38.1 30.3 25.1Small business capital gains tax retirement exemption 38.0 39.0 40.0 82.5 79.8 58.8Small business capital gains tax 50 per cent reduction 64.1 67.6 67.6 113.1 110.0 89.325 per cent entrepreneurs' tax offset 37.4 44.4 – – – –
Total 859.1 1217.3 1098.6 1306.9 1309.2 1847.9Public administration and safety
Sector-specific measuresNext Generation Manufacturing Investment Programme – – – – 0.5 1.5
(continued next page)
DETAILED ESTIMATES 131

Table A.13 (continued)
2011-12 2012-13 2013-14 2014-15 2015-16 2016-17
General export measuresExport Market Development Grants Scheme 0.1 0.2 0.1 0.2 0.1 0.2TRADEX 0.1 0.1 0.1 0.1 0.1 0.1
General R&D measuresCommercialisation Australia 0.1 0.3 0.1 0.2 0.1 –CSIRO 7.7 5.1 3.7 9.3 9.5 11.7R&D Tax Incentive - refundable tax offset – 4.7 4.6 6.1 6.5 7.9R&D tax offsets - Refundable 1.9 – – – – –Premium R&D tax concession 1.1 0.3 0.1 – – –R&D tax concession 1.5 0.7 0.2 <0.1 – –R&D Tax Incentive - non-refundable tax offset – 2.5 2.2 1.0 2.1 2.2
Other measuresEnterprise Connect Innovation Centres 0.8 <0.1 <0.1 – – –Entrepreneurs’ Infrastructure Programme - Accelerating Commercialisation – – – – – 0.4Entrepreneurs’ Infrastructure Programme - Business Management Skills – – – – – <0.1Small business capital gains tax rollover deferral – – – 0.2 0.1 0.1The Small Business and General Business Tax Break 0.1 <0.1 <0.1 – – –Small Business - Simplified depreciation rules <0.1 -0.2 0.7 -0.3 -0.7 3.7Small business capital gains tax 15-year asset exemption – – – <0.1 0.2 0.5Small business capital gains tax retirement exemption – – – 0.4 0.6 0.5Small business capital gains tax 50 per cent reduction 1.7 1.8 1.8 0.8 0.9 0.825 per cent entrepreneurs' tax offset 0.8 1.1 – – – –
Total 15.9 16.6 13.7 18.2 20.1 29.5Education and training
General export measuresExport Market Development Grants Scheme 9.2 7.6 7.0 8.0 7.4 7.0
General R&D measuresCommercialisation Australia 0.8 1.2 0.2 0.5 <0.1 –COMET Program 0.1 – – – – –Commercial Ready Program 0.1 – – – – –CSIRO 2.2 3.1 3.1 1.5 1.2 2.3R&D Tax Incentive - refundable tax offset – 9.5 9.2 12.4 13.1 15.9R&D tax offsets - Refundable 3.6 – – – – –Premium R&D tax concession 0.2 0.1 <0.1 – – –R&D tax concession 1.5 0.7 0.2 <0.1 – –R&D Tax Incentive - non-refundable tax offset – 1.6 0.3 1.1 0.2 0.2
(continued next page)
132 TRADE AND ASSISTANCE REVIEW 2016-17

Table A.13 (continued)
2011-12 2012-13 2013-14 2014-15 2015-16 2016-17
Other measuresEnterprise Connect Innovation Centres 2.6 0.1 0.1 0.1 0.1 –Entrepreneurs’ Infrastructure Programme - Accelerating Commercialisation – – – 0.1 0.7 1.2Entrepreneurs’ Infrastructure Programme - Business Management Skills – – – <0.1 <0.1 0.1South East South Australia Innovation and Investment Fund – 0.1 – – – –Temporary Assistance for Tasmanian Exporters <0.1 – – – – –Tasmanian Freight Equalisation Scheme 0.1 0.1 0.1 0.1 0.1 0.1Tasmanian Jobs and Investment Fund – – – – 0.1 0.3Small business capital gains tax rollover deferral – – – 2.3 1.6 0.8The Small Business and General Business Tax Break 2.5 0.9 0.1 – – –Small Business - Simplified depreciation rules 0.1 -0.7 2.5 -1.3 -2.6 14.5Small business capital gains tax 15-year asset exemption 0.2 0.2 0.2 1.1 0.4 0.3Small business capital gains tax retirement exemption – – – 2.6 1.9 1.1Small business capital gains tax 50 per cent reduction 4.4 4.6 4.6 4.0 4.0 3.025 per cent entrepreneurs' tax offset 5.3 6.2 – – – –
Total 32.7 35.1 27.8 32.4 28.5 46.7Health care and social assistance
Industry-specific measuresPremium Support Scheme 11.4 9.3 9.3 7.8 8.0 7.6
General export measuresExport Market Development Grants Scheme 1.6 1.2 2.2 2.2 1.6 2.0TRADEX 0.2 0.2 0.2 0.2 0.2 0.2
General R&D measuresCommercialisation Australia 1.4 1.5 3.2 2.9 0.8 –COMET Program <0.1 – – – – –Cooperative Research Centres 38.9 35.4 43.8 38.0 37.4 32.0CSIRO 53.1 53.4 55.4 33.4 32.5 33.8Innovation Investment Fund 1.6 1.9 2.2 2.2 4.4 3.1R&D Tax Incentive - refundable tax offset – 18.0 17.5 23.4 24.8 30.1R&D tax offsets - Refundable 5.5 – – – – –Premium R&D tax concession 1.0 0.3 0.1 – – –R&D tax concession 4.2 1.9 0.6 0.1 – –R&D Tax Incentive - non-refundable tax offset – 2.3 4.4 4.1 2.9 3.4
(continued next page)
DETAILED ESTIMATES 133

Table A.13 (continued)
2011-12 2012-13 2013-14 2014-15 2015-16 2016-17
Other measuresEnterprise Connect Innovation Centres <0.1 0.1 <0.1 <0.1 <0.1 –Entrepreneurs’ Infrastructure Programme - Accelerating Commercialisation – – – 0.2 2.0 1.0Entrepreneurs’ Infrastructure Programme - Business Management Skills – – – <0.1 <0.1 0.1Illawarra Region Innovation and Investment Fund – 2.0 – – – –Small business capital gains tax rollover deferral 0.8 1.0 1.0 14.9 6.4 10.0The Small Business and General Business Tax Break 13.9 4.8 0.6 – – –Small Business - Simplified depreciation rules 0.5 -2.8 10.8 -5.6 -11.5 63.5Small business capital gains tax 15-year asset exemption 2.7 2.8 3.2 8.0 8.4 8.3Small business capital gains tax retirement exemption 18.2 18.7 19.1 26.5 26.2 20.4Small business capital gains tax 50 per cent reduction 19.3 20.4 20.4 38.9 43.4 29.525 per cent entrepreneurs' tax offset 10.2 11.6 – – – –
Total 184.4 183.8 194.2 197.2 187.4 244.9Arts and recreation services
Industry-specific measuresFunding for major films - Alien: Covenant and Thor: Ragnarok – – – – – 17.6Funding for major films - Pirates of the Caribbean: Dead Men tell No Tales – – – – – 21.6Funding for major films - Wolverine 12.8 – – – – –Indigenous Broadcasting Program 15.0 15.4 16.0 – – –Screen Australia 91.8 98.1 101.1 89.9 84.4 84.4Tax incentives for film investment -17.0 -14.0 -11.0 -9.0 -7.0 -6.0Exemption of film tax offset payments 32.0 55.0 61.0 69.0 50.0 62.0Film industry offsets 204.0 226.0 252.0 143.0 325.0 280.0
General export measuresExport Market Development Grants Scheme 4.6 4.1 5.1 7.1 6.5 6.9
General R&D measuresCommercialisation Australia – 0.1 0.1 – – –CSIRO 1.2 1.1 1.3 1.3 1.3 1.3R&D Tax Incentive - refundable tax offset – 10.4 10.1 13.5 14.3 17.4R&D tax offsets - Refundable 1.2 – – – – –Premium R&D tax concession 0.4 0.1 <0.1 – – –R&D tax concession 2.6 1.2 0.4 0.1 – –R&D Tax Incentive - non-refundable tax offset – 1.3 2.6 5.2 8.0 8.0
(continued next page)
134 TRADE AND ASSISTANCE REVIEW 2016-17

Table A.13 (continued)
2011-12 2012-13 2013-14 2014-15 2015-16 2016-17
Other measuresEnterprise Connect Innovation Centres 0.1 0.1 0.2 0.1 <0.1 –Entrepreneurs’ Infrastructure Programme - Business Management Skills – – – 0.1 0.2 0.1Illawarra Region Innovation and Investment Fund 1.9 1.8 – – – –Temporary Assistance for Tasmanian Exporters <0.1 – – – – –Tasmanian Freight Equalisation Scheme 0.1 0.2 0.2 0.2 0.2 0.2Tasmanian Jobs and Investment Fund – – – – – 0.2Small business capital gains tax rollover deferral – – – 1.3 1.3 1.4The Small Business and General Business Tax Break 0.5 0.2 <0.1 – – –Small Business - Simplified depreciation rules 0.1 -0.7 2.6 -1.3 -2.5 13.5Small business capital gains tax 15-year asset exemption – – – 2.5 5.1 0.9Small business capital gains tax retirement exemption – – – 1.8 2.2 2.1Small business capital gains tax 50 per cent reduction 4.7 4.9 4.9 3.9 6.5 3.825 per cent entrepreneurs' tax offset 5.9 8.2 – – – –
Total 362.0 413.5 446.6 328.6 495.6 515.4Other services
General export measuresExport Market Development Grants Scheme 1.4 1.6 2.3 3.2 3.6 3.5
General R&D measuresR&D Tax Incentive - refundable tax offset – 11.3 10.9 14.6 15.5 18.8R&D tax offsets - Refundable 5.8 – – – – –Premium R&D tax concession 2.7 0.7 0.3 – – –R&D tax concession 7.1 3.2 1.1 0.2 – –R&D Tax Incentive - non-refundable tax offset – 7.6 9.0 4.5 0.8 1.3
Other measuresEnterprise Connect Innovation Centres 12.1 12.7 9.3 0.1 – –Entrepreneurs’ Infrastructure Programme - Accelerating Commercialisation – – – 0.1 0.8 0.2Entrepreneurs’ Infrastructure Programme - Business Management Skills – – – <0.1 0.1 0.2South East South Australia Innovation and Investment Fund <0.1 0.3 – – – –
(continued next page)
DETAILED ESTIMATES 135
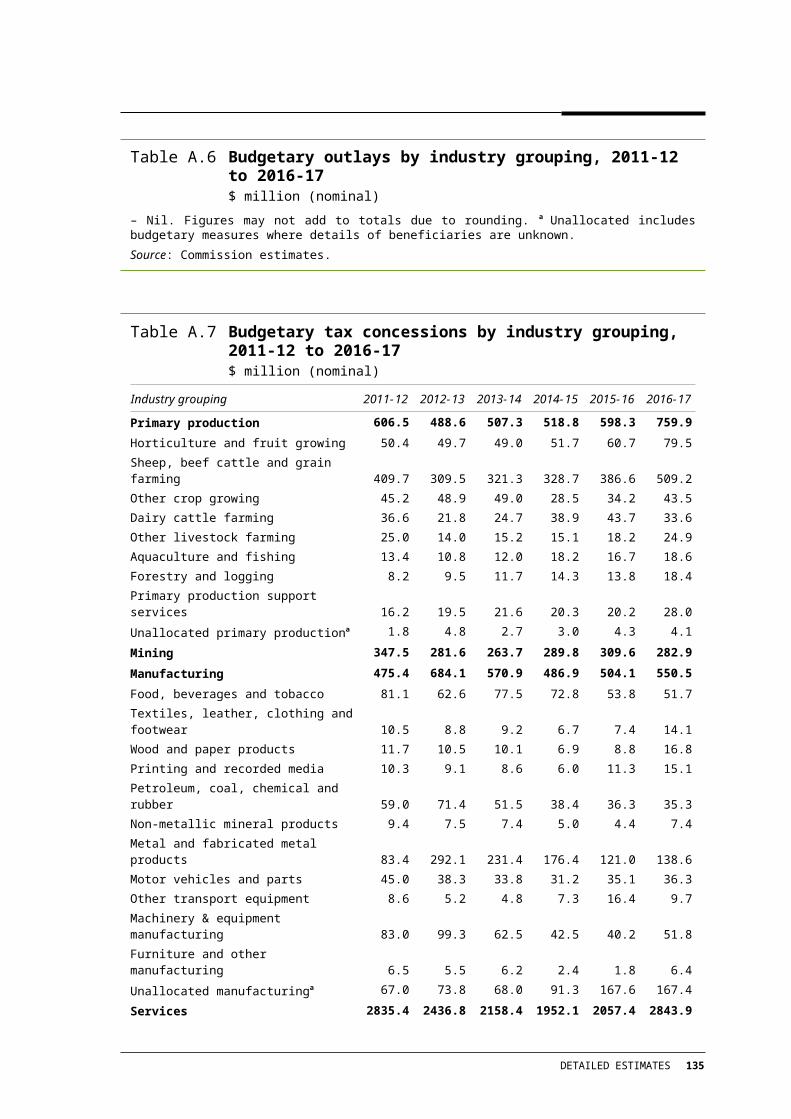
Table A.13 (continued)
2011-12 2012-13 2013-14 2014-15 2015-16 2016-17
Other measures (continued)Tasmanian Innovation and Investment Fund 0.1 <0.1 – – – –Tasmanian Jobs and Investment Fund – – – – 0.1 0.2Small business capital gains tax rollover deferral – – – 3.3 3.1 3.7The Small Business and General Business Tax Break 16.6 5.7 0.7 – – –Small Business - Simplified depreciation rules 0.4 -2.4 8.6 -4.3 -8.7 46.9Small business capital gains tax 15-year asset exemption 1.4 1.5 1.7 2.5 5.0 3.8Small business capital gains tax retirement exemption 1.8 1.8 1.9 6.0 8.3 6.1Small business capital gains tax 50 per cent reduction 8.3 8.8 8.8 11.1 12.1 10.825 per cent entrepreneurs' tax offset 10.3 13.6 – – – –
Total 68.0 66.4 54.6 41.4 40.6 95.6Unallocated services
General export measuresTourism Australia 136.8 129.7 130.4 138.9 144.0 140.3
General R&D measuresCSIRO 1.3 1.2 1.3 – – 2.2
Other measuresClean Business Australia - Green Building Fund 31.9 24.7 6.0 – – –Tourism Industry Regional Development – 7.0 9.9 – – –Tasmanian Jobs and Investment Fund – – – – 0.1 –TQUAL Grants 9.0 8.3 9.3 – – –
Total 179.0 170.8 156.8 138.9 144.1 142.4
Total outlays 2247.6 1816.1 1806.6 2153.7 2170.1 2634.1
Total tax concessions 2835.4 2436.8 2158.4 1952.1 2057.4 2843.9
Total budgetary assistance 5083.0 4252.9 3965.0 4105.8 4227.5 5478.0
– Nil. Figures may not add to totals due to rounding. a The estimates are derived primarily from Australian Government departmental annual reports and Treasury’s Tax Expenditure Statements and unpublished information provided by relevant agencies.
Source: Commission estimates.
136 TRADE AND ASSISTANCE REVIEW 2016-17

Table A.14 Australian Government budgetary assistance, unallocated other, 2011-12 to 2016-17a,b
$ million (nominal)
2011-12 2012-13 2013-14 2014-15 2015-16 2016-17
Industry-specific measuresAsian Business Engagement Plan – – 1.8 1.4 0.6 0.2Australian Space Science Program 12.2 12.7 – – – –Clean Technology Investment - Food and Foundries Program – – – 0.4 – –National Urban Water and Desalination Plan 88.9 64.2 18.7 23.2 1.0 –National Energy Efficiency Initiative - Smart Grid, Smart City 51.0 9.1 – – – –TCF Small Business Program 0.2 <0.1 – – – –
Sector-specific measuresClean Technology Investment - General Program – – – 1.1 – –Farm Help <0.1 – – – – –Manufacturing Transition Grants Programme – – – – – 1.1Next Generation Manufacturing Investment Programme – – – – – 3.6
General export measuresAustrade 115.1 101.5 112.1 115.7 136.5 123.5Clean Energy Trade and Investment Strategy 4.9 – – – – –
General investment measuresRegional headquarters program 0.5 0.5 – – – –
General R&D measuresAustralian Renewable Energy Agency 23.8 59.6 261.9 244.4 114.6 192.1Commercialisation Australia – – 0.2 – – –Clean Technology Innovation Program – – – 0.9 – –Innovation Investment Follow-on Fund 1.0 2.2 0.1 0.1 – –Manufacturing Technology Innovation Centre – 0.8 – – – –National Enabling Technologies Strategy 0.6 0.3 – – – –R&D Tax Incentive - refundable tax offset – 0.1 0.1 0.1 0.1 0.1R&D tax offsets - Refundable <0.1 – – – – –R&D Tax Incentive - non-refundable tax offset – 10.9 23.4 0.2 0.3 –R&D tax offset payments - exemption -235.0 -200.0 -135.0 -85.0 -50.0 -25.0
Other measuresAsialink Business – – – – 3.4 3.5Australian Government Innovation and Investment Fund - Tasmania – – – – – 0.7Asia Marketing Fund – 8.5 12.5 13.5 14.0 14.0Asia Pacific Partnership on Clean Development and Climate 2.3 0.2 – – – –Digital Enterprise Program 4.0 1.9 5.2 0.3 – –
(continued next page)
DETAILED ESTIMATES 137

Table A.14 (continued)
2011-12 2012-13 2013-14 2014-15 2015-16 2016-17
Other measures (continued)Enterprise Connect Innovation Centres – – – 6.7 0.1 –Energy Efficiency Information Grants 7.3 20.8 9.5 – – –Entrepreneurs’ Infrastructure Programme - Accelerating Commercialisation – – – 0.1 1.1 9.5Entrepreneurs’ Infrastructure Programme - Business Management Skills – – – 0.3 1.2 <0.1Illawarra Region Innovation and Investment Fund – 0.1 – – – –Procurement strategy 6.4 – – – – –Small Business Advisory Services Program 12.1 8.0 7.1 – – –Temporary Assistance for Tasmanian Exporters 0.9 – – – – –Tasmanian Freight Equalisation Scheme 6.3 7.5 6.8 7.5 8.7 9.2Tasmanian Jobs and Investment Fund – – – – – 1.5Concessional taxation for small business - Lower company tax rate – – – – 250.0 1100.0Small business capital gains tax rollover deferral 111.4 131.1 137.6 52.8 123.8 170.7The Small Business and General Business Tax Break 21.8 7.6 0.9 – – –Small Business - Simplified depreciation rules 0.3 -1.2 4.0 -1.5 -2.7 13.5Small business capital gains tax 15-year asset exemption 76.2 79.1 90.8 34.6 74.5 158.0Small business capital gains tax retirement exemption 210.6 216.3 222.0 100.5 153.1 311.4Small business capital gains tax 50 per cent reduction 270.7 285.5 285.5 149.7 217.5 466.425 per cent entrepreneurs' tax offset 35.6 28.6 – – – –Taxation assistance for victims of Australian natural disasters 58.0 31.0 10.0 3.0 3.0 –TCF corporate wear program 85.4 85.4 85.4 30.0 30.0 30.0Unincorporated Small Business Tax Discount – – – – – 550.0
Total outlays 337.1 297.5 436.0 415.7 281.3 359.1
Total tax concessions 635.4 674.7 724.6 284.3 799.5 2775.0
Total budgetary assistance 972.5 972.1 1160.6 700.1 1080.9 3134.1
– Nil. Figures may not add to totals due to rounding. a The estimates are derived primarily from Australian Government departmental annual reports and Treasury’s Tax Expenditure Statements and unpublished information provided by relevant agencies. b Includes programs or amounts of funding where the initial benefiting industry is not stated and/or has not been ascertained.
Source: Commission estimates.
138 TRADE AND ASSISTANCE REVIEW 2016-17

References
AAA (Australian Airports Association) 2015, Australian Airports Association submission to the Senate Rural and Regional Affairs and Transport References Committee Inquiry into Airport and Aviation Security, Submission 17.
ABS (Australian Bureau of Statistics) 2013, Australian and New Zealand Standard Industrial Classification (ANZSIC) 2006 (Revision 2.0), Cat. no. 1292.0.
—— 2017a, Australian System of National Accounts 2016-17, Cat. no. 5204.0.
—— 2017b, International Trade: Supplementary Information, Financial Year, 2016-17, 24 November, Cat. no. 5368.0.55.003.
ACCC (Australian Competition and Consumer Commission) 2017a, Airport Monitoring Report 2015-16 (Brisbane Melbourne Perth Sydney), March.
—— 2017b, Interim gas report finds substantial shortfall for east coast likely in 2018, https://www.accc.gov.au/media-release/interim-gas-report-finds-substantial-shortfall-for-east-coast-likely-in-2018 (accessed 6 April 2018).
Achard, P., Rupp, J. and Jomini, P. 2008, The Hit Parade: The Concentration of Tariff Water in Manufactured Products and the Risks to Global Trade, Groupe d’Economie Mondiale, Policy Brief, November 17.
AFP (Australian Federal Police) nd, Air Security Officers, https://www.afp.gov.au/what-we-do/our-work-airports/air-security-officers (accessed 19 February 2018).
AGD (Attorney-General’s Department) 2016, Telecommunications (Interception and Access) Act 1979, Annual Report 2015–16, Canberra.
AIPA (Australian and International Pilots Association) 2015, Submission, Inquiry into Airport and Aviation Security, Senate Regional Affairs and Transport References Committee.
Albanese, A. (Minister for Infrastructure, Transport, Regional Development and Local Government) 2010, Strengthening aviation security, February.
ANAO (Australian National Audit Office) 2015, The Ethanol Production Grants Program, 2014-15, Report No. 18.
—— 2016, Passenger Security Screening at Domestic Airports, August, Report No.5, 2016–17.
Anson, J., Cadot, O., Estavadeoral, A., de Melo, J., Suwa-Eisenmann, A. and Tumurchudur, B. 2005, ‘Rules of Origin in North-South Preferential Trading Agreements with an application to NAFTA’, Review of International Economics, July.
REFERENCES 139

ASIO (Australian Security Intelligence Organisation) 2015, Submission, Inquiry into Airport and Aviation security, January, Rural and Regional Affairs and Transport References Committee.
ATO (Australian Taxation Office) 2018, Reducing the corporate tax rate, https://www.ato.gov.au/General/New-legislation/In-detail/Direct-taxes/Income-tax-for-businesses/Reducing-the-corporate-tax-rate/?default (accessed 6 April 2018).
Australian Government 2010, Counter-Terrorism White Paper: Securing Australia, Protecting our Community, Department of the Prime Minister and Cabinet, Canberra.
—— 2017a, Budget overview 2017-18, 9 May.
—— 2017b, Foreign Policy White Paper.
Barker, C. 2016, Countering terrorism and violent extremism, Parliamentary Library Briefing Book, August, Australian Government, Parliamentary Library, Canberra.
Bauer, M., Ferracane, M., Lee-Makiyama, H. and van der Marel, E. 2016, Unleashing Internal Data Flows in the EU: An Economic Assessment of Data Localisation Measures in the EU Member States, December, European Centre for International Political Economy, http://ecipe.org/publications/unleashing-internal-data-flows-in-the-eu/ (accessed 3 April 2018).
——, —— and van der Marel, E. 2016, Tracing the Economic impact of Regulations on the Free Flow of Data and Data Localisation, Paper Series 30, Global Commission on Internet Governance and Chatham House (the Royal Institute of International Affairs).
——, Lee-Makiyama, H., van der Marel, E. and Verschelde, B. 2014, The Costs of Data Localisation: Friendly Fire on Economic Recovery, ECIPE Occasional Paper, No. 3/2014.
Bergin, A. 2015, ‘The paradox of increased counter-terrorism spending’, The Strategist, Australian Strategic Policy Institute, 7 July.
Bergin, A. and Khosa, R. 2008, Terrorism and the Australian tourism industry, Policy Analysis, Australian Strategic Policy Institute, Canberra.
Bhagwati, J. 2008, Termites in the Trading System: How preferential agreements undermine free trade, Oxford University Press.
BIAC (Business and Industry Advisory Committee to the OECD) 2017, The Flow of Data Across Borders: A BIAC Trade Policy Perspective, OECD, http://biac.org/wp-content/uploads/2016/03/The-Flow-of-Data-Across-Borders_A-BIAC-Trade-Policy-Perspective.pdf (accessed 6 November 2017).
Cadot, O. and Ing, L.Y. 2014, How Restrictive are ASEAN’s RoO?, ERIA Discussion Paper Series, 2014–18, September.
Cao, L., Hosking, A., Kouparitsas, M., Mullaly, D., Rimmer, X., Shi, Q., Stark, W. and Wende, S. 2015, Understanding the economy-wide efficiency and incidence of major Australian taxes, Working Paper 2015-01, Australian Government Treasury, Canberra, April.
140 TRADE AND ASSISTANCE REVIEW 2016-17

Cherny, D. 2016, ‘MCG security fence not returning for 2016/17 cricket season’, The Sydney Morning Herald, 29 November.
Chong, J. 2017, ‘Extra security placing significant cost burden on airlines’, Australian Aviation, 25 October.
Ciobo, S. (Minister for Trade, Tourism and Investment) 2018, A new Trans-Pacific Partnership (TPP) Agreement, Media Release, 8 March.
Cory, N. 2017, Cross-Border Data Flows: Where Are the Barriers, and What Do They Cost? https://itif.org/publications/2017/05/01/cross-border-data-flows-where-are-barriers-and-what-do-they-cost (accessed 7 November 2017).
Crook, W. and Gordon, J. 2007, Rules of Origin: can the noodle bowl of trade agreements be untangled, Productivity Commission Staff Research Note, May, Canberra.
DAWG (Department of Agriculture and Water Resources) 2017a, Annual Report 2016-17, Canberra.
—— 2017b, National Water Infrastructure Loan Facility Investment Guidelines, July, Canberra.
—— 2017c, Regional Investment Corporation, New Concessional Loans Scheme for farm businesses, Discussion Paper on key loan settings, Canberra.
DFAT (Department of Foreign Affairs and Trade) 2016, WTO Tenth Ministerial Conference — December 2015, https://web.archive.org/web/20161112121202/dfat.gov.au/international-relations/international-organisations/wto/Pages/tenth-ministerial-conference-december-2015.aspx (accessed 9 April 2018).
—— 2017, Comprehensive and Progressive Agreement for Trans-Pacific Partnership.
—— 2018a, Fourth Intersessional RCEP Ministerial Meeting – 3 March 2018, Singapore, http://dfat.gov.au/trade/agreements/negotiations/rcep/news/Pages/fourth-intersessional-rcep-ministerial-meeting-3-march-2018-singapore.aspx (accessed 9 April 2018).
—— 2018b, Pacific Alliance Free Trade Agreement, http://dfat.gov.au/trade/agreements/negotiations/pacificalliancefta/Pages/pacific-alliance-free-trade-agreement.aspx (accessed 9 April 2018).
—— 2018c, Trade & investment data, information & publications, Fact sheets for countries and regions, http://dfat.gov.au/trade/resources/Pages/trade-and-economic-fact-sheets-for-countries-and-regions.aspx (accessed 9 April 2018).
DHA (Department of Home Affairs) and DAWR (Department of Agriculture and Water Resources) 2018, Trade and Cargo Activities – Cost Recovery, Discussion Paper, Australian Government, Canberra, February.
DIIR (Department of Industry, Innovation, and Resources) 2018a, Gas Acceleration Program, https://industry.gov.au/resource/Programs/Pages/Gas-Acceleration-Program.aspx (accessed 6 April 2018).
REFERENCES 141

—— 2018b, Gas Acceleration Program, Program Guidelines, https://www.business.gov.au/assistance/gas-acceleration-program (accessed 6 April 2018).
—— 2018c, The Australian Domestic Gas Security Mechanism, https://industry.gov.au/resource/UpstreamPetroleum/AustralianLiquefiedNaturalGas/Pages/Australian-Domestic-Gas-Security-Mechanism.aspx (accessed 6 April 2018).
DIIS (Department of Industry, Innovation and Science) 2017, Science, Research and Innovation Budget Tables 2017-18, Canberra.
DIRD (Department of Infrastructure and Regional Development) 2016, 2015-2016 Regulator Performance Framework — OTS Self-assessment Report.
—— 2017a, Transport security, https://infrastructure.gov.au/security/ (accessed 17 April 2018)
—— 2017b, Transport Security Outlook to 2025 — Security Environment Review, October, Australian Government, Canberra.
DIT (Department of Infrastructure and Transport) 2012, Annual Report 2011-12.
—— 2013, Annual Report 2012-13.
DoD (Department of Defence) 2017, Australian Government Information Security Manual, Australian Government, Canberra.
—— 2018, Defence Export Strategy.
DTA (Digital Transformation Agency) 2017, Local government, www.australia.gov.au/about-government/how-government-works/local-government (accessed 8 February 2017).
EISC (Economics and Industry Standing Committee) 2017, Perceptions and Realities of Regional Airfare Prices in Western Australia, Report No. 2, November, Legislative Assembly, Parliament of Western Australia, Perth.
Eslake, S. 2016, Potential impediments to improving Australia’s productivity performance, transcript, Productivity Review Conference, Productivity Commission, 3 December.
Essential Research 2017, The Essential Report: 22 August 2017.
FIRB (Foreign Investment Review Board) 2017, Annual Report 2015-16, The Treasury, Australian Government, Canberra.
GAO (United States Government Accountability Office) 2017, Aviation Security: Actions Needed to Systematically Evaluate Cost and Effectiveness Across Security Countermeasures, Report to Congressional Requesters, September, US Government, https://www.gao.gov/products/GAO-17-794 (accessed 4 April 2018).
Gillen, D. and Morrison, W. 2015, ‘Aviation security: Costing, pricing, finance and performance’, Journal of Air Transport Management, vol. 48.
Goel, R., Hsieh, E., Nelson, M. and Ram, R. 2006, ‘Demand elasticities for Internet services’, Applied Economics, vol. 38, no. 9, pp. 975–980.
142 TRADE AND ASSISTANCE REVIEW 2016-17

Griswold, D.T. 2003, Free-trade Agreements: Steppingstones to a More Open World, Trade Briefing Paper 18, Cato Institute, Centre for Trade Policy Studies.
HRSCCA (House Of Representatives Standing Committee on Communications and the Arts) 2017, Report on the inquiry into the Australian film and television industry, December.
Joyce, B. (Deputy Prime Minister and Minister for Agriculture and Water Resources) 2017, Regional Investment Corporation gets green light in Orange, Media Release, 16 May.
Kuner, C. 2011, Regulation of Transborder Data Flows under Data Protection and Privacy Law: Past, Present, and Future, 187, OECD Digital Economy Papers, OECD Publishing, Paris.
Mauskopf, J., Chirila, C., Masaquel, C., Boye, K.S., Bowman, L., Birt, J. and Grainger, D. 2013, ‘Relationship between Financial Impact and Coverage of Drugs in Australia’, International Journal of Technology Assessment in Health Care, vol. 29, no. 1, pp. 92–100.
Mavroidis, P.C. and Vermulst, E. 2018, ‘The Case for Dropping Preferential Rules of Origin’, Journal of World Trade, vol. 52, no. 1, pp. 1–14.
Meltzer, J. 2013, ‘The Internet, Cross-Border Data Flows and International Trade’, Issues in Technology Innovation, no. 22.
Morrison, S. (Treasurer) 2016, A tax plan for Australia’s future, Media Release, 3 May.
Mowery, K., Wustrow, E., Wypych, T., Singleton, C., Comfort, C., Rescorla, E., Checkoway, S., Halderman, J.A. and Shacham, H. 2014, Security Analysis of a Full-Body Scanner, Proceedings of the 23rd USENIX Security Symposium, August 2014.
Mueller, J. and Stewart, M. 2011, Terror, Security, and Money: Balancing the risks, benefits, and costs of homeland security, Prepared for presentation at the panel, ‘Terror and the Economy: Which Institutions Help Mitigate the Damage?’ at the Annual Convention of the Midwest Political Science Association Chicago, IL, 1 April.
—— and —— 2014, ‘Evaluating Counterterrorism Spending’, Journal of Economic Perspectives, vol. 28, no. 3, pp. 237–248.
NAIF (Northern Australia Infrastructure Facility) 2017, Corporate Plan 2017-18, Cairns.
—— 2018a, NAIF Investments – NAIF, http://www.naif.gov.au/application-process/naif-investments/ (accessed 6 April 2018).
—— 2018b, Pipeline Information – NAIF, http://www.naif.gov.au/application-process/pipeline-information/ (accessed 14 February 2018).
Newell, B., Donkin, C. and Navarro, D. 2017, ‘Worried about shark attacks or terrorism? Here’s how to think about the real risk of rare events’, The Conversation, http://theconversation.com/worried-about-shark-attacks-or-terrorism-heres-how-to-think-about-the-real-risk-of-rare-events-74690 (accessed 3 April 2018).
REFERENCES 143

NSW Government 2017, The 35-year Concession of Land and Property Information (LPI): LPI Concession Fast Facts, April, Sydney, NSW, https://www.treasury.nsw.gov.au/sites/default/files/2017-04/Fact%20sheet%20-%20The%2035-year%20Concession%20of%20Land%20and%20Property%20Information%20%28LPI%29.pdf (accessed 20 November 2017).
OAIC (Office of the Australian Information Commissioner) 2015, Australian Privacy Principles guidelines, Australian Government, Canberra.
Panday, J. 2017, Rising Demands for Data Localization a Response to Weak Data Protection Mechanisms, 14 August, https://www.eff.org/deeplinks/2017/08/rising-demands-data-localization-response-weak-data-protection-mechanisms (accessed 3 April 2018).
PC (Productivity Commission) 1999, Microeconomic Reforms and Australian Productivity: Exploring the Links, Commission Research Paper, Canberra.
—— 2000, Review of Australia’s General Tariff Arrangements, Report no. 12, Canberra.
—— 2009, Government Drought Support, Report no. 46, Canberra.
—— 2010, Bilateral and Regional Trade Agreements, Research Report, Canberra.
—— 2011, Trade and Assistance Review 2009-10, Annual Report Series, Canberra.
—— 2014, Tasmanian Shipping and Freight, Report no. 69, Canberra.
—— 2015a, Barriers to Growth in Service Exports, Research Report, Canberra.
—— 2015b, Trade and Assistance Review 2013-14, June.
—— 2016a, Developments in Anti-Dumping Arrangements, Commission Research Paper, Canberra.
—— 2016b, Trade and Assistance Review 2014-15, Annual Report Series, Canberra.
—— 2017a, Collection Models for GST on Low Value Imported Goods, Report no. 86, Canberra.
—— 2017b, Rising Protectionism: Challenges, threats and opportunities for Australia, Commission Research Paper, Canberra.
—— 2017c, Shifting the Dial: 5 Year Productivity Review, Report no. 84, Canberra.
—— 2017d, Trade and Assistance Review 2015-16, Annual Report Series, Canberra.
Peng, S. and Liu, H. 2017, ‘The Legality of Data Residency Requirements: How Can the Trans-Pacific Partnership Help?’, Journal of World Trade, vol. 51, no. 2, p. 183.
PJCIS (Parliamentary Joint Committee on Intelligence and Security) 2013, Report of the Inquiry into Potential Reforms of Australia’s National Security Legislation, 24 June 2013.
—— 2015, Advisory report on the Telecommunications (Interception and Access) Amendment (Data Retention) Bill 2014, February.
144 TRADE AND ASSISTANCE REVIEW 2016-17

PMC (Department of the Prime Minister and Cabinet) 2015, Review of Australia’s Counter-Terrorism Machinery, Australian Government, Canberra.
Qantas 2015, Qantas Group submission to the Senate Rural and Regional Affairs and Transport References Committee Inquiry into Airport and Aviation Security, Submission 14.
Reinsch, W. 2018, A Data Localization Free-for-All?, Center for Strategic and International Studies, https://www.csis.org/blogs/future-digital-trade-policy-and-role-us-and-uk/data-localization-free-all (accessed 3 April 2018).
Rex Airlines 2017, Response to Senate Rural and Regional Affairs and Transport References Committee — Airport and Aviation Security Inquiry.
SA (Screen Australia) 2017, Drama Production Activity Summary, https://www.screenaustralia.gov.au/fact-finders/production-trends/all-drama-production/activity-summary (accessed 13 April 2018).
Saffioti, R. (Minister for Transport, Western Australian Government) 2017, Onslow Marine Support Base a boost to local economy, Media Statement, 20 October.
Sheppard, J. 2016, Attitudes to National Security: Balancing Safety and Privacy, 22, October, ANUpoll, Australian National University, Canberra, October.
SRRATRC (Senate Rural and Regional Affairs and Transport References Committee) 2017, Airport and aviation security, Report, 30 March, Parliament of Australia.
Stevens, G., Taylor, M.R., Jorm, L.R., Giffin, M., Ferguson, R., Agho, K.E. and Raphael, B. 2009, ‘Public perceptions of the threat of terrorist attack in Australia and anticipated compliance behaviours’, Australia and New Zealand Journal of Public Health, vol. 33, no. 4, pp. 339–346.
Stewart, M. and Mueller, J. 2011, ‘Cost-Benefit Analysis of Advanced Imaging Technology Full Body Scanners for Airline Passenger Security Screening’, Journal of Homeland Security and Emergency Management, vol. 8, no. 1, p. article 30.
Sunstein, C. 2002, ‘The Perception of Risk’, Harvard Law Review, no. 115.
The Treasury 2018, Tax Expenditures Statement 2017, Canberra.
Turnbull, M. (Prime Minister) and Joyce, B. (Deputy Prime Minister and Minister for Agriculture and Water) 2017, $4 billion Regional Investment Corporation to back strong rural and regional communities, Media Release, Australian Government, 9 May.
Vaile, M. (Deputy Prime Minister and Minister for Transport and Regional Services) 2007, Boosting Aviation Security, Media Release, 8 May, Australian Government.
Walker, L. 2018, NAIF Opening Statement, Governance and operation of the Northern Australia Infrastructure Facility, Senate Economic References Committee, Hansard 1 February.
REFERENCES 145
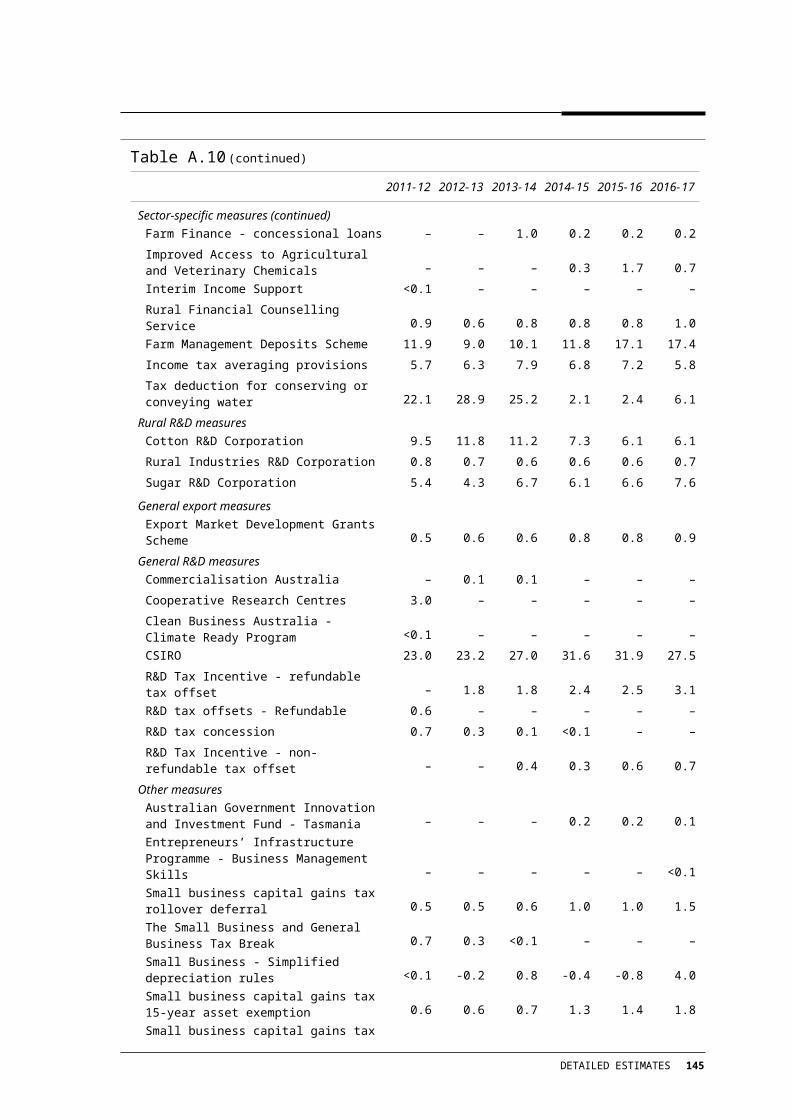
Williams, C. 2017, ‘The Australian budget and counterterrorism’, The Interpreter, Lowy Institute, 9 May, https://www.lowyinstitute.org/the-interpreter/australian-budget-and-counterterrorism (accessed 17 April 2018)
WTO (World Trade Organization) 2017, Draft Report (2017) of the Committee on Government Procurement (Revision), 9 November, GPA/W/345/Rev.1.
—— 2018a, Committee moves ahead on multiple accessions to Government Procurement Agreement, 14 March, https://www.wto.org/english/news_e/news18_e/gpro_14mar18_e.htm (accessed 9 April 2018).
—— 2018b, The Government Procurement Agreement, https://www.wto.org/english/tratop_e/gproc_e/gp_gpa_e.htm (accessed 12 April 2018).
146 TRADE AND ASSISTANCE REVIEW 2016-17