tracking national financial flows into sanitation, hygiene...
TRANSCRIPT

WHO/HSE/WSH/12.05 July 2012
UN-Water Global Analysis and Assessment of Sanitation and Drinking-Water
Tracking national financial flows into
sanitation, hygiene and drinking-water
Sophie Trémolet Martina Rama

ii
© World Health Organization 2012
All rights reserved. Publications of the World Health Organization are available on the WHO
web site (http://www.who.int) or can be purchased from WHO Press, World Health
Organization, 20 Avenue Appia, 1211 Geneva 27, Switzerland (tel.: +41 22 791 3264; fax: +41 22 791 4857; e-mail: [email protected]).
Requests for permission to reproduce or translate WHO publications – whether for sale or for
noncommercial distribution – should be addressed to WHO Press through the WHO web site (http://www.who.int/about/licensing/copyright_form/en/index.html).
The designations employed and the presentation of the material in this publication do not
imply the expression of any opinion whatsoever on the part of the World Health Organization concerning the legal status of any country, territory, city or area or of its authorities, or
concerning the delimitation of its frontiers or boundaries. Dotted lines on maps represent
approximate border lines for which there may not yet be full agreement.
The mention of specific companies or of certain manufacturers’ products does not imply that
they are endorsed or recommended by the World Health Organization in preference to others
of a similar nature that are not mentioned. Errors and omissions excepted, the names of proprietary products are distinguished by initial capital letters.
All reasonable precautions have been taken by the World Health Organization to verify the information contained in this publication. However, the published material is being distributed
without warranty of any kind, either expressed or implied. The responsibility for the
interpretation and use of the material lies with the reader. In no event shall the World Health Organization be liable for damages arising from its use.
The named authors alone are responsible for the views expressed in this publication.
Printed by the WHO Document Production Services, Geneva, Switzerland
By Sophie Trémolet and Martina Rama (independent consultants), under the leadership and guidance of Bruce Gordon, Peregrine Swann and Federico Properzi (WHO)

iii
Executive summary
Effective financing for water, sanitation and hygiene (WASH) is essential to accelerate and sustain
services that could ultimately save two million lives per year. Inadequate monitoring and limited availability of financial data impede the ability of countries to assess progress and improve
performance. An internationally agreed standard methodology for tracking financial flows to WASH
at the national level does not exist at present. This working paper argues that developing such a common methodology is required and feasible.
What do we know about financial flows in the WASH sector?
Our current understanding of financial flows to the WASH sector at the national level is limited, with
numerous gaps. Attempts to undertake global reporting and monitoring, including through the UN-
Water Global Analysis and Assessment of Sanitation and Drinking-Water (GLAAS) in 2008, 2010 and 2012, have not been fully satisfactory and do not provide sufficiently robust evidence for policy-
making at the national level.
Core funding for the sector can come from three main sources: tariffs (from households as users of the
service), taxes (from domestic taxpayers via government institutions) and transfers (from entities that
make voluntary contributions, such as international donors or philanthropic organizations). Repayable
financing from private or public sources can also be used to bridge a temporary funding gap.
Whereas transfers from Organisation for Economic Co-operation and Development (OECD) donors
are tracked with some accuracy (although not in sufficient detail to fully inform policy-making), data on domestic government spending and private spending (mostly from households via tariffs or direct
investments) can be either incomplete or unreliable. Financial flows for which data are unreliable are
seldom taken into account, which may result in a distorted understanding of current financing and potentially wrong policy decisions.
This limited understanding is partly due to the fact that the sector is complex, typically with four main
subsectors with different institutional setups, various financing sources and financing channels, and a mix of service providers, including public and private ones. As a result, consolidated data are seldom
available at the national level and are therefore difficult to compile on a comparable basis at an
international level.
What recent initiatives have been undertaken to improve our understanding of WASH financing?
Several initiatives have been undertaken by a wide range of actors, including the World Health Organization (WHO), OECD, the World Bank, the Water and Sanitation Program (WSP) of the
World Bank and WaterAid (an international nongovernmental organization [NGO]), to improve
tracking of financial flows in the WASH sector. These initiatives have greatly improved our current understanding of financial flows to the sector, particularly in the set of countries where they have been
conducted.
Most of these initiatives have been designed to assess whether sector targets, particularly the
Millennium Development Goals (MDGs), are likely to be met and to identify how much additional
financing may be needed to increase coverage. This has resulted in a strong focus on capital
expenditure and identifying sources of funding for such capital expenditure, rather than adopting an overall “sector financing” approach and examining in detail what may be needed to operate and
maintain existing assets.
These initiatives have all faced comparable difficulties and limitations in terms of access to
comprehensive and reliable data. They have typically required substantial external inputs rather than

iv
being “owned” by the countries; as such, they have often been carried out in a limited number of
countries as “one-off” exercises rather than being institutionalized.
Even though methodologies have been developed and internationally accepted, as with the System of
Environmental-Economic Accounting for Water (SEEA-Water) developed by the United Nations
(UN) Statistics Division, the WASH sector has not yet applied a global framework for tracking sector financing at the national level and beyond. By contrast, a commonly accepted methodology to track
sector financial flows has been used for both the health and education sectors. National Health
Accounts (NHAs), for example, have been developed for more than 100 countries, based on a commonly accepted methodology developed by WHO and the OECD.
Is there a need for a shared reporting framework on financial flows in the WASH sector?
There is a common agreement that a better understanding of financial flows in the WASH sector at
the national level is critical to support policy development and implementation, as well as to
encourage better utilization of existing funds and attract additional financing to the sector. However, there is also a consensus that this is a difficult and challenging task, especially considering the poor
state of current financial data in the sector.
We recommend that a commonly accepted methodology for tracking financial flows in the WASH
sector at the national level be developed, preferably by leading WASH sector organizations in
partnership. This shared methodology should be developed in an iterative manner. As a result, we have proposed what the immediate coverage and the long-term objectives of the financial tracking
exercise might be, as summarized in Table E.1.
Table E.1. Proposed scope and objectives of the tracking exercise
Immediate coverage Future developments
Proposed objectives
Track actual expenditure in the sector over a small number of years (2–3)
Evaluate capital stocks invested in the sector at a given date
Track actual expenditure in the sector over a longer period
Define and track “value-for-money” indicators
For taxes and transfers, compare planned expenditure (or commitments) with actual expenditure
Proposed scope
Funding for all activities to provide sustainable WASH services
All costs (including capital expenditures, operating expenditures, capital maintenance, support costs)
All financial sources (tariffs, including household contributions, taxes and transfers)
Formulate transparent assumptions and rely on surveys based on samples where no reliable data exist
Identical scope as for immediate coverage
Improve methodologies and coverage of data collection in subsequent exercises
What could be the basic features of a common methodology for tracking financial flows?
This working paper lays out basic proposals for a common methodology to track financial flows at the national level. The proposed methodology has been developed based on learning from NHAs in the
health sector and similar initiatives in the WASH sector. This methodology will then be developed in
the context of a multicountry testing study in order to allow for the methodology to be refined and rolled out globally for GLAAS 2014.
The objective of the methodology is to improve our understanding of current expenditure in the WASH sector so as to answer four basic questions:

v
What is the total expenditure in the sector?
How are the funds distributed to the different WASH services and expenditure types?
Who pays for WASH services, and how much?
Which entities are the main channels of funding for the WASH sector, and what is their share of
total spending?
This working paper outlines a process that countries will need to go through in order to derive more
comprehensive and reliable estimates of spending on WASH at the national level. This requires:
agreeing on a common definition of the WASH sector boundaries in terms of services;
agreeing on a classification of service providers, financing agents, cost categories and financial
sources;
agreeing on a set of matrices and indicators to facilitate the analysis of financial flows at the
national level, to enable cross-country comparisons and aggregate data at the global level.
How can this methodology be developed going forward?
Reaching consensus on a commonly agreed methodology and subsequently rolling it out to a large
number of countries will require a process of consensus-building among sector actors. A developed
methodology could take the form of a compilation manual focusing on investment and financial flows for drinking-water and sanitation and providing practical guidance for countries to implement it.
This process will have to be carried out over a number of years, based on the following actions:
Build on existing partnerships or establish a dedicated partnership between leading sector
actors to develop a common methodology comparable to NHAs. This partnership could include,
for example, WHO, the World Bank/WSP, the OECD and the UN Statistics Division, as well as
Sanitation and Water for All, NGOs (e.g. WaterAid) or research centres (e.g. the IRC International Water and Sanitation Centre) that have carried out substantial amounts of work in
this area. This partnership could finance the rolling out of this methodology in a large number of
countries, as well as conduct more detailed studies for specific methodological issues as needed.
Establish a Technical Advisory Group to oversee the results of the testing study and refine the
methodology. This group should include representatives from a sample of national governments
(including statistics institute, ministry of finance, ministry of water, ministry of environment),
international experts on WASH sector financing and experts on the System of Health Accounts (SHA) and NHAs.
Develop an iterative plan to improve the methodology gradually. It will be important not to
“overburden” national governments to start with, but to aim for a reporting framework that could be owned and implemented by national actors, applied all the way down to local governments and
commonly accepted (i.e. the equivalent of an NHA system).
In each participating country, identify an institution in charge of supervising the data
gathering process and “hosting” the data over time, so as to allow continuity. The “host”
institution may differ from country to country and will need to be identified following
consultation among active sector partners.

vi
Table of contents
Executive summary ........................................................................................................................ iii
List of acronyms ............................................................................................................................ vii
1 Introduction ............................................................................................................................. 1 The problem: a need for improved financial data in the WASH sector ........................................... 1 The context: development of the GLAAS report methodology ....................................................... 1 Structure of this working paper ...................................................................................................... 2
2 What do we know about financial flows in the WASH sector? .............................................. 4 Understanding sources of finance for the WASH sector ................................................................. 4 Tracking data on tariffs (i.e. financing from users of the service) ................................................... 5 Tracking data on taxes (i.e. financing from domestic taxpayers) .................................................... 6 Tracking data on transfers (i.e. ODA and charitable donations) ...................................................... 7 Tracking data on repayable financing ............................................................................................ 8 A limited and partial understanding of financial flows overall ........................................................ 9
3 How can financial tracking at the national level be improved? ........................................... 10 Learning from recent initiatives to track WASH sector financing ................................................. 10 Is a common methodology for tracking WASH financial flows needed? ...................................... 13 Defining the objectives and scope of the tracking exercise ........................................................... 14
4 Overview of a proposed methodology ................................................................................... 16 Defining the boundaries of the WASH sector in terms of services ................................................ 19 Identifying WASH service providers, financing sources and agents ............................................. 22 What needs to be financed: understanding costs ........................................................................... 24 Methodologies for collecting data ................................................................................................ 28 Analysing financial data .............................................................................................................. 29
5 Setting out a roadmap for methodological development ...................................................... 31
Annex A: Existing initiatives in the WASH, health and education sectors .................................. 32 Financial tracking initiatives in the WASH sector ........................................................................ 32 Learning from the health sector ................................................................................................... 49 Learning from the education sector .............................................................................................. 51
Annex B: Existing WASH financial flow studies by country ....................................................... 54
Annex C: Key informants consulted for this study ...................................................................... 58
Annex D: References ..................................................................................................................... 59 Sources for the WASH sector ...................................................................................................... 59 Sources for the health sector ........................................................................................................ 62 Sources for the education sector .................................................................................................. 62 Other useful publications (not cited) ............................................................................................ 62 Useful web sites .......................................................................................................................... 63

vii
List of acronyms
3Ts tariffs, taxes and transfers (sources of finance)
AICD Africa Infrastructure Country Diagnostic AMCOW African Ministers’ Council on Water
CRS Creditor Reporting System
CSO Country Status Overview
DAC Development Assistance Committee (OECD) EFA Education for All
GDP gross domestic product
GLAAS UN-Water Global Analysis and Assessment of Sanitation and Drinking-Water IBNET International Benchmarking Network for Water and Sanitation Utilities
IRC IRC International Water and Sanitation Centre
ISIC International Standard Industrial Classification of All Economic Activities
JMP WHO/UNICEF Joint Monitoring Programme for Water Supply and Sanitation MDG Millennium Development Goal
MTEF medium-term expenditure framework
NEA National Education Account NGO nongovernmental organization
NHA National Health Account
ODA official development assistance OECD Organisation for Economic Co-operation and Development
PER public expenditure review
PPP purchasing power parity
PRSP poverty reduction strategy paper SEEA System of Integrated Environmental and Economic Accounting
SEEA-Water System of Environmental-Economic Accounting for Water
SFP strategic financial planning SHA System of Health Accounts
SNA System of National Accounts
UIS UNESCO Institute for Statistics UN United Nations
UNESCO United Nations Educational, Scientific and Cultural Organization
UNICEF United Nations Children’s Fund
UOE UNESCO/OECD/Eurostat USAID United States Agency for International Development
WASH water, sanitation and hygiene
WHO World Health Organization WSP Water and Sanitation Program (World Bank)
WSS water supply and sanitation

1
1 Introduction
The objectives of this working paper are twofold:
to determine the state of the evidence on the monitoring and reporting of financial flows to the
water, sanitation and hygiene (WASH) sector at the national level;
if knowledge gaps are confirmed, to identify the key tenets of a methodological framework that
could significantly improve our understanding of financial flows in the WASH sector and be rolled out in a large number of countries as part of UN-Water Global Analysis and Assessment of
Sanitation and Drinking-Water (GLAAS) 2014 and beyond.
The problem: a need for improved financial data in the WASH sector
Delivering sustainable WASH services for all requires mobilizing ongoing financing flows to the
sector. Forming a good understanding of the financial flows into the sector (both recurrent
expenditure and investment) is essential in order to assess whether existing funds are being efficiently used to deliver services, whether they are adequate and how they may need to be increased so as to
extend access, to reach the water and sanitation Millennium Development Goals (MDGs) and beyond,
and to ensure that services are delivered on a sustainable basis. Such data can help with monitoring
progress towards achieving targets, benchmarking performance within and across countries, estimating future needs, mobilizing additional financial resources (if necessary) and helping to ensure
value for money.
At present, there are substantial gaps in the current understanding and tracking of financial flows
in the WASH sector at both the national and international levels, especially when compared with
other essential services, such as health and education. A number of recent initiatives have been
undertaken to fill those gaps, but none of these initiatives have been endorsed at the global level or are planned to be repeated over time and institutionalized.
The context: development of the GLAAS report methodology
The objectives of the UN-Water Global Analysis and Assessment of Sanitation and Drinking-Water
report (hereafter referred to as the GLAAS report) are to enhance the evidence base in order to
identify the bottlenecks that slow down progress towards sanitation and water for all and to
highlight the challenges that need to be addressed by the sector. UN-Water tasked the World Health Organization (WHO) with publishing the GLAAS report for the first time in 2008.
1 The GLAAS
report analyses the different inputs into the WASH sector, highlighting the major drivers and
bottlenecks, whereas the WHO/United Nations Children’s Fund (UNICEF) Joint Monitoring Programme for Water Supply and Sanitation (JMP) report assesses sector outcomes through the
measurement of the use of improved drinking-water and sanitation facilities. The GLAAS report is a
key information source presented to world leaders at the High-Level Meeting of the “Sanitation and
Water for All” initiative, a ministerial dialogue taking place every two years at which ministers of finance from developing countries and ministers of development cooperation from donor countries
take stock of progress on sanitation and water, decide how to address challenges and monitor progress
against concrete commitments.
The pilot GLAAS report, published in 2008, sought to test a methodology to report on a series of
characteristics of the WASH sector, including governance arrangements and financing flows. The
pilot report highlighted the existence of significant knowledge gaps and the fact that the sanitation and drinking-water sector lacks a global, periodic and comprehensive sector analysis that is able to talk to
1 Up until the end of 2010, the title of the report was the Global Annual Assessment of Sanitation and Drinking-
Water. With the report being published biennially, the name has been changed to the Global Analysis and
Assessment of Sanitation and Drinking-Water.

2
and influence high-level policy-makers. With respect to data on financing, crucial data gaps identified
in the 2008 GLAAS report included the lack of accurate tracking of domestic central and local government budget allocations for water and sanitation, very limited data on household and private
sector spending on water and sanitation and very limited data on non–Organisation for Economic Co-
operation and Development (OECD) development assistance flows.
The methodology underlying the 2008 pilot report was later expanded and formed the basis for
developing a questionnaire to gather comparable information on a range of issues for the 2010
GLAAS report. A total of 42 countries completed the survey, although in some cases only partial information was received, particularly on the tracking of national financial flows (for which only 4
countries submitted complete information and 22 countries submitted partial financial information).
The results of the survey, published in the 2010 GLAAS report, together with analysis of other
databases, such as the OECD Development Assistance Committee (DAC) database on international
aid flows from OECD donor countries, were overlaid with data presented by JMP on access to and
use of basic sanitation and safe drinking-water. The 2010 GLAAS report confirmed the difficulties of obtaining reliable and comparable information, particularly on financial flows to sanitation and
drinking-water at the national level, from both public sources (at national, subnational and local
government levels) and private sources.
The 2012 GLAAS report used a slightly amended version of the 2010 survey methodology for
gathering information. Out of 65 countries that completed the survey for the 2012 GLAAS report, only 5 countries submitted complete information with respect to tracking financial flows and 26
countries submitted partial financial information. Many countries were able to provide data only on
central government spending but remained silent on other sources of revenues for the sector,
particularly from households.
The objective of the present working paper is to set out a methodology that will form the basis for
gathering financial data for the 2014 GLAAS report and has the potential to be accepted as a
shared methodology for the sector.
Structure of this working paper
This working paper has been developed based on interviews with key informants (see list in Annex C) and a review of existing literature on tracking financial flows in the WASH, health and education
sectors (see Annex D for a full list of references).
This working paper is structured as follows:
Section 2 examines what we currently know about the financial flows for WASH services at the
national level and identifies data gaps.
Section 3 assesses what we can learn from existing WASH initiatives to improve tracking of
national financial flows as well as from initiatives in other sectors, including health and education. It then evaluates whether a common framework is needed to track and evaluate financing to the
WASH sector, what the long-term objectives of this exercise might be and how it may be possible
to strengthen such a framework over time.
Section 4 outlines a proposed methodology for addressing such data gaps and defining a common
reporting framework for the purpose of the testing study to feed into the 2012 GLAAS report.
Section 5 sets out a roadmap for developing the methodology outlined in this paper.
In addition:
Annex A includes a summary presentation of existing initiatives to track financial flows at the
national level in the WASH sector, as well as in the health and education sectors.

3
Annex B shows the existing financial flow studies available for a range of countries.
Annex C contains a list of key informants consulted for this study.
Annex D contains a list of references and useful web sites used in the preparation of this report.

4
2 What do we know about financial flows in the WASH
sector?
In the context of meeting the MDGs and mobilizing additional financing for the WASH sector, the
main emphasis so far has been placed on tracking sources of finance—that is, on answering the key question: “Where is the money coming from, and where is it going to come from in future”? In this
section, we give an overview of the main sources of finance to the sector and assess what we know
and where the main gaps in the information currently lie.
Understanding sources of finance for the WASH sector
Following the typology established by the OECD (2009), there are three main sources of finance
for the WASH sector: tariffs, taxes and transfers, commonly referred to as the 3Ts (Box 1).
Box 1: Defining the 3Ts
“Tariffs” are funds contributed by users of WASH services for obtaining the services. Users generally make payments to service providers for getting access to the service and for using the service. When the service is self-provided (e.g. when a household builds and operates its own household latrine), the equity invested by the household (in the form of cash, material or time—“sweat equity”) would also fall under “tariffs”. “Taxes” refer to funds originating from domestic taxes that are channelled to the sector via transfers from all levels of government, including national, regional and local. Such funds would typically be provided as subsidies, for capital investment or operations. “Hidden” forms of subsidies may include tax rebates, soft loans (i.e. at a subsidized interest rate) or subsidized services (e.g. subsidized electricity). “Transfers” refer to funds from international donors and charitable foundations (including nongovernmental organizations [NGOs], decentralized cooperation or local civil society organizations) that typically come from other countries. These funds can be contributed in the form of grants, concessionary loans (i.e. through the grant element included in a concessionary loan, in the form of a subsidized interest rate or a grace period) or guarantees.
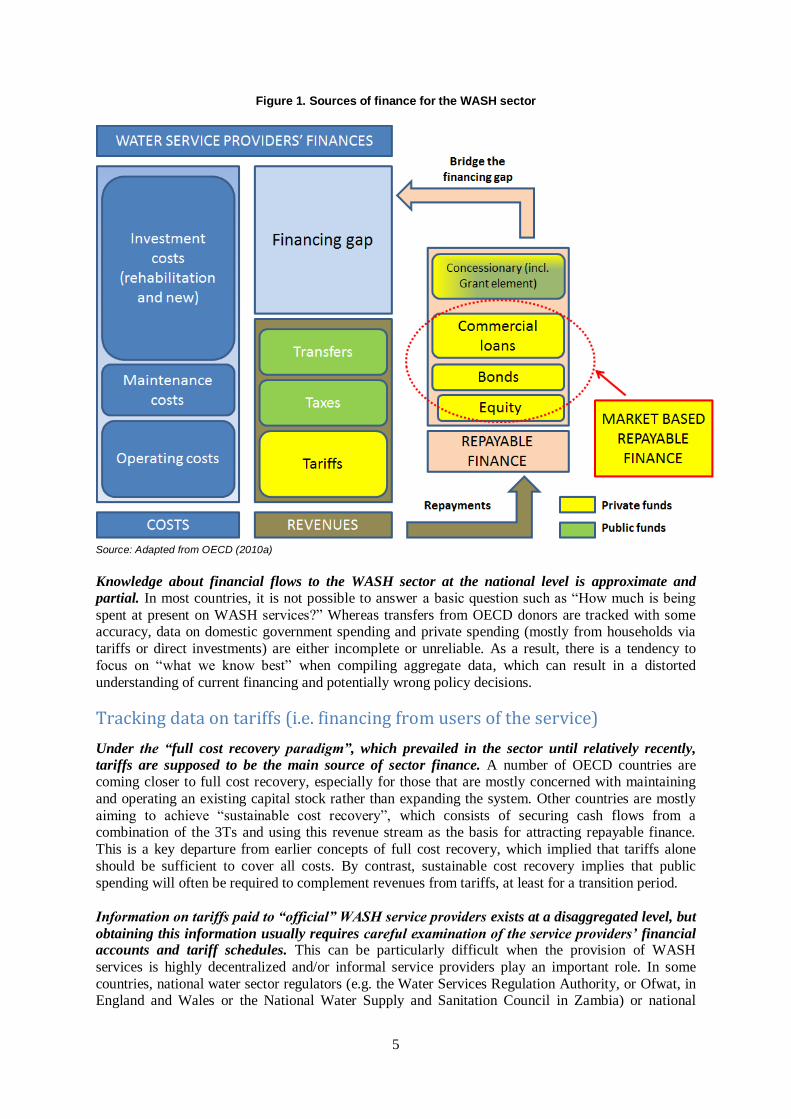
Due to the lumpy nature of WASH sector investments (relatively large investments with a long asset
life), it is seldom possible to finance all necessary investments up-front. If additional financing cannot be raised, either by reducing costs or by increasing the 3Ts, the remaining financing gap needs to be
“bridged” via a mix of repayable financing sources. At the most basic level, this financing would
include loans (on either commercial or concessionary terms) and equity investments from private investors. If repayable financing is not available (either because the cost of borrowing is too high or
because expected revenue streams are not sufficient to repay), the “financing gap” would result in an
“investment gap”, which means that necessary investments are not carried out for lack of finance. The
way in which these financing sources can be combined is shown in Figure 1 below.
5
Figure 1. Sources of finance for the WASH sector
Source: Adapted from OECD (2010a)
Knowledge about financial flows to the WASH sector at the national level is approximate and
partial. In most countries, it is not possible to answer a basic question such as “How much is being
spent at present on WASH services?” Whereas transfers from OECD donors are tracked with some accuracy, data on domestic government spending and private spending (mostly from households via
tariffs or direct investments) are either incomplete or unreliable. As a result, there is a tendency to
focus on “what we know best” when compiling aggregate data, which can result in a distorted
understanding of current financing and potentially wrong policy decisions.
Tracking data on tariffs (i.e. financing from users of the service)
Under the “full cost recovery paradigm”, which prevailed in the sector until relatively recently,
tariffs are supposed to be the main source of sector finance. A number of OECD countries are coming closer to full cost recovery, especially for those that are mostly concerned with maintaining
and operating an existing capital stock rather than expanding the system. Other countries are mostly
aiming to achieve “sustainable cost recovery”, which consists of securing cash flows from a combination of the 3Ts and using this revenue stream as the basis for attracting repayable finance.
This is a key departure from earlier concepts of full cost recovery, which implied that tariffs alone
should be sufficient to cover all costs. By contrast, sustainable cost recovery implies that public
spending will often be required to complement revenues from tariffs, at least for a transition period.
Information on tariffs paid to “official” WASH service providers exists at a disaggregated level, but
obtaining this information usually requires careful examination of the service providers’ financial accounts and tariff schedules. This can be particularly difficult when the provision of WASH
services is highly decentralized and/or informal service providers play an important role. In some
countries, national water sector regulators (e.g. the Water Services Regulation Authority, or Ofwat, in England and Wales or the National Water Supply and Sanitation Council in Zambia) or national

6
utility associations (e.g. ABCON1 in Brazil) collect this information, but this remains the exception
rather than the rule. In addition, a number of global surveys and databases exist that have been
collecting information on tariffs, such as the International Benchmarking Network for Water and
Sanitation Utilities (IBNET) benchmarking platform managed by the World Bank.
Information on other types of “tariffs”, such as tariffs paid to informal WASH service providers or
investments made by households in their own installations (e.g. latrines), are not tracked. A number
of studies have sought to estimate the value of these flows, but this has been done on a one-off basis rather than on a comprehensive basis. Available evidence shows that these flows are likely to be
substantial, particularly in the sanitation sector. With respect to water services, there is plenty of
evidence that tariffs paid to informal service providers can be many-fold higher than official tariffs,
yet the overall amounts spent on informal water vendors are not tracked on an aggregated basis. For on-site sanitation, many governments have a “no-subsidy” policy and expect households to invest in
building on-site sanitation facilities without external support. However, few governments have sought
to estimate the financial investment that this represents for households. Trémolet, Kolsky & Perez (2010) found that households are significant investors in sanitation, even when they get support from
the government. In the case of a revolving fund programme in Viet Nam, for example, households
contributed 93% of the costs of adopting a high standard of sanitation (in the form of septic tanks), whereas the public sector mainly facilitated access to credit. In Bangladesh, in the context of a
community-led total sanitation scheme with additional public subsidies, households contributed 69%
of the total costs of sanitation adoption. As these flows are usually not tracked, however, they tend to
be overlooked in the sector policy-making process.
Tracking data on taxes (i.e. financing from domestic taxpayers)
Taxes refer to funds originating from domestic taxes that are channelled to the sector via transfers
from all levels of government, including national, regional and local. Such funds would typically be provided as subsidies, for capital investment or operations. “Hidden” forms of subsidies may include
tax rebates, soft loans (i.e. at a subsidized interest rate), transfers from local government housing
taxes, donations, subsidized services (e.g. subsidized electricity) or “dormant” equity investments.
Information on taxes channelled to the WASH sector can in theory be obtained from budgetary
information. However, there are a number of common difficulties in compiling a comprehensive
picture of such budgetary flows, as follows:
In a majority of countries, responsibilities for providing WASH services have been decentralized,
and so have responsibilities for planning and monitoring these services. As a result, getting
information on the share of public budgets allocated to WASH requires obtaining data from a potentially large number of local governments.
Further complexity stems from the fact that local governments would usually be funded from a
variety of sources, including their own local tax resources, but also transfers from the national government. Such transfers can come through different ministries (e.g. the ministry of finance, the
ministry of local government, the ministry of health or the sector line ministry) or, in some cases,
via vertical funds or other forms of pooled funding mechanisms.
In some countries, a sector-wide approach has been adopted, with a willingness to pool funding to
the sector (from taxes and transfers) into a common funding basket. However, even in countries
where a sector-wide approach has been adopted, a considerable percentage of funding remains
channelled outside the sector-wide approach and is difficult to track.
1 Associação Brasileira das Concessionárias Privadas de Serviços Públicos de Água e Esgoto.
7
Some countries have established mechanisms for tracking and planning financial resources at an
aggregated level. For example, the Total Sanitation Campaign in India has a solid system of
reporting, both for financial flows and for achievements. However, such tracking systems remain relatively rare, with only the most administratively developed countries having such systems in
place.
In general, the amount and quality of consolidated information about the sanitation sector are
likely to be less (and even less for hygiene) due to the fact that the sector typically falls under several ministries (e.g. ministries of health, environment, water or education) and to the more
disaggregated structure of sanitation service provision arrangements.
Tracking data on transfers (i.e. ODA and charitable donations)
Transfers refer to funds from international donors and charitable foundations, including
nongovernmental organizations (NGOs), decentralized cooperation and local civil society
organizations, that typically come from sources external to the country—that is, are contributed by taxpayers or individual donors in other countries. These funds can be contributed in the form of
grants, concessionary loans (i.e. loans that include a “grant” element in the form of a subsidized
interest rate or a grace period) or guarantees.1
Most transfers in the form of official development assistance (ODA) from donor countries and
international organizations (bilateral and multilateral cooperation) are tracked by the OECD
Creditor Reporting System (CRS) database. The usefulness of this database for policy-making has improved over the years. Since 2001–2002, the database has tracked both donor commitments and
disbursements (although the latter are considerably more difficult to track). In late 2008, OECD
members agreed to disaggregate data on aid flows to the sector between water and sanitation. The first disaggregated data were made available in early 2012 and covered 2010 commitments and
disbursements for those donors that were able to disaggregate (when projects address both
components, such disaggregation may not be possible).
Although the OECD-CRS database is the best available, there are a number of issues with using
data from this database for policy-making at the national level, such as the following:
The information is not sufficiently disaggregated to assess what type of activity is being financed,
such as capital investment expenditure or recurrent expenditure (even though, overall, donors tend
to prioritize funding to capital expenditure), or where the funding is being directed (e.g. in rural
areas versus urban areas). The existing classification allows only the identification of whether flows are funding “large systems” or “basic services”.
Attempts to compare OECD-CRS global data with information on aid flows in a given country
can generate some discrepancies. Reasons for such discrepancies vary from country to country
(Petras, 2009).
A large (and growing) portion of ODA flows is in the form of concessionary loans (i.e. loans with
a grant element of at least 25%). If the loan satisfies the ODA criteria, the whole amount is
recorded as ODA. Repayments of the principal of ODA loans count as negative flows and are deducted to arrive at net ODA, so that by the time a loan is repaid, the net flow over the period of
the loan is zero (interest is recorded, but is not counted in the net flow statistics) (OECD-DAC,
2009). From the point of view of the recipient country, however, this should be considered as repayable financing rather than strictly speaking as transfers.
1 Guarantees can be an effective way to use public funds (domestic and international) to attract repayable
finance to the sector, as they would help with reducing interest rates and lengthening lending maturities.
However, their use in the WASH sector remains limited, for reasons discussed in OECD (2010a).
8
The OECD-CRS database does not exhaustively track transfers from non-OECD donors, such as
from China or from oil-producing countries, although there is some evidence that such flows for the WASH sector have increased and can be substantial for some countries. OECD (2010b) estimated that
in 2008, total aid flows from non-OECD countries ranged between US$ 12 billion and US$ 14 billion,
representing about 9–10% of global ODA. OECD-DAC has been collaborating with 19 non-OECD
donors that have started reporting their aid flows to DAC, including Saudi Arabia (the largest non-DAC donor, with US$ 5.56 billion in aid in 2008), but neither China nor India is currently reporting
aid flows.1
In addition, transfer flows from the “non-public” sector, such as from NGOs, foundations or
remittances from migrants, are not tracked, even though they can be substantial in some countries. Attempts to obtain data on such flows at the country level are often unsuccessful, and there is no systematic detailed reporting from international NGOs on their spending in countries of operation.
International initiatives are under way to improve the ability and transparency of information on aid
flows, however. For example, the International Aid Transparency Initiative is a temporary coalition of
donor governments, governments of developing countries and NGOs launched in October 2008 in Accra.
2 It aims to make information about aid spending easier to access, use and understand. It has
been developing systems to increase the transparency of aid flows, such as in-country aid information
management systems building on previously existing systems. The aim is to capture aid flows from foundations as well as from international and local NGOs, although this is proving relatively difficult.
Tracking data on repayable financing
As a result of the lumpy nature of WASH sector investments (with relatively large investments with a long asset life), it is seldom possible to finance all necessary investments up-front. If additional
financing cannot be raised, either by reducing costs or by increasing the 3Ts, the remaining financing
gap would need to be “bridged” via a mix of repayable financing sources. If repayable financing is not
available (either because the cost of borrowing is too high or because expected revenue streams are not sufficient to repay), the “financing gap” would result in an “investment gap”, which means that
necessary investments are not carried out for lack of finance.
Financing flows to “bridge” the financing gap (i.e. repayable finance) may include the following:3
bank loans, including commercial finance, microfinance and concessionary loans (i.e. loans from
donors that would include a grant or transfer element in the form of an interest rate below market rate or a grace period, for example);
equity provided by investors with the expectation that such equity can be repaid and would earn a
rate of return on the capital invested. In going concerns, equity may be provided over very long
periods of time and may therefore not be repaid. A hidden form of public subsidy (or transfer)
may consist of making an equity investment with no expectation of a repayment or a return;
other financial instruments, such as bonds, whereby a debt title is sold in the market to a large
group of bond investors. Bond issuers may include municipalities (i.e. “municipal bonds”) or
public and private companies (“corporate bonds”).
Information on repayable financing to the sector is very limited, besides the information contained
in the OECD-CRS database on concessionary lending. For example, with respect to microfinance,
even though good information exists on total lending via microfinance instruments in a given country,
4 these data are not broken down by sector, and it is therefore impossible to assess, for
1 For more information, see the OECD/DAC web page (link provided in Annex D). 2 See the International Aid Transparency Initiative web site (link provided in Annex D). 3 OECD (2010a) discusses how market-based repayable finance has been used in the WASH sector and what
innovations may be required in order to increase their use in future. 4 http://mixmarket.org

9
example, the total amount of microfinance loans to the WASH sector. Data on commercial loans or
bonds are also limited, although the International Financing Review compiles some of these data.
The potential contribution of “private operators” to financing WASH services has often been
misconstrued. At most, they can contribute equity or facilitate access to repayable finance. As a
result, private operators do not typically “bring” funds with them; as such, they do not represent a financing source. The amount of capital investments that is committed by private operators at the start
of the contract is tracked in the World Bank Private Participation in Infrastructure database, which is
commonly used to track private investment in infrastructure. However, these flows are brought as equity with the expectation of a positive return on investment and therefore can only “bridge” the
financing gap temporarily.
A limited and partial understanding of financial flows overall
Overall, knowledge about financial flows in the WASH sector at the national level is limited and
partial. This means that it is not possible to answer even a basic question, such as “How much is
being spent at present on WASH services?” Data on international aid are available through the OECD-CRS database, although not at the level of detail that would be ideal for planning purposes. In
contrast, there is no comprehensive data monitoring system that enables tracking financial flows at the
national level for either public or private flows. Data on other types of flows, such as household
investment in their own facilities, are often totally missing. In addition, tracking flows from the point of view of financing sources makes it difficult to analyse what these resources are spent on (i.e. the
breakdown between capital expenditure, capital maintenance and recurrent expenditure), given that
this degree of disaggregation is seldom available at the level of financing sources.
As combining data from different sources and different levels of reliability can be problematic,
there is a tendency to focus on “what we know best” (i.e. ODA flows), which may result in a
distorted understanding of current financing and potentially wrong policy decisions. Some recent initiatives have sought to address these issues; it is therefore critical to learn from what has been done
not only in the WASH sector, but also in other comparable sectors, such as health and education.

10
3 How can financial tracking at the national level be
improved? A number of initiatives led by international organizations and NGOs have sought to improve the
understanding and tracking of financial flows in the WASH sector at the national level. Each of these
initiatives has been developed for specific objectives, which results in a particular emphasis or bias.
In this section, we provide a summary overview of the various initiatives that have sought to
strengthen tracking of financial flows in the WASH sector, as well as in other sectors, at the
national level. Indeed, the challenge of tracking financial flows in a given sector in a country or at the global scale (for benchmarking purposes) is not specific to WASH; it is shared by a number of other
sectors that receive considerable amounts of public financing, such as health and education. By
comparison with WASH, these sectors appear better able to track and report on sector financial flows
at both national and international levels, although they also face substantial difficulties.
Based on this analysis, we conclude that developing a shared methodological framework for
tracking financial flows in the WASH sector would make an essential contribution to the development of sector policy, so that policy choices can be based on sound evidence and tracking of
expenditure against targets. An added advantage would be that it would allow the sector’s visibility to
be increased when competing for funds with other sectors.
Learning from recent initiatives to track WASH sector financing
So far, the WASH sector has not developed a coherent and commonly applied global framework for
evaluating sector financing at the national level and beyond, for comparisons at the international
level. However, over the last decade, a number of international agencies have defined and applied
methodologies to improve tracking of financial flows in the WASH sector, either at the level of
individual countries or on a comparable basis in several countries. These initiatives have all faced
comparable difficulties and limitations in terms of access to reliable data. They have typically required substantial external inputs rather than being “owned” by the countries; as such, they have
often been carried out in a limited number of countries as “one-off” exercises rather than being
institutionalized. The fact that numerous agencies have taken the lead for their development has also resulted in a high level of fragmentation, which makes it difficult to draw global implications from
these initiatives, as there is no single “repository” of this information.
From the perspective of this working paper, such experiences are interesting, as they provide a set
of methodologies to draw from, an indication as to which countries have developed a better
information base than others and confirmation of where the main data gaps lie. The main studies
that have been carried out in the WASH sector to track financial flows in a given country or set of countries are summarized in Table 1 (note that these are purely “financing” studies; additional detail
on other important initiatives, such as “costing” studies, is provided in Annex A). Many of these
studies have had a particular focus on sub-Saharan Africa.

11
Table 1. Summary of recent initiatives to improve tracking of financial flows in the WASH sector
Agency, study title Main objectives Outputs Geographical focus Time frame Approximate budget
World Health Organization (WHO)
GLAAS report To provide policy-makers at all levels with a reliable, easily accessible, comprehensive and global analysis of the evidence to make informed decisions in sanitation and drinking-water. The report points out where efforts stagnate in achieving the MDG target on water and sanitation and which post-2015 challenges need to be addressed. It aims to provide a deeper understanding of the catalysts for, and obstacles to, progress in the water and sanitation sector.
The 2010–2015 strategy for the UN-Water GLAAS initiative sets out four outputs:
reliable and up-to-date national and regional data collected;
data analysed and main constraints to, and drivers for, progress identified;
GLAAS data made available for use by global, regional and national decision-makers (including a biennial GLAAS report);
GLAAS data used to monitor commitments at High-Level Meetings (global and regional).
Global, although most information provided on financial flows is from OECD donor countries (for data on ODA) and sub-Saharan African countries (for national financial flows).
A pilot report was published in 2008, and the first UN-Water GLAAS report in 2010. Forthcoming reports are scheduled for 2012 and 2014.
US$ 1.5–2 million per year.
United Nations (UN) Statistics Division
System of Environmental-Economic Accounting for Water (SEEA-Water)
SEEA-Water provides a conceptual framework for organizing the hydrological and economic information in the water sector in a coherent manner.
SEEA-Water was adopted by the UN Statistical Commission in 2007 as an international statistical standard.
So far, 54 countries have expressed interest in using the standard. Countries are encouraged to use it.
Implementation is taking place now.
Not estimated. The UN Statistics Division provides capacity building but no financial support.
OECD Task Force for the Implementation of the Environmental Action Programme for Eastern Europe, the Caucasus and Central Asia
Strategic financial planning (SFP)
To ensure that a national water policy is realistic and that finance is available to implement it. SFP seeks to establish who should pay (i.e. users, taxpayers or donors) and for what (i.e. operating/capital expenses, water/sanitation, rural/urban/periurban areas, hardware/software). It determines how much money is needed, where it is likely to come from and how targets can be modified to fit available financing.
An OECD report entitled Strategic financial planning for water supply and sanitation (OECD, 2009) outlines the approach. A financial model FEASIBLE underlies the approach. Country reports about the application of the SFP approach to individual countries are also available.
Case-studies covered a wide range of countries, including OECD countries, countries in Eastern Europe, the Caucasus and Central Asia, and a few developing countries, including Lesotho, Egypt and Cambodia.
The OECD Task Force started working on SFP in 2006. Country application studies were carried out in 2007–2008. The SFP report was published in 2009. Further applications are ongoing.
Experience shows that one SFP exercise costs around €200 000–€400 000, depending on the country. This amount includes consultant remuneration, OECD work of coordination and government costs.

12
Agency, study title Main objectives Outputs Geographical focus Time frame Approximate budget
World Bank and Water and Sanitation Program (WSP)–led initiatives
WSP, resource flows assessment
To develop a better understanding of water sector finance, to develop better country-level and sector-wide financing strategies and to improve the incorporation of water and sanitation into poverty reduction strategy papers (PRSPs) and medium-term expenditure frameworks (MTEFs).
Sector finance and resource flows assessments have been developed for five African countries.
Five countries: Ethiopia (only water), Kenya, Uganda (sanitation only), South Africa and Zambia.
Studies developed between 2003 and 2004.
No information available.
World Bank, public expenditure reviews (PERs)
Assess the efficacy, efficiency and quality of public expenditures in the water and sanitation sector, by measuring the quantity and quality of the transfers of public funds to the sector from the top of the chain (central government) to the bottom of the chain (water users) and the quality and quantity of service delivery.
Between 2003 and 2009, the World Bank funded 40 PERs in which the water sector features. Five more detailed water and sanitation sector PERs were completed, and a synthesis report was later produced.
Worldwide, although most PERs have been developed for sub-Saharan African countries.
Started in the 1990s; ongoing. While the cost of PERs has begun to decrease in recent years, a survey of all PERs carried out in 1992 revealed that the average cost of each report was US$ 250 000.
African Ministers’ Council on Water (AMCOW)/WSP, Country Status Overviews (CSOs)
Examine the service delivery pathways for turning finance into WASH services. Identify bottlenecks in the process and estimate financial gaps for meeting MDG targets. Benchmark each country against its peer countries based on a grouping by gross national income.
First study: report published (AMCOW/WSP, 2006). Second study: each CSO to be published separately (in 2011–2012), plus a regional synthesis report (AMCOW/WSP, 2011).
First study: 16 African countries. Second study: 32 countries across sub-Saharan Africa.
First study carried out in 2005 and published in 2006. Second study carried out in 2009–2010, published in 2011 and 2012.
The cost of putting together a CSO was in the range of US$ 30 000 to US$ 50 000 per country, to which must be added the overall coordination costs.
Africa Infrastructure Country Diagnostic (AICD)
To improve public understanding of Africa’s infrastructure situation by collecting and analysing data on the status of the main network infrastructures, including energy, information and communication technologies, irrigation, transport, and water and sanitation.
Numerous publications, including sector overviews, are available on the AICD web site. The methodology has been published in December 2011 in the form of a Handbook on infrastructure statistics (AICD, 2011), which also includes data collection templates.
Twenty-four sub-Saharan African countries. Data collection and analysis have further been rolled out to a total of 48 countries in sub-Saharan Africa and are soon to be extended to North Africa.
The flagship report was published in 2010 (Foster & Briceño-Garmendia, 2010). A water and sanitation–specific report was published in 2011.
Data were collected with support from the African Development Bank and WSP (in the field) over a 2-year period; it was estimated that data collection alone (for all seven sectors) took about 40 consultancy-days per country.

13
Is a common methodology for tracking WASH financial flows needed?
Recent initiatives on tracking financial flows in the WASH sector have greatly improved our understanding of those flows, particularly in a number of countries where financial flows have been
well documented (see Annex B for a list of such countries). Despite decades of efforts in this area,
however, our current understanding of financial flows for the sector at an aggregate level remains somewhat limited, for a number of reasons, as discussed below.
Few initiatives in the WASH sector have sought to track all financial flows on a comparable basis. As a result, although a common policy objective is that WASH service users should pay for their services, most financing flow analysis at the sector level focuses on taxes and transfers (as these can
be tracked through public budgets) and either underestimates or does not evaluate the “tariff”
component, which includes tariffs paid to utilities but also household investment (e.g. in on-site sanitation). Those initiatives (e.g. the Africa Infrastructure Country Diagnostic, or AICD) that have
looked at household financing on a comparable basis with other flows found that households were
prime investors in the sector, even for capital investment.
Several of these financial analyses have been one-off exercises, intending to track financial flows at
a specific point in time, either to feed into a national reform process or at the initiative of governments
and donors wanting to get a better understanding of public funds allocation in a given country (this is the case of the World Bank public expenditure reviews [PERs], for example). Most of them have not
been replicated, and there are no indications that these methodologies have been “institutionalized”
and adopted by national governments for their own tracking of financial flows to the sector.
By contrast, a commonly accepted methodology to track financial flows at the sector level has been
developed for both the health and education sectors, even though they are also highly complex
sectors, with a broad range of service providers, multiple services delivered, a mix of capital and recurrent expenditures and a mix of financing sources (household payments being much higher than
usually thought, particularly in the health sector, even though they are still inadequately tracked).
In the health sector, for example, National Health Accounts (NHAs) have been prepared in more
than 100 countries and repeated several times in many countries. Such exercises follow a commonly
accepted methodology, based on a clear definition of sector boundaries, cost classification, sector matrices and guidance documents published by international organizations, such as WHO and the
OECD. Comparable data are produced based on these accounts and are then drawn together into
annual reports produced by WHO. Similar experiences in the education sector have been less
successful, however.
Interviews with key informants showed a common agreement on the fact that a better
understanding of financial flows at the national level would be critical to support policy development and implementation, as well as to attract additional financing to the sector. However,
there is also a consensus that this is a difficult and challenging task, especially considering the gaps in
terms of financial data in the sector. Experience in the health sector (and, to a lesser extent, in the
education sector) shows that there are strong advantages in building a comprehensive vision of sector financing so as to inform the development of sector policies, both at national and at international
levels, and that there are ways to overcome potential difficulties in data collection and harmonization.
In summary, we argue that a common methodological framework for tracking financial flows in
the WASH sector at the national level is urgently needed. The objectives of such an exercise are
articulated in the next subsection. Section 4 proposes an overall methodological framework. Given the real difficulties in developing comprehensive and reliable data sets, however, such a methodology will
need to be developed and rolled out over time. This framework will need to be developed in more
detail through a consultative process, as outlined in section 5.
14
Defining the objectives and scope of the tracking exercise
Potential objectives. There can be a number of objectives when tracking financial flows in the WASH sector. In the following paragraphs, we highlight a number of potential objectives in increasing order
of complexity and difficulty in data collection. Given that the sector is starting from a relatively low
base in terms of available data on financial flows, we recommend developing a methodology in an iterative manner—that is, starting from a relatively simple methodology and identifying areas for
further refinement along the way. Below, we therefore formulate recommendations about whether
these objectives should be considered in an early stage of methodological development or only later.
A basic minimum objective would be to improve our understanding of current expenditure in the
WASH sector so as to answer four basic questions (as in the NHA methodology, see Annex A):
What is the total expenditure in the sector?
How are the funds distributed to the different WASH services and expenditure types?
Who pays for WASH services, and how much?
Which entities are the main channels of funding for the WASH sector, and what is their share of
total spending?
Obtaining sound and reliable data to answer these questions would, for example, enable probing some of the existing targets that are expressed in financial rather than physical terms. For example, the
eThekwini declaration (AfricaSan, 2008) committed African countries to spend 0.5% of their gross
domestic product (GDP) on sanitation, although at this point in time, there is no commonly accepted
methodology for compiling this figure, thereby somewhat reducing the impact of such an important commitment.
In addition, getting more reliable data on the mix of financial sources currently contributing to the sector for different types of expenditures could greatly improve decision-making. For example, it
would be very useful to know what the mix of the 3Ts is in a given country, to understand what the
weight of tariffs (i.e. user contributions) is as opposed to other sources (i.e. taxes and transfers). If we
find, as Foster & Briceño-Garmendia (2010) found in sub-Saharan Africa,1 that households make the
greatest contribution to financing the sector (through their investments in on-site sanitation), then a
key policy recommendation would be about how to leverage greater household contributions (in
countries where they remain limited) without jeopardizing equity.
If such an exercise aimed to gather data for several years or was repeated several times over a
given period, it would make it possible to track trends in water sector financing. Tracking trends purely in financial terms can help to evaluate whether or not the sector is successful at attracting more
funding over the years. However, it does not improve our understanding of whether or not the sector
is getting better at using available funds (i.e. increasing cost-effectiveness and value for money).
An additional objective may involve tracking value for money by comparing expenditure (financial)
data with actual realizations (e.g. increases in coverage). Carrying out this type of analysis may be
complicated by the fact that few realizations are being tracked reliably at present. Only general evolutions in access to water and sanitation in order to meet the MDGs are tracked by the JMP,
managed by UNICEF and WHO, but the JMP does not provide explanations on how improvements in
access were achieved. As discussed in section 4 below, providing access to the services is only the first step, and many additional services need to be provided in order to ensure that such services are
delivered sustainably over time.
1 In chapter 16 of the report (Table 16.6, p. 304), it is estimated that the household contribution to capital
expenditure in water supply and sanitation in sub-Saharan Africa is about 46%.

15
Given the potential methodological difficulties involved and the lack of data on the physical side,
however, we would suggest that value-for-money estimates be done only in a subsequent stage of methodological development.
Some existing analyses (including GLAAS 2010) have sought to compare budgets and
commitments with funds that have been effectively spent. This type of data and analysis would be essential to assess the effectiveness of public financing of the sector, as one of the key issues is that
committed funds are never spent or spent only after a long gap (as found by the Country Status
Overviews [CSOs] in sub-Saharan Africa for sanitation under the Total Sanitation Campaign in the state of Bihar). However, this type of analysis is mostly valid for public funds and is not relevant for
private flows (i.e. mostly from households themselves). Besides, obtaining data on budget and
realizations can prove difficult, whereas focusing on actual expenditure allows the first set of four basic questions highlighted above to be answered. As a result, it is recommended that the first stage of
methodological development be focused on actual expenditure from all sectors (both public and
private), rather than seeking to track flows based on budgeted amounts, released amounts and
amounts actually spent.
Scope of the tracking exercise. Given that the proposed tracking methodology could only be rolled
out for the purpose of the 2014 GLAAS report, it appears that by that time, it will be essential to track how the WASH sector is performing as a whole rather than being exclusively focused on whether or
not sufficient financing is being generated to meet the water and sanitation MDGs.
As a result, it is recommended that expenditure tracking be done for a broader definition of the water
sector (i.e. including all aspects that are needed to deliver sustainable WASH services rather than just
providing access), for all costs (i.e. including operating, maintenance and capital expenditure) and for
all financial sources (including tariffs, taxes and transfers). Doing so is likely to raise methodological difficulties and will require formulating assumptions (or conducting surveys) for some areas where
little information exists (e.g. household financing). However, it will be critical to quickly build a
comprehensive vision of all financing flows in the sector so as to provide a better basis for policy decisions. Besides, as Cecilia Briceño-Garmendia, lead author of the AICD flagship report (Foster &
Briceño-Garmendia, 2010), mentioned in a personal communication, “Creating conditions for the
sustainability of data collection is more important than accuracy”, at least at an initial stage. Future
development could entail improving the generation of reliable data for those flows where only estimates could be formulated in an initial stage of methodological development. The proposed
objectives and scope of the tracking exercise are summarized in Table 2.
Table 2. Proposed objectives and scope of the tracking exercise
Immediate coverage Future developments
Proposed objectives
Track actual expenditure in the sector over a small number of years (2–3)
Evaluate capital stocks invested in the sector at a given date
Track actual expenditure in the sector over a longer period
Define and track “value-for-money” indicators
For taxes and transfers, compare planned expenditure (or commitments) with actual expenditure
Proposed scope
Funding for all activities to provide sustainable WASH services
All costs (including capital expenditures, operating expenditures, capital maintenance, support costs)
All financial sources (tariffs, including household contributions, taxes and transfers)
Formulate transparent assumptions and rely on surveys based on samples where no reliable data exist
Identical scope as for immediate coverage
Improve methodologies and coverage of data collection in subsequent exercises

16
4 Overview of a proposed methodology “The perfect is the enemy of the good” — Voltaire
This section presents proposals for the development of a shared reporting framework for the
WASH sector. This proposed methodology will then be refined and tested through a study in a
relatively small number of countries (i.e. between 6 and 10), below referred to as the “testing study”. On the basis of the results of this testing study, a guidance document will be prepared, reflecting a
modified methodology (following testing) that can then be rolled out further by 2014. The testing
study should be seen as an opportunity to experiment with different methodologies and reporting
frameworks, depending on local circumstances, so that by the end of the study, a comprehensive yet flexible monitoring framework can be defined.
We recommend developing a relatively simple methodological framework that does not seek to
capture every single financing flow (or stock) in the smallest detail but rather identifies ballpark
financing allocations. This would require making all assumptions as explicit as possible and
potentially combining quantitative with qualitative assessments for the cases where the information base is non-existent or very poor.
Based on the learning from the health sector, we recommend drawing from the NHA methodology
in order to clarify and organize the key concepts that underlie financing flows in the WASH sector. Mehta et al. (2004) came to a similar conclusion, stating: “In developing sector resource flows
assessment, it would be useful to review the approach to National Health Accounts (NHA) developed
over the past decade in the health sector.”
There are a number of advantages from adopting a comparable methodology:
The NHA methodology appears to be a well-organized way of examining sector financing flows
through a number of prisms. Financing flows are complex both in the WASH sector and in the
health sector, and the typology used by the NHAs is very relevant and can easily be adapted for
the WASH sector.
The NHA methodology has been applied in a large number of countries, both developed and
developing countries, and even in places where data availability is limited (e.g. Mozambique).
Based on the NHAs, a number of methodological developments have taken place that could yield
useful lessons for the water sector. Besides, national actors such as statistics bureaux should already be familiar with the NHA methodology, which would simplify implementation of a
similar methodology in the WASH sector.
Using comparable methodologies in both sectors would facilitate comparisons across these two sectors (which are frequently competing for funds) and would also contribute to raising the profile
and the visibility of the WASH sector for policy-makers and providers of finance.
This will require the definition of a commonly accepted framework to analyse financing flows (as well as possibly asset stocks) in the sector. As discussed in Table 1, the UN Statistics Division has
already initiated work in this area with the adoption of the System of Environmental-Economic
Accounting for Water (SEEA-Water), although at a larger scale, since the exercise concerns the water sector as a whole, including integrated water resource management issues, rather than only water and
sanitation issues. Coordination with the UN and possible integration with this existing system would
be important in order to avoid duplication and to ensure that the proposed methodology is
mainstreamed into governments’ standard statistical activities. A developed methodology could therefore take the form of a compilation manual focusing on investment and financial flows for water
and sanitation and providing practical guidance for countries to implement it.

17
The proposed methodology is designed as a process for identifying and tracking financial flows, to
help countries track financial flows in the WASH sector and analyse this information in a coherent and consistent manner across several countries. Figure 2 below outlines the main steps of the
proposed methodology, which will need to be tailored to some extent depending on country
circumstances.
Figure 2. Overview of proposed methodology to track financial flows to WASH at national level
Collect financial data
Analyse financial data
Track revenues (top-down) and costs (bottom-up)
Calculate indicators to be tracked across several countries
Identify WSH service providers, financing sources and agents
Define the boundaries of the WSH sector in terms of services
Publish sector statistics
Cross-tabulate the data based on a set of common matrices
The proposed process includes:
Financial data collection
define boundaries for the WASH sector in terms of services;
identify who are service providers, financing sources and financing agents;
track revenues (top-down) and costs (bottom-up);
Financial data analysis
cross-tabulate the data based on a set of common matrices;
define a small set of common indicators to be tracked across several countries.
Additional explanation for each step of the process is provided in subsequent paragraphs, in which we refer to the application of the methodology as the “tracking exercise”. Figure 3 sets out the main
dimensions that need to be examined in order to track financial flows in the WASH sector at the
national level in a comprehensive and reliable manner.1
1 The figure would need to be adjusted to fit each country’s specific contexts (e.g. the list of service providers
may vary significantly from one country to another).

18
Figure 3. Financing flows in the WASH sector: proposed analytical framework1
FINANCING SOURCES
Tariffs
Consumption tariffs
Connection charges
Other charges (e.g. meter rental)
Household investments
Taxes
National taxes
Local taxes
Special service taxes
Transfers
On-budget support (grants or loans)
Off-budget support for specific
projects, programmes or special
funds
FINANCING
FINANCING AGENTS
Public sector
National authorities (ministry of
finance, ministry of water or
other ministries)
Regional authorities
Local authorities
Special bodies (e.g. management
of special funds)
Public asset–owning companies and/or operators
Regulators
Non-public sector
Bilateral and multilateral donors
Private providers (utilities or
small private operators)
NGOs and community-based
organizations
Households
COSTS
Capital expenditure (including
hardware and software)
Operating and minor maintenance
expenditure
Capital maintenance expenditure
Cost of capital
Expenditure on direct support
Expenditure on indirect support
PRODUCTION
SERVICE PROVIDERS
Government agencies
Public and private utilities
Small independent providers
(formal and informal)
NGOs and community-based
organizations
Households
SERVICES
Protecting water resources
Augmenting and ensuring water
supplies
Access to water
Access to sanitation and hygiene
Wastewater collection and transport
Wastewater treatment
Safe sludge disposal/reuse
CONSUMPTION
BENEFICIARIES
Demographic groups
Socioeconomic strata
Geopolitical entities
Water resource endowment
1 This figure builds on a similar figure underlying NHAs, as shown in Annex B.
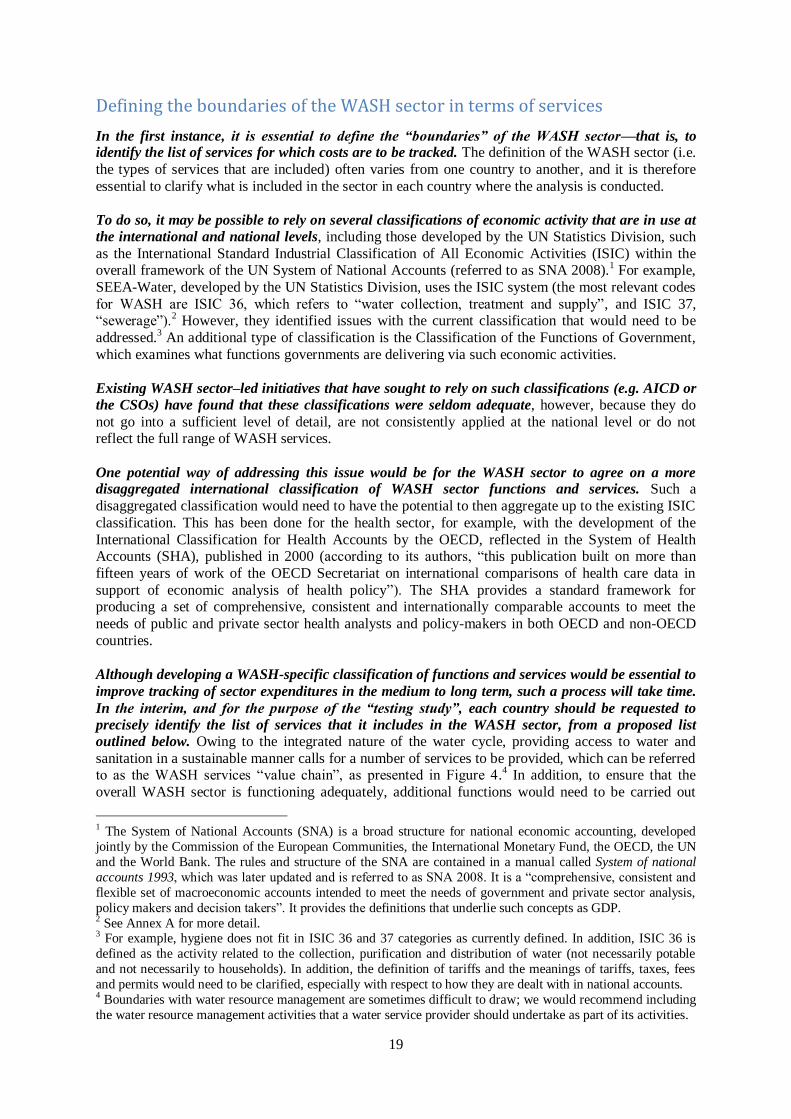
19
Defining the boundaries of the WASH sector in terms of services
In the first instance, it is essential to define the “boundaries” of the WASH sector—that is, to identify the list of services for which costs are to be tracked. The definition of the WASH sector (i.e.
the types of services that are included) often varies from one country to another, and it is therefore
essential to clarify what is included in the sector in each country where the analysis is conducted.
To do so, it may be possible to rely on several classifications of economic activity that are in use at
the international and national levels, including those developed by the UN Statistics Division, such
as the International Standard Industrial Classification of All Economic Activities (ISIC) within the overall framework of the UN System of National Accounts (referred to as SNA 2008).
1 For example,
SEEA-Water, developed by the UN Statistics Division, uses the ISIC system (the most relevant codes
for WASH are ISIC 36, which refers to “water collection, treatment and supply”, and ISIC 37, “sewerage”).
2 However, they identified issues with the current classification that would need to be
addressed.3 An additional type of classification is the Classification of the Functions of Government,
which examines what functions governments are delivering via such economic activities.
Existing WASH sector–led initiatives that have sought to rely on such classifications (e.g. AICD or
the CSOs) have found that these classifications were seldom adequate, however, because they do
not go into a sufficient level of detail, are not consistently applied at the national level or do not reflect the full range of WASH services.
One potential way of addressing this issue would be for the WASH sector to agree on a more disaggregated international classification of WASH sector functions and services. Such a
disaggregated classification would need to have the potential to then aggregate up to the existing ISIC
classification. This has been done for the health sector, for example, with the development of the
International Classification for Health Accounts by the OECD, reflected in the System of Health Accounts (SHA), published in 2000 (according to its authors, “this publication built on more than
fifteen years of work of the OECD Secretariat on international comparisons of health care data in
support of economic analysis of health policy”). The SHA provides a standard framework for producing a set of comprehensive, consistent and internationally comparable accounts to meet the
needs of public and private sector health analysts and policy-makers in both OECD and non-OECD
countries.
Although developing a WASH-specific classification of functions and services would be essential to
improve tracking of sector expenditures in the medium to long term, such a process will take time.
In the interim, and for the purpose of the “testing study”, each country should be requested to
precisely identify the list of services that it includes in the WASH sector, from a proposed list
outlined below. Owing to the integrated nature of the water cycle, providing access to water and
sanitation in a sustainable manner calls for a number of services to be provided, which can be referred to as the WASH services “value chain”, as presented in Figure 4.
4 In addition, to ensure that the
overall WASH sector is functioning adequately, additional functions would need to be carried out
1 The System of National Accounts (SNA) is a broad structure for national economic accounting, developed
jointly by the Commission of the European Communities, the International Monetary Fund, the OECD, the UN
and the World Bank. The rules and structure of the SNA are contained in a manual called System of national
accounts 1993, which was later updated and is referred to as SNA 2008. It is a “comprehensive, consistent and
flexible set of macroeconomic accounts intended to meet the needs of government and private sector analysis,
policy makers and decision takers”. It provides the definitions that underlie such concepts as GDP. 2 See Annex A for more detail. 3 For example, hygiene does not fit in ISIC 36 and 37 categories as currently defined. In addition, ISIC 36 is
defined as the activity related to the collection, purification and distribution of water (not necessarily potable
and not necessarily to households). In addition, the definition of tariffs and the meanings of tariffs, taxes, fees
and permits would need to be clarified, especially with respect to how they are dealt with in national accounts. 4 Boundaries with water resource management are sometimes difficult to draw; we would recommend including
the water resource management activities that a water service provider should undertake as part of its activities.

20
typically at the national ministry level (or regional level, in the case of federal systems), such as sector
planning, management and coordination functions.
Figure 4. The “value chain” of WASH services
Access to waterIntegrated
water resource
management
Access to sanitation
Build storage capacities
Build abstracting capacities
Protect the resource
Augment supplies
Build and maintain transport network to reduce leakage
Investing upstream in augmenting and protecting water resources and in transport
Manage demand
Investing downstream in wastewater treatment and safe disposal
Hygiene promotion
Build wastewater treatment plants
Treat water
Build water point
Build toilet
Promote behaviour change
Build sewerage
Transport wastewater or pit sludge
Collect pit sludge
Dispose of sludge
Reuse sludge or treated effluent
Develop natural treatment systems
Source: OECD (2011)
Whether or not these services are provided would depend on the level of development of the water sector in a given country. In most developing countries, these services are unlikely to be provided in
a comprehensive manner; for example, where providing access is a priority, wastewater collection and
treatment services are often very limited. However, for the purpose of tracking financial flows to the sector, it would be important to define the sector in a manner that includes all critical services that
would ideally need to be provided over time. This means that such classification could also be used in
developed countries, which would be an added advantage, enabling international comparisons.
The precise level of disaggregation for an agreed sector classification would need to be defined
based on consultation and the results of the testing study. A proposed detailed list of services is
included in Table 3. A key objective of doing so would be to identify more precisely what type of information is needed for policy-making and to not overburden governments with excessive data
collection requirements. One way to proceed would be to define several levels of aggregation and
leave each country the choice in terms of the level of sub-disaggregation that it wants to reach, based
on its policy priorities. For example, a country with a significant investment backlog for rural sanitation may want to adopt a higher level of disaggregation for these specific services.

21
Table 3. Services required for sustainable WASH provision: Proposed list of activities to form the basis for an agreed classification for the WASH sector
Providing access to safe water and sanitation
Access to safe water near/in the home
Build, operate and maintain water access points
Build, operate and maintain water networks
Build, operate and maintain water treatment plants
Provide point-of-use water treatment methods (if no centralized water treatment exists)
Access to sanitation and hygiene
Build, operate and maintain sanitation and hygiene facilities
Promote sanitation adoption and hygienic practices
Wastewater collection and transport
Build, operate and maintain sewerage networks
Collect and transport pit sludge outside the home
Upstream: managing the supply/demand balance sustainably
Augmenting and ensuring supply
Develop and protect water resources
Build, operate and maintain storage capacity
Build, operate and maintain abstraction capacity (e.g. river intakes, wells)
Develop alternative sources, such as aquifer recharge, desalination, reuse of treated effluent
Design and implement drought and flood management plans at service provider level
Managing demand
Reduce leakage (on the network and within customers’ premises)
Install water saving devices
Raise awareness, educate the public
Downstream: wastewater treatment for safe disposal and reuse
Wastewater treatment
Build and operate wastewater treatment plants or natural treatment processes
Organize safe disposal of residual sludge
Sector support activities
Protect water resources necessary for drinking-water supply (e.g. establish catchment protection zones, establish and enforce voluntary agreements, establish regulations)
Define and enforce drinking-water and discharge standards for municipal wastewater
Develop sector policies
Regulate service providers
Sector planning, including estimating future sector financial needs
Mobilize financial resources and structure investment projects
Carry out tariff reforms
Reform water sector management

22
Identifying WASH service providers, financing sources and agents
Second, it is critical to map out the way in which funds circulate around the sector in order to determine the scope of the tracking exercise. Such mapping involves identifying WASH service
providers, financing sources (typically, households and domestic and international governments) and
financing channels. A schematic representation of a typical decentralized WASH sector is presented in Figure 5, where the dark blue boxes show the financing sources and the light blue boxes show the
financing agents (or channels) for public funding (note that the central government or its agencies
may play both roles of financing source and financing agent at the same time).
Figure 5. Mapping financial flows to WASH
Identifying service providers. The organization of the WASH sector varies greatly from one country
to another, depending on factors such as water resource availability, historical legacy, official
coverage of WASH services or the extent to which services are decentralized. WASH services are
typically provided by a broad range of service providers, including:
government agencies;
public and private utilities;
small independent providers (formal and informal);
NGOs and community-based organizations;
households (which “self-provide” on-site sanitation, for example).
It has become standard practice to distinguish four main subsectors in the WASH sector (urban
water services, urban sanitation services, rural water services and rural sanitation services),
reflecting the fact that service providers in these four subsectors would usually differ.1
1 The provision of hygiene services is usually not considered as a separate subsector, as it is assumed that
service providers would provide hygiene education services in addition to the other services they provide (either
water or sanitation). However, this is often not the case, which means that hygiene provision is often neglected.

23
For example, in Burkina Faso, a public urban utility, ONEA, is in charge of providing water services
in the main urban centres (as well as sanitation services in the big cities). By contrast, service provision in rural areas is decentralized, with rural communities being responsible for the delivery of
water services. While boreholes in rural areas are managed by water committees or by users’
associations, rural municipalities with a water network are supposed to sign contracts with private
operators. To date, about 70 of such municipalities (30%) have signed contracts with four official private providers. In the remaining municipalities, the network is managed by a recognized
community association (20%), by the municipality itself or by an informal provider. Informal
providers are also found in periurban areas. Concerning sanitation, in rural areas, services are typically self-provided. In other countries, such as in Bangladesh, service provision is decentralized,
meaning that there are a large number of urban water service providers operating the services.
Sanitation services may be provided jointly with water services or separately. In a large number of
cases, there is no formal sanitation service provider. As a result, households invest in on-site
sanitation solutions and maintain those installations themselves (referred to as “self-supply”).
Despite these variations, it is possible to identify patterns in service provision in the WASH sector. It
would therefore be possible to establish a commonly accepted classification of WASH service
providers, as has been done in the health sector. Identifying who is in charge of providing the service would then allow identifying how revenues and costs can be tracked.
Short of establishing such a commonly accepted classification, it would be essential for countries where testing activities are to be conducted to identify the main service providers in each of the
WASH subsectors. Such classification is a key initial step in tracking financial flows, as a large share
of WASH sector expenditure is incurred by service providers. Identifying who is in charge of
providing the service therefore allows the identification of which costs should be tracked.
Understanding financing sources. This has been the starting point for several financial flow
tracking studies in the WASH sector so far. As mentioned in section 2, there are three main types of financing sources for the sector—tariffs, taxes and transfers (referred to as the 3Ts)—to which must
be added repayable financing sources. Identifying information on each of these financing sources can
be done in several ways, as outlined in Table 4. The most appropriate methods for gathering data on
financing sources would need to be defined on a country by country basis.
Table 4. Gathering data on financing sources
Data sources and collection methods
Tariffs
- via service providers Use existing sources where available, such as IBNET, national regulators or service providers’ associations
For main service providers, obtain turnover data per WASH service; in decentralized countries, organize a survey of formal service providers
Organize an inventory and survey of other service providers to assess their overall tariff revenues
- household investments Household survey data on coverage
Organize ad hoc household surveys to assess their investments
Taxes National and local government actual expenditure data, based on data collection by national bureau of statistics or specific questionnaires
Data on other public financing channels, such as special funds
Transfers OECD DAC database
National and local government financial accounts
Surveys of NGOs and other charitable organizations about their investments
Repayable finance Surveys of commercial banking sector
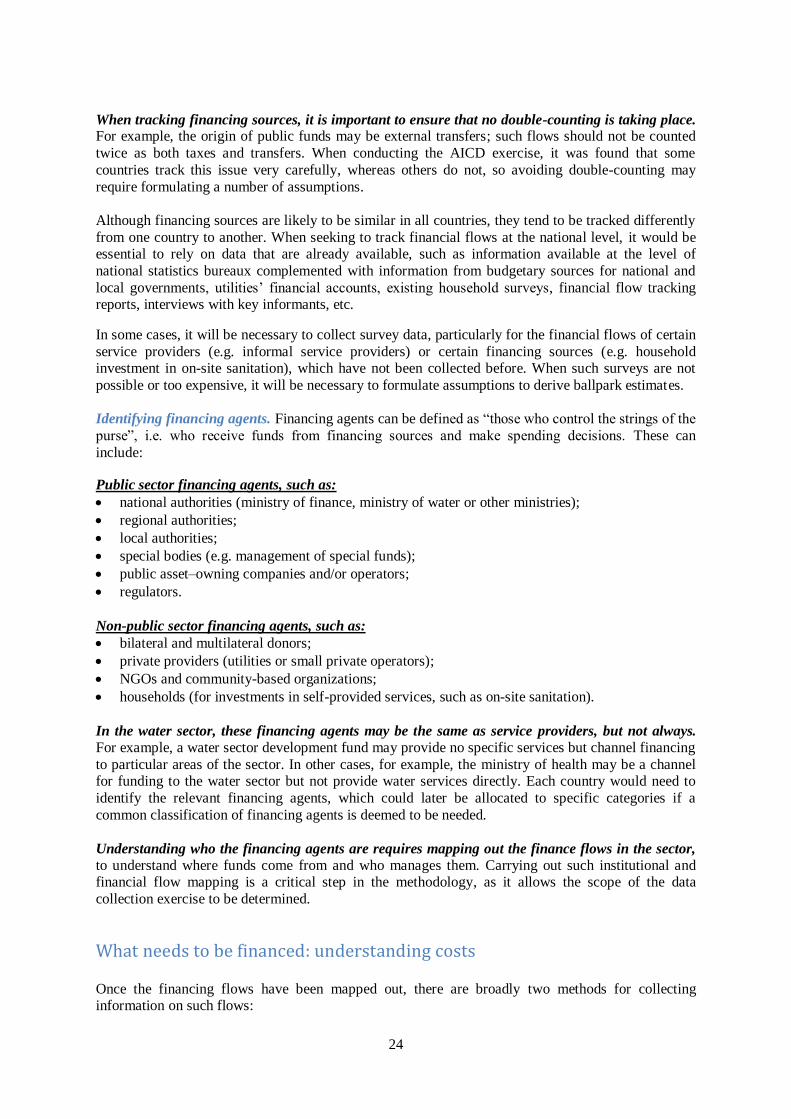
24
When tracking financing sources, it is important to ensure that no double-counting is taking place. For example, the origin of public funds may be external transfers; such flows should not be counted
twice as both taxes and transfers. When conducting the AICD exercise, it was found that some
countries track this issue very carefully, whereas others do not, so avoiding double-counting may
require formulating a number of assumptions.
Although financing sources are likely to be similar in all countries, they tend to be tracked differently
from one country to another. When seeking to track financial flows at the national level, it would be essential to rely on data that are already available, such as information available at the level of
national statistics bureaux complemented with information from budgetary sources for national and
local governments, utilities’ financial accounts, existing household surveys, financial flow tracking reports, interviews with key informants, etc.
In some cases, it will be necessary to collect survey data, particularly for the financial flows of certain
service providers (e.g. informal service providers) or certain financing sources (e.g. household investment in on-site sanitation), which have not been collected before. When such surveys are not
possible or too expensive, it will be necessary to formulate assumptions to derive ballpark estimates.
Identifying financing agents. Financing agents can be defined as “those who control the strings of the
purse”, i.e. who receive funds from financing sources and make spending decisions. These can
include:
Public sector financing agents, such as:
national authorities (ministry of finance, ministry of water or other ministries);
regional authorities;
local authorities;
special bodies (e.g. management of special funds);
public asset–owning companies and/or operators;
regulators.
Non-public sector financing agents, such as:
bilateral and multilateral donors;
private providers (utilities or small private operators);
NGOs and community-based organizations;
households (for investments in self-provided services, such as on-site sanitation).
In the water sector, these financing agents may be the same as service providers, but not always. For example, a water sector development fund may provide no specific services but channel financing
to particular areas of the sector. In other cases, for example, the ministry of health may be a channel for funding to the water sector but not provide water services directly. Each country would need to
identify the relevant financing agents, which could later be allocated to specific categories if a
common classification of financing agents is deemed to be needed.
Understanding who the financing agents are requires mapping out the finance flows in the sector,
to understand where funds come from and who manages them. Carrying out such institutional and financial flow mapping is a critical step in the methodology, as it allows the scope of the data
collection exercise to be determined.
What needs to be financed: understanding costs
Once the financing flows have been mapped out, there are broadly two methods for collecting information on such flows:

25
The “top-down” approach consists of tracking revenues from each financing source, i.e.
estimating “how much money is allocated to the sector”, and aggregating those estimates.
The “bottom-up” approach consists of tracking the costs of different services, i.e. “what is being
spent”, and aggregating those expenses together in order to derive total expenditure figures.
The top-down approach is the most straightforward approach for tracking public financing flows, as most public entities would have a budget allocation for the sector and should be able to report on this.
Such an approach is not sufficient when seeking to track all sources of finance, however. For
example, there are no readily available aggregate data on how much households spend on the services they self-supply, although there is evidence that such amounts can be substantial. In addition, service
providers receive financing from several sources, and tracking information only about their revenues
does not allow analysing what the funds are spent on.
The “bottom-up” approach consists of evaluating the costs of providing the services. This needs to be
done based on a commonly agreed typology of costs, which would at least distinguish among capital
expenditure (including large maintenance costs), operating costs and minor maintenance expenditure. Ideally, those costs would need to be collected at the level of each service provider. However, in
countries with a large number of service providers, that may need to be done on a sample basis and
then extrapolated.
Data collection will need to be conducted based on a combination of the top-down and bottom-up
approaches, so as to be in a position to answer two essential questions: “What is being spent?” and
“Who are the main financiers of the sector?” A reconciliation of these two sets of data would also allow identifying any discrepancies between the two sets of figures.
Tracking the composition of spending between different categories of costs is essential for policy-making and budgeting. For example, Ghosh Banerjee & Morella (2011) found that:
Middle-income countries allocate 80 percent of WSS [water supply and sanitation] spending to
maintenance, likely reflecting the fact that they have already built much of the infrastructure needed. By
contrast, all the other country groups allocate at most 30 percent to this item. Therefore, resource-rich
countries, low-income countries, and fragile states spend 70 to 90 percent of their budgets on capital investments. While this reflects their need to build new WSS facilities, there is a danger of neglecting the
maintenance needs of the limited network that is available.
The costs of providing WASH services and ensuring that the overall sector operates in a
sustainable manner have been classified by the IRC International Water and Sanitation Centre (IRC) as part of the WASHCost project, as shown in Table 4 (also shown in Annex A). This
classification seeks to capture the entire life cycle costs of investing in WASH services. The cost
definitions developed by WASHCost were inspired by the cost categories that are typically used for urban water and sewerage services and were extended to the rural water and sanitation sectors.
1
Such classification is still being tested and refined in the context of the WASHCost project, with
considerable external support in each country. Initial research results have shown the validity of this classification and in particular the need to account separately for capital maintenance expenditure.
Another key innovation of this methodology is the explicit consideration of software costs—that is,
expenditure on a range of “software” activities required to ensure that such services are delivered effectively.
2 These software activities are extremely varied and broad in scope; they range from the
costs of managing the sector at the level of the ministry (staff costs employed in planning, budgeting,
1 However, they do not include any specific mention of water resource costs or environmental costs, which may
need to be done in subsequent methodological development. 2 Trémolet, Kolsky & Perez (2010) also explicitly accounted for software costs when deriving the costs of
providing on-site sanitation at the household level.
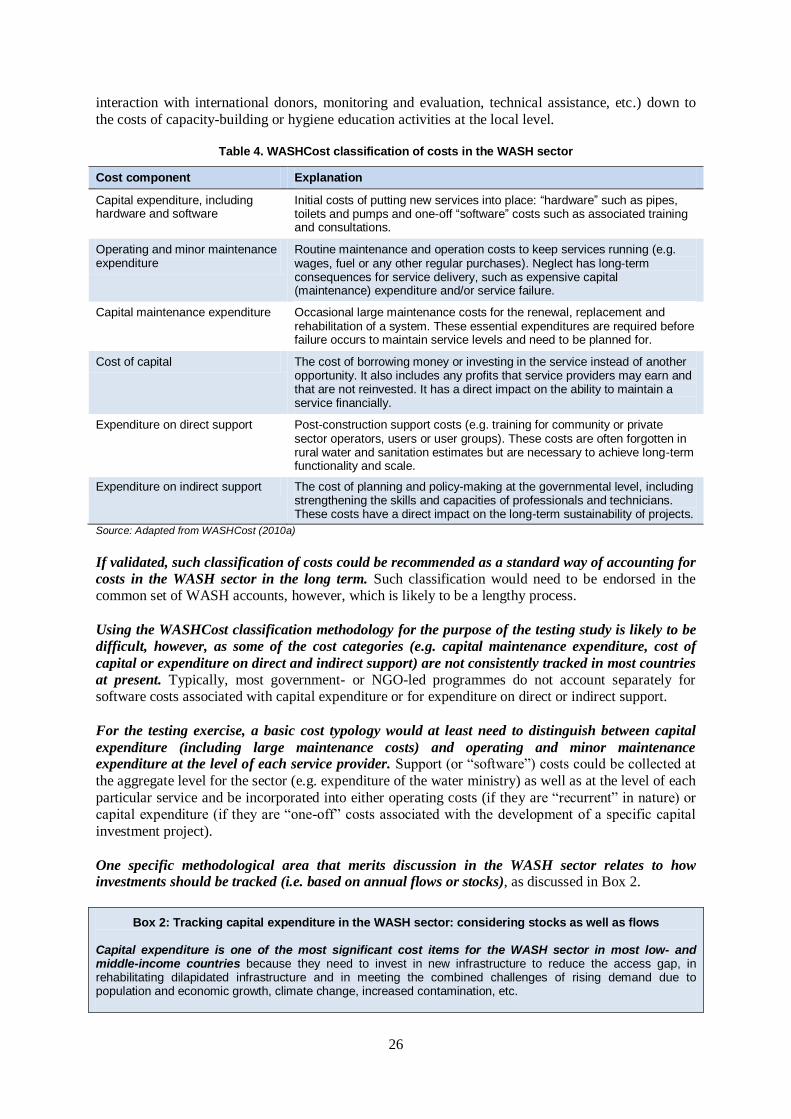
26
interaction with international donors, monitoring and evaluation, technical assistance, etc.) down to
the costs of capacity-building or hygiene education activities at the local level.
Table 4. WASHCost classification of costs in the WASH sector
Cost component Explanation
Capital expenditure, including hardware and software
Initial costs of putting new services into place: “hardware” such as pipes, toilets and pumps and one-off “software” costs such as associated training and consultations.
Operating and minor maintenance expenditure
Routine maintenance and operation costs to keep services running (e.g. wages, fuel or any other regular purchases). Neglect has long-term consequences for service delivery, such as expensive capital (maintenance) expenditure and/or service failure.
Capital maintenance expenditure Occasional large maintenance costs for the renewal, replacement and rehabilitation of a system. These essential expenditures are required before failure occurs to maintain service levels and need to be planned for.
Cost of capital The cost of borrowing money or investing in the service instead of another opportunity. It also includes any profits that service providers may earn and that are not reinvested. It has a direct impact on the ability to maintain a service financially.
Expenditure on direct support Post-construction support costs (e.g. training for community or private sector operators, users or user groups). These costs are often forgotten in rural water and sanitation estimates but are necessary to achieve long-term functionality and scale.
Expenditure on indirect support The cost of planning and policy-making at the governmental level, including strengthening the skills and capacities of professionals and technicians. These costs have a direct impact on the long-term sustainability of projects.
Source: Adapted from WASHCost (2010a)
If validated, such classification of costs could be recommended as a standard way of accounting for
costs in the WASH sector in the long term. Such classification would need to be endorsed in the common set of WASH accounts, however, which is likely to be a lengthy process.
Using the WASHCost classification methodology for the purpose of the testing study is likely to be
difficult, however, as some of the cost categories (e.g. capital maintenance expenditure, cost of
capital or expenditure on direct and indirect support) are not consistently tracked in most countries
at present. Typically, most government- or NGO-led programmes do not account separately for software costs associated with capital expenditure or for expenditure on direct or indirect support.
For the testing exercise, a basic cost typology would at least need to distinguish between capital
expenditure (including large maintenance costs) and operating and minor maintenance expenditure at the level of each service provider. Support (or “software”) costs could be collected at
the aggregate level for the sector (e.g. expenditure of the water ministry) as well as at the level of each
particular service and be incorporated into either operating costs (if they are “recurrent” in nature) or capital expenditure (if they are “one-off” costs associated with the development of a specific capital
investment project).
One specific methodological area that merits discussion in the WASH sector relates to how investments should be tracked (i.e. based on annual flows or stocks), as discussed in Box 2.
Box 2: Tracking capital expenditure in the WASH sector: considering stocks as well as flows
Capital expenditure is one of the most significant cost items for the WASH sector in most low- and middle-income countries because they need to invest in new infrastructure to reduce the access gap, in rehabilitating dilapidated infrastructure and in meeting the combined challenges of rising demand due to population and economic growth, climate change, increased contamination, etc.

27
Most existing financial tracking initiatives have focused on tracking flows of funds (i.e. the amount of new capital investment made every year). Such a methodology often stems from an emphasis on tracking public flows, as public budgets typically distinguish between “recurrent” expenditure and “development” expenditure (i.e. capital investment). It is therefore assumed that collecting data on development budgets from public agencies’ accounts will give a good indication of capital investments. There are several limitations with methodologies that focus on tracking investment flows, as follows:
Tracking investment flows can give some potentially misleading results, as investment flows typically vary from year to year due to capital programming and realization. For example, if a country is building a large asset at a national scale (e.g. a dam or a transmission pipe), capturing the nominal value of that investment in each year as the asset is being built would show up as an investment peak followed by much lower levels of investment. At a global level, this may be interpreted as the country having “deprioritized” investment once this large asset has been built, when in fact the asset would start producing benefits and investment needs are subsequently lower.
Capturing the entire value of an investment in a given year does not allow differences in the asset lives of such investments to be reflected. Following on the example mentioned above, taking into account the entire value of a new asset with an asset life of, say, 50 years in the year in which such investment is made ignores the fact that such an asset is going to deliver benefits over a long period.
Some very important investments (e.g. household investments on on-site sanitation) cannot be tracked in such a way because no data are available on annual investment flows. What is available is information (mostly from household surveys) on service coverage at different points in time (i.e. when the household surveys are conducted) rather than annual investment flows.
A complementary approach would consist of estimating the value of existing investment stocks and tracking how such value evolves over time. Such a methodology has numerous advantages, as follows:
It is in line with the UN SNA, which is the standard methodology used by governments to compile and track information on economic activity. According to the UN Statistics Division, statistics bureaux in each country should already be compiling information on asset stocks for all economic activities, including for water and sanitation. Concepts such as “gross fixed capital formation” and “stocks of fixed assets” are already defined in a standard manner in SNA 2008.
It is potentially simpler, provided balance sheet information is available. Getting data on investment from utilities or government agencies usually requires going back to their balance sheets and estimating the change in asset stocks from one year to the next, as cash flow accounts (where investment amounts are recorded) are seldom readily available in published accounts.
It would allow tracking all sources of investment on a comparable basis, thereby overcoming the problem of a lack of data on annual capital investment flows for significant investors, such as households for on-site sanitation. This was the approach taken by the AICD when estimating current investments in the sector, for example, and it is on the basis of this estimate that it found that households are the most significant investors in the WASH sector in sub-Saharan Africa.
It would allow reflecting whether existing assets are providing a service or not. For example, it would be possible to exclude from the “asset base” the value of assets that are no longer functioning, such as an estimated 50% of all manual hand-pumps in sub-Saharan Africa.
It would provide a sounder basis for estimating future costs—in particular, the costs of attaining the MDGs. For example, the WHO global costing exercise (first produced in 2004 and updated in 2012; see Hutton, 2012) is currently estimating a relatively “crude” estimate of the total asset stock by combining JMP figures on coverage with the best available estimates of unit costs, based on the service ladder. Based on the value of this stock of assets, WHO applies a ratio in order to derive projected operations and maintenance costs. However, good unit cost values are not always available at the national level.
There are a number of methodological difficulties with adopting an “asset stock” approach, which would require further consideration, including the following:
Existing information on assets is often very poor, for a number of reasons. Few entities have developed a comprehensive and reliable asset register. The ownership of the assets is frequently unclear, and there is frequent confusion about who has paid for the assets and who effectively owns the assets. However, adopting such a valuation approach could provide added incentives for improving asset registries.
It would be necessary to agree on a common methodology for valuing assets. There are a number of

28
existing methodologies for valuing assets, which can produce very different values, especially if the asset base combines assets that have been built at different times. Alternative methodologies include valuing assets at their historical cost (i.e. how much did it cost to build it when it was built, adjusted or not for inflation) or valuing assets at their replacement value (i.e. how much it would cost to replace the given asset by its modern equivalent at today’s cost). The simplest methodology would consist of valuing assets at their current book value. Standard methodologies in the SNA could also be used.
It would be important to obtain information about who invested in such an asset in the first place. If this information is going to be used in order to track financial sources in the sector, it will be important to know who financed its construction in the first place. For water utilities, for example, investment funds may come from internally generated revenues, government subsidies or international transfers.
For investments carried out by households, it will be necessary to formulate a number of assumptions. Deriving the value of the capital stock in which households have invested over time can be done based on the number of existing facilities multiplied by the unit costs of these facilities, minus government subsidies.
1
Most key informants consulted for the purpose of this scoping study supported the idea of using a
methodology that accounts for assets in terms of both stocks and flows. We therefore recommend that capital expenditure be tracked on the basis of capital stocks as well as flows. Given the
methodological difficulties entailed, however, the testing study will need to test the feasibility of
alternative methods for estimating asset values and potential errors or biases in doing so. Applying this methodology may be more complex the first time round (when the initial value of the asset base
needs to be determined) but would become comparatively easier for the subsequent iterations. It
would require identifying existing assets for each service provider and valuing the assets. It would also help with defining reference values for other types of costs, such as operating costs and capital
maintenance costs.
A next step in the refinement of the methodology will be to adopt a full “balance sheet” approach for the sector, by tracking not only assets, but also liabilities (i.e. mostly the loans that have been
provided to finance such assets), so as to derive a value for the net capital stock. Such a balance sheet
approach at the sector level is recommended, for example, by the International Monetary Fund (2001) in its Government finance statistics manual.
Methodologies for collecting data
Data collection methods. In order to keep the costs of the exercise down, it will be essential to rely
primarily on data that are already available, such as information available at the level of national
statistics bureaux complemented with information from budgetary sources for national and local
governments, utilities’ financial accounts, existing household surveys, existing financial flow tracking reports, interviews with key informants, etc.
In some cases, it will be necessary to collect primary data, particularly for the costs of certain service providers (e.g. informal service providers) or certain financing sources (e.g. household investment in
on-site sanitation), that have not been collected before. When such surveys are not possible or too
expensive, it will be necessary to formulate assumptions to derive ballpark estimates. A summary
section in the “testing study” report could indicate areas where further investigation and firming up of data will be needed for subsequent iterations.
Periodicity of data collection and reporting. In the first instance, countries should express interest in producing data according to a commonly agreed framework. As this kind of exercise becomes more
1 An additional complication is that in national accounts, households are not considered to be “investors”;
instead, they purchase consumer durables (which would be classified as investments if purchased by an
establishment). As a result, for households, the consumer durable is recorded as consumed the moment it is
purchased. It is therefore important to record the purchase of consumer durables by households and estimate the
lifetime of the equipment.

29
institutionalized, it is suggested that data collection and analysis could take place every 2–4 years in a
given country, in order to be able to feed into the GLAAS report. Over the 4-year period, it would be preferable to collect time-series data rather than data for a single year. When information is not
available for several years in a row, data gaps can be filled by triangulation or linear regressions.
The exact timing of such exercises would need to take account of policy definition processes in each country. Coordination with data collection of physical indicators, such as with data collection for the
WHO/UNICEF JMP, should be encouraged, so as to allow for economies of scale in data collection
and the potential computation of cost-effectiveness indicators.
If data are collected over a relatively long period (e.g. 4 years), it will be necessary to agree on
common rules for dealing with inflation. In most cases, it will be easier to collect data in nominal terms. If there has been substantial inflation over that period, it may be necessary to deflate these data
back to a base year so as to eliminate any inflation impact and therefore express the data in real terms.
Institution in charge of data collection. In each country, a national-level institution should take the lead for managing the data collection exercise and reporting on the basis of the commonly agreed
framework, with limited external support from international organizations and their consultants. This
institution could be either a sector institution (e.g. the ministry of water or ministry of environment) or the national bureau of statistics. Cooperation between these two types of actors should also be
encouraged.
Analysing financial data
In order to analyse the information collected in such a way, it will be necessary to define a set of
common matrices and indicators. The main objectives of these tools will be to answer the following
questions:
What is the total expenditure in the sector?
How are the funds distributed to the different WASH services and expenditure types?
Who pays for WASH services, and how much?
Which entities are the main channels of funding for the WASH sector, and what is their share of
total spending?
Matrices can be useful to cross-tabulate data so as to visualize the information across two
dimensions, such as:
distribution of WASH sector expenditure by financing agent;
distribution of WASH sector expenditure by financing source;
distribution of WASH sector expenditure by service provider;
distribution of WASH asset stock by financing agent;
distribution of WASH sector expenditure by type of service provided.
The NHAs have defined a set of commonly agreed matrices, which facilitate comparisons across
countries. A final set of recommended matrices should come out of the testing exercise.
Single indicators can be useful as headline figures and cross-national comparisons, such as:
total expenditure on the WASH sector at the national level (and total expenditure on each
subsector taken separately, such as drinking-water, sanitation and hygiene);
total expenditure on WASH per capita;
total WASH asset stock per capita;
30
total expenditure on WASH as a percentage of GDP;
total expenditure on WASH as a percentage of total public spending;
recurrent and capital expenditures as a percentage of total WASH expenditure;
sanitation expenditure as a percentage of total WASH expenditure.
It would be preferable to define a small set of common indicators estimated in a consistent manner across countries, then let individual countries define their own indicators, depending on what is most
relevant in their own policy determination processes.
To the extent possible, such indicators should be defined in ratio terms, in order to avoid the distorting
impact of exchange rates. In terms of presentation, certain indicators would benefit from being
presented in comparison with actual levels of GDP, however. For example, the figure that shows the
percentage of WASH sector expenditure as a percentage of GDP (Figure 9 in the 2010 GLAAS report) does not give an indication of the relative sizes of GDP from one country to the next. It would
be preferable to chart the percentage of WASH expenditure on the x-axis and show GDP per capita on
the y-axis. This is what is typically done in the health sector and enables seeing whether there is any type of “GDP impact” on WASH sector spending.

31
5 Setting out a roadmap for methodological development
Reaching consensus on a commonly agreed methodology and subsequently rolling it out to a large
number of countries will require a process of consensus-building among sector actors. This process will have to be carried out over a number of years, with the following actions:
Build on existing partnerships or establish a dedicated partnership between leading sector
actors to develop a common methodology comparable to the NHAs. This partnership could
include, for example, WHO, the World Bank/WSP, the OECD and the UN Statistics Division, as well as Sanitation and Water for All, NGOs (e.g. WaterAid) or research centres (e.g. IRC) that
have carried out substantial amounts of work in this area. This partnership could work together
towards the development of a shared methodology and finance the rolling out of this methodology in a large number of countries, as well as conduct more detailed studies for specific
methodological issues as needed.
Set up a Technical Advisory Group to oversee the results of the testing study and refine the
methodology. This group should include representatives from a sample of national governments (including statistics institute, ministry of finance, ministry of water, ministry of environment),
international experts on WASH sector financing and experts on the SHA and on the NHAs.
Develop an iterative plan to improve the methodology gradually. It will be important not to
“overburden” national governments to start with, but ultimately aim for a reporting framework
that could be owned and implemented by national actors, applied all the way down to local
governments and commonly accepted (i.e. the equivalent of an NHA system).
In each participating country, identify an institution in charge of supervising the data
gathering process and “hosting” the data over time, so as to allow continuity. The “host”
institution may differ from country to country and will need to be identified following
consultation among the active sector partners.

32
Annex A: Existing initiatives in the WASH, health and
education sectors
Financial tracking initiatives in the WASH sector
Initiatives led by WHO
The GLAAS report
The Global Analysis and Assessment of Sanitation and Drinking-Water (GLAAS)1 is a UN-Water
initiative implemented by the World Health Organization (WHO). The objective of GLAAS is to provide policy-makers at all levels with a reliable, easily accessible, comprehensive and global
analysis of the evidence to make informed decisions in the water, sanitation and hygiene (WASH)
sector.
In 2008, WHO conducted a GLAAS pilot study that demonstrated both the need for and the
importance of collecting additional data from countries and external support agencies regarding sanitation and drinking-water. At the country level, it was determined that existing data on
institutional capacity and financing contained critical gaps relating to periodicity, geographical extent
of reporting, disaggregation of data and comparability. For external support agencies, it was
determined that existing data did not cover all types of donors to sanitation and drinking-water and that additional data beyond financing, such as prioritization, future planning and alignment, were of
interest to policy-makers. The pilot report concluded that these additional data are crucial to improve
the comprehensiveness of global sanitation and drinking-water reporting and to better inform policy-making (UN-Water, 2008).
Acknowledging the fact that the sanitation and drinking-water sector lacked a global, periodic and
comprehensive sector analysis, able to talk to and influence high-level policy-makers, the first GLAAS report was published in 2010. It wished to present a global and all-round picture of the
sanitation and drinking-water sector by attempting to “bring all the pieces of the puzzle together” and
complementing the information provided by existing reports and initiatives.
The 2010 GLAAS report pointed out where efforts stagnate in achieving the Millennium
Development Goal (MDG) target on water and sanitation, and which post-2015 challenges need to
be addressed. It aimed to provide a deeper understanding of the catalysts for, and obstacles to, progress in the water and sanitation sector. There are three main parts to the 2010 GLAAS report
(UN-Water, 2010):
Part 1 presents an analysis of priority-setting, examines targeting of sanitation and drinking-water
funds and external aid, and discusses the adequacy of financial flows.
Part 2 discusses the sustainability of drinking-water and sanitation services along with current
status and trends concerning sanitation and drinking-water policies, institutions, planning and
monitoring, budgets and human resources in developing countries.
Part 3 examines opportunities for improving performance through stakeholder coordination, aid
alignment and mutual accountability.
1 The title has now changed from “Annual Assessment” to “Analysis and Assessment”.

33
As far as possible, in order to avoid duplicating efforts, GLAAS uses data that have already been
collected and analysed. The main sources of existing data used by GLAAS are the WHO/United Nations Children’s Fund (UNICEF) Joint Monitoring Programme for Water Supply and Sanitation
(JMP), which is the official United Nations (UN) mechanism to monitor the sanitation and drinking-
water MDG target, and the Organisation for Economic Co-operation and Development (OECD)
Creditor Reporting System (CRS) database, which collects aid funding data from bilateral (23 countries) and multilateral (16 agencies or international banks) donors in OECD countries.
To address information gaps in countries, GLAAS, in collaboration with the World Bank’s Water
Sanitation Program (WSP) Country Status Overview (CSO) project, developed a three-part survey
questionnaire and consultation process for data collection at the country level. Each questionnaire
consisted of questions for governments concerning policies, institutions, planning, financing, human resources, sustainability and outputs, disaggregated in the four subsectors of urban water supply, rural
water supply, urban sanitation and rural sanitation, as well as between urban and rural services.
Detailed financial information on drinking-water and sanitation budgets and expenditures from both
government and external sources was also requested. Invitations to participate in the country data collection were sent to over 60 countries. A total of 42 countries, 27 in sub-Saharan Africa, 10 in
south or south-east Asia and 5 in other areas of the world, participated in the combined CSO and
GLAAS data collection effort.
While data availability was vastly improved compared with the pilot GLAAS, not all country
respondents could respond to all parts of the questionnaire. Of the 42 countries, 30 responded to Part I of the questionnaire, which was composed of mostly subjective trend information, but also coverage
data for schools, information on human resources and future coverage targets. Twenty-six countries
responded at least partially to Part II of the questionnaire, which requested a breakdown of budgets and expenditures from 2006 to 2011. Forty out of 42 countries responded to Part III of the
questionnaire, which contained mostly evidence-based questions concerning policies, institutions,
financing and sustainability, with potential responses on a three-step scale. Financial information
was generally available for central government and external donors, but many countries had
difficulties in reporting on subnational and local government expenditures.
To address information gaps concerning external development aid, GLAAS 2010 also included a
data gathering exercise aimed at bilateral and multilateral donors, nongovernmental organizations
(NGOs), private foundations and international agencies. Two questionnaires were developed, one
for agencies that already report aid flows to the OECD-CRS and one for agencies that do not report to
the OECD-CRS. WHO invited 65 bilateral and multilateral agencies, private foundations and other NGOs that provide development aid, research or other support to the sanitation and drinking-water
sector to participate in the survey. Twenty-seven external support agencies responded to the 2009–
2010 GLAAS external support agency survey, representing an estimated 90% of reported aid
directed specifically at water and sanitation.
A main focus of GLAAS 2010 was to determine whether existing financial flows are sufficient to achieve the MDG target for water and sanitation. To determine the adequacy of existing financial
flows, either for national governments or globally, current and/or projected financial expenditures
need to be assessed against estimated financial needs. Countries were requested to make this estimate, and the results show that only two countries (Kenya and South Africa) estimated that they had more
than 75% of what is needed to achieve the MDG target for sanitation, and five countries estimated
that they had more than 75% of what is needed to achieve the MDG target for drinking-water. Yet this
exercise considers financial requirements only in terms of capital investment for the expansion of existing infrastructure or construction of new infrastructure in order to determine those people
currently without access to the services. An estimate of required funding for operation and
maintenance is included, but only with reference to the new infrastructure developed. This approach
seems to underestimate the financial requirements needed to allow existing services to function

34
correctly; in other words, it does not include costs related to operation and maintenance of existing
infrastructure and services or costs of rehabilitation of assets.
WHO global costing exercise
In 2008, WHO promoted a study on the “Regional and Global Costs of Attaining the Water Supply
and Sanitation Target (Target 10) of the Millennium Development Goals” (Hutton & Bartram,
2008). The study focused on developing countries. Given the different completeness of water and
sanitation data, slight variance existed between the countries included for water and those included for
sanitation. The estimate of costs of achieving the water component of the MDG target was based on 91 countries with a combined population of 5.84 million in 2015 (93% of the projected population of
6.25 billion for non-OECD regions). The costs of achieving the sanitation component of the MDG
target was based on 94 countries with a combined population of 5.68 billion in 2015 (91% of the
projected population of 6.25 billion for non-OECD regions).
The study was a costing exercise and not a financial flow tracking exercise; therefore, its goal was
not to track existing financial flows but to estimate financial gaps on the basis of a certain number
of methodological assumptions. The study used improved water and sanitation JMP coverage data for
1990 and 2004 to estimate the population to be covered to attain the MDG target, taking into account population growth until 2015. The targeted population was assumed to receive improved water and
sanitation in equal annual increments from the beginning of 2005 (the base year) until the end of
2014. Investment and recurrent costs per capita were applied to the target population. The main difficulties of the costing exercise were due to the complexity of estimating the cost of
maintaining and/or replacing existing facilities, while very few data were available on the actual state of infrastructure. This implies that the asset base was valued using replacement cost value. For
example, it was impossible to know how much of existing coverage needed replacement or renovation
and very difficult to estimate how much investment is currently taking place. In the costing model, estimates were based on unit cost data and the average length of life of infrastructure. Difficulties
were also encountered in estimating investment at the household level; it would have been necessary
to conduct household surveys on expenditure on water and sanitation to complement partial data, but
this was not possible at a large scale. Operation and maintenance costs were estimated based on different percentages for different technologies; these costs were estimated to reach up to 10% a year
for bigger systems. Operation costs were estimated per cubic metre of treated water and wastewater.
A new costing study has recently been released by WHO to update the 2008 exercise (Hutton,
2012). This new edition uses more recent coverage data and more reliable data on country-level
unit cost, drawing on the WASHCost and Economics of Sanitation Initiative1 experiences. New sets
of information have been integrated, including data on household water treatment at point of use and
higher unit costs for more resilient facilities. This study also considers different levels of water and
sanitation services, following the service ladder approach: no facilities, unimproved, improved,
household connections.
Initiatives led by the UN Statistics Division, Department of Economic and Social Affairs
The System of Environmental-Economic Accounting for Water (SEEA-Water)
2 provides a
conceptual framework for organizing hydrological and economic information in a coherent and consistent manner. It has been prepared by the UN Statistics Division in collaboration with the
1 The Economics of Sanitation Initiative aims to measure the costs and benefits of sanitation improvements. It
has been launched by the WSP in the East Asia and Pacific region and will be extended to other WSP regions. It
comprises two phases: a sanitation economic impact study (2006–2007) and a sanitation cost–benefit study
(2008–2009). 2 See the UNSTAT web page on environmental accounting (link provided in Annex D).

35
London Group on Environmental Accounting, in particular with its Sub-Group on Water Accounting,
under the auspices of the UN Committee of Experts on Environmental-Economic Accounting.
SEEA-Water is based on the 2003 System of Integrated Environmental and Economic Accounting
(SEEA), which it further elaborates to cover in more detail all aspects related to water. Both SEEA
and SEEA-Water use as a basic framework the 1993 System of National Accounts (SNA), which is the international standard system for the compilation of economic statistics. As such, they have a
similar structure to the SNA and share common definitions and classifications. In 2007, the SEEA-
Water framework was adopted by the UN Statistical Commission, which also encouraged countries to implement it.
SEEA-Water was developed with the objectives of standardizing concepts and methods in water
accounting. The advantage of the SEEA-Water approach is that it provides a tool to integrate
hydrological and economic information in support of environmental-economic analysis, thus
overcoming the tendency to divide issues along disciplinary lines. SEEA-Water is potentially an
important tool for policy-makers, as it provides them with indicators to monitor the interaction between the environment and the economy, with a database for strategic planning and policy analysis
to identify sustainable development paths and appropriate policy instruments for implementing them.
The SEEA-Water framework comprises the five categories of accounts (UN Statistics Division, 2007):
Category 1: Physical supply and use tables describing the flows of water from the environment
within the economy and back to the environment;
Category 2: Emission accounts describing the amounts of pollutants added to water as a result of
production and consumption;
Category 3: Hybrid and economic accounts linking the physical accounts with the monetary
information of the national accounts, disaggregated for water and sanitation;
Category 4: Water asset accounts;
Category 5: Quality accounts describing the quality of water and the changes in quality; these
accounts are still experimental.
Of these, category 3 (hybrid and economic accounts) is particularly interesting in terms of tracking
national financial flows to water and sanitation services. This category of accounts aligns physical
information with monetary information on supply and use. These accounts are referred to as “hybrid” because they combine different types of measurement units. In these accounts, physical
quantities can be compared with the matching economic flows. This category of accounts includes
information on the costs associated with water use and supply, such as water abstraction, purification, distribution and wastewater treatment. It also provides information on financing—for example, the
amount users pay for the services of wastewater treatment, and the extent to which these services are
subsidized by the government and other units. These accounts can help governments take decisions in
terms of cost recovery policies and water allocation policies and can be used in economic models to evaluate potential costs and benefits of putting in place new infrastructure.
Hybrid and economic accounts describe in monetary terms the use and supply of water-related
products to identify (1) the costs associated with the production of these products, (2) the income
generated by their production, (3) the investment in water-related infrastructure and the costs to
maintain them and (4) the fees paid by the users for water-related services as well as the subsidies
received. Table A.1 provides information by industry classification (International Standard Industrial Classification of All Economic Activities [ISIC] codes 36 and 37 are the ones that are relevant to
water supply and sanitation, although they do not exactly match the definition of WASH services) on
the output produced, including water-related output, the intermediate consumption, including the costs of purchasing water and sewerage services, and value added. It also presents information on gross
fixed capital formation for water-related infrastructure by industry, which represents the investments
in fixed capital related to water (infrastructure).

36
It also shows the closing stocks of fixed assets for water supply and sanitation (e.g. pumps and dams). The stocks of fixed assets represent the total value of infrastructure in place, disaggregated according
to whether they relate to water supply or wastewater services.
Table A.1. Hybrid account for supply and use of water
Source: UN Statistics Division (2007)
Activities in Table A.1 are classified to the relevant ISIC1 category regardless of the kind of
ownership, type of legal organization or mode of operation. Therefore, even when activities for water collection, treatment and supply (ISIC 36) and sewerage (ISIC 37) are carried out by the
government (as may be the case in some countries), they should be classified to the extent possible in
the specific classes (ISIC 36 and 37) and not in ISIC 84, Public administration. When information is available, the producing units could be further disaggregated according to the type of institutional
sector that owns them (government, corporation and households). In order to provide a complete
picture of the economy of water, the hybrid account tables should be complemented with the accounts
for water-related activities carried out for own use and for expenditures of the government on collective consumption services related to water (intermediate consumption, compensation of
employees and consumption of fixed capital).
To date, more than 50 countries have expressed interest in compiling national environmental-
economic accounting for water following the SEEA-Water framework. These are mostly developed
countries (mainly European Union countries), but some developing countries are also starting to adopt the framework.
2 At the national level, SEEA-Water is being implemented gradually, as a step-
by-step process. Data on the physical aspects of water resources (flows and stocks, as well as
abstraction and pollution) are being compiled first, and only in a second phase are monetary data
being included. Only very few countries have been able to develop complete accountings, including
1 The ISIC code was developed by the UN as a standard way of classifying economic activities. The ISIC code
groups together enterprises if they produce the same type of goods or service or if they use similar processes.
The original ISIC code was adopted in 1948, and it has been periodically reviewed since. 2 These countries include, for example, South Africa, Zimbabwe, Namibia, Botswana, Mauritius, Dominican
Republic, Ecuador, Mexico, Panama and Colombia.

37
both physical and monetary data. The UN Statistics Division is encouraging countries to use this
system of accounts by organizing regional workshops and delivering capacity-building activities. However, they are not providing financial support to countries that wish to adopt this system of
accounts.
Initiatives led by the World Bank group
The World Bank has a history of providing assistance to its client countries on improving public
financial management in the WASH sector. As such, it has piloted several initiatives to improve
tracking of financial flows in the WASH sector, with various objectives.
Water and Sanitation Program: Resource flows assessments
In 2003, WSP-Africa initiated a regional initiative to track financial flows in the water supply and
sanitation (WSS) sector. The initiative was aimed at providing assistance to sector leaders, policy-
makers and development partners to help African countries meet the MDG target on water and sanitation, through rationalizing allocation of public funds, leveraging non-public resources and
improving targeting of required subsidies. As a result of this initiative, sector finance and resource
flows assessments have been developed (between 2003 and 2004) for five countries: Ethiopia (only water), Kenya, Uganda (only sanitation), South Africa and Zambia.
The main objectives of these assessments were to develop a better understanding of water sector
finance, to develop better country-level and sector-wide financing strategies and to improve the
incorporation of WSS into poverty reduction strategy papers (PRSPs) and medium-term
expenditure frameworks (MTEFs). The goal of the studies, which were mainly based on secondary
sources of information (budget documents, reports and databases), was to test a methodology for resource flows assessment at the country level that could be generalized in different countries in the
region. The methodology included the development of a framework to assess the WSS-related
financial resource flows and of a benchmarking tool to assess the sector financial performance. Benchmarking is done on the basis of three criteria:
adequacy of sector finance to meet the MDG target and the country’s own targets and extent of
resource leveraging;
effectiveness in terms of match between sector strategy and public allocations, decentralization
and financial viability of service providers, equity and poverty focus;
efficiency in terms of utilization of resources, value for money achieved in the sector and
operating performance of service providers.
The assessments’ methodological framework includes two tools:
institutional mapping, which captures the governance structure of the sector and relates the
importance of governance to efficient and effective channelling of funds and implementation;
financial mapping, which tries to capture all sector sources (especially public funds, as they are
considered to be the dominant source in the sector), channels and uses of funds, defined as follows:
o “Sources” include general government revenues (national and local taxes), user charges,
assistance from donors (loan/grants), household savings, providers’ surplus and market borrowing.
o “Channels” refer to the way in which the funds are mobilized and allocated. They include
government budgets (national, regional and local), special sector or multisector funds, internal
generation by utilities and providers, off-budget funding through NGOs and community contributions.

38
o “Uses” refer to development and recurrent expenditures by different service providers
(operation and maintenance versus capital investments for new services, augmentation or rehabilitation).
For a given country, sector financial mapping is done by (1) determining the actual channels and
sources used by different service providers and the manner in which resource flows take place, (2) measuring the actual resource flows within this framework and (3) determining the emerging financial
arrangements, as most countries in the region are undergoing change. The measurement is done for
both development and recurrent expenditures.
After having developed the sector financial mapping, public finances are analysed in more detail.
Three aspects are important for the public finance analysis:
decision-making for allocation of public resources (considering the medium-term expenditure
framework, ongoing decentralization processes, the nature and level of consultations, etc.);
review of rules, procedures and regulatory framework (considering the incentives for efficiency,
especially in reaching the poor, the potential for service providers to mobilize finance from
different sources, and the extent of community contributions and cost recovery);
analysis of monitoring and accountability systems (considering the link between public finance
allocations and actual results, and assessing the value for money achieved with public resources).
A wide range of policy-relevant indicators are used to measure WSS financial flows. Core
indicators used in the resource flows assessments include:
relative shares of recurrent and development expenditures (%) per channel for finance;
development expenditure (million US$);
sector expenditure as a share of gross domestic product (GDP) (%);
per capita development expenditure (US$): total population and uncovered population;
non-functioning schemes by type in rural areas;
on-budget and off-budget (NGO) donor funds in the sector (a comparison between four African
countries);
revenues and expenditures for main urban water supply service utilities;
estimates of allocations by NGOs for projects with a water component;
estimated investment requirements to meet coverage targets by 2015.
The main difficulties encountered in the resource flows assessments included limited data
availability, especially for nongovernment expenditures and for sanitation, and an inadequate level
of disaggregation of data. Ethiopia’s assessment particularly
highlights the paucity of available information for sector finance. Compared with public expenditure in the
water sector, however, information was even more difficult and at times simply non-existent for many non-
public sources and for sanitation …. In some cases it was necessary to use the limited available information
with “best judgment” assumptions to arrive at national estimates.
Although it was intended to include sanitation and household/community expenditures (other than for
user charges) in the study on Ethiopia, this has not been possible due to the lack of adequate
information.
Other difficulties highlighted include the fact that, even for available information from government
budgets, disaggregation of water sector data was often not readily available, and there was no
compiled information on allocations and expenditures by subnational governments. Adequate details of allocation and use of funds for different purposes (sector development and service providers in
rural and urban areas), as well as an appropriate classification for recurrent versus capital expenditure,
are also rarely available.

39
Through the resource flows assessments exercise, WSP-Africa identified three critical information
gaps in finance and resource flows, common to many countries in the region:
assessment of off-budget finance through NGOs;
assessment of user contribution, including tariffs, as well as expenditure for self-supply or on
coping costs to deal with inadequate and/or unreliable services;
assessment of finance for sanitation and hygiene promotion.
Based on this analysis, Mehta et al. (2004) concluded that
The lack of a comprehensive understanding of the flows of financial resources to the sector makes it
difficult to assess their linkages with sector reforms. The lack of finance understanding has also been identified as one of the key reasons for the weak representation of the water and sanitation sector in poverty
reduction strategy papers (PRSPs) and the intertwined budget process: medium-term expenditure
framework (MTEF).
World Bank: Public expenditure reviews
Public expenditure reviews (PERs) are diagnostic studies that assess national public spending in
different social sectors and examine the expenditures’ performance in terms of outcomes (services), as well as the sustainability of the expenditures (Pradhan, 1996). They have been conducted by the
World Bank since the 1990s, in order to “help countries establish effective and transparent
mechanisms to allocate and use available public resources in a way that promotes economic growth and helps in reducing poverty”,
1 as well as to orient the World Bank’s own country assistance
strategy. Conducting PERs on a repeated basis is promoted, although they are not a standard exercise.
PERs can be general in scope (concerning all main sectors of a country’s economy) or oriented to
one or several specific sector(s), such as education, health and water. Between 2003 and 2009, the
World Bank funded 40 PERs in which the water sector features (Van Ginneken, 2010). In most of
these PERs, the water sector was discussed alongside several other sectors (29 out of 40), and the analysis was limited to water supply and sanitation, excluding water resource management and
irrigation. PERs addressed specifically to the water sector, with the exception of Mexico, were all
undertaken in Africa and were mainly, but not exclusively, focused on rural water supply (8 out of 10). In 2010, the World Bank Africa region developed five more in-depth PERs for the water sector
(for the Central African Republic, the Democratic Republic of the Congo, the Congo, Togo and Sierra
Leone), which have been finalized and published in 2011 together with a synthesis paper (Van
Ginneken, Netterstrom & Bennett, 2011).
According to the United Republic of Tanzania’s country report (Van den Berg et al., 2009), the
objective of a WSS PER is “to assess the quantity and quality of the transfers of public funds to the
water and sanitation sector from the top of the chain (central government) to the bottom of the
chain (water users) and the quality and quantity of service delivery”. PERs aim, therefore, at gaining
insight into how budgeted allocations for the water sector translate into actual water and sanitation service delivery and at understanding what affects the links between the two. A main hypothesis
behind the PER’s exercise is that, while there may be a strong rationale behind the need for additional
public resources directed to the water sector, higher public expenditures do not necessarily result in
better social outcomes, because of a non-efficient or suboptimal use of existing resources.
Therefore, the PERs try to assess the efficacy, efficiency and quality of public expenditures in the
WSS sector in order to see if and how these social outcomes can be improved.
1 See the World Bank’s web page on Public Expenditure Reviews (link provided in Annex D).

40
In addition to commonly used indicators related to access to service (evolution of water and sanitation
coverage rates, disaggregated between rural and urban areas) and financial data (evolution of budget allocations, per capita investment cost, sources of funding, etc.), indicators used in PERs include:
link between allocations and functionality of urban and rural facilities;
recipient and local community contributions;
operating cost coverage ratio for utilities;
allocation across expense categories (disaggregated recurrent and development expenditures);
spatial allocation (between central and local administrations and between urban and rural);
budget execution rates (budget allocation versus actual capital and recurrent expenditure);
delays in funding transfers between national and regional/local authorities;
efficiency of investments (link between the volume of expenditures and improvements to access);
aid commitments and disbursements to the water sector (in millions of US dollars).
Undertaking a PER requires substantial resources. PERs are heavily data intensive and frequently
require in-depth knowledge of local conditions. While the cost of PERs has begun to come down in
recent years, a survey of all PERs carried out in 1992 revealed that the average cost of each report was
88 staff weeks, which translated into US$ 250 000.1
As the prime goal of PERs is at the national level, they are not based on standard classifications
and identical methodologies, but they are flexible so that they can adapt and develop according to country specificities. This approach allows PERs to reflect a country’s specific needs and priorities.
Yet the lack of standard classifications and the use of slightly different definitions and scopes
complicate benchmarking and cross-country comparisons. As a consequence, although there is now a
range of countries for which a good knowledge of public financial flows into the water and sanitation sector is available, there has been no study on overall lessons learnt from water PERs.
In 2010, the Water Anchor and the Africa Water and Urban Sector Unit launched an initiative to
synthesize key results from past water PERs (including an overview and benchmark of public
expenditure on WSS in selected African countries) and provide guidance (including a how-to guide
or toolbox) to assist with the preparation of future water PERs. This also includes setting up a web site with tools for analysing public expenditures in the education, health and social protection sectors.
AMCOW/WSP: Country Status Overviews (CSOs)
The WSS CSOs were commissioned by the African Ministers’ Council on Water (AMCOW) and
developed by the WSP in collaboration with the African Development Bank, UNICEF, the World Bank and WHO. The first round of CSOs concerned 16 African countries and was published in 2006
as a single report called Getting Africa on track to meet the MDGs on water and sanitation: A status
overview of sixteen African countries (AMCOW/WSP, 2006). The second round, which was extended to 32 African countries, was carried out in 2009–2010 and published in 2011–2012. Each CSO is
published separately, together with a regional synthesis report (AMCOW/WSP, 2011) to provide
feedback on findings and good practice emerging from the CSOs.
The CSOs are focused on assessing countries’ level of preparedness to meet the MDG target and
the financing requirements and gaps to achieve the MDG target. They also assess the sustainability
of the sector and include recommendations regarding steps needed to improve performance. For the evaluation of current spending, the CSOs used the same matrix as the one used by GLAAS for the
2010 report. The focus is on collecting data on capital expenditure, as well as recurrent expenditure
that is needed for the purpose of delivering such investments.2 They sought to obtain data on both
1 See the World Bank’s web page on Public Expenditure Reviews (link provided in Annex D). 2 The main objective of this exercise is to evaluate whether countries have the “absorptive” capacity of
delivering such investments.

41
budgeted and actual expenditure, as the ability to disburse funds was deemed critical for the
underlying sector analysis, and one of the key underlying questions was whether funds for meeting the MDG target were available but were not being spent.
The CSOs consist of individual country reports produced through data gathering from existing local
sources and detailed broad-based consultations with government agencies and country sector stakeholders. Three carefully structured instruments were used to collate and analyse data:
Scorecard: a tool to identify drivers and barriers in the “service delivery pathway” for turning
finance into water and sanitation services in each of the four main subsectors: urban water supply, rural water supply, urban sanitation and rural sanitation. The scorecard allows each building block
of a subsector to be considered in turn. Scores are generated with reference to specific indicators,
and a simple visual key allows bottlenecks to be easily identified;
Costing tool: an Excel-based model including data on current spending on capital investment (and
associated recurrent expenditure) and estimating the annual investment required for infrastructure
(new and replacement) in each subsector, as well as what proportion will need to be met from
public finance based on existing subsidy policies. This is then compared with anticipated public
investment from national, donor and NGO sources, to identify any investment gaps;
Questionnaire to sector ministries: a questionnaire that elicits formal inputs to the costing model
as well as supplementary qualitative information regarding progress (e.g. on donor coordination).
Difficulties encountered in the CSO exercise included availability and reliability of data and
estimates, especially concerning public expenditures to sanitation, anticipated funds and household
contributions. It was found that sector monitoring systems and records of domestic expenditures are
weak across most countries, with budgets being generally unclear and not very detailed. For example, it was not always clear whether countries had included expenditure on water resources (e.g. building
storage) in their estimates of baseline costs. For a certain number of countries (especially fragile
states), allocations to each subsector were difficult to discern at all levels of government, with a large
amount of finance (more than 50% in most cases) not captured in the budget at all. In 27 of 33 countries examined, separating out rural sanitation allocations at any level was difficult or impossible,
as these were included in water supply, health and education spending.
Partly due to the consultative nature of the CSO process, the cost of putting together a country CSO
was in the range of US$ 30 000 to US$ 50 000 per country, to which must be added the overall
coordination costs to ensure that the methodology is consistently applied and results are comparable.
The process of preparing a CSO in each country was spread over about a year, whereas the second round of the CSO exercise took about 2 years from commitment to publication.
The WSP has been requested by a number of sector actors to use the CSO diagnostic tool in other countries. For example, the African Development Bank is planning to expand the CSO exercise to
North Africa, UNICEF is to apply it in Asia, and the WSP will apply it in Latin America. In addition,
it is planned that countries will update the scorecard and revise priority actions in 2012. The full CSO exercise is unlikely to be repeated before 2015, however, at which point it would be done based on a
revised methodology.
Africa Infrastructure Country Diagnostic (AICD)
Most recently, the World Bank has managed the Africa Infrastructure Country Diagnostic (AICD)
process on behalf of a wide-ranging group of donors, to improve public understanding of Africa’s
infrastructure situation.1 The AICD has undertaken unprecedented data collection and analysis on
1 The AICD was implemented by the World Bank on behalf of a steering committee chaired by the African
Union Commission and comprising the New Partnership for Africa’s Development, the African Development
Bank, Africa’s regional economic communities and donors investing in African infrastructure. The main
contributors included the United Kingdom Department for International Development, the Public Private

42
the status of the main network infrastructures, including energy, information and communication
technologies, irrigation, transport, and water and sanitation. The analysis encompasses public expenditure trends, future investment needs and sector performance reviews. The AICD found that
collecting data on current spending flows was by far one of the most difficult data collection
exercises. It was based on three main databases, including:
household surveys (used to analyse the current status and access trends, use and payment for
infrastructure services, with data also on household assets and expenditure patterns);
AICD WSS survey, with data collected from ministries, sector institutions and water utilities with
a view to capturing institutional and performance variables (these data were integrated with
International Benchmarking Network for Water and Sanitation Utilities [IBNET] data);
AICD fiscal database, for the country-level analysis of the volumes, patterns and composition of
financial resources to the sector. This database captures information on public spending in the
infrastructure sector in 25 countries and is, according to the authors, “a unique attempt to
document in a standardized manner the levels and patterns of public spending for infrastructure”.1
For the water and sanitation sector, the AICD flagship report (Foster & Briceño-Garmendia, 2010)
evaluated current spending from both public and private sources in 24 sub-Saharan African
countries and estimated the financing gap to reach the MDG target and how such a gap could be filled from existing or future sources. The initial set of countries accounted for about 80% of total
GDP in Africa and was defined to be representative of a range of country circumstances, levels of
income and infrastructure development, geographical situation, etc.
The flagship report found that existing annual spending on water supply and sanitation in sub-
Saharan Africa is US$ 7.9 billion (1.2% of the region’s GDP), or about a third of what is required if
the MDG target is to be met. The analysis conducted enabled the breakdown of current expenditure by functional category (i.e. capital investment versus operations and maintenance), by funding source
and by financing channel (i.e. type of institutions channelling the funds). Data are usually expressed
as a percentage of GDP in order to enhance comparability between countries. The analysis revealed
some very interesting and previously unexpected findings. For example, the report found that households in sub-Saharan Africa contribute to almost half of total capital investments in the sector
(mostly for on-site sanitation). According to the report (Foster & Briceño-Garmendia, 2010, p. 217),
in Sub-Saharan Africa, households are important financiers of capital investment (0.3 percent of the Sub-
Saharan African GDP) and account for $2.2 billion, most of it dedicated to the construction of on-site
sanitation facilities, such as latrines. The level of contributions from OECD donors is similar to that of
domestic public resources (comprising tax revenue and user charges raised by SOEs [state-owned
enterprises]), equivalent to 0.2 percent of the Sub-Saharan African GDP. The contribution of non-OECD
countries is only 0.03 percent of the Sub-Saharan African GDP.
Finally, contributions from private sector operators were found to be negligible, with local capital markets contributing next to nothing to the WSS sector in sub-Saharan Africa and little prospect for
doing more.
The analysis started by carrying out an institutional mapping of the sector, to define the scope for
the data collection exercise. There were a number of methodological issues in terms of defining the
sanitation and hygiene sectors in particular, as existing government finance classifications (e.g. by the International Monetary Fund) were not deemed to be sufficiently detailed to capture the relevant
Infrastructure Advisory Facility, Agence Française de Développement, the European Commission and the
World Bank. 1 Financing flows within public spending are defined as including tax revenue or user charges channelled
through both on-budget (central and local governments) and off-budget mechanisms (state-owned enterprises
and special funds).

43
flows. Tracking expenditure on hygiene was deemed particularly difficult, as these budgets are
typically split between several ministries.
Most of the analysis of current expenditure was focused on public spending from national and
local governments as well as off-budget entities, such as utilities and special funds.1 With respect to
tracking data from decentralized entities (local governments and utilities), they included data from the
three largest (considered to be the most significant) entities. For utilities, they relied on published financial accounts, which were not always available in all cases (in addition, cash flow statements are
seldom publicly available, although they are the accounts that clearly state the amounts that have been
allocated to investments). They also included spending from “special funds” (e.g. rural water supply funds), which have centralized budgets but usually channel financing via local governments. In
contrast, they were not able to track expenditure by NGOs, which was identified as a significant issue.
The analysis was carried out by local consultants, with a lot of support from the World Bank in Washington, DC, to ensure consistent application of the methodology. Data were collected with
support from the African Development Bank and the WSP (in the field) over a 2-year period; it was
estimated that data collection alone took about 40 consultancy-days per country (this is an estimate for
all seven sectors, however). The methodology has been published in the form of a Handbook on infrastructure statistics (AICD, 2011), which also includes data collection templates.
The methodology underlying the AICD report has now been transferred to the African
Development Bank. Data collection and analysis have already been rolled out to a total of 48 countries in sub-Saharan Africa and are soon to be extended to North Africa.
Initiatives led by the OECD: Strategic Financial Planning for Water Supply and
Sanitation (OECD, 2009)
Following the 2006 OECD Development and Environment Ministers’ call for strengthened efforts
to ensure adequate provision of water and sanitation services in developing countries, the OECD
established a Task Team on Sustainable Financing to Ensure Affordable Access to Water Supply
and Sanitation.2 In 2007–2008, the Task Team collected and analysed good practices on approaches
and tools supporting strategic financial planning in the WSS sector, carried out several pilot experiences applying such approaches and tools and summarized the results of the comparative
analysis3 and pilot experiences in a synthesis report.
The synthesis report, called Strategic Financial Planning for Water Supply and Sanitation, was
published in 2009. It is mainly addressed to developing countries and aims to provide analysis and
recommendations to assist governments to develop strategic financial planning for the WSS sector. It builds on the experience of developed OECD members in their own countries and in their developing country partners through development cooperation. It draws lessons from the work of the
OECD Secretariat through its Task Force for the Implementation of the Environmental Action
Programme in Eastern Europe, the Caucasus and Central Asia countries (Armenia, Georgia, Kyrgyzstan and the Republic of Moldova), as well as two additional initiatives developed through the
Task Force in Egypt and Lesotho.
Strategic financial planning (SFP) is concerned with ensuring that a national water policy is
realistic and that finance is available to implement it. The essential questions that SFP seeks to
1 “Off-budget” refers to public funds that do not go through the standard budget-setting process at the level of the national government and are spent by other public agencies. 2 See the OECD web page on the OECD DAC/EPOC Water Task Team (link provided in Annex D). 3 The national case-studies provided to the Task Team cover the following countries: Armenia, Austria, Czech
Republic, Dominican Republic, Ethiopia, France, Georgia, India, Kenya, Mexico, the Netherlands, Republic of
Korea, Republic of Moldova, Senegal, Spain, Turkey and Uganda. An example from Mozambique was also
provided in the report.

44
answer are who (users, taxpayers, donors…) should pay for what (operating/capital expenses,
water/sanitation, rural/urban/periurban areas, hardware/software expenses…). It determines how much money is needed and where it would come from.
The main objectives of SFP are to:
provide a structure to enable a policy dialogue to take place, involving all relevant stakeholders,
with the aim of producing a consensus on a feasible future WSS;
illustrate the impact of different objectives and target in a long-term perspective;
link sector policies, programmes and projects;
facilitate external financing by providing clear and transparent data on financing requirements;
identify sustainable sources of finance and financial modalities to support the future development
of infrastructure and services.
In practice, the SFP process is flexible and can adapt to the contexts and needs of the countries
that develop the exercise. In developing countries, SFPs have mainly focused on financial resource
mobilization, financial programming, affordability and service coverage target. For these countries, emphasis has been placed on financial resource mobilization, particularly from external support
through official development assistance (ODA) or loans from international financial institutions. In
this perspective, SFP “identifies why and where such funds are needed to complement revenue from
user charges and domestic public budget resources, and demonstrates how financial sustainability can be attained” (OECD, 2009, p. 55).
Experience shows that one SFP exercise costs around €200 000 – €400 000 per country, depending on the country. This amount includes consultant remuneration, OECD coordination work and
government costs. The exercise, which involves a lot of consultation with the government, takes about
18 months in total. Some SFP exercises have been conducted based on the purpose-built financial model FEASIBLE, developed by COWI (a Danish consultancy). This model and underlying process
have now been used in a set of countries, including Armenia, Bulgaria, Cambodia, China, Colombia,
Egypt, Georgia, Kazakhstan (at the national level and in one province), Kyrgyzstan, Lesotho, the
Republic of Moldova, the Russian Federation (in six provinces), Turkey and Ukraine. The model requires a lot of consultancy input to be operated, however, and a simpler version of the model has
been developed in some cases in order to increase stakeholders’ involvement at the national level.
Initiatives led by WaterAid (NGO)
WaterAid is an international NGO focused on improving poor people’s access to WASH. It works in 26 countries (17 established country programmes and 9 new programmes) in Africa, Asia and
the Pacific region. WaterAid also develops research work and studies to increase knowledge and
understanding of key aspects of the WASH sector, including finance. WaterAid believes that
Correcting the present under-investment in the sector cannot be justified unless the financial waste which
goes on is also eliminated. This waste results from money being spent in the wrong places, on unnecessarily
expensive or unsustainable technologies, or being lost in overly complex and lengthy bureaucratic
procedures of government or donors. Lack of transparency about budgets, spending and results also creates
opportunities for corruption.1
To increase knowledge and transparency concerning national financial flows in the WASH sector,
WaterAid has developed several initiatives and published various papers and studies2 on issues
concerning finance in the WASH sector, including:
1 Source: WaterAid’s web site (link provided in Annex D). 2 See list of publications on WaterAid’s web site (link provided in Annex D).

45
a series of National Water Sector Assessments, which include data and estimates on financial
flows and financial needs for the WASH sector. Studies for Madagascar, Ethiopia, Mozambique,
Uganda and the United Republic of Tanzania were published in 2005. Studies for Nigeria, Bangladesh and Ghana were published in 2006;
a report called Think local, act local, which draws on evidence from 12 of the poorest countries in
Africa and Asia and highlights the key blockages that stand in the way of development money
reaching the local authorities that have responsibility for delivering services;
a general assessment of financing of WSS at the local level (report published in 2008), followed
by detailed analysis of local-level financing of WSS services in six developing countries: Ethiopia, Ghana, Nepal, Nigeria, Uganda and Madagascar (country reports published in May
2009);
a comparative analysis on the effectiveness of public funding for sanitation in Thailand, Bihar
(India) and Dar Es Salaam (United Republic of Tanzania) (Trémolet & Binder, forthcoming). The objectives of the study were to identify the different sources of sanitation financing and determine
the share of financing originating from households and public sources for different components of
the sanitation “value chain” (from collection to safe disposal) and to make recommendations on increasing the effectiveness of public spending.
In 2010, WaterAid developed a detailed assessment of public financial flows in Ethiopia called
“Budget tracking of WASH sector in Ethiopia: An analysis of the cases at national, regional & local levels”. This study is particularly interesting in terms of the methodology adopted and the detail
of information gathered. The specific objectives for the Ethiopian budget tracking exercise (Aboma &
Kefale, 2010) were:
to estimate the portion of the national budget going into water supply and sanitation and track
how it flows down to local levels against available policy guidelines;
to identify and analyse factors affecting the allocation and utilization of budgets by the water
supply and sanitation sector;
to put forward policy recommendations for the betterment of water and sanitation sector
investments.
The study used quantitative (budget allocated to WASH at all government levels for the most recent
5 years) and qualitative data (opinion survey to key stakeholders). A purposive sampling technique was used to select three regions and six local governments (two per region: one from those included in
the donor-supported WASH programme, and the other government financed). Budget data were
collected from the line ministries of finance and economic development, water resources and health. This was done at federal, regional and local government levels. Indicators used in the study included:
trend in the financing sources for WASH programmes in the last 5 years (treasury, assistance,
loans);
trend in the federal government capital and recurrent and region subsidy;
percentage share of WASH in national budget and GDP;
level of utilization of funds (earmarked donor funds managed by the ministry of finance; WASH
funds);
trend in the percentage share of WASH in regional and local budgets;
level of capital intensiveness for selected poverty sectors.
The research encountered several difficulties, especially from the lack of an established mechanism
to access budget data and limited available information. In particular, sanitation has no specific budget line and no specific department within the health institutions across the different levels of
governments; this makes tracking the total dedicated budget for sanitation a difficult task. To estimate
the amount of budget indirectly going into sanitation, this study used 44% of the salary of health extension workers (which accounts for only 2% of the health budget and only 0.17% of the national

46
budget). Roughly 50% of sanitation budgets came from donors, while the government and NGOs1
have contributed about 40% and 10%, respectively, during the past 5 years.
Another interesting initiative developed by WaterAid in 2010 is WASHwatch, an online platform
for civil society organizations to monitor government commitments and budgets in the WASH
sector. The site enables comparison of different countries’ progress against political declarations and government budgets for WASH.
Data in WASHwatch are now available for 20 countries. The most detailed and comprehensive web pages have been developed for Nepal, Uganda, Mali and Burkina Faso. Figures are taken directly
from the national budget. The amounts provided are totals and include capital and recurrent budgets
and rural and urban allocations. They exclude off-budget aid or allocations and exclude financing for water resource management and irrigation. Only budgeted amounts are considered, without assessing
whether the amount has actually been spent.
The criteria for analysis are objective and transparent and therefore comparable across countries.
For each country, data and information provided are classified in four sections: sanitation policy,
water policy, WASH finance and access to WASH. For the first two sections, the country’s performance is evaluated on the basis of several indicators concerning policy, finance, institutions and
monitoring, and a final score is given out of 20.
For the WASH finance section, two main graphs show the evolution of the government’s WASH
budget between 2006 and 2011, one as an absolute value and one as a percentage of the total government budget. Below the graphs, a table summarizes the following key financial indicators for
the years 2006–2011:
government WASH budget as a percentage of the total budget;
government WASH budget as a percentage of GDP;
government WASH budget (current US dollars, millions);
government WASH budget (local currency, millions);
government budget for sanitation only (local currency, millions);
total government budget (local currency, millions);
GDP (current US dollars, millions, International Monetary Fund);
average US dollar exchange rate for that year (http://www.xe.com).
WASHwatch is willing to avoid duplication and therefore tries to be complementary to existing initiatives (e.g. GLAAS), especially focusing on monitoring commitments and with a special focus on
accountability.
Initiatives led by IRC International Water and Sanitation Centre (IRC)
The WASHCost project, launched by IRC in 2008 with support from the Bill & Melinda Gates
Foundation, aims at improving knowledge about the real disaggregated costs in the life cycle of
WASH service delivery to poor people in rural and periurban areas in the developing world. The starting point of the 5-year WASHCost project is that it is easier to build new systems than to
maintain existing ones. According to the WASHCost brochure (WASHCost, 2010a),
one in three hand pumps are not working in Africa and too many users find that their hand pumps last only three years instead of their design life-time of twenty years. Many latrines are abandoned and some
1 The sanitation budget considered in this analysis as off-budget was based on the data collected from 40 WASH
NGOs, while there are hundreds of them operating in the country. The share could be different if the
contributions of all NGOs in the sector were considered.

47
converted into washing houses or grain storage… This is a lot of money, which is going into infrastructure
that fails to meet expectations.
According to WASHCost, the lack of accurate information, especially in rural and periurban areas
in the developing world, makes it difficult to estimate the true cost of providing sustainable water
and sanitation services to the poor. To improve the sustainability of WASH services, WASHCost
aims at developing a methodology for costing sustainable services by assessing life cycle costs and comparing them against levels of service provided in reality. They believe that knowing what
sustainable service delivery costs at local and national levels is a critical step towards effective
planning for equitable access to water and sanitation.
In order to improve the sustainability of WASH services, the WASHCost project seeks not only to
better understand the true life cycle cost of WASH services, but also to explain why life cycle cost
assessment is important and to mainstream the life cycle cost approach into WASH governance processes at all institutional levels, from local to national to international.
Life cycle costs are defined (WASHCost, 2010b) as follows:
Life-cycle costs (LCC) represent the aggregate costs of ensuring delivery of adequate, equitable and
sustainable WASH services to a population in a specified area. These costs include the construction and
maintenance of systems in the short and longer term, taking into account the need for hardware and
software, operation and maintenance, capital maintenance, the cost of capital, source protection, and the
need for direct and indirect support, including training, planning and institutional pro-poor support.
WASHCost considers six main components of life-cycle costs, as shown in Table A.2.
Table A.2. Components of life cycle costs considered by WASHCost
Cost component Explanation
Capital expenditure, including hardware and software
Initial costs of putting new services into place: “hardware” such as pipes, toilets and pumps and one-off “software” costs such as associated training and consultations.
Operating and minor maintenance expenditure
Routine maintenance and operation costs to keep services running (e.g. wages, fuel or any other regular purchases). Neglect has long-term consequences for service delivery, such as expensive capital (maintenance) expenditure and/or service failure.
Capital maintenance expenditure Occasional large maintenance costs for the renewal, replacement and rehabilitation of a system. These essential expenditures are required before failure occurs to maintain service levels and need to be planned for.
Cost of capital The cost of borrowing money or investing in the service instead of another opportunity. It also includes any profits that service providers may earn and that are not reinvested. It has a direct impact on the ability to maintain a service financially.
Expenditure on direct support Post-construction support costs (e.g. training for community or private sector operators, users or user groups). These costs are often forgotten in rural water and sanitation estimates but are necessary to achieve long-term functionality and scale.
Expenditure on indirect support The cost of planning and policy-making at the governmental level, including strengthening the skills and capacities of professionals and technicians. These costs have a direct impact on the long-term sustainability of projects.
Source: Adapted from WASHCost (2010a)
Each new service implies new costs, and these should be taken into account by those financing these
services. Each component of life cycle costs has to be paid for by someone. “How much is being paid for WASH?” and “By whom?” are key questions that WASHCost explores in detail.
48
A significant element of the life cycle cost approach is an understanding that costs can be
compared and properly assessed only when they are related to particular levels of service. WASHCost is exploring the use of service ladders to compare life cycle costs. Most existing service
ladders are based on the type of infrastructure or quantity of water and do not estimate the real level of
service delivered. Instead, WASHCost’s idea of a service ladder is the step-by-step improvement in
the quality of the service. Each step requires a combination of infrastructure, systems, human resources and support and entails different life cycle costs that need to be covered. For example, in the
case of sanitation, it is important to take the level of service into account throughout the whole chain
of service delivery: containment, collection, treatment, disposal and reuse.
To test the WASHCost research methodology, pilot studies are being carried out in districts of
Burkina Faso, Ghana, Mozambique and India (Andhra Pradesh). The WASHCost project uses country Learning Alliance platforms to make sure that all stakeholders jointly identify research topics
that are a priority in their own context. Practitioners and researchers work together to understand and
solve commonly identified problems. At the international level, experts involved in existing initiatives
that collect data in the WASH sector, such as OECD, UN-Water GLAAS, the European Union Joint Research Centre and JMP, are regularly invited to meetings and seminars to share experiences and
discuss methodologies.
In the four countries involved in the WASHCost project, specific tools are used for data collection.
They include geographic information system technical (and financial) surveys, focus group
discussions and key informant interviews at the local, regional and national levels, household surveys, auditing of village-level records, official government data, district-level capacity survey, meetings and
seminars with sector stakeholders.
The sources of data for one variable can be found with different tools at different levels. Triangulations can be used to check data or complete missing data. For example, between
governmental data and data obtained from NGOs, capital expenditure can be triangulated by checking
information and quotes from contractors. If there is a discrepancy of more than 20% in the triangulations, then data collection needs to be rechecked.
WASHCost activities carried on in the field have encountered some difficulties in collecting data,
namely the following:
Collecting cost data at the national level is difficult unless there are personal connections with
senior staff.
Project reports often simply give lump sum (rather than disaggregated) costs.
Finding data older than 3 years is a problem.
Data are especially limited for sanitation.
Sources of information are extremely scattered, especially in decentralized countries.
Elections usually prevent the collection of any data at the community level for several months.
Reconciling data collected at the village level with official government figures is difficult.
The cost of the WASHCost project is US$ 14.5 million. It is financed by a grant from the Bill &
Melinda Gates Foundation.

49
Learning from the health sector1
The health sector has developed a commonly accepted framework for tracking sectoral financial flows at the national level, referred to as National Health Accounts (NHAs). NHAs constitute a
systematic, comprehensive and consistent monitoring of resource flows in a country’s health system
for a given period and reflect the main functions of health-care financing: resource mobilization and allocation, pooling and insurance, purchasing of care and the distribution of benefits.
NHAs have emerged and evolved within the broader framework of OECD’s System of Health
Accounts (SHA) and were adapted to developing country contexts in the late 1980s and early 1990s. Up to January 2009, more than 100 low- and middle-income countries (27 of them in Africa) had
conducted NHA estimations that generated evidence for country-level policy-making as well as for
cross-country comparisons.2 NHAs generally cover a period of 2–3 fiscal years. NHAs have yet to
become fully institutionalized, however. In most countries, an NHA has been compiled once, even
though in some countries, two or three cycles of NHAs have been conducted. Many countries are now
trying to institutionalize the methodology so that they can carry out NHAs on a regular basis.
The main purpose of NHAs is to track total spending and resource flows in the health sector, in
order to assist policy-makers in their efforts to understand their health systems and improve health
system performance. NHAs help in developing national strategies for effective health financing and in raising additional funds for health. Information can be used to make financial projections of a
country’s health system requirements and compare the country’s current health sector financing with
the situation in the past or that of other countries. For example, the Abuja Declaration (OAU, 2001) set as a target that governments should spend at least 15% of their public budgets on health. NHAs
provide a standardized framework to assess whether or not health spending meets such a target in a
given country. NHAs allow four main questions to be answered:
What is the total health expenditure?
Who pays for health, and how much?
Who are the main actors of health financing, and, in care provision, how important are they in
terms of health expenditure?
How are the funds distributed to the different health services and interventions?
To make cross-national comparisons possible, NHAs are based on the International Classification for Health Accounts developed in 2000 by the OECD (OECD, 2000) and updated in 2011 (OECD,
2011). This classification tracks financial flows in the health sector by considering four fundamental
dimensions of the service delivery chain, as well as the associated costs and beneficiaries along each of these dimensions (see Figure A.1):
Financing sources: institutions or entities that provide the funds used in the health system (central
treasury, households, employers and donors); Financing agents: institutions or entities with programmatic control over allocation of funding
(the ministry of health, other ministries, insurance schemes, NGOs, etc.) and which manage and
distribute the funds in the sector; Providers: entities that receive money in exchange for or in anticipation of producing health
goods and services (providers can be public, semi-public or private, including traditional healers);
Functions: the types of goods and services provided and activities performed within the health accounts boundary (curative care, preventive and public health programmes, administration, etc.).
1 The main sources for this section are WB, WHO & USAID (2003, 2009), WHO (2010a, 2010b) and the
National Health Accounts page on WHO’s web site. 2 See the Mozambique National Health Accounts (2004–2006) for a good exemple of the type of health accounts
produced in a low-income country (link provided in Annex D).
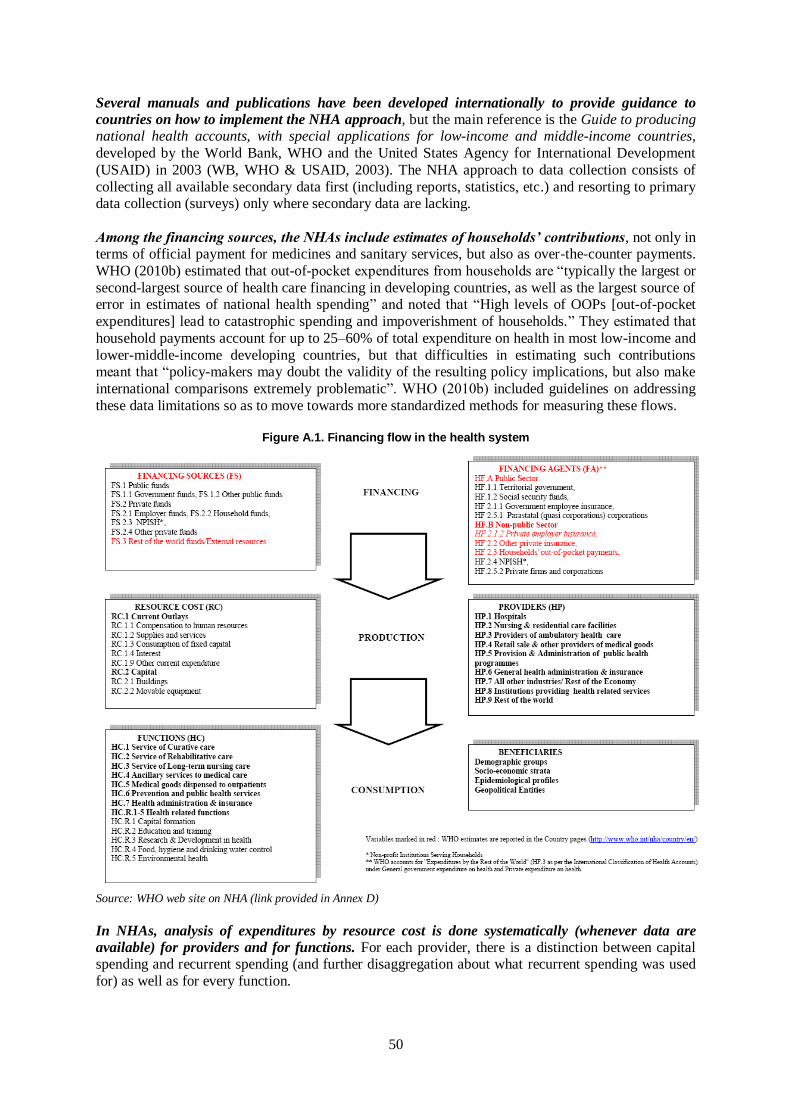
50
Several manuals and publications have been developed internationally to provide guidance to
countries on how to implement the NHA approach, but the main reference is the Guide to producing national health accounts, with special applications for low-income and middle-income countries,
developed by the World Bank, WHO and the United States Agency for International Development
(USAID) in 2003 (WB, WHO & USAID, 2003). The NHA approach to data collection consists of
collecting all available secondary data first (including reports, statistics, etc.) and resorting to primary data collection (surveys) only where secondary data are lacking.
Among the financing sources, the NHAs include estimates of households’ contributions, not only in terms of official payment for medicines and sanitary services, but also as over-the-counter payments.
WHO (2010b) estimated that out-of-pocket expenditures from households are “typically the largest or
second-largest source of health care financing in developing countries, as well as the largest source of error in estimates of national health spending” and noted that “High levels of OOPs [out-of-pocket
expenditures] lead to catastrophic spending and impoverishment of households.” They estimated that
household payments account for up to 25–60% of total expenditure on health in most low-income and
lower-middle-income developing countries, but that difficulties in estimating such contributions meant that “policy-makers may doubt the validity of the resulting policy implications, but also make
international comparisons extremely problematic”. WHO (2010b) included guidelines on addressing
these data limitations so as to move towards more standardized methods for measuring these flows.
Figure A.1. Financing flow in the health system
Source: WHO web site on NHA (link provided in Annex D)
In NHAs, analysis of expenditures by resource cost is done systematically (whenever data are
available) for providers and for functions. For each provider, there is a distinction between capital spending and recurrent spending (and further disaggregation about what recurrent spending was used
for) as well as for every function.

51
Examples of indicators that are derived based on these data include the following:
health expenditure by type of financing agent and type of provider, by function, by socioeconomic
status of the population or by geographic region;
cost of resources used to produce health goods and services.
Experience in countries where health accounts have been conducted indicates that several
difficulties emerge in data collection:
Reliability of estimates: Data sources may provide conflicting data; therefore, appreciable time
needs to be spent on crosschecking and in some cases making value judgements on the data.
Incompleteness of data: Sometimes data are not available or difficult to obtain, such as data on
financial flows from donors and NGOs that are not recorded in the government’s budget or informal household payments.
Unavailability of data: Available records may not classify expenditures by sources, functions and
disease type, or the level of disaggregation might be too low to allow this type of analysis.
The cost of implementing and sustaining the NHA approach varies from country to country and
typically declines sharply over time if the exercise is conducted repeatedly. In a number of countries
for which figures are available, first-year costs have been in the range of US$ 50 000 to US$ 75 000
(excluding the cost of new survey work). If sufficient data are available from existing sources, costs are typically lower. If external expertise and new data collection exercises are needed, then costs may
be higher. If a country intends to produce NHAs on an ongoing basis, the cost of sustaining them
within government institutions can be modest, as subsequent year costs have been largely absorbed into the cost of producing recurrent statistics. A number of countries have used external financial
support to undertake the initial cycles of their health accounts, with WHO and USAID as main
donors. Experience shows that in most countries, NHAs can be assembled in 12–18 months with a team of 3–6 analysts working part-time.
NHAs have provided a key source of financial information for the production of the World Health
Report, WHO’s leading publication, published annually since 1995. Each year, the report combines an expert assessment of global health, including statistics relating to all countries, with a focus on a
specific subject. With respect to financial analysis, most data in the World Health Report come from
NHAs, as the NHA system is the most widely recognized and applied method for tracking health financial flows at the national level.
Learning from the education sector1
Acknowledging the difficulty in obtaining reliable and comprehensive data on financial statistics
for the education sector, several initiatives have emerged to encourage better tracking of financial
flows in the education sector at national and international levels.
In the early 1990s, parallel to the emergence of NHAs, the World Bank promoted the development of National Education Accounts (NEAs). The reasons for developing such systems were as follows
(Galodé, 1998):
Statistical information on education system expenditure and funding is an important factor in policies
concerned with the development and management of these systems. Collecting the information is usually a
labour-intensive business, owing to the complexity of educational funding mechanisms, the large number of
sources of finance, and the difficulty of gaining access to the relevant accounts data.
1 The main sources for this section are Lassibille & Rasera (1998), UNESCO (2010), UNESCO-UIS (2009,
2010, no date) and the education survey page on the United Nations Educational, Scientific and Cultural
Organization (UNESCO) Institute for Statistics (UIS) web site (link provided in Annex D).

52
Only a few NEAs have been conducted to date, however.
In 1998, the United Nations Educational, Scientific and Cultural Organization (UNESCO)
published two manuals on a statistical information system on expenditure in education (Galodé,
1998; Lassibille & Rasera, 1998), which set out a conceptual framework for constructing a
coherent system for collecting and processing national education expenditure data in the form of an accounting framework. The methodology was tested in several pilot countries in Africa in order to
support methodological developments, but this has not been reproduced since in other countries.
The UNESCO Institute for Statistics (UIS), hosted by the Université de Montréal in Canada, was
established in July 1999 to meet the growing international needs for a wider range of policy-
relevant, timely and reliable statistics in the fields of education, science and technology, culture and communication. The UIS collects education data from about 200 countries and territories through
three annual Surveys on Statistics of Education. The majority of countries respond to the main UIS
annual survey, which covers all education levels and a range of issues, such as gender parity, teachers
and financing. In addition, about 60 countries participate in the UNESCO/OECD/Eurostat (UOE) survey, which is administered jointly by the UIS, the OECD and the Statistical Office of the European
Union (Eurostat), and about 16 middle-income countries participate in the World Education Indicators
survey.
The objective of the UIS Survey on Statistics of Education is to provide internationally comparable
data on key aspects of education systems as well as the associated costs and type of resources employed. All surveys are based on similar definitions according to the International Standard
Classification of Education, which ensures the international comparability of the data. These data also
form a central part of the database of education statistics available at the UIS. The education statistics
are disseminated widely to the user community and used to help inform policy-makers at both national and international levels. The UIS also serves as a laboratory for developing and testing new
indicators and statistical methodologies. National statisticians take an active role in this process of
innovation. At the same time, the UIS collaborates to reinforce the capacities of national statistical authorities in order to improve data quality at national and international levels.
The UIS collects education statistics in aggregate form at the national level. Information is collected
from public administrations and includes data on educational programmes, access, participation, progression, completion, internal efficiency and human and financial resources. The UIS education
questionnaires are sent to UNESCO Member States annually. The questionnaires are based on
international standards, classifications and measures that are regularly reviewed and modified in order to address emerging statistical issues and improve the quality of data.
1
The UIS education database includes a long list of education indicators, including some
information relative to financial flows, such as:
public expenditure on education, by level of education, as a percentage of GDP per capita and in
US dollar purchasing power parity (PPP);
public expenditure on education as a percentage of total government expenditure;
percentage distribution of public total and current expenditure on education, by level of education;
public current expenditure per student as a percentage of gross national income per capita;
public current expenditure on education by sources of funds (public, private, international);
teachers’ annual salaries as a percentage of public current expenditure on education;
relative percentage of public and private expenditure on educational institutions per level of
education;
1 Additional surveys are conducted in high- and middle-income countries to gather supplementary data, such as
the UOE survey (conducted by UNESCO-UIS, the OECD and Eurostat) and the World Education Indicators
survey.
53
distribution of public expenditure by destination of funds, such as to public, private or publicly
subsidized institutions.
Data availability varies greatly from one country to another (with fewer data available for
developing countries, especially Arab states and South and West Asia states) and from one indicator
to another (with generally more data on public expenditures on education and very few data on funds
from private sources). The main difficulty is the low rate of response to the questionnaires, which translates into a low level of data timeliness and completeness. Incomplete or late responses also
create difficulties with respect to the availability of updated data. Difficulties sometimes emerge also
because not all countries use the same classification systems, sometimes leading to discrepancies between national data and those published internationally. Additional difficulties relate to the
harmonization of education data from surveys and population censuses. The UIS recognizes that
serious limitations exist in data coverage, especially for such dimensions as public financing of education.
Given these data limitations, an international initiative called “Improving education finance
statistics” was launched in 2007 by the Education Program for Development Fund and carried out by the UIS. It was designed to improve the availability, quality and sustainability of education finance
data for sub-Saharan Africa. The project involved intensive work with national teams to document,
rationalize and improve data sources in order to produce a strategic set of analytical indicators that will be produced by the countries on a regular basis.
At the international level, a critical tool for comparing financial data for education across the
world is the Global Education Digest,1 published jointly by UNESCO and the UIS every year since
2003. This report presents a wide range of statistical tables, including a substantial section tracking
education expenditure. In addition, the Education for All (EFA) Global Monitoring Report,2 published
annually by UNESCO since 2002, is a prime instrument to assess global progress in the education sector overall. Both these international reports use the UIS online database as their prime source of
education expenditure statistics; despite its limitations, it is considered to be the best available source
of information on sector expenditure.
1 The link to the Global Education Digest is provided in Annex D. 2 The link to the Global Monitoring Report is provided in Annex D.

54
Annex B: Existing WASH financial flow studies by country
Lead agency WHO OECD WSP AMCOW/
WSP World Bank World Bank IRC WaterAid
Name of initiative GLAAS Strategic financial planning
Resource flows
assessment
Country Sector
Overviews AICD
PER (since 2002)
WASHCost project
Various initiatives
Sub-Saharan Africa
Angola 2010 2010 2009
Benin 2010 2006, 2010 2005 FY04
Botswana 2009
Burkina Faso 2010 2006, 2010 2005 FY08 (2008–2012) 2010 WW
Burundi 2010 2010
Cameroon 2010 2010 2005 FY09
Central African Republic 2010 2010 2009 FY10
Cape Verde 2005 FY06, FY08
Chad 2010 2010 2005
Congo, Brazzaville 2010 2009 FY10
Côte d’Ivoire 2010 2010 2005 FY09
Democratic Republic of the Congo
2010 2006, 2010 2005 FY10
Ethiopia 2010 2004 (only
water) 2006, 2010 2005
FY04, FY08, FY09
2005 WSA,
2009 LLF, 2010 BT
Gabon 2009
Gambia 2010
Ghana 2008, 2010 2006, 2010 2005 FY08 (2008–2012) 2006 WSA,
2009 LLF
Kenya 2010 2004 2006, 2010 2005
Lesotho 2010 2009 2005
Liberia 2010 2009

55
Lead agency WHO OECD WSP AMCOW/
WSP World Bank World Bank IRC WaterAid
Name of initiative GLAAS
Strategic
financial planning
Resource
flows assessment
Country
Sector Overviews
AICD PER
(since 2002) WASHCost
project Various
initiatives
Madagascar 2008, 2010 2006, 2010 2005 FY07 2005 WSA, 2009 LLF
Malawi 2006, 2010 2005
Mali 2010 2010 2009 FY08 2010 WW
Mauritania 2010 2006, 2010 2009
Mauritius 2009
Mozambique 2010 2006, 2010 2005 FY03, FY09 (2008–2012) 2005 WSA
Namibia 2005
Niger 2010 2006, 2010 2005 FY09
Nigeria 2010 2005 FY08 +
FY09 (local)
2006 WSA, 2009 LLF
Rwanda 2010 2006, 2010 2005 FY06-07
Senegal 2010 2006, 2010 2005
Sierra Leone 2010 2010 2009 FY10
South Africa 2010 2004 2010 2005
Sudan 2010 2010 2005
Swaziland 2009
Togo 2010 2010 FY10
Uganda 2008, 2010 2004 (only sanitation)
2006, 2010 2005 FY03 2005 WSA,
2009 LLF, 2010
WW
United Republic of Tanzania 2010 2006, 2010 2005 FY03, FY04,
FY09
2005 WSA, 2010 PFS (Dar
Es Salaam)
Zambia 2004 2006, 2010 2005
Zimbabwe 2010 2010 2009
Middle East and North Africa
Algeria FY07
Egypt 2009 FY06

56
Lead agency WHO OECD WSP AMCOW/
WSP World Bank World Bank IRC WaterAid
Name of initiative GLAAS
Strategic
financial planning
Resource
flows assessment
Country
Sector Overviews
AICD PER
(since 2002) WASHCost
project Various
initiatives
Jordan FY05
Libya FY09
Morocco 2010
Oman 2010
Europe and Central Asia
Albania FY07, FY08
Armenia 2008 FY07
Bulgaria 2008 FY06
Georgia 2008
Kazakhstan 2008, 2010 2008
Kyrgyzstan 2008
Republic of Moldova 2008
Russian Federation 2008
Turkey 2008
Ukraine 2008
East Asia and Pacific
Cambodia 2010 2008
China 2008
Indonesia 2010 FY07
Lao People’s Democratic
Republic 2010
Mongolia 2008, 2010
Philippines 2010 FY07
Thailand 2010 2010 PFS
Timor-Leste 2010
Viet Nam 2008, 2010

57
Lead agency WHO OECD WSP AMCOW/
WSP World Bank World Bank IRC WaterAid
Name of initiative GLAAS
Strategic
financial planning
Resource
flows assessment
Country
Sector Overviews
AICD PER
(since 2002) WASHCost
project Various
initiatives
Latin America and Caribbean
Dominican Republic FY03
Ecuador FY04
El Salvador FY04
Honduras 2010
Mexico FY04, FY05,
FY06
Nicaragua FY07
Panama FY06
Paraguay 2010
South Asia
Bangladesh 2010 2006 WSA
India (2008–2012) 2010 PFS
(Bihar)
Nepal 2008, 2010 2009 LLF, 2010
WW
Pakistan FY03
BT, Budget Tracking; FY, Fiscal Year; LLF, Study on Local-Level Financing; PFS, Public Funding for Sanitation; WSA, Water Sector Assessments; WW, WASHwatch

58
Annex C: Key informants consulted for this study
Name Organization E-mail
Alessandra Alfieri UNDESA [email protected]
Sudeshna Banerjee World Bank [email protected]
Peter Borkey OECD [email protected]
Cecilia Briceño-Garmendia World Bank [email protected]
Clarissa Brocklehurst UNICEF [email protected]
Kerstin Danert RWSN - Skat [email protected]
Dominick de Waal WSP Africa [email protected]
Vivien Foster World Bank [email protected]
Christopher Gasson Global Water Intelligence [email protected]
Alan Hall EUWI [email protected]
Patricia Hernandez WHO [email protected]
Laura Hucks WaterAid Tanzania [email protected]
Guy Hutton WHO/WSP [email protected]
Gérard Lassibille IREDU [email protected]
Xavier Leflaive OECD [email protected]
David Lloyd-Owen Envisager [email protected]
Ricardo Martinez-Lagunes UNDESA [email protected]
Meera Mehta Independent [email protected]
Claude de Miras IRD/IDDRI Foundation [email protected]
Jonathan Parkinson IWA [email protected]
Gérard Payen Aquafed/UNSGAB [email protected]
Christelle Pezon IRC [email protected]
Monica Scatasta European Investment Bank [email protected]
Jérémie Toubkiss Hydroconseil [email protected]
Caroline van den Berg World Bank [email protected]
Meike van Ginneken World Bank [email protected]
EUWI, European Union Water Initiative; IRC, IRC International Water and Sanitation Centre; IRD/IDDRI, Institut de recherche
pour le développement/Institut du développement durable et des relations internationales; IREDU, Institut de recherche sur
l’éducation; IWA, International Water Association; OECD, Organisation for Economic Co-operation and Development; RWSN, Rural Water Supply Network; UNDESA, United Nations Department of Economic and Social Affairs; UNICEF, United Nations Children’s Fund; UNSGAB, United Nations Secretary-General’s Advisory Board on Water & Sanitation; WHO, World Health
Organization; WSP, Water Sanitation Program (World Bank)

59
Annex D: References
Sources for the WASH sector
Aboma G, Kefale Z (2010). Budget tracking of WaSH sector in Ethiopia: an analysis of the cases at national, regional & local levels. WaterAid Ethiopia.
AfricaSan (2008). The eThekwini Declaration and AfricaSan Action Plan. 11th African Union Summit on “Meeting the Millennium Development Goals on Water and Sanitation”, AfricaSan+5
Conference on Sanitation and Hygiene, February 2008
(http://www.wsp.org/wsp/sites/wsp.org/files/publications/eThekwiniAfricaSan.pdf).
AICD (2011). Handbook on infrastructure statistics. Africa Infrastructure Knowledge Program
(http://www.infrastructureafrica.org/library/doc/969/handbook-infrastructure-statistics).
AMCOW/WSP (2006). Getting Africa on track to meet the MDGs on water and sanitation. A status
overview of sixteen African countries. Nairobi, African Ministers’ Council on Water and Water and
Sanitation Program-Africa (http://www.wsp.org/wsp/sites/wsp.org/files/publications/319200725615_312007101903_MDGs_All
_final3_high.pdf).
AMCOW/WSP (2011). Pathways to progress—Transitioning to country-led service delivery
pathways to meet Africa’s water supply and sanitation targets. African Ministers’ Council on Water
and Water and Sanitation Program, Country Status Overviews Regional Synthesis Report [in addition
to individual reports published for single countries] (http://www.wsp.org/wsp/content/pathways-progress-status-water-and-sanitation-africa).
Foster V, Briceño-Garmendia C, eds (2010). Africa’s infrastructure: a time for transformation. A copublication of Agence Française de Développement and the World Bank. Washington, DC, The
International Bank for Reconstruction and Development / The World Bank
(http://www.infrastructureafrica.org/aicd/flagship-report).
Ghosh Banerjee S, Morella E (2011). Africa’s water and sanitation infrastructure: access,
affordability, and alternatives. Washington, DC, The International Bank for Reconstruction and
Development / The World Bank (http://water.worldbank.org/node/84013).
Hutton G (2012). Global costs and benefits of drinking-water supply and sanitation interventions to
reach the MDG target and universal coverage. Geneva, World Health Organization (http://www.who.int/water_sanitation_health/publications/2012/globalcosts.pdf).
Hutton G, Bartram J (2008). Regional and global costs of attaining the water supply and sanitation
target (target 10) of the Millennium Development Goals. Geneva, World Health Organization, Public Health and the Environment
(http://www.who.int/water_sanitation_health/economic/mdg_global_costing.pdf).
International Monetary Fund (2001). The government finance statistics manual, 2nd ed. International
Monetary Fund, Statistics Division (http://www.imf.org/external/pubs/ft/gfs/manual/pdf/all.pdf).
Mehta M et al. (2004). Ethiopia water supply sector resource flows assessment. Washington, DC, The
World Bank, Water and Sanitation Program (Sector Finance Working Papers No. 10;
http://water.worldbank.org/publications/ethiopia-water-supply-sector-resource-flows-assessment-
volume-2-2).

60
OECD (2009). Strategic financial planning for water supply and sanitation. Paris, Organisation for Economic Co-operation and Development, OECD Task Team on Sustainable Financing to Ensure
Affordable Access to Water Supply and Sanitation
(http://www.oecd.org/dataoecd/45/27/42811787.pdf).
OECD (2010a). Innovative finance mechanisms for the water sector. Paris, Organisation for
Economic Co-operation and Development (http://www.oecd-ilibrary.org/environment/innovative-
financing-mechanisms-for-the-water-sector_9789264083660-en).
OECD (2010b). Beyond the DAC—the welcome role of other providers of development co-operation.
Paris, Organisation for Economic Co-operation and Development, Development Co-operation Directorate (http://www.oecd.org/dataoecd/58/24/45361474.pdf).
OECD (2011). Benefits of investing in water and sanitation: an OECD perspective. OECD Studies on
Water, OECD Publishing (http://www.oecd-ilibrary.org/environment/benefits-of-investing-in-water-and-sanitation_9789264100817-en).
OECD-DAC (2009). Measuring aid to water supply and sanitation. Paris, Organisation for Economic Co-operation and Development, Development Assistance Committee, December
(http://www.oecd.org/dataoecd/2/60/42265683.pdf).
Petras R (2009). Comparative study of data reported to the OECD Creditor Reporting System (CRS) and to the Aid Management Platform (AMP). A report to the Organisation for Economic Co-operation
and Development and Development Gateway, October
(http://www.oecd.org/dataoecd/0/27/43908328.pdf).
Pradhan S (1996). Evaluating public spending: a framework for public expenditure reviews.
Washington, DC, The World Bank (World Bank Discussion Paper 323; http://www-
wds.worldbank.org/external/default/WDSContentServer/WDSP/IB/1996/05/01/000009265_3961219102516/Rendered/PDF/multi_page.pdf).
Trémolet S, Binder D (forthcoming). Effectiveness of public funding for sanitation in Thailand, Bihar,
Dar Es Salaam. A study for WaterAid, London.
Trémolet S, Kolsky P, Perez E (2010). Financing on-site sanitation for the poor. A six country
comparative review and analysis. A report for the Water and Sanitation Program, The World Bank, Washington, DC (http://documents.worldbank.org/curated/en/2010/01/12840650/financing-on-site-
sanitation-poor-six-country-comparative-review-analysis).
UN Statistics Division (2007). System of Environmental-Economic Accounting for Water. New York,
NY, United Nations (http://unstats.un.org/unsd/statcom/doc07/SEEAW_SC2007.pdf).
UN-Water (2008). Global annual assessment of sanitation and drinking water (GLAAS): pilot report,
testing a new reporting approach. Geneva, World Health Organization
(http://www.who.int/water_sanitation_health/glaas/2008_pilot/glaas_2008_pilot_finalreport.pdf).
UN-Water (2010). Global annual assessment of sanitation and drinking water (GLAAS). Geneva,
World Health Organization (http://whqlibdoc.who.int/publications/2010/9789241599351_eng.pdf).
Van den Berg C et al. (2009). Tanzania public expenditure review of the water sector. Washington,
DC, The World Bank (http://water.worldbank.org/publications/tanzania-public-expenditure-review-
water-sector).

61
Van Ginneken M (2010). Lessons learned through public expenditure reviews in the water supply and
sanitation sector, project concept note. Energy, Transport and Water Department and Africa Technical Families Urban/Water (AFTUW) of the World Bank. Washington, DC, The World Bank.
Van Ginneken M, Netterstrom U, Bennett A (2011). More, better, or different spending? Trends in
public expenditure on water and sanitation in sub-Saharan Africa. Africa Technical Families Urban/Water (AFTUW), Africa Region, The World Bank (Water Papers 67321-AFR;
http://water.worldbank.org/publications/more-better-or-different-spending-trends-public-expenditure-
water-and-sanitation-sub-sa).
WASHCost (2010a). Life-cycle costs approach: towards accountable investments. The Hague, IRC
International Water and Sanitation Centre.
WASHCost (2010b). Life-cycle costs approach, glossary and cost components—Briefing Note 1a.
The Hague, IRC International Water and Sanitation Centre (http://www.washcost.info/page/1557).
Sources for the health sector
OAU (2001). Abuja Declaration on HIV/AIDS, tuberculosis and other related infectious diseases. Organization of African Unity (OAU), African Summit on HIV/AIDS, tuberculosis and other related
infectious diseases, Abuja, Nigeria, 24–26 April 2001 (OAU/SPS/ABUJA/3;
http://www.un.org/ga/aids/pdf/abuja_declaration.pdf).
OECD (2000). A System of Health Accounts. Version 1.0. Paris, Organisation for Economic Co-
operation and Development.
OECD (2011). A System of Health Accounts, 2011 ed. Paris, Organisation for Economic Co-operation
and Development (http://www.oecd.org/dataoecd/41/4/1841456.pdf).
WB, WHO, USAID (2003). Guide to producing national health accounts, with special applications
for low-income and middle-income countries. Geneva, World Bank, World Health Organization and
United States Agency for International Development (http://www.who.int/nha/docs/English_PG.pdf).
WB, WHO, USAID (2009). National health accounts and public expenditure reviews: redundant or
complementary tools? Health Systems 2020 Policy Brief. Washington, DC, World Bank, World
Health Organization and United States Agency for International Development (http://www.healthsystems2020.org/content/resource/detail/2240/).
WHO (2010a). The world health report: health systems financing, the path to universal coverage. Geneva, World Health Organization (http://www.who.int/whr/2010/en/index.html).
WHO (2010b). Estimating out-of-pocket spending for national health accounts, Geneva, World
Health Organization (http://www.who.int/nha/methods/estimating_OOPs_ravi_final.pdf). [This was originally prepared by Rannan-Eliya R (2006) under the title “National health accounts—Estimation
of private expenditure on health”.]

62
Sources for the education sector
Galodé G (1998). SISEE—Statistical Information System on Expenditure in Education, administration manual. Paris, Institute for Education Economics Research in cooperation with the Division of
Statistics of the United Nations Educational, Scientific and Cultural Organization.
Lassibille G, Rasera B (1998). SISEE technical reference manual. Paris, United Nations Educational,
Scientific and Cultural Organization.
UNESCO (2010). Education for all global monitoring report. Paris, United Nations Educational, Scientific and Cultural Organization; Oxford, Oxford University Press
(http://www.unesco.org/new/en/education/themes/leading-the-international-agenda/efareport/).
UNESCO-UIS (2009). Report on the activities of the institute in 2009. Montreal, United Nations
Educational, Scientific and Cultural Organization, Institute for Statistics.
UNESCO-UIS (2010). Global education digest, comparing education statistics across the world.
Montreal, United Nations Educational, Scientific and Cultural Organization, Institute for Statistics.
UNESCO-UIS (no date). Guide to UIS education statistics. Montreal, United Nations Educational, Scientific and Cultural Organization, Institute for Statistics.
Other useful publications (not cited)
Berkowitz P et al. (2009). Water budget monitoring education tool. Braamfontein, Centre for Applied Legal Studies and Mvula Trust
(http://www.wits.ac.za/files/res1d6124c660eb4720ae7ff305301c604e.pdf).
DFID (2007). Finance policy background paper: financing of water supply and sanitation. Final
draft. United Kingdom Department for International Development.
Fonseca C et al. (2008). Working together to improve aid effectiveness in the water sector. Mapping EU development assistance to the water sector in Africa: exercise of the Africa Working Group of the
European Union Water Initiative 2007–2008. The Hague, IRC International Water and Sanitation
Centre (http://docs.watsan.net/Downloaded_Files/PDF/Fonseca-2008-Working.pdf).
Fonseca C et al. (2010). A multi dimensional framework for costing sustainable water and sanitation
services in low-income settings: lessons from collecting actual life cycle costs for rural and peri-
urban areas of Ghana, Burkina Faso, Mozambique and Andhra Pradesh. The Hague, IRC International Water and Sanitation Centre (http://docs.watsan.net/Downloaded_Files/PDF/Fonseca-
2010-Multi.pdf).
Martín-Hurtado R, Borkey P, Paris R (2008). Strategic financial planning in the water supply and
sanitation sector—first draft of selected case studies. Revised background document for the third
meeting of the Organisation for Economic Co-operation and Development (OECD) Development Assistance Committee (DAC)/Environment Policy Committee (EPOC) Water Task Team (10–11
April 2008).
Mehta M, Ondari J (2004). Sector finance and resource flows for water supply: a pilot application for Kenya. Washington, DC, The World Bank, Water and Sanitation Program, Africa Region (Sector
Finance Working Papers No. 7; http://documents.worldbank.org/curated/en/2004/05/7507329/sector-
finance-resource-flows-water-supply-pilot-application-kenya-vol-1-2-main-report).

63
Ndaw F (2008). Stratégies de planification du financement du secteur de l’eau et de l’assainissement
au Sénégal. Paris, Organisation for Economic Co-operation and Development, OECD Water Task Team on Good Practices in Strategic Financial Planning for Water Supply and Sanitation.
OECD (2008a). Case study: Ethiopia. Paris, Organisation for Economic Co-operation and
Development, OECD Development Assistance Committee (DAC) Water Task Team on Good Practices in Strategic Financial Planning for Water Supply and Sanitation.
OECD (2008b). Outcomes from the finance strategy (FS) case-studies in Armenia. Draft for comments, 10 January 2008. Paris, Organisation for Economic Co-operation and Development.
OECD (2009). Managing water for all: an OECD perspective on pricing and financing. Paris, Organisation for Economic Co-operation and Development
(http://www.oecd.org/dataoecd/0/34/44476961.pdf).
United Nations (2008). Achieving the Millennium Development Goals in Africa: recommendations of the MDG Africa Steering Group. New York, NY, United Nations Department of Public Information
(http://www.who.int/pmnch/events/2008/mdgsteeringgrouprecommendations.pdf).
Van den Berg C, Danilenko A (2010). The IBNET water supply and sanitation performance blue
book: The International Benchmarking Network for Water and Sanitation Utilities databook.
Washington, DC, The World Bank (http://www-wds.worldbank.org/external/default/WDSContentServer/WDSP/IB/2011/01/07/000334955_20110107
044636/Rendered/PDF/588490PUB0IBNE101public10BOX353816B.pdf).
WSP (2004a). Water supply and sanitation sector finance and resource flow assessment: Zambia. Prepared by Dennis Chiwele for the Zambian Ministry of Local Government and Housing, the
Development Cooperation Ireland and the Water and Sanitation Program, World Bank (Sector
Finance Working Papers No. 7; http://www.wsp.org/wsp/sites/wsp.org/files/publications/af_flow_zambia.pdf).
WSP (2004b). Strengthening budget mechanisms for sanitation in Uganda. Prepared by Mike
Thomson for the Environmental Health Division of the Ministry of Health and Water and Sanitation Program-Africa (Sector Finance Working Papers No. 9; executive summary at http://www-
wds.worldbank.org/external/default/WDSContentServer/WDSP/IB/2008/12/10/000333038_20081210
025610/Rendered/PDF/467480WSP0Box31heningbudget1execsum.pdf).
Useful web sites
AICD, Africa Infrastructure Country Diagnostic: http://www.infrastructureafrica.org/
Cowi’s FEASIBLE tool:
http://www.cowi.com/menu/project/EconomicsManagementandPlanning/Financialanalysesandlaw/Pa
ges/feasiblemodel.aspx
GLAAS reports:
GLAAS 2008 pilot report:
http://www.who.int/water_sanitation_health/glaas/2008_pilot/en/index.html
GLAAS 2010 report: http://www.unwater.org/activities_GLAAS2010.html
GLAAS 2012 report: http://www.who.int/water_sanitation_health/glaas/en/
IBNET (The International Benchmarking Network for Water and Sanitation Utilities): http://www.ib-
net.org/

64
International Aid Transparency Initiative: http://www.aidtransparency.net/
International Financing Review: http://www.ifre.com/
IRC, International Water and Sanitation Centre, publications on financing and cost-recovery: http://www.irc.nl/page/5989
OECD DAC Open Doors web page: http://www.oecd.org/document/62/0,3343,en_2649_33721_44131518_1_1_1_1,00.html
OECD DAC/EPOC Water Task Team: http://www.oecd.org/document/43/0,3746,en_2649_34291_38711659_1_1_1_1,00.html
OECD System of Health Accounts (SHA):
http://www.oecd.org/document/8/0,3746,en_2649_37407_2742536_1_1_1_37407,00.html
Sanitation and Water for All initiative: http://www.sanitationandwaterforall.org/
UNESCO Education for All (EFA) Global Monitoring Report:
http://unesdoc.unesco.org/images/0018/001866/186606E.pdf
UNESCO Global Education Digest:
http://www.uis.unesco.org/template/pdf/ged/2010/GED_2010_EN.pdf
UNESCO Indicators for the education sector: http://stats.uis.unesco.org/unesco/TableViewer/tableView.aspx?ReportId=172
UNESCO Institute for Statistics, Education survey: http://www.uis.unesco.org/surveys/education
UNSTAT Classification of the Functions of Government:
http://unstats.un.org/unsd/cr/registry/regcst.asp?Cl=4
UNSTAT ISIC (International Standard Industrial Classification of All Economic Activities):
http://unstats.un.org/unsd/cr/registry/isic-4.asp
UNSTAT System of Environmental-Economic Accounting for Water (SEEA-Water):
http://unstats.un.org/unsd/envaccounting/water.asp
UNSTAT System of National Accounts (SNA):
http://unstats.un.org/unsd/nationalaccount/sna2008.asp
WashCost research publications: http://www.washcost.info/page/196
WASHWatch online advocacy tool: http://www.washwatch.org
WaterAid research publications:
http://www.wateraid.org/uk/what_we_do/documents_and_publications/default.asp
WHO National Health Accounts (NHA): http://www.who.int/nha/en/
Country information: http://www.who.int/nha/country/en/
Financing flow chart: http://www.who.int/nha/country/Financing%20flow%20June2007.pdf

65
Mozambique National Health Account: http://www.who.int/nha/country/moz/mozambique_2004-
2006.pdf
WHO Statistical Information System (WHOSIS):
http://www.who.int/whosis/whostat/2010/en/index.html
WHO World Health Report: http://www.who.int/whr/en/index.html
World Bank Private Participation in Infrastructure database: http://ppi.worldbank.org/
World Bank Public Expenditure Reviews (PERs):
http://web.worldbank.org/WBSITE/EXTERNAL/TOPICS/EXTPUBLICSECTORANDGOVERNAN
CE/EXTPUBLICFINANCE/0,,contentMDK:20236662~menuPK:2083237~pagePK:148956~piPK:216618~theSitePK:1339564,00.html#2
