tracking evolving communities in large linked networks john hopcroft, omar khan, brian kulis, and...
TRANSCRIPT
Tracking Evolving Communities in Large Linked Networks
John Hopcroft, Omar Khan, Brian Kulis, and Bart Selman
Fatih ER
2002701360

Outline
Introduction Data Set Instabilities and Natural Cammunities Tracking Natural Communities Conclusion

Introduction
Emergent properties of large linked networks have recently become the focus of intense study. This research is driven by the increasing complexity and importance of large networks, such as the World Wide Web, the electricity grid, and large social networks that capture relationships between individuals. Real world networks generally exhibit properties that lie somewhere in-between those of highly structured networks and purely random ones.

Introduction
So far, most research has focused on using static properties, such as the connectivity of the nodes in the network and the average distance between two nodes, to explain the complex structure. However, these networks generally evolve over time and so temporal characteristics are a key source of interest. The goal in this paper is to provide techniques for the study of the evolution of large linked networks. The approach that is used agglomerative clusterings of the linked network.
Introduction
Clustering methods can be surprisingly sensitive to minor changes of the input data. For obtaining a static view of the higher-level structure of the data, such instabilities may be acceptable because the resulting hierarchy often already reveals interesting structure. However, in tracking changes over time, we need to be able to find corresponding communities in clusterings taken from the data at different points in time.
Introduction
If the clusterings are very sensitive to small perturbations of the input data, distinguishing between ‘‘real’’ changes versus ‘‘accidental’’ changes in the higher-level structure becomes difficult, if not impossible. In the clusterings of the network data, there are a large number of relatively random clusters that do not correspond to real community structures. These random clusters obscure the real temporal changes. Performing a series of agglomerative clustering runs, each run on slightly perturbed input data, one can identify a stable set of clusters that occur in a significant proportion of the clusterings.
Data Set
The data used is an October 2001 snapshot of the NEC CiteSeer database. At that time, the CiteSeer database contained the full text and bibliographies of 250,000 papers. These are mostly related to computer science, with a small collection covering other topics like physics, mathematics, and economics. The papers are mostly published after 1990, and the set is growing by 25,000 papers per year. In addition, the database contains title and author information on another 1.6 million earlier papers that are referenced by the 250,000 set but whose full text is not contained in the database.
Data Set
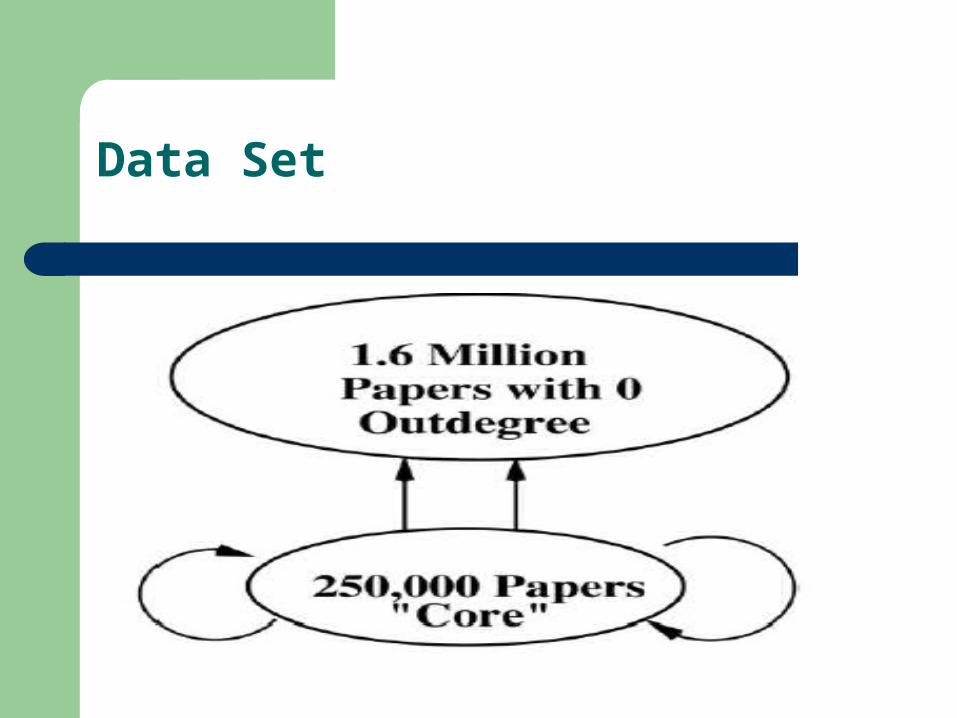
The citation graph induced by this data set was analyzed: vertices correspond to all 1.85 million papers in the database; there is a directed edge from paper A to paper B if A references B. We call the set of 250,000 papers whose full-text and bibliography are known the core of the citation graph. The papers in the core have citations to each other and to the 1.6 million earlier papers. We do not have the reference lists for the papers outside the core. So, their out-degree is 0, whereas their in-degree is at least 1.
Data Set
Data Set
Data Set
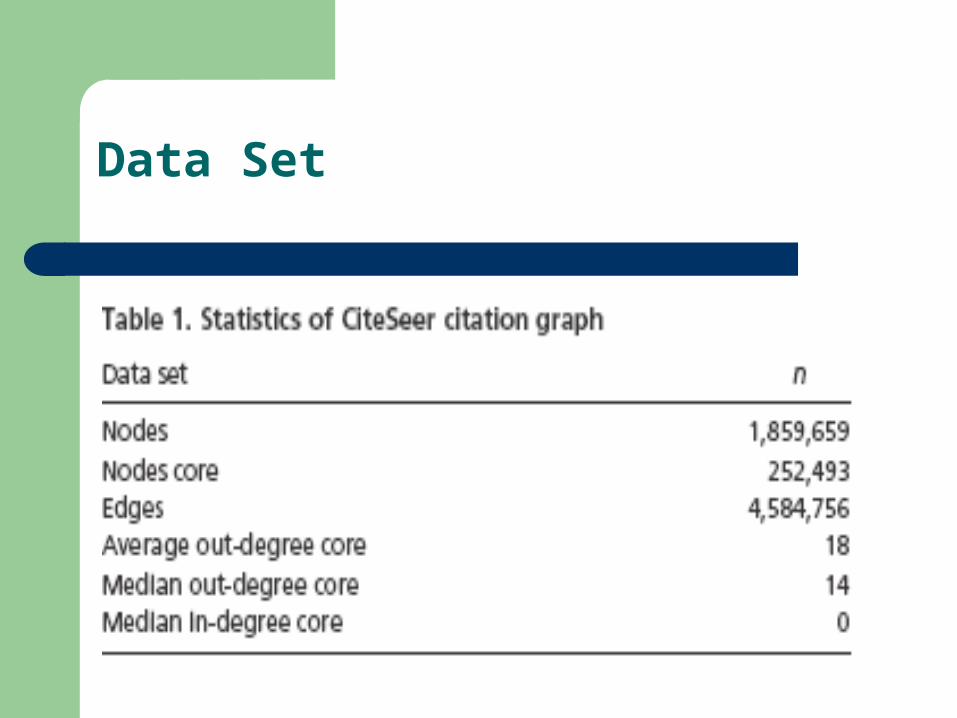
The basic statistics of this graph already reveal that its structure is very different from a standard random graph. About 1 in every 100 papers receives 20 citations, 1 in every 1,000 papers has 300 citations or more, and 18 papers of the 1.85 million have 1,000 citations. This pattern is indicative a power law. An interesting research question concerns the role of the highly cited papers. For example, are such nodes essential in the definition of the hidden community structure? Also, are such nodes essential in the formation of new communities?
Instablities & Natural Communities
Hierarchical agglomerative clustering starts with each paper in a cluster by itself. At each stage, the two ‘‘closest’’ clusters are merged. The process is repeated until all papers are in a single cluster. The overall process results in a ‘‘clustering tree’’ with the single paper clusters at the leaves. Each internal node corresponds to a cluster resulting from merging its two children. Researchers have used many different distance measures. The selected measure in this study based on cosine similarity, which is the standard similarity measure in the literature

Instablities & Natural Communities
With each paper p, we associate an N-dimensional reference vector rp, where N is the total number of papers in the CiteSeer database (N=1.85 million). There is a 1 in element i of rp if p references paper i, otherwise the entry is 0. The similarity between two papers p and q can now be measured in terms of the cosine of the angle between the associated reference vectors, rp and rq. More formally, the similarity of p and q is defined to be
similarity (p,q) = cos(rp ,rq) = .
.p q
p q
r r
r r
Instablities & Natural Communities
So, if two papers have no references in common, then their similarity is minimal, i.e., 0 (90° angle); two papers citing exactly the same set of papers have maximal similarity, i.e., 1 (0° angle). To get a distance measure between papers, we simply use 1-cosine, so the distance between papers ranges from 0 to 1. When merging two papers or clusters, we represent the new cluster by the normalized sum of all of the individual papers’ reference vectors, called the ‘‘centroid’’ of the cluster.
Instablities & Natural Communities
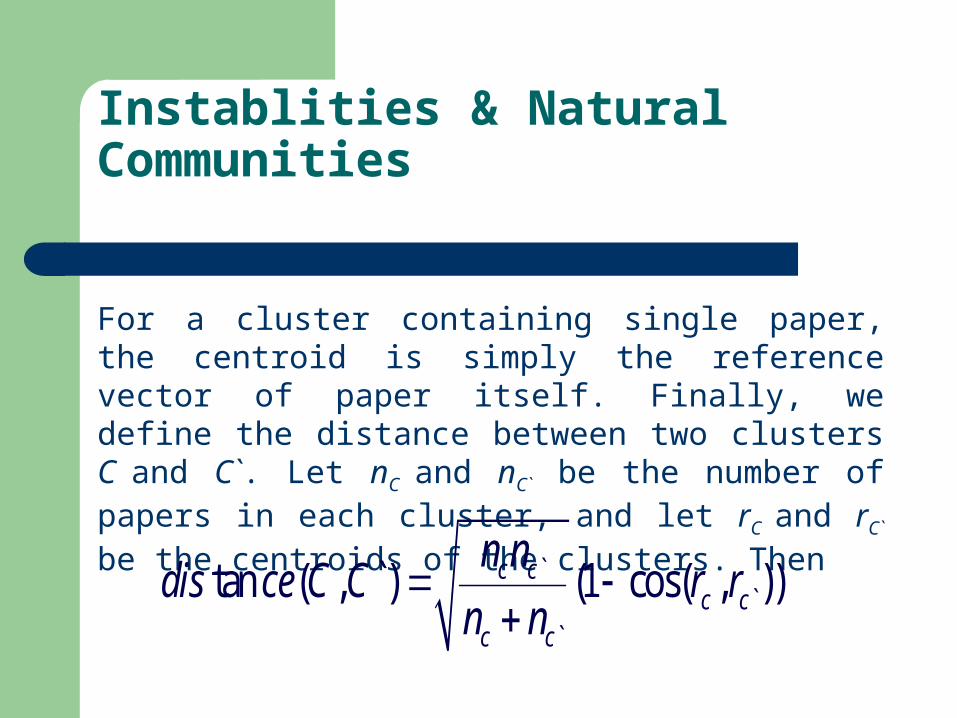
For a cluster containing single paper, the centroid is simply the reference vector of paper itself. Finally, we define the distance between two clusters C and C`. Let nC and nC` be the number of papers in each cluster, and let rC and rC` be the centroids of the clusters. Then
``
`
tan ( , `) (1 cos( , ))c cc c
c c
n ndis ce C C r r
n n

Instablities & Natural Communities
To determine the set of natural communities, the changes are examined in the clustering trees under minor perturbations of the input data. Given a base tree T1 is compared with a second tree T2, obtained on a different clustering run. Let C and C` be two clusters of papers we wish to compare. Treating C and C` as sets, we define a value match(C,C`) as follows:
` `( , `) min( , )
`
C C C Cmatch C C
C C
Instablities & Natural Communities
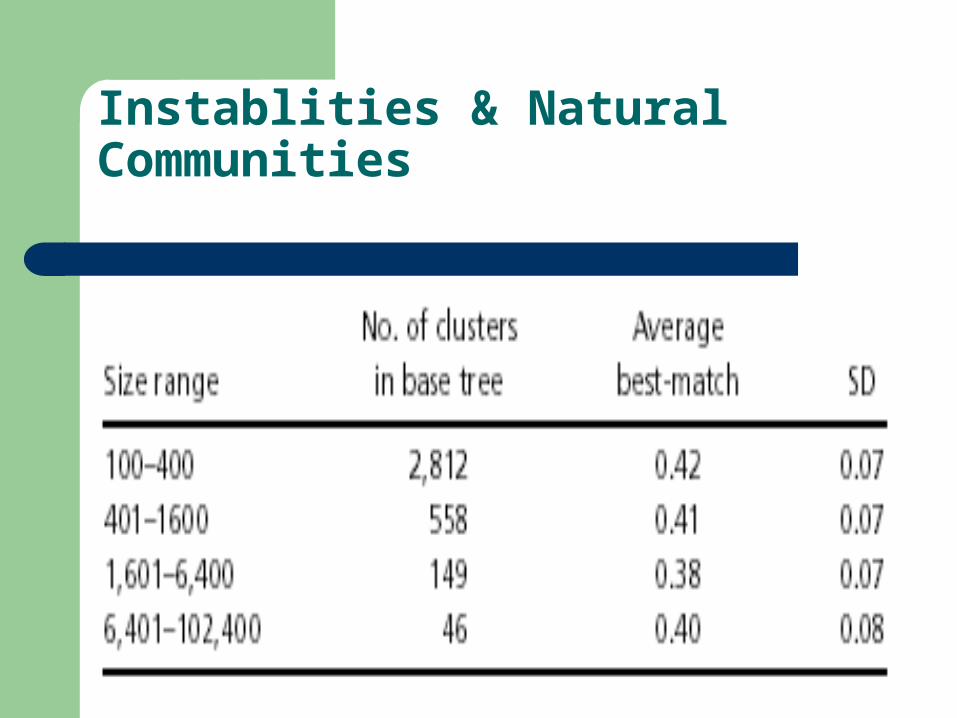
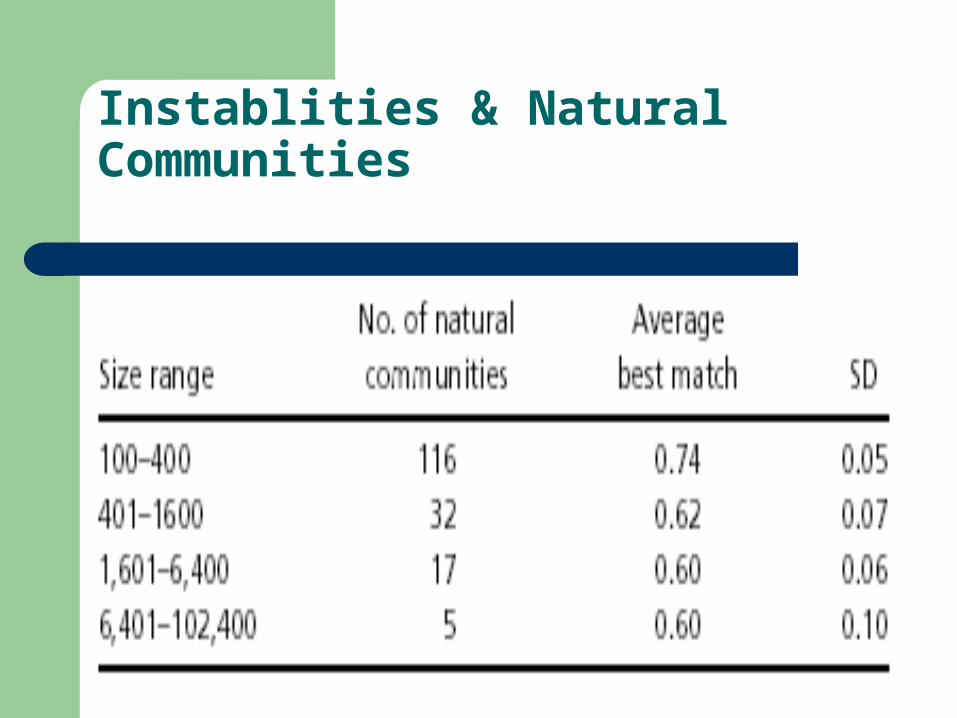
The definition ensures that a high match values (close to 1) occurs when two clusters have many papers in common and are roughly of the same size. the best-match value (C,T) is defined as the highest match (C,C`) value for any cluster C` in T. A total of 45 clusterings of the CiteSeer graph are considered. Each run uses a graph with a random 5% of the core papers removed. Then the avarege best-match values of the clusters in the base tree T1 match against the other 44 trees.
Instablities & Natural Communities
Instablities & Natural Communities
Table shows that the average cluster matches quite poorly to its closest match in the other tree (average best-match value only 0.40). A careful examination of the results of many runs shows that a small number of clusters, 170, appear in a good fraction of clusterings, and it is these clusters that correspond to recognizable topics. These ‘‘fixed points’’ in the Cite-Seer graph are what we call natural communities, and these are the communities whose evolution we will track over time.
Instablities & Natural Communities
We now define a natural community or cluster as follows. A community C in base tree T1 is natural iff in a fraction f of the clustering trees in T the best-match of C has a value greater than p, a predefined threshold. The definition has two parameters: f, the fraction of trees out of n trees total, and p, a lower-bound for the best match. Depending on what values are choosen for these parameters, one obtains more or less well defined natural communities. In practice, these values are set sufficiently high to select clusters that are clearly different from the average cluster in the tree.
Instablities & Natural Communities
Using n=45, f=0.6, p=0.7 for clusters with containing less than 1,000 papers and p=0.5 for larger clusters,170 natural communities were found that are size of 100 or greater in the CiteSeer graph, covering all aspects of computer science and portions of other fields. These natural communities were selected from 3,500 clusters with size 100 in the base tree. Note that these natural communities vary in strength and their precise number depends, of course, on the setting of f and p. By using keyword data and journal titles, we found the natural communities to be quite coherent.
Instablities & Natural Communities
Instablities & Natural Communities
Tracking Natural Communities
Now turn to our main objective: the use of these natural communities in tracking the temporal evolution of the network. In particular, we need to validate that when the network evolves over time and a few years of papers are added (i) there is not a dramatic shift in terms of natural communities, and (ii) that the occurring changes have a plausible interpretation in terms of the evolution of the field. These are inherently empirical questions. The results discussed below will show that our notion of natural communities satisfies both criteria.
Tracking Natural Communities
To study the temporal evolution process in detail, we will track changes for a subset of the natural community data. Two snapshots were used : the time periods 1990–1998 (referred to as the 1998 data set) and 1990–2001 (referred to as the 2001 data set). The goal is to study changes in community structure as they occurred during the three years from 1999 to 2001. [The core set of the CiteSeer data set consists of papers available in digital form on the web. The literature coverage of the earlier years of the collection is less complete because the fraction of papers available on the web was limited.]
Tracking Natural Communities
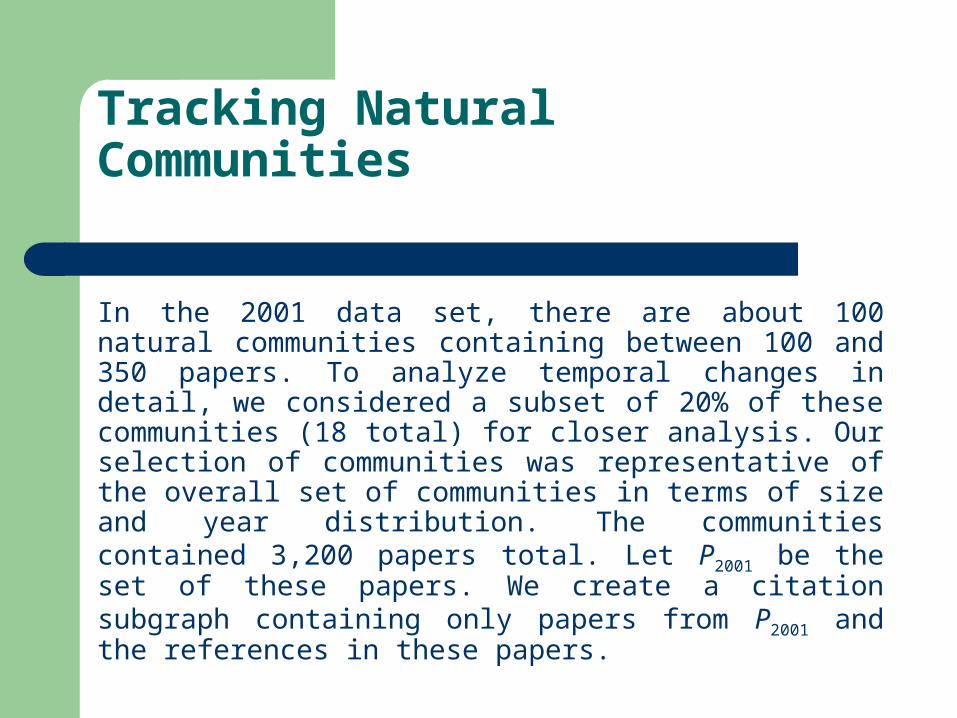
In the 2001 data set, there are about 100 natural communities containing between 100 and 350 papers. To analyze temporal changes in detail, we considered a subset of 20% of these communities (18 total) for closer analysis. Our selection of communities was representative of the overall set of communities in terms of size and year distribution. The communities contained 3,200 papers total. Let P2001 be the set of these papers. We create a citation subgraph containing only papers from P2001 and the references in these papers.
Tracking Natural Communities
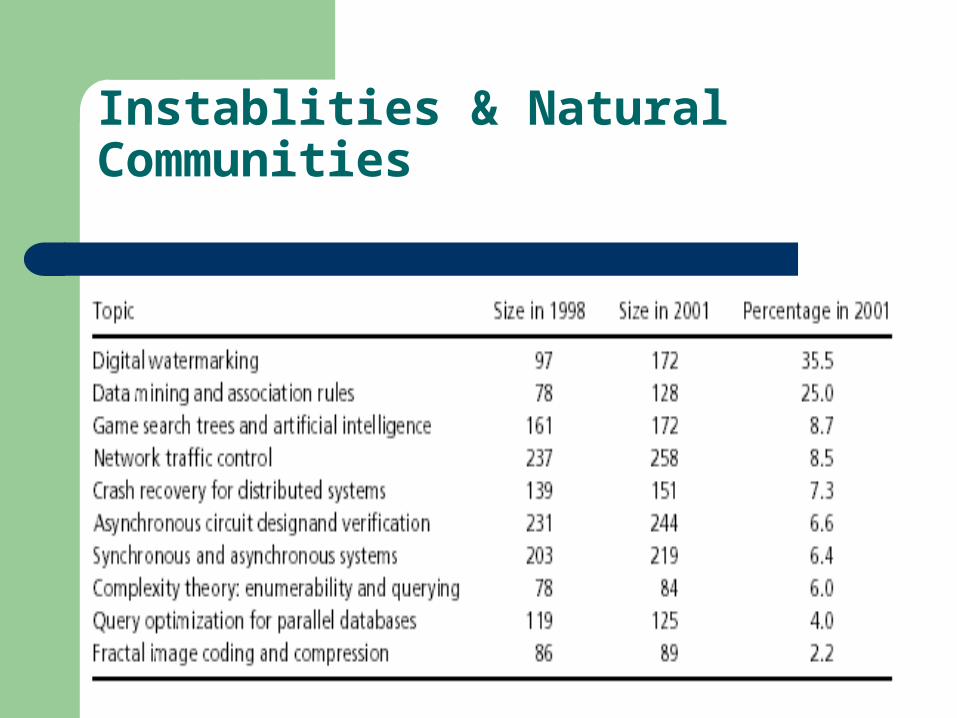
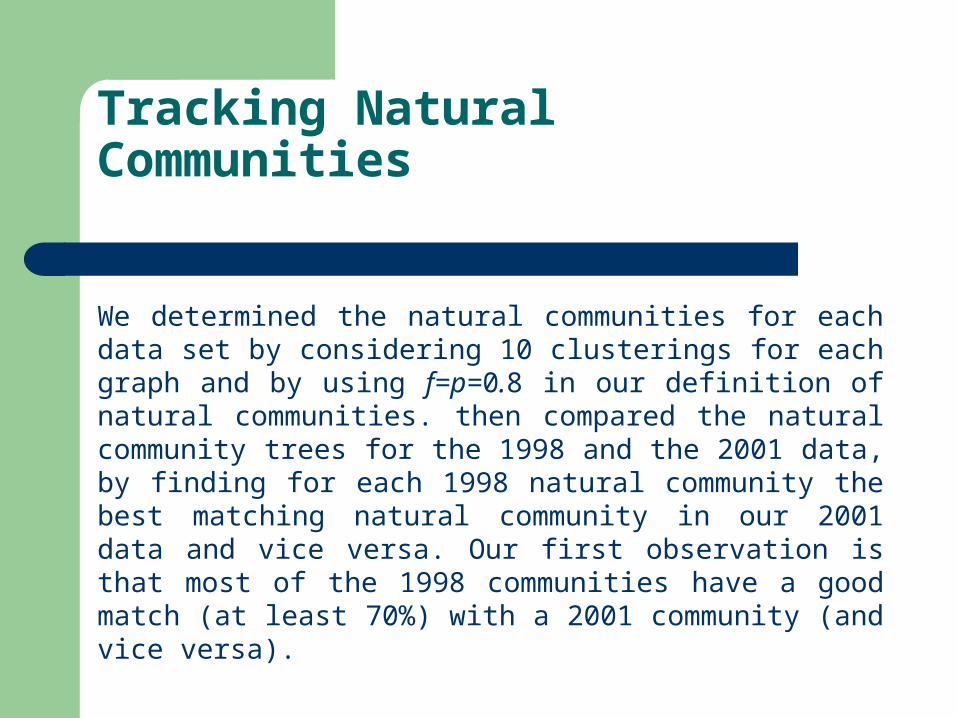
We determined the natural communities for each data set by considering 10 clusterings for each graph and by using f=p=0.8 in our definition of natural communities. then compared the natural community trees for the 1998 and the 2001 data, by finding for each 1998 natural community the best matching natural community in our 2001 data and vice versa. Our first observation is that most of the 1998 communities have a good match (at least 70%) with a 2001 community (and vice versa).
Tracking Natural Communities
Tracking Natural Communities
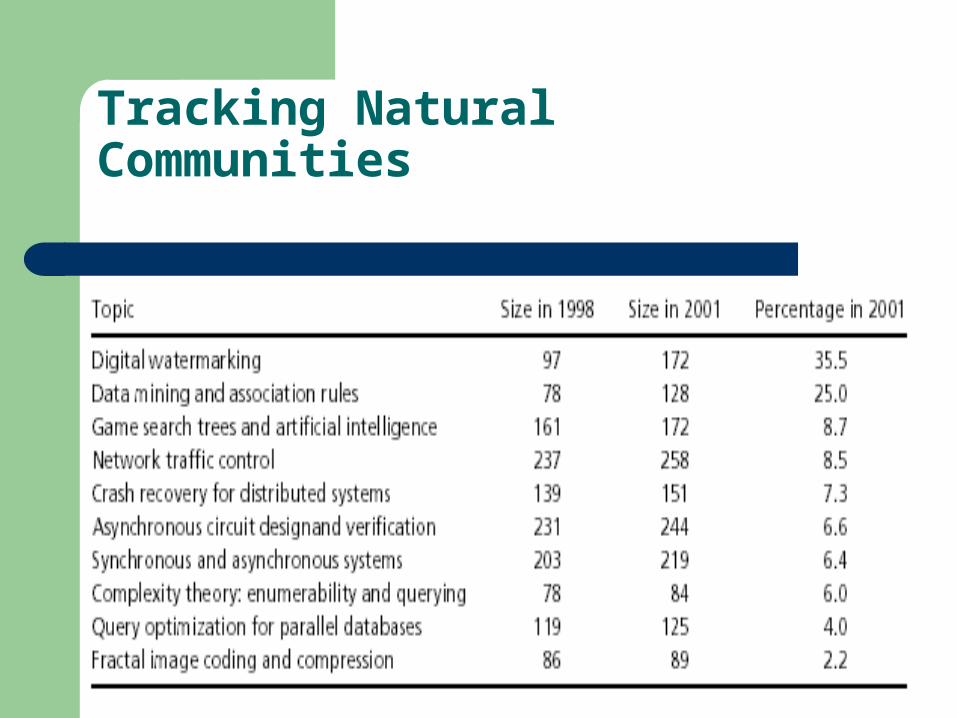
The communities are sorted by growth rate. We see that the growth rates vary quite a bit: some communities are very active and growing fast, but several other communities appear stagnant. From the perspective of temporal evolution, the most interesting changes involve the emergence of new communities. Two emerging communities were identified: wireless networks and quantum computing. These emerging communities are consistent with recent developments in the field.
Tracking Natural Communities
Our first example is the emergence of the wireless community. In 1998, two natural communities centered around ‘‘network systems’’ with 367 papers. These communities consist of a combination of optical networking, distributed computing, and crash recovery papers with some initial papers on ad hoc/wireless networks. However, at this time, there is no well defined community on ad hoc/wireless networks. However, there is a significant change in networking papers over the 1999–2001 period.
Tracking Natural Communities
About 60 papers on ad hoc/wireless networks are added to the database. As a result, we find that, in the 2001 data, the ad hoc/wireless papers form a distinct natural community consisting of ad hoc/wireless papers from the 1998 set with the post-1998 papers added. In the 2001 cluster tree, this new community merges in with the larger network community at a higher level.

Tracking Natural Communities
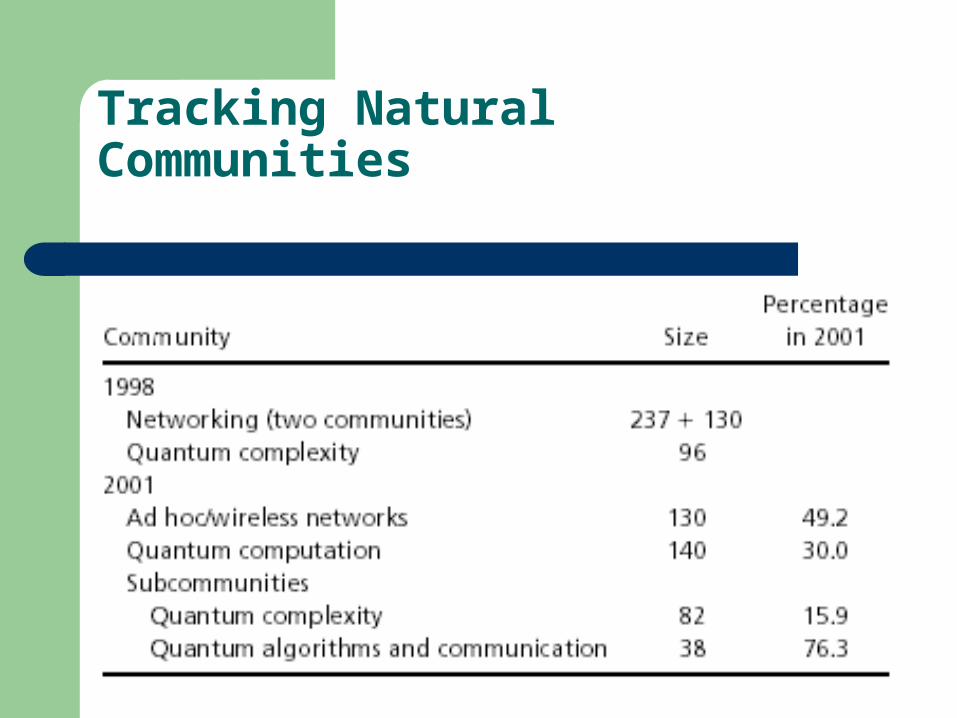
A second example is the emergence of the quantum algorithms and communication community within quantum computing. This is an example of a community that is branching out over time (evolving community). In the 1998 set of natural communities, we find that there is a natural community of size 96 that contains papers on quantum computing and complexity theory. In the 2001 set, this community has grown to 140 papers. However, the 2001 clustering now reveals further substructure.

Tracking Natural Communities
There are two distinct subcommunities; one on quantum complexity (size 82; fairly stable) and another, fast growing community of 38 papers. After examining the titles, it is clear that most of these papers cover quantum algorithms and quantum communication, both very hot topics in the past few years, it is encouraging to see these developments reflected in our natural community data.. So, in 1998, the quantum community was mostly centered on one topic; in 2001, the community was branching and growing quickly.
Tracking Natural Communities
Conclusion
In summary, these examples show that the notion of natural communities provides a promising tool for studying the temporal evolution of linked networks. This work have provided a framework for studying the temporal evolution of the community structure of large linked networks. The notion of natural communities can be used to identify a relatively stable core of a hierarchical agglomerative clustering.
Conclusion
The true structure in the data are revealed by averaging out the large number of ‘‘accidental’’ clusters that emerge in any single clustering run. In the experiments on the CiteSeer network, and the natural communities can be used to study the evolution of the network by tracking established communities and uncovering new emerging community structure.

Questions
?