tracking clients’ progress out of poverty koota case... · financial services pvt. ltd — a...
TRANSCRIPT
Progress out of Poverty Index® (PPI®) Mini Case Study Series | 1
IntroductionGrameen Koota (GK), a division of Grameen Financial Services Pvt. Ltd — a well-known microfinance institution (MFI) operating in India, is the first MFI in that country to fully integrate into its operations two Grameen Foundation tools that have helped it under-stand the poverty levels of its clients and track their movement out of poverty over time.
Grameen Koota began as a project of the T. Muniswamappa Trust, an NGO. In 1999, GK launched independent operations in Kar-nataka with a Grameen-style group lending methodology. By 2011, the MFI had grown to more than 450,000 clients and almost 2,000 employees, and developed many non-financial products as well as an individual lending pro-gram. GK now has operations in four states in India.
GK’s mission is twofold: to transform and up-lift the lives of poor and low-income families with microfinance and other developmental services, and to be a sustainable and trusted provider of affordable, need-based services. GK’s commitment to proactive data collection and management, as well as its investment in technology, has enabled the MFI to discover important trends in its clients’ movement across poverty lines during their time with the institution.
A long-term partnership with Grameen Foun-dation led to GK’s early adoption of two key tools that have contributed to the MFI’s cur-rent capacity to collect and analyze client data on poverty levels. First, in 2007, GK started using Mifos1, a dynamic open-source manage-ment information system (MIS) developed by Grameen Foundation to help MFIs central-ize data management functions. The Mifos platform has several advantages – including flexibility, scalability and centralization – all of which support GK’s innovative data manage-ment and analysis activities. These advantag-es were fundamental to enabling GK to com-pile its poverty data in a way that helps reveal its clients’ movement up the economic ladder.
Client Data Underpins Strategic AnalysisIn December 2008, when GK began collect-ing the poverty status data of its clients using the Progress out of Poverty Index® (PPI®), it was the first MFI in India to do so. GK is now the first fully certified user of the PPI in that country. PPI certification demonstrates that the MFI is using the tool correctly, and ensures the accuracy of its results.
1 Grameen Foundation began plans to turn the management of Mifos over to the strong open-source community that helped to create and build it over the last five years. That transition should be complete by November 2011.
Grameen Koota: Tracking Clients’ Progress out of Poverty
Progress out of Poverty Index® (PPI®) Mini Case Study Series | 2
GK collects PPI data from its clients at client intake, each time the client renews an income generating loan, and at drop-out, if the client leaves the MFI. Once collected, the PPI data is stored in the Mifos platform, which GK has tailored to meet its specific information needs.
Given its commitment to data collection, GK has collected PPI data for more than 300,000 clients in the last two years. More than 48,000 of these clients now have data from at least two PPIs, which enables the institution to begin to track its clients’ movement out of poverty. At the end of each month, required data is extracted out of Mifos into Excel and a rigorous data cleaning and validation pro-cess is carried out. Once the data set is ready, analysis and reporting follow. The data is representative of the MFI’s clients regionally
and at the branch level and therefore can help the institution begin to set targets based on this information. Another advantage is that the data aids in the segmentation of GK clients according to various client characteristics, such as urban/rural location, religion, branch affiliation, etc. to help the MFI tailor its prod-ucts and services more precisely to its clients’ needs.
Demonstrating Progress out of PovertyAnalyzing clients with data from at least two PPIs enabled GK to understand more precisely the poverty profiles over time of groups of clients vis-à-vis several variables, such as age, loan amount, loan purpose, region and use of
Highlights of Grameen Koota’s Poverty Data
GK has analyzed the data for more than 48,000 clients who have at least two PPIs, with the following results:
• MovementOutofPoverty–Poverty levels of GK clients with data from two PPIs have improvedconsistently across all poverty brackets for the duration of the loan: 23% of the clients who werebelow the $1.25/day/PPP line and 9% of the clients who were below the $2/day/PPP line during thefirst PPI dataset have moved above their respective poverty lines.
• LocationMatters–Rural clients are poorer on average than urban clients and rural clients’ move-ment across poverty lines is slower than urban clients: 21% of the clients who were below $1.25/day/PPP line in rural areas have moved above that line, versus 26% for urban areas.
• RepeatClients–When PPIs were collected across loan cycles, it was found that poverty ratesdecreased with the increasing number of loan cycles and that a similar reduction in poverty rateoccurred during each loan cycle. PPI data analysis cannot rationalize this finding, and there couldbe several reasons, such as clients benefiting from the loan or loans becoming larger to attract andretain relatively better-off clients as the number of loan cycles increase. Therefore, further research isnecessary to understand this finding more fully.
• MicrofinancePlus–GK financed pilot loans to fund the purchase of water/sanitation devices andmore efficient cooking stoves. Based on the data from these clients’ PPIs, it was found that clientswith loans for water and sanitation had lower poverty rates than general credit clients, and were ableto move up the economic ladder in significant numbers.
Progress out of Poverty Index® (PPI®) Mini Case Study Series | 3
non-financial products. The results are then compared with national and international poverty lines. Time-series data such as this enables GK to understand a client’s move-ment across various poverty lines.
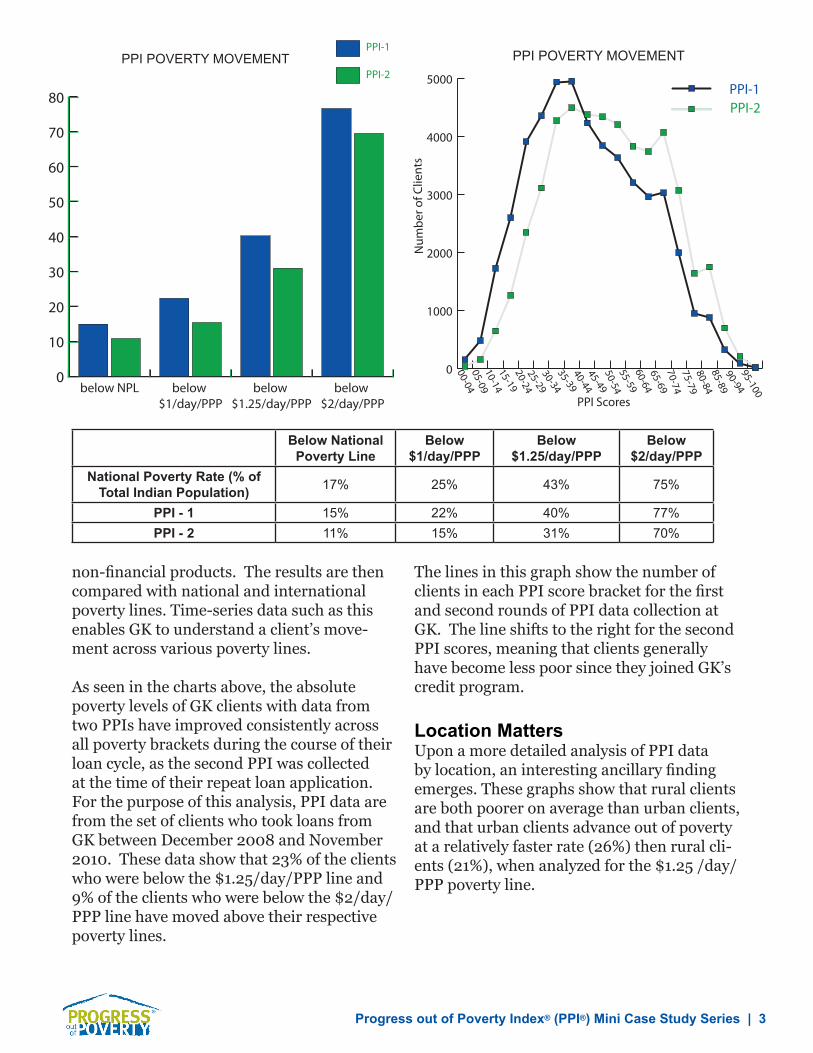
As seen in the charts above, the absolute poverty levels of GK clients with data from two PPIs have improved consistently across all poverty brackets during the course of their loan cycle, as the second PPI was collected at the time of their repeat loan application. For the purpose of this analysis, PPI data are from the set of clients who took loans from GK between December 2008 and November 2010. These data show that 23% of the clients who were below the $1.25/day/PPP line and 9% of the clients who were below the $2/day/PPP line have moved above their respective poverty lines.
The lines in this graph show the number of clients in each PPI score bracket for the first and second rounds of PPI data collection at GK. The line shifts to the right for the second PPI scores, meaning that clients generally have become less poor since they joined GK’s credit program.
Location MattersUpon a more detailed analysis of PPI data by location, an interesting ancillary finding emerges. These graphs show that rural clients are both poorer on average than urban clients, and that urban clients advance out of poverty at a relatively faster rate (26%) then rural cli-ents (21%), when analyzed for the $1.25 /day/PPP poverty line.
0
10
20
30
40
50
60
70
80
PPI-2
PPI-1
below $2/day/PPP
below $1.25/day/PPP
below $1/day/PPP
below NPL
PPI POVERTY MOVEMENT
0
1000
2000
3000
4000
5000
PPI-2PPI-1
95-100
90-94
85-89
80-84
75-79
70-74
65-69
60-64
55-59
50-54
45-49
40-44
35-39
30-34
25-29
20-24
15-19
10-14
05-09
00-04
PPI ScoresN
umbe
r of C
lient
s
PPI POVERTY MOVEMENT
Below National Poverty Line
Below $1/day/PPP
Below$1.25/day/PPP
Below$2/day/PPP
National Poverty Rate (% of Total Indian Population) 17% 25% 43% 75%
PPI - 1 15% 22% 40% 77%PPI - 2 11% 15% 31% 70%

Progress out of Poverty Index® (PPI®) Mini Case Study Series | 4
Poverty Rates Among Repeat ClientsThe PPI enables GK to measure poverty rates among those clients who have taken subse-quent loans. When PPI data were first col-lected among repeat clients from various loan cycles, the data revealed that poverty rates decreased with the increasing number of loan cycles. There could be various reasons for this finding and further analysis of the data is nec-essary to establish causality. Some plausible reasons for this result include:
� Clients benefitted from participation in GK’s credit program and have improved their economic well being.� Higher loan amounts for each consecutiveloan cycle enabled GK to attract and retain better off clients.
� Drop-out of poorer clients at the end of each loan cycle, which could be due to a vari-ety of reasons.
0
10
20
30
40
50
60
70
80
PPI-2-Rural
PPI-1-Rural
below $2/day/PPP
below $1.25/day/PPP
below $1/day/PPP
below NPL
POVERTY MOVEMENT, RURAL PORTFOLIO
0
10
20
30
40
50
60
70
80PPI-2-Urban
PPI-1-Urban
below $2/day/PPP
below$1.25/day/PPP
below $1/day/PPP
below NPL
POVERTY MOVEMENT, URBAN PORTFOLIO
% Change in Poverty LevelsPoverty Rate
Net Reduction in Poverty Rate (%)# of PPIs
Assessed 90% Confidence Interval $1.25/day/PPPPPI-1 (%)
$1.25/day/PPPPPI-2 (%)
Loan Cycle 2 725 +/- 4.2% 49 39 21
Loan Cycle 3 23849 +/- 0.7% 47 36 23
Loan Cycle 4 8342 +/-1.3% 37 28 24
Loan Cycle 5 & Above 15258 +/- 0.9% 32 25 22
Rural/Urban # of PPIs Assessed
Below National Poverty Line
Below $1/day/PPP
Below$1.25/day/PPP
Below$2/day/PPP
PPI-1 - Rural 30823 16% 25% 44% 79%PPI-2 - Rural 30823 12% 18% 34% 73%PPI-1 - Urban 17351 13% 18% 34% 72%PPI-2 - Urban 17351 9% 12% 25% 64%
90% confidence interval: +/- 0.4% to +/- 0.9% depending on poverty line used for analysis

Progress out of Poverty Index® (PPI®) Mini Case Study Series | 5
When the second round of PPI data collection took place, it showed that poverty rates im-proved in each loan cycle at largely the same rate. For the $1.25/day/PPP poverty line, there was a 21%-24% reduction in the poverty rate of clients during each loan cycle.
Microfinance PlusBecause Grameen Koota is committed to help-ing transform clients’ lives, it is conducting pilot implementation of two alternative prod-ucts, which are designed not to produce rev-enue, but rather to improve the clients’ quality of life. One of these products offers a loan so that clients who cook over an open fire can purchase a fuel-efficient cooking stove. The other is a loan that enables clients to invest in improved water/sanitation infrastructure for their homes. Currently, these products are only offered in portions of the state of Karna-taka, and so the poverty levels of these clients are not representative of GK’s client base as a whole.
One trend that is visible from this data is that the clients who took a loan for the water and sanitation product, who are slightly better off than the very poor, were able to move up the economic ladder in significant numbers. Fur-ther qualitative research is required to estab-lish the rationale for this preliminary evidence provided by application of the PPI tool to GK’s pilot loans.
Challenges and Opportunities for the Application of PPITracking poverty information for hundreds of thousands of clients in rural areas in the developing world is certainly not without its challenges. Some of the main obstacles that GK faces for smoother implementation of the PPI include: � Low connectivityPoor internet connections during the data entry process can lead loan officers to cre-ate multiple entries for the same client due to not receiving confirmation that previously entered data was properly saved in the data-base. These data entry errors are taken care of during the monthly cleaning and validation process; however, this process currently takes one week for each month of data, due to the volume of such errors. GK is currently work-ing to improve its system for data entry and minimize these types of errors.
� Inconsistent implementationCurrently figures show that loan officers ad-minister a PPI for only 30-50% of the cases where PPI data should be collected from cli-ents (during intake, renewal and exit). Proper loan officer training and enhanced efficiency in implementation of the PPI survey will be necessary to reach GK’s goal of 100% consis-tency in terms of the collection of PPI data for its clients at each of these three points in the loan cycle, especially during client drop-out.
PPIs for Water Sanitation
# of PPIs Assessed
Below National Poverty Line
Below $1/day/PPP
Below $1.25/day/PPP
Below $2/day/PPP
PPI-1 558 12% 18% 35% 75%
PPI-2 558 9% 12% 26% 67%Net Reduction in Poverty Rate (%) 26% 34% 25% 10%
90% confidence interval: +/- 3.1% to +/- 5.2% depending on poverty line used for analysis
Progress out of Poverty Index® (PPI®) Mini Case Study Series | 6
� Uneven advancement out of povertyWhile these data show that significant num-bers of GK clients are improving their eco-nomic well-being and becoming less poor, this is not true of all clients, especially certain cat-egories of clients, such as the very poor who participated in the cook stove pilot. Further analysis and additional data collection should help the MFI understand the differences between those clients who are moving out of poverty and those who are not, which in turn should enable them to better target those cli-ents who need additional assistance to move out of poverty.
On the other hand, collecting and analyzing this type of data creates many unique op-portunities for GK to enhance its operations through the strategic application of its PPI data. Some of these opportunities include:
� Expanded reporting —Monthly management reports are being cre-ated so that GK managers can benefit from timely information on the institution’s pov-erty outreach and its clients’ changing poverty status. Reports designed for field officers are also planned, to share relevant portions of this information with those closest to the clients.
� Strategic planning –Due to the large size of GK’s dataset – more than 48,000 clients have information from multiple PPIs – this data can be used to set targets for the institution and shape GK’s pri-orities and outreach in the future.
� Improved products and services –The application of this analysis has not yet resulted in revisions of current products, organizational policies and strategy or the expansion of product offerings. In the future, GK is committed to applying its data-driven knowledge of its clients’ poverty levels toward
improving the clients’ experience with both their financial and non-financial products. Some potential interventions might include: improved product design based on the seg-mentation of clients through PPI data, in-creased outreach to poorer regions, or offering non-financial or other complementary prod-ucts to poorer clients to facilitate their faster movement across poverty lines.■
Brief History of Grameen Koota’s Honors
Grameen Koota has won several distinc-tions over the last few years that demon-strate its commitment to excellence and innovation:
• ProcessExcellence– In 2006, GK won PlaNetFinance’s Microfinance Process Excellence Award(MPEA) for India.
• ForbesTop50–In 2007, Forbes magazine rankedGK in the top 50 MFIs worldwide. GK also won aGrameen Foundation Pioneer Award in the sameyear for its adoption of Mifos, and was the first MFIin India to adopt this open source MIS.
• Number1inIndia–The Microfinance InformationExchange (MIX) ranked GK the number one MFI inIndia in terms of reporting for 2010, and gave theinstitution 5 diamonds for excellence in disclosure.
• ListedonBombayStockExchange–In 2010 and2011, Grameen Koota sold Non-Convertible Deben-tures (NCDs) on Asia’s oldest stock exchange.
www.progressoutofpoverty.org
This case study was produced by the Grameen Foundation. Acknowledgements go to Cara Forster as the writer, Sameera B, Senior Manager of New Initiatives at Grameen Koota and the rest of the Grameen Koota team for their help in collecting information for this case study.
To learn more about or contact Grameen Koota, visit their website at http://www.gfspl.in.
Photos and graphics inside were provided by Grameen Foundation and Grameen Koota.
This case study demonstrates one program’s innovative use of the PPI as a tool to advance its social mis-sion, offering valuable lessons for pro-poor organizations.