tracking and modeling focus of attention in meetings - interactive
TRANSCRIPT
Tracking and Modeling Focus of Attention
in Meetings
Zur Erlangung des akademischen Grades eines
Doktors der Ingenieurwissenschaften
von der Fakultat fur Informatik
der Universitat Karlsruhe (Technische Hochschule)
genehmigte
Dissertation
von
Rainer Stiefelhagenaus Stuttgart
Tag der mundlichen Prufung: 5. Juli 2002Erster Gutachter: Prof. Dr. Alex WaibelZweiter Gutachter: Prof. Dr. Matthew Turk


Abstract
This thesis addresses the problem of tracking the focus of attention of people. Inparticular, a system to track the focus of attention of participants in meetings isdeveloped. Obtaining knowledge about a person’s focus of attention is an importantstep towards a better understanding of what people do, how and with what or whomthey interact or to what they refer. In meetings, focus of attention can be used todisambiguate the addressees of speech acts, to analyze interaction and for indexing ofmeeting transcripts. Tracking a user’s focus of attention also greatly contributes tothe improvement of human-computer interfaces since it can be used to build interfacesand environments that become aware of what the user is paying attention to or withwhat or whom he is interacting.
The direction in which people look; i.e., their gaze, is closely related to their focusof attention. In this thesis, we estimate a subject’s focus of attention based on hisor her head orientation. While the direction in which someone looks is determinedby head orientation and eye gaze, relevant literature suggests that head orientationalone is a sufficient cue for the detection of someone’s direction of attention duringsocial interaction. We present experimental results from a user study and from severalrecorded meetings that support this hypothesis.
We have developed a Bayesian approach to model at whom or what someone is look-ing based on his or her head orientation. To estimate head orientations in meetings,the participants’ faces are automatically tracked in the view of a panoramic cameraand neural networks are used to estimate their head orientations from pre-processedimages of their faces. Using this approach, the focus of attention target of subjectscould be correctly identified during 73% of the time in a number of evaluation meet-ings with four participants.
In addition, we have investigated whether a person’s focus of attention can be pre-dicted from other cues. Our results show that focus of attention is correlated to whois speaking in a meeting and that it is possible to predict a person’s focus of attentionbased on the information of who is talking or was talking before a given moment.We have trained neural networks to predict at whom a person is looking, based oninformation about who was speaking. Using this approach we were able to predictwho is looking at whom with 63% accuracy on the evaluation meetings using onlyinformation about who was speaking. We show that by using both head orientationand speaker information to estimate a person’s focus, the accuracy of focus detectioncan be improved compared to just using one of the modalities for focus estimation.
To demonstrate the generality of our approach, we have built a prototype system to

demonstrate focus-aware interaction with a household robot and other smart appli-ances in a room using the developed components for focus of attention tracking. Inthe demonstration environment, a subject could interact with a simulated householdrobot, a speech-enabled VCR or with other people in the room, and the recipient ofthe subject’s speech was disambiguated based on the user’s direction of attention.

Zusammenfassung
Die vorliegende Arbeit beschaftigt sich mit der automatischen Bestimmung und Ver-folgung des Aufmerksamkeitsfokus von Personen in Besprechungen.
Die Bestimmung des Aufmerksamkeitsfokus von Personen ist zum Verstandnis undzur automatischen Auswertung von Besprechungsprotokollen sehr wichtig. So kanndamit beispielsweise herausgefunden werden, wer zu einem bestimmten Zeitpunkt wenangesprochen hat beziehungsweise wer wem zugehort hat. Die automatische Bestim-mung des Aufmerksamkeitsfokus kann desweiteren zur Verbesserung von Mensch-Maschine-Schnittstellen benutzt werden.
Ein wichtiger Hinweis auf die Richtung, in welche eine Person ihre Aufmerksamkeitrichtet, ist die Kopfstellung der Person. Daher wurde ein Verfahren zur Bestimmungder Kopfstellungen von Personen entwickelt. Hierzu wurden kunstliche neuronaleNetze benutzt, welche als Eingaben vorverarbeitete Bilder des Kopfes einer Personerhalten, und als Ausgabe eine Schatzung der Kopfstellung berechnen. Mit dentrainierten Netzen wurde auf Bilddaten neuer Personen, also Personen, deren Bildernicht in der Trainingsmenge enthalten waren, ein mittlerer Fehler von neun bis zehnGrad fur die Bestimmung der horizontalen und vertikalen Kopfstellung erreicht.
Desweiteren wird ein probabilistischer Ansatz zur Bestimmung von Aufmerksamkeits-zielen vorgestellt. Es wird hierbei ein Bayes’scher Ansatzes verwendet um dieA-posteriori Wahrscheinlichkeiten verschiedener Aufmerksamkteitsziele, gegebenbeobachteter Kopfstellungen einer Person, zu bestimmen. Die entwickelten Ansatzewurden auf mehren Besprechungen mit vier bis funf Teilnehmern evaluiert.
Ein weiterer Beitrag dieser Arbeit ist die Untersuchung, inwieweit sich die Blickrich-tung der Besprechungsteilnehmer basierend darauf, wer gerade spricht, vorhersagenlaßt. Es wurde ein Verfahren entwickelt um mit Hilfe von neuronalen Netzen denFokus einer Person basierend auf einer kurzen Historie der Sprecherkonstellationenzu schatzen.
Wir zeigen, dass durch Kombination der bildbasierten und der sprecherbasiertenSchatzung des Aufmerksamkeitsfokus eine deutliche verbesserte Schatzung erreichtwerden kann.
Insgesamt wurde mit dieser Arbeit erstmals ein System vorgestellt um automatischdie Aufmerksamkeit von Personen in einem Besprechungsraum zu verfolgen.
Die entwickelten Ansatze und Methoden konnen auch zur Bestimmung der Aufmerk-samkeit von Personen in anderen Bereichen, insbesondere zur Steuerung von comput-erisierten, interaktiven Umgebungen, verwendet werden. Dies wird an einer Beispielap-plikation gezeigt.


Acknowledgments
This work was conducted at the Interactive Systems Lab (ISL) in the Institut furLogik, Komplexitat und Deduktionssysteme. I would like to thank Prof. Alex Waibel,director of the ISL, for advising me during my doctoral studies and giving me theopportunity to work in such an inspiring research environment. I would also like tothank Prof. Matthew Turk, my co-advisor, for his thorough comments, which havegreatly improved this dissertation.
I am very grateful to Dr. Jie Yang of the Carnegie Mellon University, who in recentyears has provided a great deal of support and encouragement. I would like to thankhim especially for many fruitful discussions both in person and via telephone.
Moreover, I would like to thank many current and former colleagues at the Interac-tive Systems Labs, both in Karlsruhe and at Carnegie Mellon, for their collaborationand their wonderful support: Michael Bett, Susi Burger, Eric Carraux, Matthias De-necke, Christian Fugen, Michael Finke, Jurgen Fritsch, Petra Geutner, Ralph Gross,Hermann Hild, Stefan Jager, Thomas Kemp, Detlef Koll, Victoria MacLaren, RobertMalkin, Stefan Manke, John McDonough, Uwe Meier, Florian Metze, Celine Morel,Jurgen Reichert, Klaus Ries, Ivica Rogina, Thomas Schaaf, Tanja Schulz, HagenSoltau, Bernhard Suhm, Martin Westphal, Monika Woszczyna and Jie Zhue.
Many thanks to Silke Dannenmaier for her cheerful assistance in all administrativematters. Thanks to Frank Dreilich, Martin Klein and Norbert Berger for having keptour machines and network running.
And thanks to everybody who participated in the numerous data collection sessions!
Also thanks to Susi Burger, Uwe Meier, Klaus Ries, Pankaj Rege and Ashish Sanilfor their hospitality during my visits to Pittsburgh. Thanks to Thomas Schaaf andJurgen Fritsch for taking care of my papyrus whenever I was away.
Special thanks to everybody who helped proofreading this thesis: Jurgen Fritsch,Hermann Hild, Gunter Leypoldt, John McDonough, Klaus Ries and Jie Yang.
I also wish to thank my parents Hans-Dieter and Heidemarie and all the rest of myfamily for their support over the years.
Finally, I would like to thank Ines for her love and understanding.


Contents
1 Introduction 1
1.1 Focus of Attention Tracking in Meetings . . . . . . . . . . . . . . . . 3
1.2 Approach . . . . . . . . . . . . . . . . . . . . . . . . . . . . . . . . . 7
1.3 Outline . . . . . . . . . . . . . . . . . . . . . . . . . . . . . . . . . . . 10
2 Background and Related Work 13
2.1 Human Attention . . . . . . . . . . . . . . . . . . . . . . . . . . . . . 13
2.1.1 Computational models of attention . . . . . . . . . . . . . . . 15
2.2 Where We Look Is Where We Attend To . . . . . . . . . . . . . . . . 16
2.3 Gaze and Attention During Social Interaction . . . . . . . . . . . . . 19
2.4 Cues for the Perception of Gaze . . . . . . . . . . . . . . . . . . . . . 21
2.5 Eye Gaze Tracking Techniques . . . . . . . . . . . . . . . . . . . . . . 22
2.6 Head Pose Tracking . . . . . . . . . . . . . . . . . . . . . . . . . . . . 24
2.6.1 Vision-Based Methods . . . . . . . . . . . . . . . . . . . . . . 25
2.7 Summary . . . . . . . . . . . . . . . . . . . . . . . . . . . . . . . . . 27
3 Detecting and Tracking Faces 29
3.1 Appearance Based Face Detection . . . . . . . . . . . . . . . . . . . . 29
3.2 Face Detection Using Color . . . . . . . . . . . . . . . . . . . . . . . 30
3.3 A Stochastic Skin-Color Model . . . . . . . . . . . . . . . . . . . . . 31
i

ii CONTENTS
3.4 Locating Faces Using the Skin-Color Model . . . . . . . . . . . . . . 32
3.5 Tracking Faces With an Omni-Directional Camera . . . . . . . . . . . 33
3.5.1 Discussion . . . . . . . . . . . . . . . . . . . . . . . . . . . . . 36
4 Head Pose Estimation Using Neural Networks 37
4.1 Data Collection . . . . . . . . . . . . . . . . . . . . . . . . . . . . . . 38
4.1.1 Data Collection With a Pan-Tilt-Zoom Camera . . . . . . . . 39
4.1.2 Data Collection With the Omni-Directional Camera . . . . . . 40
4.2 Image Preprocessing . . . . . . . . . . . . . . . . . . . . . . . . . . . 41
4.2.1 Histogram Normalization . . . . . . . . . . . . . . . . . . . . . 41
4.2.2 Edge Detection . . . . . . . . . . . . . . . . . . . . . . . . . . 42
4.3 Neural Network Architecture . . . . . . . . . . . . . . . . . . . . . . . 43
4.4 Other Network Architectures . . . . . . . . . . . . . . . . . . . . . . . 44
4.5 Experiments and Results With Pan-Tilt-Zoom Camera Images . . . . 45
4.5.1 Error Analysis . . . . . . . . . . . . . . . . . . . . . . . . . . . 46
4.5.2 Generalization to Different Illumination . . . . . . . . . . . . . 48
4.5.3 A Control-Experiment to Show the Usefulness of Edge Features 50
4.6 Experiments and Results With Images From the Omni-DirectionalCamera . . . . . . . . . . . . . . . . . . . . . . . . . . . . . . . . . . 52
4.6.1 Adding Artificial Training Data . . . . . . . . . . . . . . . . . 53
4.6.2 Comparison . . . . . . . . . . . . . . . . . . . . . . . . . . . . 53
5 From Head Orientation to Focus of Attention 55
5.1 Unsupervised Adaptation of Model Parameters . . . . . . . . . . . . . 58
5.2 Experimental Results . . . . . . . . . . . . . . . . . . . . . . . . . . . 59
5.2.1 Meetings With Four Participants . . . . . . . . . . . . . . . . 63
5.2.2 Meetings With Five Participants . . . . . . . . . . . . . . . . 64
5.2.3 Upper Performance Limits Given Neural Network Outputs . . 64
5.3 Panoramic Images Versus High-Resolution Images . . . . . . . . . . . 66
5.4 Summary . . . . . . . . . . . . . . . . . . . . . . . . . . . . . . . . . 67

CONTENTS iii
6 Head Pose versus Eye-Gaze 69
6.1 Data Collection . . . . . . . . . . . . . . . . . . . . . . . . . . . . . . 69
6.2 Contribution of Head Orientation to Gaze . . . . . . . . . . . . . . . 70
6.3 Predicting the Gaze Target Based on Head Orientation . . . . . . . . 73
6.3.1 Labeling Based on Gaze Direction . . . . . . . . . . . . . . . . 73
6.3.2 Prediction Results . . . . . . . . . . . . . . . . . . . . . . . . 74
6.4 Discussion . . . . . . . . . . . . . . . . . . . . . . . . . . . . . . . . . 75
7 Combining Pose Tracking with Likely Targets of Attention 77
7.1 Predicting Focus Based on Sound . . . . . . . . . . . . . . . . . . . . 78
7.1.1 Sound-Only Based Prediction Results . . . . . . . . . . . . . . 80
7.2 Combining Head Pose and Sound to Predict Focus . . . . . . . . . . 80
7.3 Using Temporal Speaker Information to Predict Focus . . . . . . . . . 81
7.3.1 Experimental Results . . . . . . . . . . . . . . . . . . . . . . . 84
7.3.2 Combined Prediction Results . . . . . . . . . . . . . . . . . . 85
7.4 Summary . . . . . . . . . . . . . . . . . . . . . . . . . . . . . . . . . 86
8 Portability 89
8.1 Data Collection at CMU . . . . . . . . . . . . . . . . . . . . . . . . . 90
8.2 Head Pan Estimation Experiments . . . . . . . . . . . . . . . . . . . 90
8.2.1 Training New Networks from Scratch . . . . . . . . . . . . . . 91
8.2.2 Adapting a Trained Network . . . . . . . . . . . . . . . . . . . 92
8.3 Focus of Attention Detection Results . . . . . . . . . . . . . . . . . . 95
8.4 Discussion . . . . . . . . . . . . . . . . . . . . . . . . . . . . . . . . . 97
9 Focus of Attention in Context-Aware Multimodal Interaction 99
10 Conclusions 103
10.1 Future Work . . . . . . . . . . . . . . . . . . . . . . . . . . . . . . . . 105
Bibliography 107

iv CONTENTS

List of Figures
1.1 Image taken in the meeting room. . . . . . . . . . . . . . . . . . . . 5
1.2 The main window of the meeting browser. It consists of three sections:an upper graphical display which shows the meeting over time, a lowerleft window that shows a transcript of the meeting and a lower rightwindow which displays either a video of one of the participants or adialogue summary. . . . . . . . . . . . . . . . . . . . . . . . . . . . . 6
2.1 Seven records of eye movements by the same subject. Each recordlasted 3 minutes. 1) Free examination. Before subsequent recordings,the subject was asked to: 2) estimate the material circumstances ofthe family; 3) give the ages of the people; 4) surmise what the familyhad been doing before the arrival of the “unexpected visitor;” 5) re-member the clothes worn by the people; 6) remember the position ofthe people and objects in the room; 7) estimate how long the “unex-pected visitor” had been away from the family (from [Yarbus ’67], cf.[Glenstrup & Engell-Nielsen ’95]). . . . . . . . . . . . . . . . . . . . . 17
2.2 Some commercial head mounted eye gaze trackers. . . . . . . . . . . . 24
2.3 Remote eye-gaze tracking systems. . . . . . . . . . . . . . . . . . . . 24
2.4 Typical image resolutions used in commercial eye gaze tracking systems. 25
3.1 Skin-color distribution of forty people . . . . . . . . . . . . . . . . . . 31
3.2 Application of the color model to a sample input image. The face is foundin the input image (marked by a white rectangle) . . . . . . . . . . . . . 33
3.3 The panoramic camera used to capture the scene1 . . . . . . . . . . . 33
3.4 Meeting scene as captured with the panoramic camera . . . . . . . . 34
v

vi LIST OF FIGURES
3.5 Panoramic view of the scene around the conference table. Faces areautomatically detected and tracked (marked with boxes). . . . . . . . 35
3.6 Perspective Views of the meeting participants. . . . . . . . . . . . . 35
3.7 Some sample images of occluded or not correctly detected faces. . . . 36
4.1 Some sample images from the pan-tilt-zoom camera taken in the com-puter lab. . . . . . . . . . . . . . . . . . . . . . . . . . . . . . . . . . 39
4.2 Some sample images from the pan-tilt-zoom camera taken in a secondroom with many windows. . . . . . . . . . . . . . . . . . . . . . . . . 39
4.3 Distributions of horizontal (pan) and vertical (tilt) head rotations inthe collected data set. . . . . . . . . . . . . . . . . . . . . . . . . . . 40
4.4 Training Samples: The perspective images were generated from apanoramic view. Head pose labels are collected with a magnetic fieldpose tracker. . . . . . . . . . . . . . . . . . . . . . . . . . . . . . . . . 41
4.5 Pre-processed images: normalized gray-scale, horizontal edge and ver-tical edge image (from left to right). . . . . . . . . . . . . . . . . . . . 42
4.6 Neural network to estimate head pan (or tilt) from pre-processed facialimages. . . . . . . . . . . . . . . . . . . . . . . . . . . . . . . . . . . . 44
4.7 Error histograms for pan and tilt on the multi-user test set. . . . . . . 46
4.8 Error histograms for pan and tilt on the new users. . . . . . . . . . . 47
4.9 Mean errors for different target angles on the multi-user test set andon new users. . . . . . . . . . . . . . . . . . . . . . . . . . . . . . . . 47
5.1 Class-conditional head pan distributions of four persons in a meetingwhen looking to the person to their left, to their right or to the per-son sitting opposite. Head orientations were estimated using a neuralnetwork. . . . . . . . . . . . . . . . . . . . . . . . . . . . . . . . . . . 56
5.2 a) The distribution p(x) of all head pan observations of one subject ina meeting. Also the adapted mixture of three Gaussians is plotted. b)True and estimated class-conditional distributions of head pan x forthe same subject, when he or she is looking to three different targets.The adapted Gaussians, are taken from the adapted Gaussian mix-ture model depicted in a). c) The posterior probability distributionsP (Focus|x) resulting from the found mixture of Gaussians. . . . . . 60

LIST OF FIGURES vii
5.3 A typical meeting scene captured with the panoramic camera. . . . . 61
5.4 Approximate locations of the participants around the table in therecorded meetings (viewed from top). . . . . . . . . . . . . . . . . . . 62
5.5 Perspective views of two participants. These views were used togetherwith the panoramic view of the scene to label at whom a participantwas looking. . . . . . . . . . . . . . . . . . . . . . . . . . . . . . . . . 62
5.6 Class-conditional distributions of horizontal head rotations of one sub-ject, when he or she is looking at four target persons at the table. Ahigh overlap of the distributions can be observed. . . . . . . . . . . . 66
6.1 a) Datacollection with eye and head tracking system during a meeting.b) A participant wearing the head-mounted eye and head trackingsystem. . . . . . . . . . . . . . . . . . . . . . . . . . . . . . . . . . . . 70
6.2 Plot of a subjects horizontal head orientation, eye orientation and over-all gaze direction in a meeting. Eye orientation is measured relativeto head orientation; i.e., the eye orientation within the eye sockets isindicated. The data was captured using an gaze tracking system fromIscan Inc [ISC. ]. . . . . . . . . . . . . . . . . . . . . . . . . . . . . . 71
6.3 Schematic view of head oriention ho, eye orientation eo and gaze di-rection los of a subject. . . . . . . . . . . . . . . . . . . . . . . . . . . 71
6.4 Histograms of horizontal gaze directions of two subjects. For bothsubjects three peaks in the distribution of gaze directions can be seen,which correspond to looking at the three other participants in themeeting. . . . . . . . . . . . . . . . . . . . . . . . . . . . . . . . . . . 73
6.5 a) The distribution of all head orientation observations p(x) from onesubject and the found mixture of Gaussians. b) The three componentsof the mixture of Gaussians are taken as class-conditional head pandistributions. c) the posterior probability distributions P (Focus|x)resulting from the found mixture of Gaussians. . . . . . . . . . . . . . 74
7.1 Neural net to predict focus target based on who is speaking. A se-quence of binary vectors describing who is speaking at a given momentis used as input. . . . . . . . . . . . . . . . . . . . . . . . . . . . . . . 83
7.2 Sound-based focus prediction results with different audio-history lengthsand different number of hidden units. . . . . . . . . . . . . . . . . . . 85

viii LIST OF FIGURES
8.1 The data collection setup at CMU (see text). . . . . . . . . . . . . . . 90
8.2 Pan estimation results on a user-independent test set from CMU.Shown are the results for networks trained from scratch with datafrom CMU and the results of the UKA-network when all weights wereadapted using the data from CMU. For both approaches, results usingimages from an increasing number of persons for training/adaptationare shown. . . . . . . . . . . . . . . . . . . . . . . . . . . . . . . . . . 92
8.3 Pan estimation results on a user-independent test set from CMU.Shown are the results with the adapted UKA-network. The lowercurve indicates the mean pan estimation errors when all weights wereadapted; the upper curve indicates the results when only the unit bi-ases of the network were adapted. . . . . . . . . . . . . . . . . . . . . 93
8.4 Adaption results when adapting all weights (a) or unit biases only (b).Shown are the average pan estimation errors for increasing numbersof training iterations and using images from an increasing number ofsubjects for adaptation. . . . . . . . . . . . . . . . . . . . . . . . . . 94
8.5 Accuracy of focus of attention detection on a meeting recorded atCMU. Both the upper limit and the result using unsupervised adap-tation of the model parameters is indicated for the different neuralnetworks (see text). . . . . . . . . . . . . . . . . . . . . . . . . . . . . 95
8.6 Accuracy of focus of attention detection on a second meeting recordedat CMU. Both the upper limit and the result using unsupervised adap-tation of the model parameters is indicated for the different neuralnetworks (see text). . . . . . . . . . . . . . . . . . . . . . . . . . . . . 96
9.1 A demonstration prototype system to show focus of attention awareinteraction with several appliances in a smart room. See text for details.100

List of Tables
4.1 Collected data to train and test networks. . . . . . . . . . . . . . . . 41
4.2 Head pose estimation accuracy from good resolution images on a multi-user test set and on two new users. Results for three different prepro-cessing methods are indicated: 1) using histogram-normalized imagesas input, 2) using edge images as input and 3) using both histogram-normalized and edge images as input. The results indicate the meanerror in degrees for pan/tilt. . . . . . . . . . . . . . . . . . . . . . . . 46
4.3 Average error in estimating head pan and tilt for two “room-dependent”networks and for a network trained on images from two rooms. . . . 48
4.4 Results on multi-user test sets, obtained when training and testingon images taken under different lighting conditions. Both histogram-normalized gray-scale image and edge images were used together asinput to the nets. . . . . . . . . . . . . . . . . . . . . . . . . . . . . . 49
4.5 User-independent results obtained when training and testing on imagestaken under different lighting conditions. Both histogram-normalizedgray-scale image and edge images were used together as input to thenets. . . . . . . . . . . . . . . . . . . . . . . . . . . . . . . . . . . . . 49
4.6 Pan estimation results when training with images from one room andtesting on images from another room with different illumination. Byusing some sample images from the new room for cross-evaluation,generalization is improved. Further improvement could be obtainedby also using artificially mirrored training images. . . . . . . . . . . . 50
4.7 Results for pan estimation using only histogram normalized images ofsize 36x54 pixels or using both histogram normalized and edge imagesof size 20x30 pixels as input. . . . . . . . . . . . . . . . . . . . . . . . 51
ix

x LIST OF TABLES
4.8 Multi-user results. The mean error in degrees of pan/tilt is shown.Three different types of input images were used. Training was done ontwelve users, testing on different images from the same twelve users. . 52
4.9 User independent results. The mean error in degrees of pan/tilt isshown. Three different types of input images were used. Training wasdone on twelve users, testing two new persons. . . . . . . . . . . . . . 53
4.10 Results using additional artificial training data. Results on the multi-user test set and on the two new users are shown for the differentpreprocessing approaches. The mean error in degrees of pan/tilt isshown. . . . . . . . . . . . . . . . . . . . . . . . . . . . . . . . . . . 53
4.11 Results obtained with good resolution facial images captured with apan-tilt-zoom camera and results with facial images obtained from theomni-directional camera. The mean difference from true head rotationin degrees is indicated. . . . . . . . . . . . . . . . . . . . . . . . . . 54
5.1 Overview of the recorded meetings used for evaluation. . . . . . . . . 61
5.2 Percentage of correct focus targets based on computing P (Focus|head pan)in meetings with four participants. . . . . . . . . . . . . . . . . . . . 63
5.3 Percentage of correct focus targets based on computing P (Focus|head pan)in the meetings with five participants. . . . . . . . . . . . . . . . . . . 64
5.4 Upper performance limits of focus of attention detection, given esti-mated head orientations. The percentage of correctly assigned focustargets using true class-conditionals of estimated head pan are indi-cated. Four subjects participated in each meeting. . . . . . . . . . . . 65
5.5 Upper performance limits of focus of attention detection from esti-mated head orientations with five meeting participants. Percentage ofcorrectly assigned focus targets using true class-conditionals of esti-mated head pan are indicated. . . . . . . . . . . . . . . . . . . . . . . 66
6.1 Eyeblinks and contribution of head orientation to the overall gaze. . . 72
6.2 Focus detection based on horizontal head orientation measurements. . 75
7.1 Table summarizes, how often subjects looked to participants in certaindirections, during the different speaking conditions (see text for furtherexplanation). . . . . . . . . . . . . . . . . . . . . . . . . . . . . . . . 79

LIST OF TABLES xi
7.2 Focus-prediction using sound only. Percentage of correct assigned fo-cus targets by computing P (Focus|Sound). a) Results with four partic-ipants in meetings A to D. b) Results with five participants (MeetingF and G). . . . . . . . . . . . . . . . . . . . . . . . . . . . . . . . . . 80
7.3 Focus-prediction using only head orientation, using only sound andprediction using both head orientation and sound. . . . . . . . . . . 82
7.4 Focus-prediction using twenty frames of speaker information. Neuralnetworks were trained to predict P (Focus|At, At−1, ..., At−N). . . . . 84
7.5 Focus-prediction using only head orientation, only sound and predic-tion using both. Sound-based focus prediction is done with a neuralnetwork, using twenty frames of speaker information as input. Fourpersons participated in the meetings. . . . . . . . . . . . . . . . . . . 86

xii LIST OF TABLES

Chapter 1
Introduction
Interaction with computers has for many years been dominated by the classical WIMP(Windows, Icons, Menus, Pointers) paradigm: users still typically interact with adesktop computer through graphical user interfaces, by pointing, typing and clicking.Moreover, interaction usually happens between one user and one computer at a time,and the user must intentionally perform various actions – such as pointing, typing –to accomplish the specific task that he has in mind.
In recent years many researchers have devoted substantial effort to investigating howcomputers can be used more efficiently to support users during various tasks andactivities in their everyday lives without requiring them to attentively control specificcomputers or devices.
Black et al., for example, described their efforts to build a “digital office”[Black et al. ’98]. Their goal was to remove the barrier between physical and elec-tronic objects and to facilitate the interaction of humans with all kinds of documentsin an office. They have thus augmented a physical office with cameras to scan doc-uments on a desk and to capture a person’s notes from a whiteboard. Cameras arealso used to track a user’s gestures and to enable gesture-driven interaction with acomputer-supported whiteboard.
Mozer et al. have built an “adaptive house” which automatically adapts to its inhab-itants’ needs [Mozer ’98]. They have equipped a real house with infrared sensors todetect the locations of the inhabitants and have also used various sensors to measureheating, whether doors are open or whether lights are switched on or off. The inputfrom all sensors is then used to learn the inhabitants’ preferences and to automat-ically adjust lighting and heating in the house accordingly. The house for example“learns” at what time the heating has to be at a comfortable level and during which
1

2 Chapter 1 Introduction
periods the temperature can be lowered because the inhabitants are usually at work.The house also automatically learns when to switch on the room lights.
Abowd et al. [Abowd et al. ’96] have presented an “intelligent classroom” which pro-vides technology and tools to support teachers and students during lectures and alsofacilitates retrieval of recorded lectures. Their classroom is equipped with electronicwhiteboards, pen-based personal interfaces for the students and projectors to displaythe presenter’s notes and related information from web pages. The room also has mi-crophones and video cameras to record the lectures. During a lecture, the presenter’shand written notes, audio and video are automatically captured. In addition, eachstudent is provided with a pen-based PC to record his own personal notes. After-wards, the video documentation, the presenter’s slides and his hand-written notes areautomatically made available online as a multimedia document. Students can browsethrough the document using a special web-interface. They can search for certaintopics, watch the corresponding slides and the presenter’s handwritten annotationsor they can look at the relevant parts in the video of the lecture.
At Microsoft Research, the “Easy Living Project” [Brumitt et al. 2000b] is concernedwith the development of architectures and technologies for intelligent environments.These researchers have built a living room which automatically tracks the location of auser and provides the information or service that a user requests through appropriatedevices in the proximity of the user. They have also investigated various multimodalinteraction techniques to control the room lights, for example [Brumitt et al. 2000a].
In order to make such intelligent and interactive environments respond appropriatelyto users’ needs, it is necessary to equip them with perceptive capabilities to captureas much relevant information about its users and the context in which they act aspossible. Such information includes: detecting the number and locations of usersin the room, their identities, facial expressions, body movements, the users’ speech,their gaze direction and their focus of attention.
Obtaining knowledge about a person’s focus of attention is a major step towards abetter understanding of what users do, how and with what or whom they interact orto what they refer.
For instance, in a smart interactive environment, which incorporates appliances thatrespond to a user’s speech, knowing where users look is essential to determine whichappliance they address when talking. Even more importantly, such information canbe used to detect whether any of the speech-enabled appliances is addressed at all,or whether a subject was talking to another person in the room, in which case noneof the appliances need to react. We certainly don’t want our VCRs to start recordingor the room lights to react whenever we talk to other persons in our living room.

1.1 Focus of Attention Tracking in Meetings 3
Focus of attention tracking could be especially useful in cars. Here, monitoring wheredrivers look could, for example, be used to determine whether they are aware of eventson the street, whether they checked the rear-view mirrors before over-taking anothercar, or whether they have recently checked their speed indicator. In cases when adriver is apparently unaware of something important, an intelligent car could thennotify the driver about these things.
1.1 Focus of Attention Tracking in Meetings
This thesis focuses on the problem of tracking focus of attention in meetings.
Having meetings is one of the most common activities in business. It is impossible,however, for people to attend all relevant meetings or to retain all the salient pointsraised in meetings they do attend. Protocols, notes and summaries of meetings areused to develop a corporate memory that overcomes these problems.
Hand recorded notes, however, have many drawbacks. Note-taking is time consuming,requires focus, and thus reduces one’s attention to and participation in the ensuingdiscussions. For this reason notes tend to be fragmentary and partially summarized,leaving one unsure exactly what was resolved, and why. Recalling all details oncertain topics of a meeting is therefore impossible from such hand-written notes. Inaddition, meeting notes tend to be biased by the minute taker’s understanding of themeeting. And finally, non-verbal and social cues, which often are essential for a goodunderstanding of the meeting, are often completely missing in such notes.
In order to provide really useful meeting records, as many of the modalities thathumans use during interaction should be captured and analyzed as possible. Thesemodalities include speech, gestures, emotions and body language.
Furthermore, the context in which the meeting took place has to be provided for adetailed meeting record. To fully understand the dynamics of a meeting, meetingrecords should provide details such as:
• Who participated in the meeting?
• When did the meeting take place?
• What were the topics of the meeting?
• What was said?
• Who said what and to whom?

4 Chapter 1 Introduction
• What was the social setting and the relationship of the participants? Was it abusiness meeting or an informal interaction between friends?
To analyze meetings with regard to these questions, a number of technologies areneeded. These include speech recognition, dialogue processing, text summarization,person tracking and identification, and gesture recognition.
Visual communication cues, such as gesturing, looking at another person or monitor-ing his facial expressions, play an important role during face-to-face communication[Argyle ’69, Goodwin ’81]. Therefore, to fully understand an ongoing conversation,it is necessary to capture and analyze these visual cues in addition to spoken content.Knowing who is looking at whom at a certain moment in a meeting, can help us, forexample, to understand to whom the participants are paying attention and whom aspeaker does address.
At the Interactive Systems Lab at the Universitat Karlsruhe and at Carnegie Mel-lon University in Pittsburgh, we are developing an intelligent meeting room toautomatically capture and transcribe meetings.
The goal of this project is to develop a meeting room that eventually will identifywhen a meeting begins, start capturing and analyzing the meeting and create ameeting record with information about who was in the meeting, what was said, etc.Users should be able to use the meeting room as if it were a normal meeting room,and the technology used to capture meetings and extract information should be asnon-intrusive to the users as possible.
To capture the necessary audio and video streams we have equipped our meeting roomwith a number of lapel microphones, pan-tilt-zoom cameras and an omni-directionalcamera on the meeting table. Figure 1.1 shows an image that was taken duringa meeting in our meeting room at Carnegie Mellon University. On the table theomni-directional camera can be seen; in the back, one of the pan-tilt-zoom camerasis located.
In the project the following research issues are currently addressed.
Speech Recognition Speech recognition is needed to transcribe what the partic-ipants say during the meetings. Speech recognition in meetings is a partic-ularly challenging task. Difficulties include the conversational speaking stylethat tends to be observed in meetings; the usually high specialization of topics,which make collection of appropriate training data difficult, and the degradedrecording conditions, in which cross-talk and background-noise are prevalent[Waibel et al. 2001b].

1.1 Focus of Attention Tracking in Meetings 5
Figure 1.1: Image taken in the meeting room.
Dialogue Analysis The idea of dialogue analysis in the meeting room context isto use features other than keywords for information access to spoken infor-mation. Features like speaking style or speaker dominance have proven tobe helpful for information retrieval in meeting minutes and provide relevantinformation, which can easily be visualized when browsing through meetingtranscripts [Waibel et al. 2001a, Ries & Waibel 2001].
Text Summarization This module provides a relevance ranked list of sentencesfrom a given meeting. Thus, the most relevant passages of a meeting can bedisplayed, which gives the user a good quick overview of a meeting’s content.
Detecting Emotions
Person Tracking Detecting and tracking participants and their faces in the roomis a prerequisite for tasks such as face recognition, facial expression recognition,audio-visual speech recognition and focus of attention tracking.
Face- and speaker identification Identification of the participants based on theirface and their voice is necessary in order to know who participated in themeeting and who said what.
Focus of attention tracking
The Meeting Browser An important part of meeting recognition is the ability toefficiently capture, manipulate and review all aspects of a meeting. The meeting
6 Chapter 1 Introduction
browser has been developed [Bett et al. 2000, Waibel et al. ’98] to that end.It comprises the individual components to analyze meetings, facilitates rapidaccess to captured meetings, allows easy browsing through meeting transcriptsand facilitates the retrieval of relevant parts of a meeting.
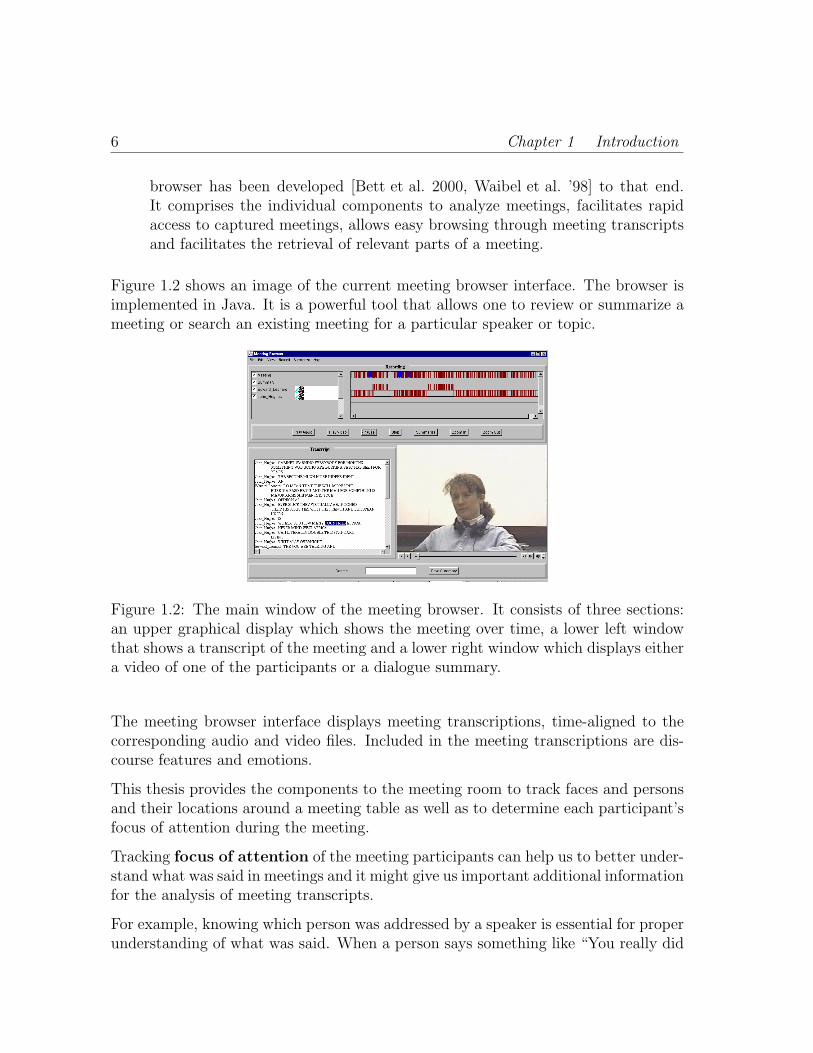
Figure 1.2 shows an image of the current meeting browser interface. The browser isimplemented in Java. It is a powerful tool that allows one to review or summarize ameeting or search an existing meeting for a particular speaker or topic.
Figure 1.2: The main window of the meeting browser. It consists of three sections:an upper graphical display which shows the meeting over time, a lower left windowthat shows a transcript of the meeting and a lower right window which displays eithera video of one of the participants or a dialogue summary.
The meeting browser interface displays meeting transcriptions, time-aligned to thecorresponding audio and video files. Included in the meeting transcriptions are dis-course features and emotions.
This thesis provides the components to the meeting room to track faces and personsand their locations around a meeting table as well as to determine each participant’sfocus of attention during the meeting.
Tracking focus of attention of the meeting participants can help us to better under-stand what was said in meetings and it might give us important additional informationfor the analysis of meeting transcripts.
For example, knowing which person was addressed by a speaker is essential for properunderstanding of what was said. When a person says something like “You really did

1.2 Approach 7
a great job!” it is important to know which of the participants was addressed by thespeaker.
Information about the focus of attention of participants can also be used for indexingand retrieval of parts of the meeting. Together with components for person andspeaker identification [Yang et al. ’99, Gross et al. 2000], queries such as “Show meall parts when John was telling Mary something about the multimedia project.”become possible.
We believe that focus of attention tracking can furthermore be used to measure howactively certain participants followed ongoing discussions. This could for instance bedone by counting how often they contributed to the discussion by saying something,by measuring how often the participants looked at the speakers or by monitoringhow actively subjects looked at other participants in general. Counting how often aperson was looked at, for instance, could provide us some idea about who was in thecenter of attention during different periods of the meeting.
1.2 Approach
A body of research literature suggests that humans are generally interested in whatthey look at. This has for example been demonstrated in Yarbus’ classical experi-ments in which a subjects’ eye movements were tracked when they watched a painting[Yarbus ’67]. The close relationship between gaze and attention during social interac-tion has further been investigated by [Argyle ’69, Argyle & Cook ’76, Emery 2000].User studies, in addition, recently reported strong evidence that people naturallylook at objects or devices with which they are interacting [Maglio et al. 2000,Brumitt et al. 2000a]. This close relationship of gaze and attention will be discussedin more detail in Chapter 2.
A first step in determining someone’s focus of attention, therefore is, to find out inwhich direction the person looks. There are two contributing factors in the formationof where a person looks: head orientation and eye orientation. In this studyhead orientation is considered as a sufficient cue to detect a person’s direction ofattention. Relevant psychological literature offers a number of convincing argumentsfor this approach (see Chapter 2) and the feasibility of this approach is demonstratedexperimentally in this thesis.
We conducted an experiment which aimed at evaluating the potential of head orienta-tion estimation in detecting who is looking at whom in meetings. In the experimenthead orientation and eye gaze were captured using special high accuracy trackingequipment. The experimental results show that head orientation contributes 69% on

8 Chapter 1 Introduction
average to the overall gaze direction, and focus of attention estimation based on headorientation alone can achieve an average accuracy of 89% in a meeting applicationscenario with four participants.
A practical reason to use head orientation to estimate a person’s focus of attentionis that in scenarios such as those addressed in this thesis, head orientation can beestimated with non-intrusive methods while eye orientation can not. Although havingpeople wear special equipment to track their eye gaze might be acceptable for user-studies or one-time occasions, it is certainly not acceptable during every day use ina meeting room. Certainly users would not want to wear head-mounted equipment,calibrate eye-gaze trackers each time they use the meeting room, or sit at fixedlocations in front of the tracking hardware.
Detecting a person’s head orientation, however, as this thesis will show, can be donewith cameras and from a distance, even when participants are moving and when thecamera resolution is low.
To map a person’s head orientation onto the focused object in the scene, a model ofthe scene and the interesting objects in it is needed. In the case of a meeting scenario,clearly the participants around the table are likely targets of interest. Therefore, ourapproach to tracking at whom a participant is looking is the following:
1. Detect all participants in the scene
2. Estimate each participant’s head orientation
3. Map each estimated head orientation to its likely targets using a probabilisticframework.
Compared to directly classifying a person’s focus of attention target – based onimages of the person’s face, for example – our approach has the advantage thatdifferent numbers and positions of participants in the meeting can be handled. Ifthe problem were treated as a multi-class classification problem, and a classifier suchas a neural network were trained to directly learn the focus of attention target fromthe facial images of a user, then the number of possible focus targets would have tobe known in advance. Furthermore, with such an approach it would be difficult tohandle situations where participants sit at different locations than they were sittingduring collection of the training data.
In our system, an omni-directional camera is used to capture the scene around ameeting table. Participants are detected and tracked in the panoramic image usinga real-time face tracker. Furthermore, neural networks are used to compute headpose of each person simultaneously from the panoramic image.

1.2 Approach 9
A Bayesian approach is then used to estimate a person’s focus of attention from thecomputed head orientation. With the proposed model, the a-posteriori probabilitythat a person is looking at a certain target, given the observed head pose, is estimated.Using this approach, we have achieved an average accuracy of 73% in detecting theparticipants’ focus of attention on several recorded meetings with four participants.In the experiments, each subject’s focus of attention target could be one of the otherthree participants at the table.
Our approach to determine focus of attention is of course not perfect. Since eye gazeis neglected in our approach, a certain amount of error is introduced. The noisyestimation of head orientations from camera images introduces additional errors.
To improve the robustness of focus of attention tracking, we therefore would like tocombine various sources of information. Attention is clearly influenced by externalstimuli, such as noises, movements or speech of the other persons. Monitoring andusing such cues might therefore help us to bias certain targets of interests againstothers.
Information about who is currently talking in a meeting clearly could be useful for theprediction of to whom people are attending. It seems intuitive that participants tendto look at the speaker. Argyle, for instance, pointed out that listeners use glancesto signal continued attention, and that gaze patterns of speakers and listeners areclosely linked to the words spoken [Argyle & Cook ’76].
We have found that focus of attention is correlated to who is speaking in a meeting andthat it is possible to estimate a person’s focus of attention based on the informationof who is talking at or before a given moment. To estimate where a person is looking,based on who is speaking, probability distributions of where participants are lookingduring certain “speaking constellations” are used. On recorded meetings with fourparticipants we could achieve 56% accuracy in predicting the participants’ focus ofattention based on who is speaking.
The accuracy of sound-based prediction of focus of attention can furthermore signif-icantly be improved by taking a history of speaker constellations into account. Wehave trained neural networks to predict focus of attention based on who was speakingduring a short period of time. Using this approach, sound-based prediction could beincreased from 56% to 66% accuracy on the recorded meetings.
Finally, the head pose based and the sound-based estimations are combined to obtaina multimodal estimate of the participants’ focus of attention. By using both headpose and sound, we have achieved 76% accuracy in detecting the participants’ focusof attention on the recorded meetings.
10 Chapter 1 Introduction
The system for focus of attention detection in meetings which is presented in thisthesis has been successfully installed in both our labs at the Universitat Karlsruhe,Germany and at Carnegie Mellon University in Pittsburgh, USA. A problem whenporting the system to a new location is the need for appropriate training images forthe neural network based approach to head orientation estimation. We therefore alsoinvestigated how much training data is necessary to port the system to a new location.We furthermore show how a network for head orientation estimation that was trainedwith images from one location (Karlsruhe) can be used in a new location (CMU) withnew illumination conditions. This is done by adapting the network with a numberof training images taken in the new location. In our experiments, new images fromonly four subjects were necessary for the adaptation of the neural network for and toachieve good focus of attention detection accuracy in the new location.
Focus of attention tracking could be also greatly beneficial for a number of otherapplications than analyzing meetings. To show how focus of attention tracking canbe used for multimodal context-aware interaction in a smart environment, we havebuilt a prototype system in which a subject can interact with a simulated householdrobot or a speech-enabled VCR in a room. In the demonstration system, we used thecomponents developed for focus of attention tracking to determine whether a userwas addressing the robot, the VCR or whether the user was just talking to otherpeople in the room.
1.3 Outline
This thesis is organized as follows: In Chapter 2 we discuss relevant literatureconcerning human attention, the relationship of gaze and attention and the perceptionof attention during social interaction. We also review state of the art techniques foreye-gaze tracking and head pose estimation.
Chapter 3 provides details about the skin-color based face tracking approach used inthis work. We also describe how meeting participants can be simultaneously trackedusing an omni-directional camera to capture the scene.
In Chapter 4 we describe our approach to estimating head orientation with neuralnetworks. We describe the data collection, the neural network architecture employed,different pre-processing methods that we investigated, and we provide experimentalresults.
In Chapter 5 we present a probabilistic approach for determining at which targeta person is looking, based on his or her head orientation. We discuss how the model

1.3 Outline 11
parameters can be adapted to different numbers and locations of meeting participantsand provide experimental results on a number of recorded meetings.
In Chapter 6 we present a user study investigating how reliably focus of attentioncan be estimated based on head orientation alone in meetings. Two questions wereaddressed in this experiment: 1) How much does head orientation contribute to gaze?2) How reliably can we predict at whom the person was looking, based on his headorientation? To answer these questions, we have captured and analyzed gaze andhead orientations of four people in meetings using special hardware equipment.
Chapter 7 suggests that focus of attention tracking could benefit from also track-ing other relevant cues such as sound or movements. We specifically investigatewhether focus of attention can be predicted based on who is speaking. We showthat information about who is speaking is indeed a reliable cue for predicting theparticipant’s focus. We present an approach to predict focus based on a sequence ofaudio-observations using a neural network. We also present experimental results in-dicating that the combination of sound-based focus of attention prediction and focusof attention estimation based on the subjects’ head orientation leads to better resultsthan using only one modality for focus estimation.
In Chapter 8 we discuss how the presented system for focus of attention trackingcan be installed in a new location. We explore how a neural network for head panestimation can be adapted to work under new conditions by using some adaptationdata collected in the new location. We examine how much adaptation data is nec-essary to obtain reasonable performance and compare the adaptation results to theresults obtained with neural networks that are trained from scratch with the newdata.
In Chapter 9 a prototype system to demonstrate how focus of attention can beused to improve human-computer interaction is presented. In the demonstrationenvironment, a subject can interact with a simulated household robot, a speech-enabled VCR or with other people in the room, and the recipient of the subject’sspeech is disambiguated using the focus of attention tracking components developedin this work.
Finally, Chapter 10 summarizes the main contributions of this work and concludeswith a discussion of limitations and future work.

12 Chapter 1 Introduction

Chapter 2
Background and Related Work
2.1 Human Attention
“Every one knows what attention is. It is the taking possession by themind, in a clear and vivid form of one out of what seem several simultane-ously possible objects or trains of thought. Focalization, concentration ofconsciousness are of its essence. It implies withdrawal from some thingsin order to deal effectively with others [...].” (William James)
This is how of William James, one of the most influential psychologists at the turnof the century defined attention in his major work, The principles of Psychology[James 1890/1981].
According to the Encyclopedia Britannica, attention can be defined as “the concen-tration of awareness on some phenomenon to the exclusion of other stimuli”. It isthe awareness of the here and now in a focal and perceptive way [Enc 2002].
While at first sight it might be expected that an individual is aware of all the eventsat a given moment, this is clearly not the case. Individuals focus upon – or attendto – a limited subset of the sensory information available at a given moment.
It is assumed that the reason for limited awareness is the limited processing capacityof the brain: we simply cannot consciously experience and process all the informationavailable at a given time. In the primate visual system, for instance, the amount ofinformation coming down the optical nerve is estimated to be on the order of 108
bits per second. This far exceeds what the brain is capable of fully processing andassimilating into conscious experience. Attention can be understood as a condition
13

14 Chapter 2 Background and Related Work
of selective awareness. It is a strategy to deal with this processing bottleneck by onlyselecting portions of the input to be processed preferentially.
Attention has been a topic of study and scientific debate in experimental psychologyfor more than a hundred years. Psychologists began to emphasize attention in thelate 19th century and early 20th century.
Wilhelm Wundt was among the first to point out the the distinction between the focaland the more general features of human awareness. He used the term “Blickfeld” todescribe the wide field of awareness, within which lay the more limited focus ofattention, the “Blickpunkt”. He suggested that the range of the “Blickpunkt” wasabout six items [Enc 2002].
During the 20th century, several theories about the selective function of attentionwere developed.
In an influential work, Broadbent [Broadbent ’58] postulated that the many signalsentering the central nervous system are analyzed by the brain for certain featuressuch as their location in space, their tonal quality, their size, their color, or otherphysical properties. These signals then pass through a filter that allows only thosesignals with appropriate, selected properties to proceed for further analysis.
Shiffrin and Schneider [Shiffrin & Schneider ’77] (cf. [Enc 2002]) later formulated a“two-process” theory of attention. They distinguish between two modes of infor-mation processing: Controlled search and automatic detection. Controlled searchdemands high attentional capacity and is under the individual’s control. By con-trast, automatic detection comes into operation without active control or attentionby the individual and it is difficult to suppress.
Most researchers now agree that the attention selection mechanism consists of twoindependent stages: an early preattentive stage, that operates without capacitylimitation and in parallel across the entire visual field, followed by a later atten-tive stage, that can only deal with one to few items at a time [Theeuwes ’93] (cf.[Glenstrup & Engell-Nielsen ’95]).
The attentive selection process is however not a purely bottom-up process. Variousstudies indicate that visual attention can be controlled to focus on smaller areas of thevisual field [LaBerge ’83], [Eriksen & Yeh ’85] (cf. [Glenstrup & Engell-Nielsen ’95]).It is suggested that attention can be varied like a spotlight across the visual field, andthat the spotlight “enhances the efficiency of detection of events within its beam”[Posner et al. ’80] (cf. [Glenstrup & Engell-Nielsen ’95]).
A good example for the willful (top-down) control of (audio-visual) attention is the“Cocktail-Party phenomenon”. Cherry [Cherry ’57] (cf. [Gopher ’90]) described in a

2.1 Human Attention 15
series of experiment the perceived clarity and intensity for a person standing in onecorner of the room, of a conversation taking place at another remote corner, but ofhigh interest to him. This is the work of focused attention that seems to override themuch louder vocalizations of surrounding parties and his own discussion partner.
Both modes of the selection process – bottom-up, preattentive selection of salientfeature, and top-down control of visual attention – can happen at the same time.Visual stimuli can be willfully brought into the focus of attention, or they win thepreattentive selection process [Itti & Koch 2000].
2.1.1 Computational models of attention
With the advance of computer technology and artificial intelligence, there is a grow-ing interest in computational models of attention. Especially models of the visualattention system have been investigated.
Itti et al. [Itti et al. ’98, Itti & Koch 2000] presented a bottom-up model for thecontrol of visual attention based on saliency maps. A saliency map encodes earlyvisual features such as color, intensity or orientation. In their model, the maximumin the saliency map is taken as the most salient stimulus and as a consequence, focusof attention is directed to this location. After inspection of one location, this locationand its neighbors are “inhibited” in the saliency map and visual search proceeds tothe next most salient point in the map. The idea of a saliency map to accomplishpreattentive selection was first introduced by Koch and Ullman [Koch & Ullman ’85]
Rao et al. [Rao et al. ’95] proposed a model for saccadic targeting during a searchtask which combines bottom-up and top-down information. Their model uses iconicscene representations derived from spatial filters at various scales. Objects of interestto a search task are represented by a set of feature vectors, derived from the spatialfilters. Visual search proceeds in a coarse-to-fine manner by finding the closest corre-spondence of the object of interest and the saliency image at each scale of the filters.And at each scale a saccade is directed to the closest match of the saliency mapand the object representation. They report good agreement between eye movementspredicted by their model and those recorded from human subjects.
Computational models of attention are also used to control gaze, visual search andorienting behaviours of robots.
Adams et al. [Adams et al. 2000], for instance, give an overview of the humanoidrobot project COG, which aims at developing robots that can behave like and interactwith humans. To control a robot’s visual attention, they have implemented a model ofvisual search and attention, which was proposed by Wolfe [Wolfe ’94]. The attentional

16 Chapter 2 Background and Related Work
model combines color, motion and face detectors with a habituation function toproduce an attention activation map. The attention process influences gaze controland the robot’s internal behavioural state, which in turn influences the feature-mapcombination.
2.2 Where We Look Is Where We Attend To
Research literature suggest that humans are generally interested in what they lookat.
Barber and Legge [Barber & Legge ’76] (cf. [Glenstrup & Engell-Nielsen ’95]), forexample, carried out an experiment in which the they asked a group of subjects totell what the most informative parts of pictures were. Then they tracked eye-gaze ofanother group of subjects regarding the same pictures. They concluded that therewas good agreement between what was considered informative and what was lookedat most often.
Similar conclusion can be drawn from Yarbus’ classical experiments [Yarbus ’67], inwhich eye movements are tracked as a subject responds to questions about a paintedscene he watches. His experiments showed that the visual investigation of a complexscene involves complicated patterns of fixations, where the eye is held fairly still,and saccades, where the eyes move to foveate a new part of the scene, which is thenattended to. The experiments also showed that the subject’s eye movement patternswere highly dependent on the different tasks the subject tried to solve. It seems areasonable explanation, that the different observed fixation patterns were due the thedifferent information the subject was trying to find in the scene.
The human’s eye has its highest acuity in the region of the fovea. This region ap-proximately covers a visual angle of 2 degrees and is used by humans to make de-tailed observations of the world. The remaining part of the retina offers peripheralvision, which has only about 15-50% of the acuity of the retina, it is less color-sensitive but is more reactive to flashing objects and sudden movements [Jacob ’95](cf. [Glenstrup & Engell-Nielsen ’95]). Since the fovea covers only such a small area,eye movements are necessary to capture details of our surroundings.
The movement of the eyes to a new location is performed by executing a saccade.Saccades are sudden rapid movement of the eyes, which are completed between 30-120ms after initiation. Saccades can be volutarily initiated, but are ballistic; i.e.,once they are initiated, their path and target location cannot be changed. Duringsaccades, processing of the visual image is suppressed. Thus, visual processing takes

2.2 Where We Look Is Where We Attend To 17
Figure 2.1: Seven records of eye movements by the same subject. Each record lasted3 minutes. 1) Free examination. Before subsequent recordings, the subject was askedto: 2) estimate the material circumstances of the family; 3) give the ages of the people;4) surmise what the family had been doing before the arrival of the “unexpectedvisitor;” 5) remember the clothes worn by the people; 6) remember the position ofthe people and objects in the room; 7) estimate how long the “unexpected visitor” hadbeen away from the family (from [Yarbus ’67], cf. [Glenstrup & Engell-Nielsen ’95]).

18 Chapter 2 Background and Related Work
place between the saccades, the so called fixations, that last for about 200-600ms[Glenstrup & Engell-Nielsen ’95].
Researchers have started to use human eye movements to build new human-computer interfaces. Applications include eye controlled interfaces for the disabled[Hutchinson et al. ’89], eye gaze word processors [Frey et al. ’90] and missile guidingsystems. In such interfaces, users can either make use of intentional, manipulatoryeye-gaze, or the user’s natural eye movements are used, for example when he or sheis scanning a screen [Jacob ’95] (cf. [Salvucci ’99]).
One problem when building interfaces using eye gaze is the difficulty of interpretingeye movement patterns. Raw eye-gaze data does not describe what we think welook at. This is caused by the unconscious eye movements such as saccades andmicro-saccades, or due to gaze tracking failure, for example when the user blinked.
The problem of interpreting the raw eye movement patterns has been addressedby a number of researchers. Jacob [Jacob ’93] accessed this problem by expectinga series of fixations separated by saccades and trying to fit the raw data to thismodel. Another approach to interpret eye gaze data has been proposed by Salvucci[Salvucci ’99]. In his fixation tracing approach, hidden Markov models are used tomap raw eye movements to a cognitive process model. He reports good interpretationresults in an eye typing study.
Recent user studies report strong evidence that people naturally look at objects ordevices they are interacting with.
Maglio et al., for instance, investigated how people use speech and gaze when inter-acting with an “office of the future”. In their experiment, they used a Wizard-Of-Ozdesign, where the subjects could interact with speech-understanding office applica-tions, such as a Calendar, a Map and an address book which were represented asdifferent futuristic looking screen displays. They found that subjects nearly alwayslooked at the addressed device before making a request [Maglio et al. 2000]. Fur-thermore they concluded that in their study gaze information alone was sufficient todisambiguate the addressed devices 98% of the time.
Similar results are reported for example by Brumitt et al. [Brumitt et al. 2000a].They investigated different interfaces to control lights in a living room. In theirstudy people were able to control the lights in the “Easy Living Lab”, a mock upof a small living room, using various non-traditional mechanisms, such as controllingthem by speech, speech and gesture, touching or using a wall display. Apart fromreporting that people preferred to use their voice to control the lights, they reportthat subjects typically looked at the lights they wanted to control. Only in 9% ofthe investigated tasks, people never looked at the light they were controlling for any

2.3 Gaze and Attention During Social Interaction 19
commands they issued. In 25% of the tasks, people looked at the light during someof their commands, and in the remaining 66% people always looked at the light theywanted to control [Brumitt et al. 2000a]. They conclude that finding out the placein a room where someone is looking would be the most useful “gesture” to recognizein conjunction with speech recognition.
2.3 Gaze and Attention During Social Interaction
An important ability of humans and other primates is the ability to monitor whereother individuals look. This can signal where they are currently attending, it mightsignal sources of possible interest or of immediate danger.
In the primate literature, there is for instance much evidence suggesting that someprimates use gaze to convey information about their intentions. Baboons and vervetsfor example, use quick glances between an aggressor and a potential helper to gainsupport from the potential helper. It is also assumed that primates are using gazeto influence the behavior of a human care-giver. Some experiments with monkeysshowed evidence that these monkeys link gaze of the human experimenter with hisintentional actions [Emery 2000].
The detection of another’s gaze is also important to establish joint attention, which iscritical for learning and language acquisition. The age at which an infant first followsanother’s gaze is controversial, ranging from 6 to 18 months of age [Emery 2000].Before they are 12 months old, human infants can follow their mother’s gaze, butcannot direct their attention to the object of her attention and at around 12 monthsof age, they begin to follow their mother’s gaze towards particular objects in theirvisual field [Emery 2000].
Joint attention may especially be important for language learning in human infants.An early stage in language development is the process of associating a word with thephysical presence of an object. This stage of learning is difficult to achieve withoutthe ability to follow gaze. By following a speaker’s line of regard, the infant candetermine the intended referent of a new word [Baldwin ’91].
The close relationship of a person’s gaze and his or her direction of attention dur-ing social interaction has long been emphasized. In an extensive study, Argylediscriminates between a number of different functions of gaze during conversations[Argyle ’69, Argyle & Cook ’76]:
Gaze as signal and channel Gaze not only serves as a signal, but also to open andclose the visual channel itself; i.e., in order to monitor someone’s visual signals,

20 Chapter 2 Background and Related Work
one first has to point his gaze towards him. During conversations, speakers lookup to get feedback from their audience, and listeners look at the speakers tostudy their facial expressions and their direction of gaze.
Gaze to signal interpersonal attitudes One of the roles of gaze is the signalingof interpersonal attitudes, such as liking, hostility and emotions, such as shame,embarrassment or sorrow. Studies provided evidence that people look more atthose they like [Exine & Winter ’66], and – with some exceptions – people wholook more create a more favorable impression and are liked more.
Dominance and leadership Gaze is related to dominance and leadership duringinteractions. During communication between two people, people looked moreat people of higher status. In addition, persons giving good arguments in groupdiscussion are both looked at more, and are rated higher on leadership qualities[Burroughs et al. ’73].
Gaze and speech There is evidence that gaze patterns of speakers and listeners areclosely linked to the words spoken, and are also important in handling timingand synchronization of utterances: glances of the speaker are used as grammati-cal breaks, to emphasize particular words or phrases and gaze sometimes is usedto pass the word to the next speaker. On the other side, listeners use glancesto signal continued attention, to reinforce particular points and to encouragethe speaker or to indicate surprise, disbelief or anger.
Gaze as a signal of attention The most basic meaning of gaze during interactionis as a signal of attention: a person looking at another person signals, that hisvisual channel is open and that he is paying attention. People who look more areperceived as more attentive and for example looking down during a conversationis interpreted as a sign of inattention [J.W.Tankard ’70]. In addition studiesprove that it is considered polite to look at people when interacting with them[Kleinke et al. ’73].
Similar results are reported by Ruusuvuori [Ruusuvuori 2001]. They studied thecoordination of patients’ production of their complaint and the doctors’ orientationto the patient on the one hand and to medical records on the other. In this studyit is suggested that disengaging from interaction by orienting towards the medicalrecords may leave the patient puzzled about whether the doctor is listening or not.
Vertegaal et al. [Vertegaal et al. 2001] investigated the relationship of where peoplelook and whom they attend to during multi-party conversations. They found thatsubjects looked about 7 times more at the individual they listened to than at others,

2.4 Cues for the Perception of Gaze 21
and that subjects looked about 3 times more at individuals they spoke to. They con-clude that information about who is looking at whom is an ideal candidate to provideaddressee information and that it can also be used to predict to whom someone islistening.
2.4 Cues for the Perception of Gaze
The main cue in detecting where other individuals look at are the eyes. In fact,it is assumed that the morphology of the human eye, with its white sclera and thedark pupil, may have evolved to facilitate gaze perception, and thus to facilitate jointattention in our highly social species (cf. [Emery 2000]).
Although the eyes are the primary source for detecting a person’s direction of at-tention, the perception of another person’s direction of attention is not limited toinformation from the eyes alone.
Langton et al. suggest that in addition to gaze, there are also other cues, such ashead orientation, body posture and pointing gestures, which make a large contri-bution to the perception of another’s direction of attention [Langton et al. 2000,Langton 2000]. They report several experiments that demonstrate how head ori-entation influences the perception of gaze even when they eyes are clearly visible. Allthese experiments indicate that perception of gaze must be based on some combina-tion of information from the eyes and from head orientation.
Perret et al. [Perret & Emery ’94] have proposed a model based on neurophysiolog-ical research which describes how humans combine information from eye gaze, headorientation and body posture to determine where another individual is attendingto. In their model, information from gaze, head orientation and body posture arecombined hierarchically: direction-of-attention will be signaled by the eyes if theseare visible, but if they are obscured, or if the face is viewed at too great a distance,head orientation will be used to determine direction of attention. If informationfrom the eyes and the head are unavailable, attention direction is signaled by theorientation of the body. All theses cues are likely to be processed automatically byobservers and all make contributions to the perceptions of another person’s attention[Perret & Emery ’94].
The experiments by Langton however showed that even when the eyes are clearlyvisible, head orientation strongly influences the perception of gaze. This indicatesthat head orientation and eye gaze may be processed in parallel and play a moreequal role for the perception of attention direction. In fact, for children it seems thatprior to 14-18 months simply the head orientation is used as an attention-following cue

22 Chapter 2 Background and Related Work
and that eye-gaze is ignored [Langton et al. 2000]. He concludes that the orientationof the head makes a large contribution to the perception of another’s direction ofattention [Langton et al. 2000].
Several studies suggest that head orientation is in fact a sufficient indicator of atten-tion direction [Emery 2000, Argyle & Cook ’76, Cranach ’71]. Cranach [Cranach ’71]argued that gaze changes during social interaction are usually accompanied by headorientation changes. Argyle constitutes that this “implies that most lookers in ef-fect cooperate by making head movements, or other special expressive movementsaccompanying shifts of gaze” [Argyle & Cook ’76] (page 49).
2.5 Eye Gaze Tracking Techniques
There are a number of commercially available systems to track a person’s eye gaze.The different methods for eye gaze tracking can be classified into the following meth-ods [Glenstrup & Engell-Nielsen ’95, Calhoun & McMillan ’98]:
1. Electro-oculography. Measuring the electric potential of the skin aroundthe eyes. This technique is based on the existence of an electrostatic field thatrotates along with the eye.
2. Applying special contact lenses that facilitate tracking of the eye-ball. Thereare two lens techniques: a) engraving plane mirror surfaces on the lens thatfacilitate tracking and b) implanting a tiny induction coil into the lens. Thepositioning of the coil can be measured through the use of special magneticfields placed around the user’s head.
3. Measuring the reflectance of light – typically infrared light – that is directedonto the eye of the user.
Electrooculography (EOG) is based on the existence of an electrostatic field thatrotates with the eye. By detecting differences in the skin potential around the eyes,the position of the eye can be detected [Gips et al. ’93]. To measure the potentialdifferences, electrodes have to be placed around the subject’s eyes, which makes thismethod quite intrusive. According to [Calhoun & McMillan ’98] there are howeversome problems associated with this technique, such as varying skin resistance overtime and potential changes due to lighting adaption of the eye, which make thismethod unlikely to work robustly outside the lab.

2.5 Eye Gaze Tracking Techniques 23
Since for the methods of type 2 the user has to wear special contact lenses, thepractical use of such methods in out-of-the lab scenarios is very limited.
Several commercially available systems use infrared light that is shone into the user’seye. The resulting reflections occurring on the lens and the cornea of the eye, theso-called Purkinje images, can be used to compute the user’s eye gaze.
Other vision-based approaches aim at measuring eye gaze by detecting certain fea-tures of the eye in the image, such as the boundary and center of the pupil and thecorners of the eye. Eye gaze is then computed by estimating the rotation of theeye-ball based on the detected features.
A different eye-gaze tracking technique was proposes by Baluja and Pomerleau[Baluja & Pomerleau ’94]. In their system, eye-gaze was estimated with artificialneural networks based on low-resolution images of the user’s eyes. They used astationary light in front of the user and the system started by finding the user’s eyeby searching the image for the reflection of this light. In [Stiefelhagen et al. ’97c] asimilar neural network based approach was described, which did not require speciallighting.
A main technical problem associated with these vision based approaches is the acqui-sition of stable frontal images of the user’s eyes with good image resolution. Therefore,head-mounted cameras tend to be used, or the user has to be in more or less fixedposition with regard to the camera, so that tracking of the eyes is possible. Other dis-advantages of these methods are that they are very sensitive to illumination changesand placement of tracking components.
Some available commercial head mounted eye-gaze tracking systems are depicted inFigure 2.2. Using such head mounted eye-gaze trackers eye-gaze can even be measuredwhen a user is moving his head.
Figure 2.3 shows pictures of a few eye-gaze trackers that do not require head mountedcameras. With such systems, the user’s head movements are however very restrictedsince eyes have to stay within the view of the camera. With ASL’s eye-gaze trackerModel 504, which is depicted leftmost in Figure 2.3, head movement for instance isrestricted to one square foot according to the specifications of that system [ASL ].
Figure 2.4 shows typical eye images used in commercial eye tracking systems. It isclear that such high-resolution images are difficult to obtain without precise controlof the user’s position with respect to the camera.
To summarize: Eye gaze tracking systems of the kind available today are not accept-able to be used in a meeting room. While they are able to monitor a person’s eyegaze with high accuracy at high sampling rates, none of them can be used to track

24 Chapter 2 Background and Related Work
ASL Model 501 [ASL ] Eyelink II by SR Research [SRR ]SMI’s 3D-VOG system [SMI ]
Figure 2.2: Some commercial head mounted eye gaze trackers.
ASL Model 504 [ASL ] LC Technologies’ system [LCT ] Arrington’s system [ARR ]
Figure 2.3: Remote eye-gaze tracking systems.
a person’s eye gaze without carefully controlling the seating of the user with respectto the tracking system or without having the user wear head mounted cameras.
2.6 Head Pose Tracking
If intrusiveness is not an issue, a number of commercial systems can be used track auser’s head orientation.
An often used system is the FASTRAK system by Polhemus Inc. [Polhemus ]. Thetracking system uses electro-magnetic fields to determine the position and orientation(pose) of a sensor that can be attached to a remote object, such as a head. Thesystem consists of a main system electronics unit, one to four pose sensors and asingle magnetic transmitter. The pose sensors are connected to the main unit viacables and the system unit can be connected to a computer through a serial interface.

2.6 Head Pose Tracking 25
(Picture from [ARR ]) Picture from [SRR ]
Figure 2.4: Typical image resolutions used in commercial eye gaze tracking systems.
According to the manufacturer’s specification, the possible accuracy of the systemis 0.15 degrees for the sensor orientation. Such accuracy, however, is only obtainedwhen the pose sensors are located within 30 inches from the magnetic transmitterand when no sources of high magnetic disturbance such as computer monitors or ironshelves are located near the pose sensors. The system delivers the orientation andposition parameters at 60 Hz if only one sensor is used.
A magnetic pose tracking system with similar specifications is offered by AscensionTechnology Corp [Ascension ]. Yet another system is available from iReality.com,Inc. [iReality ]. They offer a low-cost 3D orientation tracker intended to be usedin virtual reality games, for instance, where high precision is not necessary. Thissystems utlizes an electronic compass and tilt sensors to compute pose. According tothe product specifications, the tracker has an accuracy of +/- 2 degrees for headingand tilt.
Such tracking systems are often used for virtual reality applications, together withhead mounted displays or head mounted eye trackers, or to track position and ori-entation of data gloves. The advantage of such tracking systems is that they candeliver quite accurate head orientation measurements at high frame rates. In orderto compute a user’s head orientation, these systems, however, would require the userto have a special magnetic sensor attached to his head.
2.6.1 Vision-Based Methods
Vision-based approaches to estimate head orientation from camera images provide aless intrusive alternative to the above tracking systems.

26 Chapter 2 Background and Related Work
Approaches to vision-based estimation of head orientation can be divided into twocategories: model based approaches and appearance based approaches.
In model-based approaches, tracking head orientation is usually formulated asa pose estimation problem. Pose Estimation is the task to recover the 3D positionand rotation of an object, with respect to a certain coordinate system. Estimatinga person’s head rotation can be formulated as a pose estimation problem wherethe task is to recover the 3D rotation and translation of the head. To recoverhead pose usually a number of facial features, such as eyes, nostrils, lip-cornerhave to be located. By finding correspondences between the facial landmarkspoints in the image and their respective locations in a head model, head posecan be computed [Haralick et al. ’89], [Gee & Cipolla ’94], [Gee & Cipolla ’95],[Stiefelhagen et al. ’96], [Stiefelhagen et al. ’97b], [Jebara & Pentland ’97],[Heinzmann & Zelinsky ’98].
The main difficulty with these approaches is the reliable tracking of the facial land-mark points. It requires rather high resolution facial images, and tracking is likely tofail when quick head movements or occlusions of certain features occurs.
Appearance based approaches on the other hand, estimate head orienta-tion from the whole image of the face. Appearance based approaches eitheruse some function approximation technique, such as a neural network, to es-timate head orientation from an image [Beymer et al. ’93, Schiele & Waibel ’95,Rae & Ritter ’98, Kwong & Gong ’99], or a face database is used to encode exampleimages [Pentland et al. ’94, Ong et al. ’98]. Head pose of new images is then esti-mated using the chosen function approximator, or by matching novel images to theimages in the database.
Another appearance based approach is presented by Cascia et al. In their approach3D head tracking is achieved by registration of a facial image to a 3D surface modelof a face. One problem with their approach is the lack of a backup technique whenthe track is lost. In their model the positioning of the initial model has to be doneby hand. And since tracking errors accumulate over time, the performance of thetracker gradually decreases after a few hundred frames [Cascia et al. ’98].
The main advantage of using an appearance based approach to estimate head orien-tation is that no facial landmark points have to be detected and tracked. Only thefacial region has to be detected to estimate head pose.
A problem of appearance based approaches is, however, that a sufficient number andvariety of example images are necessary for good pose estimation results on unseenimages. Furthermore, such approaches tend to be sensitive to different illuminationconditions, since these affect the appearance of the facial images. The problem of pose

2.7 Summary 27
estimation under different illumination conditions will be discussed in later sectionsof this thesis.
2.7 Summary
Due to the limited processing capacity of the brain, only a small subset of the availablesensory input reaches a level of consciousness and becomes aware to us. This subsetis determined by our attention, which is partly an unconscious selection process,and partly can be controlled willfully. Gaze is a good indicator of a subject’s focusof attention. We usually look at the objects that are currently of interest to us.This is true for social interaction and for interaction with objects or devices. Whilegaze is the main cue that humans use to monitor where other individuals look, alsohead and body orientation influence the perception of another person’s gaze. Somestudies suggest that head orientation is in effect a sufficient indicator the determinethe direction of attention.
Several hardware and software based methods for head pose and eye gaze trackingexist today. The practical usefulness of eye gaze tracking methods is however limited.With state of the art eye tracking technology, the location of the user with respect tothe eye tracker has to be carefully controlled or the user has to wear head mountedcameras.

28 Chapter 2 Background and Related Work

Chapter 3
Detecting and Tracking Faces
Detecting a face in a camera image is a prerequisite for many applications includingface recognition, facial expression analysis and audio-visual speech recognition. It isparticularly necessary for vision-based approaches to head pose and gaze tracking,such as they are investigated in this work.
In this chapter we will give a brief overview of existing vision based face detectionapproaches. We will then discuss a color-based approach for face detection andtracking in more detail, since this face detection technique is used in our own system.Finally we describe our use of a panoramic camera to capture a meeting scene andhow faces are detected using the panoramic images.
3.1 Appearance Based Face Detection
Several approaches for face locating have been reported: Turk and Pentland describedhow Eigenfaces, obtained by performing a principal component analysis on a set offaces, can be used to identify a face [Turk & Pentland ’91].
Sung and Poggio [Sung & Poggio ’94] report a face detection system based on clus-tering techniques. A similar system with better results has been claimed by Rowleyet al. [Rowley et al. ’95]. In [Rowley et al. ’95] neural nets are used as the basiccomponents to classify whether a sub-image contains a face or not.
Schneiderman and Kanade [Schneiderman & Kanade 2000] recently proposed a sta-tistical method for face detection. In their approach, appearance of both faces andnon-faces are represented as the product of histograms, describing joint statisticsof wavelet coefficients and their positions on the face. On the test set used in
29

30 Chapter 3 Detecting and Tracking Faces
[Sung & Poggio ’94] and in [Rowley et al. ’95], their approach appeared to obtainthe best results.
A main drawback of these appearance based approaches however is their computa-tional effort. In all the approaches, sub-images at various sizes and at many (if notall) positions of the input image have to be processed to detect faces, which makesthem rather slow. Schneiderman for example reports face detection times of 1 minutewith a coarse to fine search strategy on 320x240 images and 5 seconds detection timewith an optimized version that can only detect frontal faces.
Recently, Viola and Jones [Vioal & Jones 2001] have presented a very fast appear-ance based face detection approach. In their approach, a “cascade” of increasinglycomplex classifiers is used to detect faces in images. The key idea of this approachis to start with simple efficient classifiers to reject many sub-windows that are veryunlikely to contain a face and then use more and more complex classifiers to inves-tigate whether not rejected sub-windows contain a face or not. In their approachvertical, horizontal and diagonal filters at various sizes are used to compute imagefeatures. A learning approach (AdaBoost) is used to find good classification functionsand to find an optimal cascade of classifiers. Their upright frontal face detection sys-tem achieves results comparable to the systems presented in [Rowley et al. ’95] and[Schneiderman & Kanade 2000] while running at 15 frames per second.
3.2 Face Detection Using Color
A different approach for locating and tracking faces is described by Hunke and Waibel[Hunke & Waibel ’94]. They locate faces by searching for skin-color in the image anduse neural networks to distinguish faces from other skin-colored objects such as handsand arms. The main advantages of a color-based face detection and tracking approachare its simplicity and its speed.
In the research presented here, a skin-color based face detection approach as describedin [Yang & Waibel ’96] was implemented and used to find and extract faces in images.In the following paragraphs, this face detector is described in more detail.
Most video cameras use an RGB representation of colors. However, RGB is notnecessarily the best color representation for characterizing skin-color. In the RGBspace, a triple [R,G,B] represents not only color but also brightness.
However, it has been shown that the seemingly strong differences between skin colorsof different individuals (including Asian, black, white faces) are mainly based on

3.3 A Stochastic Skin-Color Model 31
brightness of the reflected skin colors, and that skin-colors form a cluster in chromaticcolor space [Hunke & Waibel ’94, Yang & Waibel ’96].
Chromatic colors (r,g) [Wyszecki & Styles ’82], also known as “pure” colors in theabsence of brightness, are defined by a normalization process:
r =R
R + G + B,
g =G
R + G + B.
In fact, this defines a mapping from a three dimensional color space R3 to a twodimensional one, R2. Color blue, which is defined as b = B
R+G+B, is redundant after
normalization because r+g+b = 1.
3.3 A Stochastic Skin-Color Model
It has been shown that the skin-color distribution in chromatic color spacehas a regular shape which remains similar under changing lighting conditions[Yang & Waibel ’96].
Figure 3.1: Skin-color distribution of forty people
Figure 3.1 shows such a skin color distribution. The histogram shows the skin-colorof forty people in the chromatic color space (from [Yang & Waibel ’96]). This skin-color distribution was obtained by analyzing faces of different races, including Asian,African American, and Caucasian. The grey-scale in the figure reflects the magnitudeof the histogram. It can be seen that skin-colors are clustered in a small area of the
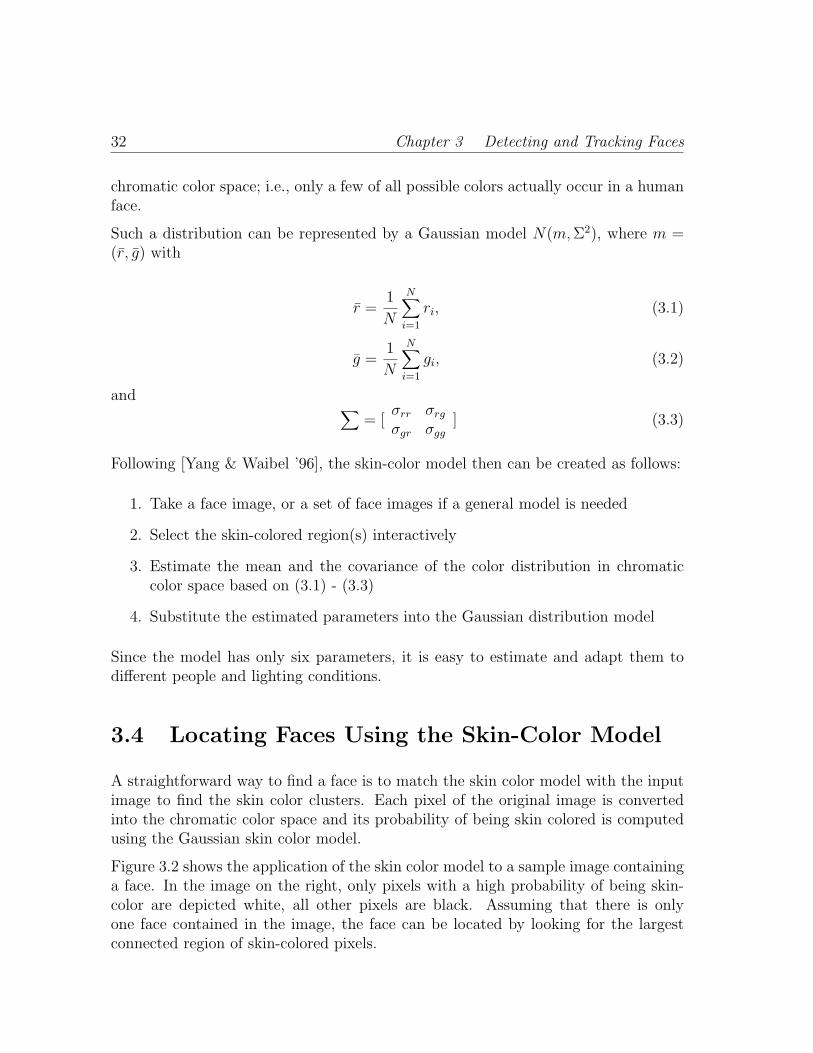
32 Chapter 3 Detecting and Tracking Faces
chromatic color space; i.e., only a few of all possible colors actually occur in a humanface.
Such a distribution can be represented by a Gaussian model N(m, Σ2), where m =(r, g) with
r =1
N
N∑i=1
ri, (3.1)
g =1
N
N∑i=1
gi, (3.2)
and ∑= [
σrr σrg
σgr σgg] (3.3)
Following [Yang & Waibel ’96], the skin-color model then can be created as follows:
1. Take a face image, or a set of face images if a general model is needed
2. Select the skin-colored region(s) interactively
3. Estimate the mean and the covariance of the color distribution in chromaticcolor space based on (3.1) - (3.3)
4. Substitute the estimated parameters into the Gaussian distribution model
Since the model has only six parameters, it is easy to estimate and adapt them todifferent people and lighting conditions.
3.4 Locating Faces Using the Skin-Color Model
A straightforward way to find a face is to match the skin color model with the inputimage to find the skin color clusters. Each pixel of the original image is convertedinto the chromatic color space and its probability of being skin colored is computedusing the Gaussian skin color model.
Figure 3.2 shows the application of the skin color model to a sample image containinga face. In the image on the right, only pixels with a high probability of being skin-color are depicted white, all other pixels are black. Assuming that there is onlyone face contained in the image, the face can be located by looking for the largestconnected region of skin-colored pixels.

3.5 Tracking Faces With an Omni-Directional Camera 33
Input image (color!) Skin-colored regions
Figure 3.2: Application of the color model to a sample input image. The face is found inthe input image (marked by a white rectangle)
3.5 Tracking Faces With an Omni-Directional Cam-
era
In our system, we use a panoramic camera put on top of the conference table to cap-ture the scene. This has the advantage that only one camera is necessary to captureall participants around the table. Compared to using multiple cameras to capturethe scene, no camera calibration is necessary with the omni-directional camera. Fur-thermore, only one video-stream has to be captured, which eliminates the need forsynchronization and reduces hardware needs.
Figure 3.3: The panoramic camera used to capture the scene1

34 Chapter 3 Detecting and Tracking Faces
Figure 3.4: Meeting scene as captured with the panoramic camera
Figure 3.3 shows a picture of the panoramic camera system we are using. The camerais located in the top cylinder and is focusing on a parabolic mirror on the bottomplate. Through this mirror almost a whole hemisphere of the surrounding scene isvisible as shown in Figure 3.4. This figure shows the view of a meeting scene as it isseen in the parabolic mirror and as it is captured with the panoramic camera.
As the topology of the mirror and the optical system are known, it is possible tocompute panoramic views of the scene as well as perspective views at different anglesof the panoramic view [Baker & Nayar ’98]. Figure 3.5 shows the rectified panoramicimage (with faces marked) of the camera view depicted in Figure 3.4.
To detect and track faces in the panoramic camera view, we use the skin-color trackerdescribed in the previous section: The input image is searched for pixels with skincolors. Connected regions of skin-colored pixels in the camera image are considered aspossible faces. Since humans rarely sit perfectly still for a long time, motion detectionis in addition used to reject outliers that might be caused due to noise in the imageor skin-like objects in the background of the scene that are not faces or hands. Onlyregions with a response from the color-classifier and some motion during a period oftime are considered as faces.
The drawback of this approach, however, is that faces and hands are not yet dis-
1Image courtesy of CycloVision Technologies, Inc.

3.5 Tracking Faces With an Omni-Directional Camera 35
Figure 3.5: Panoramic view of the scene around the conference table. Faces areautomatically detected and tracked (marked with boxes).
Figure 3.6: Perspective Views of the meeting participants.
tinguished sufficiently. Therefore we consider skin-colored regions as belonging tothe same person if the projection of their centers onto the x-axis are close enoughtogether. Among the candidate regions belonging to one person, we consider theuppermost skin-like region to be the face and consider the lower skin-like region tobe hands. Figure 3.5 shows the rectified panoramic image (with faces marked) of thecamera view depicted in Figure 3.4.
Once the faces in the image are found, perspective views of each person can becomputed. Compared to panoramic view as depicted in 3.5, the perspective imagesare further rectified. Straight lines in the scene now appear as straight lines in theimages. Figure 3.6 shows the perspective images of the participants detected in thepanoramic image as depicted in 3.5.
Once the perspective images are generated, faces are again searched in these viewsusing the color-based face detector. The faces detected and extracted from theseperspective view are later on used to estimate each participant’s head pose. This willbe described in detail in Chapter 4.

36 Chapter 3 Detecting and Tracking Faces
3.5.1 Discussion
On the meetings that we captured with the omni-directional camera (see Chapter 5for more details), we found that the color-based face tracker correctly detected theparticipants’ faces about 94% of the time.
Errors happened for example because a person’s face was occluded by his hand orarms or by a coffee mug. Sometimes a face was also occluded by one of the posts ofthe camera. In other cases of tracking failure occured because either the hands orarms of the user were falsely classified as the face. Figure 3.7 shows a few exampleswhere faces were not correctly detected.
(a) (b) (c) (d)
Figure 3.7: Some sample images of occluded or not correctly detected faces.
One possibility to detect such outliers could be to use an appearance based facedetector (e.g. as described by [Rowley et al. ’95] or [Schneiderman & Kanade 2000])to verify whether the detected candidate region contains a face or not. Such anapproach might also be useful to refine face detection, when the face really coversonly a part of the candidate region detected by the color-based face tracker (see e.g.Figure 3.7(c)). This has, however, not been investigated in this thesis and remainsfor further work.

Chapter 4
Head Pose Estimation UsingNeural Networks
In this chapter we will describe our approach to estimating head orientation withneural networks.
In this work we aim at estimating head orientation directly from facial images. Themain advantage of such an appearance based approach is that no facial landmarkpoints have to be detected in order to compute head pose. Instead, head pose isestimated from the whole facial image and therefore only the face has to be detectedand tracked in the camera image. This is especially advantageous if head orientationhas to be estimated from small or low resolution facial images, as it is true in ourcase. In the images captured with the omni-directional camera, which we are using tosimultaneously track several participants’ faces around a table, detailed facial featuressuch as eyes or lip-corners, mostly cannot be detected nor tracked (see Figure 4.4 forsome sample images).
We use neural networks to estimate pan and tilt of a person’s head from pre-processedfacial images. Neural networks provide a practical learning technique that has beenwidely used for pattern recognition problems. In the field of computer vision, neu-ral networks have been successfully used for many tasks such as the visual recog-nition of hand postures [Meyering & Ritter ’92], [Drees ’95] and facial expressions[Rosenblum et al. ’96], the detection of faces [Rowley et al. ’98], [Rowley et al. ’95],[Hunke & Waibel ’94] and pedestrians [Wohler et al. ’98], [Zhao & Thorpe ’99], formobile robot guidance [Pomerleau ’92] and for the estimation of head poses[Rae & Ritter ’98], [Schiele & Waibel ’95], to name a few.
Neural networks can be used to “learn” a function that maps the network’s input toits output, given input/output vectors as examples during a training phase. In our
37

38 Chapter 4 Head Pose Estimation Using Neural Networks
approach, the input vectors are preprocessed and vectorized facial images and theoutputs are the horizontal (pan) or vertical (tilt) rotation of the input images. Whena new image is provided to the trained neural network, it will produce as its outputan estimate of the orientation of the face in the input image.
A similar approach is described by Schiele and Waibel [Schiele & Waibel ’95]. Theydescribe a system to estimate head pan from facial color images. In their system,faces are classified to belong to a number of head rotation classes, which correspondto 15 quantized rotation angles from -70 to +70 degrees. Their approach, however,differs in several aspects from the approach presented here. Schiele and Waibel’ssystem estimated head pan in ten degree steps, whereas in our approach both thehead rotation in pan and tilt direction are estimated without any quantization. InSchiele and Waibel’s system, furthermore, only images of faces with no rotation in tilt-direction were used for training and testing, whereas in our system no such restrictionsare made, but instead a user’s head orientation in any direction is allowed.
Another system that uses neural networks to estimate head pose from images is de-scribed in [Rae & Ritter ’98]. As compared to the work presented in this thesis, theirsystem, however, is user-dependent and only results on a single user are reported. Intheir approach, color segmentation, ellipse fitting, and Gabor-filtering on a segmentedface are used for preprocessing. They reported an average accuracy of 9 degrees forpan and 7 degrees for tilt for the one user.
We have trained neural networks to estimate a person’s head rotation from two kindsof camera images: 1) images from a pan-tilt-zoom camera (Canon VC-C1) and 2) anomni-directional camera.
Pan-tilt-zoom cameras are ideal for tasks where only one person’s face and headorientation have to be monitored. An advantage of using an omni-directional camera,however, is that all participants sitting around a table can be simultaneously trackedin one camera view. It is therefore not necessary to synchronize, calibrate and controla number of cameras to track the participants faces and their locations.
4.1 Data Collection
In order to get sufficient generalization to new users, it is necessary to collect trainingimages from different people to train the neural networks. We collected facial imagesfrom many members and students of our lab to get a sufficient amount of trainingdata. During data collection, users had to wear a head band with a sensor of aPolhemus pose tracker attached to it [Polhemus ]. Using the pose tracker, the headpose with respect to a magnetic transmitter could be collected in real-time.

4.1 Data Collection 39
Figure 4.1: Some sample images from the pan-tilt-zoom camera taken in the computerlab.
Figure 4.2: Some sample images from the pan-tilt-zoom camera taken in a secondroom with many windows.
4.1.1 Data Collection With a Pan-Tilt-Zoom Camera
In case of the networks for regular CCD-camera images, we collected data in twodifferent rooms with different lighting conditions. One of the rooms was a computerlab which is mainly illuminated by a number of neon lights at the ceiling, the otherroom had windows all along two of the four walls of the room and was illuminated bydaylight only. In the first room, we took images from 14, in the second room imagesfrom 16 persons. Altogether more than 14,000 images from 19 different persons werecollected. Eighteen of the users were male, five of the nineteen users were wearingglasses. Hair-styles ranged from almost bald to long hair.
To capture the training images, the camera was positioned approximately 1.5 metersin front of the user’s head. The user was asked to randomly look around in the roomand the images together with the pose sensor readings were recorded. Some sampleimages taken in the computer lab are shown in Figure 4.1. Figure 4.2 shows someimages taken in the room with windows. One can see the users wear the head bandwith the little magnetic pose sensor attached to it.
The recorded head orientations varied between 90 degrees to the left and to the rightand approximately 60 degrees up or down. Figure 4.3 shows the distributions ofhorizontal and vertical head rotations in the collected data.

40 Chapter 4 Head Pose Estimation Using Neural Networks
0
10
20
30
40
50
60
70
80
90
-100 -80 -60 -40 -20 0 20 40 60 80 100
#Sam
ples
Head Pan [degrees]
0
20
40
60
80
100
120
140
160
180
-60 -40 -20 0 20 40 60
#Sam
ples
Head Tilt [degrees]
Figure 4.3: Distributions of horizontal (pan) and vertical (tilt) head rotations in thecollected data set.
4.1.2 Data Collection With the Omni-Directional Camera
During data collection with the omni-directional camera, we only collected imagesin the computer lab. Each subject had to sit at the table on which the camera waspositioned. We then tracked the subject’s face in the panoramic view generated fromthe omni-directional camera view and computed a perspective view of the subject’sface as described in Section 3.5. The subject again had to wear the head band withthe pose tracker sensor attached to it, to obtain ground truth of the user’s head pose.The subject was asked to look around, and the perspective views of the subject wererecorded together with the pose sensor readings.
Each subject was furthermore positioned at four different locations around the ta-ble and training data was collected. This was done to obtain training images withdifferent illumination of the faces.
Altogether, we collected data from fourteen users at four positions around a table.All of the users were male, four of them had glasses.
Figure 4.4 shows some sample images taken during data collection with the omni-directional camera. It can be seen that the image resolution is much lower than theresolution of the images obtained with the pan-tilt-zoom camera. In addition, facialimages are captured from a different angle than with the pan-tilt-zoom camera. Thisis due to the fact that the omni-directional camera is positioned at the table, whilethe pan-tilt-zoom camera was positioned approximately at the height of the user’sface.
Table 4.1 summarizes the data that we collected with the different cameras.

4.2 Image Preprocessing 41
Figure 4.4: Training Samples: The perspective images were generated from apanoramic view. Head pose labels are collected with a magnetic field pose tracker.
Camera type Room #subjects #images
Pan-Tilt-Zoom Computer Lab 14 6972Pan-Tilt-Zoom Seminar Room 16 7468
Omni-directional Computer Lab 14 10290
Table 4.1: Collected data to train and test networks.
4.2 Image Preprocessing
As input to the neural nets, three different approaches were evaluated:
1. Using histogram normalized gray-scale images as input
2. Using horizontal and vertical edge images as input
3. Using both normalized gray-scale plus the edge images as input.
To find and extract faces in the collected images, we use the color-based face detectordescribed in Section 3.2.
4.2.1 Histogram Normalization
In the first preprocessing approach, histogram normalization is applied to the gray-scale face images. No additional feature extraction is performed. The normalizedgray-scale images are down-sampled to a fixed size of 20x30 pixels and are then usedas input to the nets.

42 Chapter 4 Head Pose Estimation Using Neural Networks
(a) Original image from pan-tilt-zoom camera.
(b) Original image from omni-directional camera.
Figure 4.5: Pre-processed images: normalized gray-scale, horizontal edge and verticaledge image (from left to right).
Histogram normalization defines a mapping of gray levels p into into gray levels qsuch that the distribution of q matches a certain target distribution (e.g., a uniformdistribution). This mapping stretches contrast and usually improves the detectabil-ity of many image features [Ballard & Brown ’82]. Histogram normalization is alsohelpful to get some illumination invariance.
4.2.2 Edge Detection
In the second approach, the Sobel operator is used to extract horizontal and verticaledges from the facial gray scale images. The resulting edge images are then binarized(thresholded) and down-sampled to 20x30 pixels and are both used as input to theneural nets.
Figure 4.5(a) shows the pre-processed facial images of a user captured with the pan-tilt-zoom camera. From left to right, the normalized gray-scale image, the horizontaland vertical edge images of a user’s face are depicted. Figure 4.5(b) shows the corre-sponding pre-processed images of a face that was captured with the omni-directionalcamera.

4.3 Neural Network Architecture 43
4.3 Neural Network Architecture
In this work we use multi-layer perceptrons with one hidden layer to estimate headpan and tilt from images. A multi-layer perceptron is simple feed-forward networkwith differentiable activation functions. Such a network can be efficiently trainedusing gradient descent (error backpropagation) [Bishop ’95, John Hertz ’91].
Multilayer perceptrons consist of an input layer, one or more hidden layers and anoutput layer. Each unit in the hidden and output layer computes a nonlinear functionof its input vector x consisting of a linear activation function followed by a non-lineartransfer function. The following activation function is used for all units:
ai(x) =N∑
k=1
wikxk + bi,
where the wik are the weights and bi are the unit biases. As transfer functions mostlythe sigmoid function is used, yielding to the following output function of a unit:
yi(x) =1
1 + exp(−ai(x))=
1
1 + exp(∑N
k=1 wikxk + bi).
We have trained separate nets to estimate head pan and tilt. For each net, a multi-layer perceptron architecture with one output unit (for pan or tilt) and one hiddenlayer with 20 to 150 hidden units was used. For both the output units and the hiddenunits, the sigmoid function was used as transfer function.
The size of the input retina depended on the different number and type of inputimages that we investigated. When only the histogram normalized gray-scale imagewas used as input, the size of the input retina was 20x30 units; when the two edgeimages were used, the input retina had 2x20x30 units; when both the histogram-normalized image and the two edge images were used, 3x20x30 units were used asinput units.
Figure 4.6 depicts the architecture of the neural network when both the histogramnormalized image and the two edge images are used as input. On the bottom the threepre-processed input images are displayed. The network has the same architecture forestimating pan and tilt.

44 Chapter 4 Head Pose Estimation Using Neural Networks
Figure 4.6: Neural network to estimate head pan (or tilt) from pre-processed facialimages.
Output activations for pan and tilt were normalized to the range [0,1]. In case ofthe networks for pan estimation, an output activation of 0 corresponded to a headorientation of 90 degrees to the left and an output activation of 1 corresponded tohead orientations of 90 degrees to the right. In case of the networks for tilt estimation,an output activation of 0 corresponded to looking down by 60 degrees and an outputactivation of 1 corresponded to looking up 60 degrees.
Training of the neural net was done using standard back-propagation.
4.4 Other Network Architectures
We have also experimented with two other neural network architectures to estimatehead orientation from the facial images.
First, we tried to estimate head pan and tilt with one network. The network thereforehad two output units, one for pan and one for tilt. The output activations for pan

4.5 Experiments and Results With Pan-Tilt-Zoom Camera Images 45
and tilt were normalized to the range [0,1] as in the case with separate networks toestimate pan and tilt. With the networks to jointly estimate head pan and tilt wehowever achieved poorer estimation results than with the separate networks for panand tilt estimation.
We also investigated neural networks to classify head orientation into different headorientation classes. The output layer of theses networks consisted of 19 units rep-resenting 19 different angles (-90, -80, ...,+80, +90 degrees). The output layer ofthe tilt estimating net consisted of 6 units representing the tilt angles +15, 0, -15,.. -60 degrees. For both nets we used a Gaussian output representation. With suchan output representation not only the single correct output unit is activated duringtraining, but also its neighbors receive some training activation decreasing with thedistance from the correct label. On a multi-user test set, these networks performedslightly worse than the networks with one output unit. On two new users, the resultswere slightly better. A drawback of this network architecture is, however, the muchhigher number of network parameters (nineteen times higher for the pan estimationnetworks!) which significantly prolonged the time necessary for training the networks,while not leading to significantly better results.
We have therefore decided to use separate networks to estimate pan and tilt and touse networks with one output unit for pan and tilt estimation in this work. In theremainder of this thesis, we therefore only report experiments with such a networkarchitecture.
4.5 Experiments and Results With Pan-Tilt-Zoom
Camera Images
To evaluate the different preprocessing methods, we first trained networks on onlythe images that were taken in one room. The images of 12 users were divided into atraining set consisting of 4,750 images, a cross-evaluation set of 600 images and a testset with a size of 600 images. The images of the remaining two users were kept asideto evaluate performance on new users whose images have not been in the training setat all.
Table 4.2 shows the results that we obtained on the twelve-user test set and onthe new users using the different preprocessing approaches. Each cell of the tableindicates the mean difference between the true pan (tilt) and the estimated pan (tilt)over the whole test set. Results are given in degrees.
It can be seen that the best results were obtained when using both the histogramnormalized images and the edge images as input to the neural networks. On the

46 Chapter 4 Head Pose Estimation Using Neural Networks
preprocessing multi-user new users
histogram 3.8 / 3.0 9.4 / 10.9edges 4.6 / 3.6 10.1 / 9.9
histo + edges 3.5 / 2.8 7.5 / 8.9
Table 4.2: Head pose estimation accuracy from good resolution images on a multi-user test set and on two new users. Results for three different preprocessing methodsare indicated: 1) using histogram-normalized images as input, 2) using edge imagesas input and 3) using both histogram-normalized and edge images as input. Theresults indicate the mean error in degrees for pan/tilt.
multi-user test set a mean error of 3.5 degrees for pan an 2.8 degrees for tilt wasobtained. On new users the mean error was 7.5 degrees for pan and 8.9 degrees fortilt.
4.5.1 Error Analysis
Figure 4.7 shows histograms of the observed errors for pan and tilt estimation on themulti-user test set. For both pan and tilt estimation we see that the error histogramshave a Gaussian shape with zero mean. The error histograms for pan and tilt on thenew users are given in figure 4.8. On the new users we see the higher variance of theerror histogram. We also see that the mean of the error histogram for pan estimationis slightly less than zero, which indicates a tendency of the pan estimation networksto underestimate head rotation on the new users.
0
20
40
60
80
100
120
-25 -20 -15 -10 -5 0 5 10 15 20 25
#Sam
ples
Error [degrees]
Pan
0
20
40
60
80
100
120
140
160
-25 -20 -15 -10 -5 0 5 10 15 20 25
#Sam
ples
Error [degrees]
Tilt
Figure 4.7: Error histograms for pan and tilt on the multi-user test set.

4.5 Experiments and Results With Pan-Tilt-Zoom Camera Images 47
0
10
20
30
40
50
60
-40 -30 -20 -10 0 10 20 30 40
#Sam
ples
Error [degrees]
Pan
0
10
20
30
40
50
60
-40 -30 -20 -10 0 10 20 30 40
#Sam
ples
Error [degrees]
Tilt
Figure 4.8: Error histograms for pan and tilt on the new users.
Figure 4.9 indicates the mean error for different horizontal head rotations. On the left,the errors for estimating pan on the multi-user test set is depicted; on the right theerrors on new users are shown. It can be seen that the average errors are quite similarfor head rotations between -60 and +60 degrees. For large head rotations, however,the average errors significantly increase. This is probably due to the distribution ofhead rotation examples in the collected data set (see Figure 4.3). Since only a smallamount of training data was available for large head rotations, the errors are higherfor such rotations.
0
2
4
6
8
10
12
14
16
-100 -50 0 50 100
Mea
n er
ror
[deg
rees
]
Target angle [degrees]
a) Multi-User Test Set
2
4
6
8
10
12
14
16
18
20
-100 -50 0 50 100
Mea
n er
ror
[deg
rees
]
Target angle [degrees]
(b) New Users
Figure 4.9: Mean errors for different target angles on the multi-user test set and onnew users.

48 Chapter 4 Head Pose Estimation Using Neural Networks
4.5.2 Generalization to Different Illumination
We also evaluated the performance of the neural networks on the data collected inthe second room and for networks that were trained on images from both rooms.Since the above experiments showed that using the histogram-normalized image andthe two edge images together as input worked the best, we only present the resultsfor this preprocessing method here. Table 4.3 summarizes the results.
For training and evaluating the networks on images from both rooms, around 9900images from 17 different users were used for training. Both the cross-evaluation setand the test-set contained around 1240 images from the same users. User-independentperformance was evaluated on 1960 images from two users.
The performance of the network on images from both rooms is approximately theaverage of the performances obtained on images of each room. This result showsthat the network is able to handle some amount of illumination variation, as long asimages from both rooms have been in the training set.
Data multi-user new users
Room 1 3.5 / 2.6 7.5 / 8.9Room 2 4.0 / 3.6 6.3 / 12.8
Room 1+2 3.8 / 3.2 7.1 / 9.5
Table 4.3: Average error in estimating head pan and tilt for two “room-dependent”networks and for a network trained on images from two rooms.
To evaluate how different lighting conditions affect the performance of the neural net-works, we trained neural networks with images taken only in one room and evaluatedthe performance on images taken in another room. The first room we collected datain had no windows, but head several light sources on the ceiling. The second roomhad several windows along two sides of the room, no artificial light was present.
Table 4.5 shows the results that we obtained using these “room-dependent” nets whentesting on images from the same room versus testing with images from another room.All the results are user-independent; i.e., no images of the subjects in the test setwere present in the training set.
It can be seen that the accuracy of pose estimation decreases when testing the netson images that were taken under different lighting conditions than during training.
When using images from both rooms for training, however, the pose estimation resultsremain stable. On the user-independent test set with images from both rooms, for

4.5 Experiments and Results With Pan-Tilt-Zoom Camera Images 49
Training Data Test Data Epan Etilt
Room 1 Room 1 3.5 2.6Room 2 Room 2 4.0 3.6
Room 1 Room 2 16.8 18.1Room 2 Room 1 13.9 12.1
Room 1+2 Room 1+2 3.8 3.2
Table 4.4: Results on multi-user test sets, obtained when training and testing onimages taken under different lighting conditions. Both histogram-normalized gray-scale image and edge images were used together as input to the nets.
Training Data Test Data Epan Etilt
Room 1 Room 1 7.5 8.9Room 2 Room 2 6.3 12.8
Room 1 Room 2 13.0 11.4Room 2 Room 1 15.8 10.9
Room 1+2 Room 1+2 7.1 9.5
Table 4.5: User-independent results obtained when training and testing on imagestaken under different lighting conditions. Both histogram-normalized gray-scale im-age and edge images were used together as input to the nets.
instance, an average error of 7.1 degrees for pan estimation and 9.5 degrees for tiltestimation was obtained. This is approximately as good as the average performanceobtained on the user-independent test with neural networks that were trained foreach of those rooms.
In the results reported here, cross-evaluation sets with images taken in the sameroom as the images in the training set were used in order to determine when to stoptraining. Better generalization on images from new rooms can be achieved when across-evaluation set with images from the new room is used. We have trained a neuralnetwork to estimate pan with the 4754 images from “Room 1” in the training set andused a cross-evaluation set of 648 images from “Room 2” to determine when to stoptraining. On the test set from “Room 2” the measured average error for estimatinghead pan then 15.8 degrees, as compared to 16.8 degrees when using images from“Room 1” for cross-evaluation.
Further generalization improvement to a new room could be achieved by also usingartificial training images. We artificially mirrored all the images (and the correspond-

50 Chapter 4 Head Pose Estimation Using Neural Networks
ing head orientations) of the training images from “Room1”. After training networkswith these additional artificial training samples from “Room1”, an average error of15.4 degrees on images from “Room 2” were measured. By furthermore using imagesfrom “Room 2” for cross-evaluation, the measured accuracy on images from “Room2” could be increased to 14.1 degrees. Compared to the initial result of 16.8 degreesaverage error, this signifies an error reduction of 16%. Table 4.6 summarizes theseresults.
Training Set Cross-Evaluation Set Test Set Epan
Room 1 Room 1 Room 2 16.8Room 1 Room 2 Room 2 15.8
Room 1 + mirrored images Room 1 Room 2 15.4Room 1 mirrored images Room 2 Room 2 14.1
Table 4.6: Pan estimation results when training with images from one room andtesting on images from another room with different illumination. By using somesample images from the new room for cross-evaluation, generalization is improved.Further improvement could be obtained by also using artificially mirrored trainingimages.
The achieved pan estimation error of 14.1 degrees on images taken in a new room ishowever still more than twice as high than the average pan estimation error that wasachieved on new users, when images from both rooms were available for training (seeTable 4.5).
In order to further improve the performance of the neural networks under new illu-mination conditions we have therefore investigated how the networks can be adaptedusing training images that are collected in the new location. These experiments willbe discussed in Chapter 8.
4.5.3 A Control-Experiment to Show the Usefulness of EdgeFeatures
Our experimental results showed that using histogram-normalized greyscale imagesleads to better estimation results than using edge images as input. The best results,however, were obtained using both histogram-normalized and edge images as input.
One possibility for the increased accuracy when using both histogram-normalized andedge images as input could be the higher number of parameters of the neural networkwhich is due to three times higher number of input units.
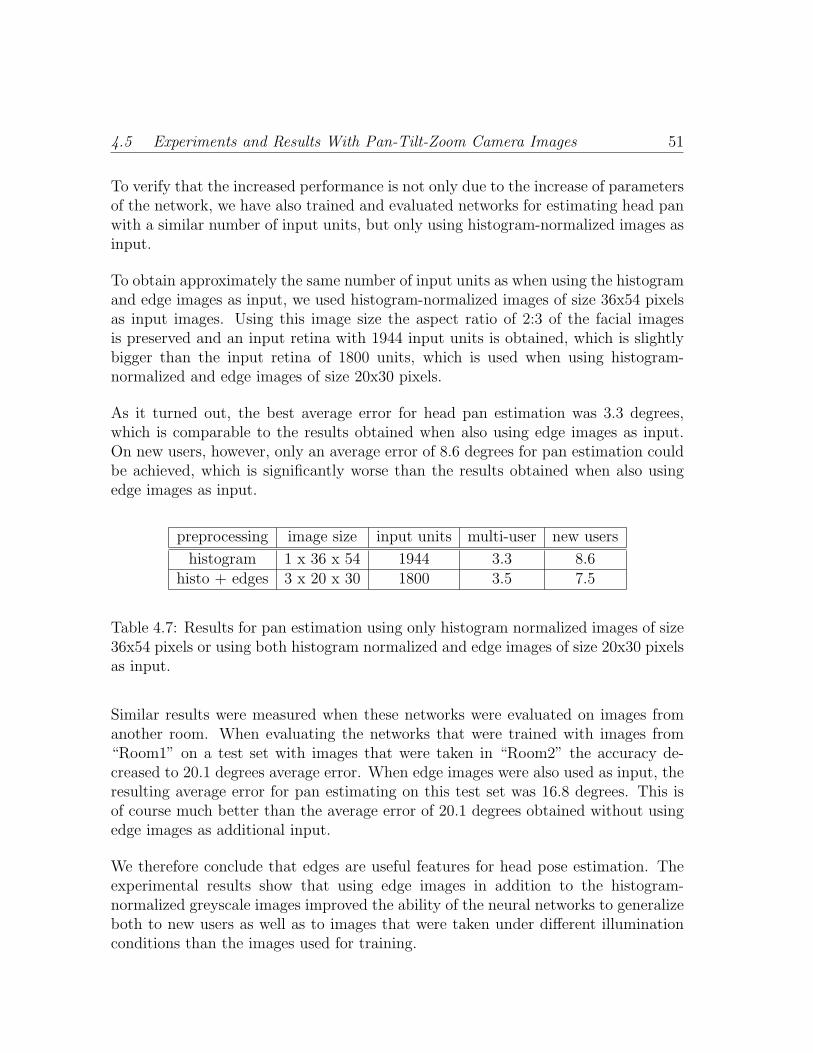
4.5 Experiments and Results With Pan-Tilt-Zoom Camera Images 51
To verify that the increased performance is not only due to the increase of parametersof the network, we have also trained and evaluated networks for estimating head panwith a similar number of input units, but only using histogram-normalized images asinput.
To obtain approximately the same number of input units as when using the histogramand edge images as input, we used histogram-normalized images of size 36x54 pixelsas input images. Using this image size the aspect ratio of 2:3 of the facial imagesis preserved and an input retina with 1944 input units is obtained, which is slightlybigger than the input retina of 1800 units, which is used when using histogram-normalized and edge images of size 20x30 pixels.
As it turned out, the best average error for head pan estimation was 3.3 degrees,which is comparable to the results obtained when also using edge images as input.On new users, however, only an average error of 8.6 degrees for pan estimation couldbe achieved, which is significantly worse than the results obtained when also usingedge images as input.
preprocessing image size input units multi-user new users
histogram 1 x 36 x 54 1944 3.3 8.6histo + edges 3 x 20 x 30 1800 3.5 7.5
Table 4.7: Results for pan estimation using only histogram normalized images of size36x54 pixels or using both histogram normalized and edge images of size 20x30 pixelsas input.
Similar results were measured when these networks were evaluated on images fromanother room. When evaluating the networks that were trained with images from“Room1” on a test set with images that were taken in “Room2” the accuracy de-creased to 20.1 degrees average error. When edge images were also used as input, theresulting average error for pan estimating on this test set was 16.8 degrees. This isof course much better than the average error of 20.1 degrees obtained without usingedge images as additional input.
We therefore conclude that edges are useful features for head pose estimation. Theexperimental results show that using edge images in addition to the histogram-normalized greyscale images improved the ability of the neural networks to generalizeboth to new users as well as to images that were taken under different illuminationconditions than the images used for training.

52 Chapter 4 Head Pose Estimation Using Neural Networks
Net Input Training Set Test Set
Gray-scale 6.6 / 5.0 9.4 / 6.9Edges 6.0 / 2.6 10.8 / 7.1
Edges + Gray-scale 1.4 / 1.5 7.8 / 5.4
Table 4.8: Multi-user results. The mean error in degrees of pan/tilt is shown. Threedifferent types of input images were used. Training was done on twelve users, testingon different images from the same twelve users.
4.6 Experiments and Results With Images From
the Omni-Directional Camera
In case of the panoramic image data, we divided the data set of twelve users (of thefourteen users in the whole data set) into a training set consisting of 6080 images, across-evaluation set of size 760 images and a test set with a size of 760 images. Theimages of the remaining two users were kept as a user independent test set.
As input to the neural nets, again three different preprocessing approaches wereinvestigated: using histogram normalized gray-scale images as input, using horizontaland vertical edge images as input and using both normalized gray-scale plus the edgeimages as input.
Again, we trained the neural networks on the training data set and used the cross-evaluation set to determine when to stop training. The performance of the networkswas then evaluated on the test set containing images of the twelve persons that werealso in the training set (multi-user case). On the multi-user test set, we obtainedthe best performance using both normalized gray-scale images and edge images asinput. A mean error of 7.8 degrees for pan and 5.4 degrees for tilt was obtained withthe best nets. Using only the gray-scale images as input, the results decreased to 9.4degrees for pan and 6.9 degrees for tilt. With edge images as input, only 10.8 degreesfor pan and 7.1 degrees for tilt could be achieved. Table 4.8 summarizes these resultstogether with the accuracies on the corresponding training sets.
To determine how well the neural nets can generalize to new users, we have alsoevaluated the networks on the two users which have not been in the training set. Onthe two new users the best result for pan estimation, which was 9.9 degrees meanerror, was obtained using normalized gray-scale images plus edge images as input.The best result for tilt-estimation measured was 9.1 degrees mean error and wasobtained using only normalized grey-scale images as input. Table 4.9 summarizes theresults.

4.6 Experiments and Results With Images From the Omni-Directional Camera 53
Net Input Training Set New Users
Gray-scale 6.6 / 5.0 11.3 / 9.1Edges 6.0 / 2.6 13.3 / 10.8
Edges + Gray-scale 1.4 / 1.5 9.9 / 10.3
Table 4.9: User independent results. The mean error in degrees of pan/tilt is shown.Three different types of input images were used. Training was done on twelve users,testing two new persons.
Net Input Multi-user Test Set New Users
Gray-scale 5.5 / 4.1 10.4 / 9.3Edges 5.6 / 3.5 12.2 / 10.3
Edges + Gray-scale 3.1 / 2.5 9.5 / 9.8
Table 4.10: Results using additional artificial training data. Results on the multi-user test set and on the two new users are shown for the different preprocessingapproaches. The mean error in degrees of pan/tilt is shown.
4.6.1 Adding Artificial Training Data
In order to obtain additional training data, we have artificially mirrored all of theimages in the training set, as well as the labels for head pan. As a result, theavailable amount of data could be doubled without having the effort of additionaldata collection. Having more training data should especially be helpful in order toget better generalization on images from new, unseen users. Indeed, after trainingwith the additional data, we achieved an average error of only 9.5 degrees for panand 9.8 degrees for tilt on the two new users. On the multi-user test set the accuracyeven was doubled to 3.1 degrees for pan and 2.5 degrees for tilt. Table 4.10 showsthe results on the multi-user test set, as well as the new user test set for the differentpreprocessing approaches.
4.6.2 Comparison
It is interesting to compare the head pose estimation result obtained when usingthe images from the omni-directional camera as input to the networks with thoseresults obtained with facial images of higher resolution obtained from a pan-tilt-zoom camera. Table 4.11 summarizes the best pose estimation results we obtainedwith the two kind of input images. It can be seen that on a multi-user test set, both

54 Chapter 4 Head Pose Estimation Using Neural Networks
image types lead to similar results. However, on new users, the mean error for headpan and tilt estimation is higher with images from the omni-directional camera.
Camera Type Multi-User New Users
Pan-Tilt-Zoom 3.5 / 2.6 7.1 / 8.3Omni-directional 3.1 / 2.5 9.5 / 9.8
Table 4.11: Results obtained with good resolution facial images captured with a pan-tilt-zoom camera and results with facial images obtained from the omni-directionalcamera. The mean difference from true head rotation in degrees is indicated.

Chapter 5
From Head Orientation to Focus ofAttention
In this chapter we present a probabilistic approach to detect a person’s focus ofattention target based on his or her head orientation. We discuss details of themodel, how the model parameters can be adapted to different numbers and locationsof targets, and we present experimental results on a number of meetings that werecorded in our lab.
In our approach we first estimate a person’s head orientation – as described in theprevious chapter – and then estimate at whom a person was looking, based on his orher estimated head orientation. Since head tilt is not needed to determine at whichof several participants around a table someone is looking, we only use a person’s headpan to determine at whom he is looking.
Compared to directly classifying a person’s focus of attention target – based on imagesof the person’s face for example – our approach has the advantage that differentnumbers and positions of participants in the meeting can be handled. If the problemwas treated as a multi-class classification problem, and a classifier such as a neuralnetwork was trained to directly learn the focus of attention target from the facialimages of a user, then the number of possible focus targets would have to be knownin advance. Furthermore, with such an approach it would be difficult to handlesituations where participants sit at different locations than they were sitting duringcollection of the training data.
A first solution to find out at whom a person S is looking could be to use the measuredhead pose of S and look which target person Ti sits nearest the position to whichS is looking. Gaze is, however, not only determined by head pose, but also by the
55

56 Chapter 5 From Head Orientation to Focus of Attention
-60 -40 -20 0 20 40 60
Pro
babi
lity
dens
ity
Head Pan [degrees]
p( x | Left )p( x | Right )
p( x | Opposite )
Person 1
-60 -40 -20 0 20 40 60
Pro
babi
lity
dens
ity
Head Pan [degrees]
p( x | Left )p( x | Right )
p( x | Opposite )
Person 2
-60 -40 -20 0 20 40 60
Pro
babi
lity
dens
ity
Head Pan [degrees]
p( x | Left )p( x | Right )
p( x | Opposite )
Person 3
-60 -40 -20 0 20 40 60
Pro
babi
lity
dens
ity
Head Pan [degrees]
p( x | Left )p( x | Right )
p( x | Opposite )
Person 4
Figure 5.1: Class-conditional head pan distributions of four persons in a meeting whenlooking to the person to their left, to their right or to the person sitting opposite.Head orientations were estimated using a neural network.

57
direction of eye gaze. People do not always completely turn their heads toward theperson at which they are looking. Instead, they also use their eye gaze direction.
We have therefore developed a Bayesian approach to estimate at which target aperson is looking, based on his observed head orientation. More precisely, we wish tofind P (FocusS = Ti|xS), the probability that a subject S is looking towards a certaintarget person Ti, given the subject’s observed horizontal head orientation xS, whichis the output of the neural network for head pan estimation. Using Bayes formula,this can of be decomposed into
P (FocusS = Ti|xS) =p(xS|FocusS = Ti)P (FocusS = Ti)
p(xS), (5.1)
where xs denotes the head pan of person S in degrees and Ti is one of the otherpersons around the table.
Using this framework, given a pan observation xs for a subject S – as estimatedby the neural network for head pan estimation – it is then possible to compute theposterior probabilities P (FocusS = Ti|xS) for all targets Ti and choose the one withhighest posterior probability as the subject’s focus of attention target in the currentframe.
In order to compute P (FocusS = T |xS), it is necessary, however, to estimate the class-conditional probability density function p(xS|FocusS = T ), the class prior P (FocusS =T ) and p(xS) for each person. Finding p(xS) is trivial and can be done by just buildinga histogram of the observed head orientations of a person over time.
One possibility to find the class-conditional probability density function and the priorwould be to adjust them on a training set of similar meetings. This, however, wouldrequire training data for any possible number of participants at the table and for anypossible combination of the participants’ locations around the table. Furthermore,adapting on different meetings and different persons would probably not model acertain person’s head turning style very well, nor would the priors necessarily be thesame in different meetings. In our meeting recordings we observed, for instance, thatsome people turned their head more than others and some people made stronger useof their eye-gaze and turned their head less when looking at other people. Figure 5.1shows the head pan distributions of four participants in one of our recorded meetings.The head orientation of the user was estimated with the neural nets. It can be seen, forexample, that for Person 1, the three class-conditionals are well separated, whereasfor Person 3 or Person 4, the peaks of some distributions are much closer to eachother, and a higher overlap of the distributions can be observed.

58 Chapter 5 From Head Orientation to Focus of Attention
In order to adapt the parameters of our model to varying target locations and to thedifferent head turning styles of the participants, we have developed an unsupervisedlearning approach to find the head pan distributions of each participant when lookingat the others.
5.1 Unsupervised Adaptation of Model Parame-
ters
In our approach, we assume that the class-conditional head pan distributions, suchas depicted in Figure 5.1, can be modeled as Gaussian distributions. Then, thedistribution p(x) of all head pan observations from a person will result in a mixtureof Gaussians,
p(x) ≈M∑
j=1
p(x|j)P (j), (5.2)
where the individual component densities p(x|j) are given by Gaussian distributionsNj(µj, σ
2j ).
In our approach, the number of Gaussians M is set to the number of other participantsat the table, because we assume that these are the most likely targets that the personhas looked at during the meeting, and because we want to find the individual Gaussiancomponents that correspond to looking at these target persons. This parameter canautomatically set to the number of faces detected around the table.
The model parameters of the mixture model can then be adapted so as to maximizethe likelihood of the pan observations given the mixture model. This is done usingthe expectation-maximization algorithm by iteratively updating the parameter valuesusing the following update equations [Bishop ’95]:
µnewj =
∑n P old(j|xn)xn∑
n P old(j|xn)(5.3)
(σnewj )2 =
1
d
∑n P old(j|xn)||xn − µnew
j ||2∑n P old(j|xn)
(5.4)
P (j)new =1
N
∑n
P old(j|xn). (5.5)

5.2 Experimental Results 59
To initialize the means µj of the mixture model, k-means clustering was performed onthe pan observations. Adaptation of the parameters was stopped after a maximum of100 iterations. In a few rare cases, we observed that two means of the mixture modelmoved very closely together during the adaptation process. To prevent this, we alsostopped adaptation when the difference between two means µi and µj became lessthan ten degrees.
After adaptation of the mixture model to the data, we use the individual Gaus-sian components of the mixture model as an approximation of the class-conditionalsp(x|Focus = T ) of our focus of attention model described in equation (5.1). We fur-thermore use the priors of the mixture model, P (j), as the focus priors P (Focus = T ).To assign the individual Gaussian components and the priors to their correspondingtarget persons, the relative position of the participants around the table can be used.
Figure 5.2 shows an example of the adaptation on pan observations from one user.In Figure 5.2(A) the distribution of all head pan observations of the user is depictedtogether with the Gaussian mixture that was adapted as described above. Figure5.2(B) depicts the real class-conditional head pan distributions of that person, to-gether with the Gaussian components taken from the Gaussian mixture model de-picted in Figure 5.2(A). As can be seen, the Gaussian components provide a goodapproximation of the real class-conditional distributions of the person. Note that thereal class-conditional distributions are just depicted for comparison and are of coursenot necessary for the adaptation of the Gaussian components. Figure 5.2(C) depictsthe posterior probability distribution resulting from the adapted class-conditionalsand class priors.
5.2 Experimental Results
To evaluate our approach, several meetings were recorded. In each of the meetingsfour or five participants were sitting around a table and were discussing a freelychosen topic. Video was captured with the panoramic camera. Each participant hada microphone in front of him so that his speech could be recorded. Using this setup,audio streams for each of the participants plus the panoramic view of the scene couldbe simultaneously recorded to hard-disk. A typical panoramic view of a recordedmeeting is shown in Figure 5.3.
To record the audio- and video streams, a software tool for simultaneous time-alignedcapturing of video and up to eight audio-streams was developed. Each audio streamwas recorded with a sampling rate of 16kHz. Time-stamps for each video framewere recorded for later synchronization of the audio streams and the video images.

60 Chapter 5 From Head Orientation to Focus of Attention
0
0.005
0.01
0.015
0.02
0.025
0.03
0.035
0.04
0.045
-60 -40 -20 0 20 40 60
Prio
r Pro
b.
Head Pan [degrees]
True p(x)Adapted p(x)
(A)
0
0.02
0.04
0.06
0.08
0.1
0.12
-60 -40 -20 0 20 40 60
Cla
ss-c
ondi
tiona
l Pro
bs.
Head Pan [degrees]
(B)
0
0.2
0.4
0.6
0.8
1
-60 -40 -20 0 20 40 60
Pos
terio
r Pro
bs.
Head Pan [degrees]
p(Left | x)p(Opposite | x)
p(Right | x)
(C)
Figure 5.2: a) The distribution p(x) of all head pan observations of one subject ina meeting. Also the adapted mixture of three Gaussians is plotted. b) True andestimated class-conditional distributions of head pan x for the same subject, when heor she is looking to three different targets. The adapted Gaussians, are taken fromthe adapted Gaussian mixture model depicted in a). c) The posterior probabilitydistributions P (Focus|x) resulting from the found mixture of Gaussians.
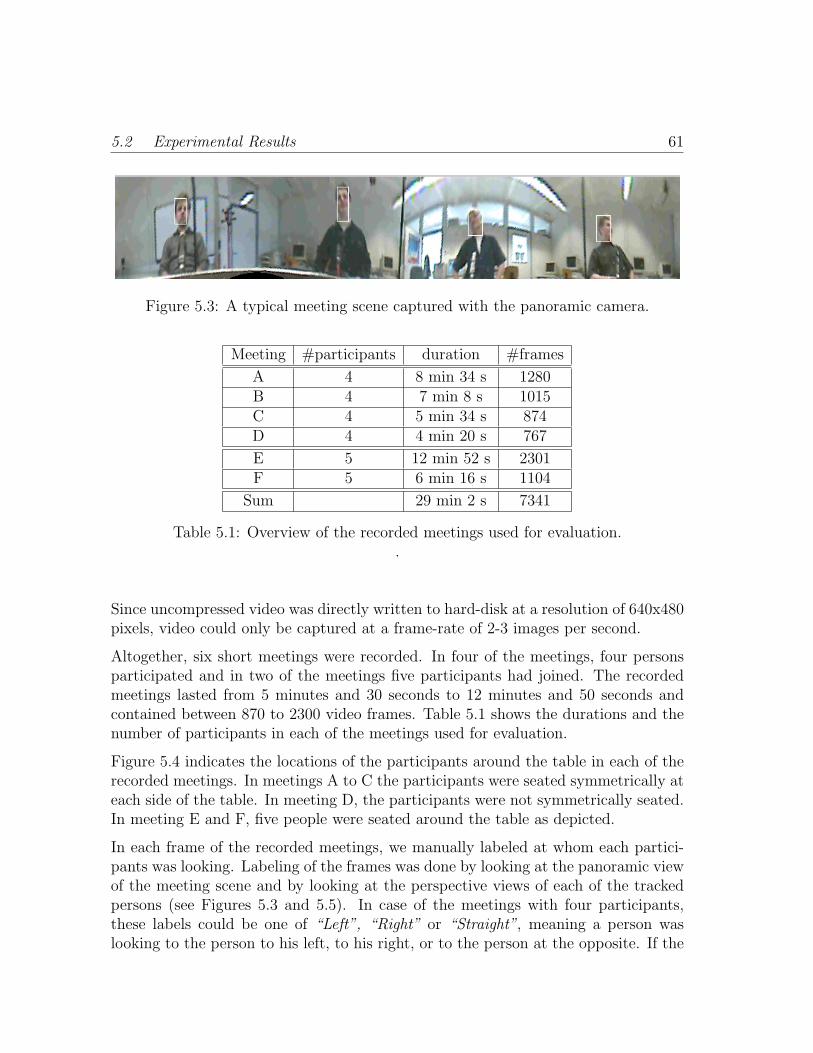
5.2 Experimental Results 61
Figure 5.3: A typical meeting scene captured with the panoramic camera.
Meeting #participants duration #frames
A 4 8 min 34 s 1280B 4 7 min 8 s 1015C 4 5 min 34 s 874D 4 4 min 20 s 767
E 5 12 min 52 s 2301F 5 6 min 16 s 1104
Sum 29 min 2 s 7341
Table 5.1: Overview of the recorded meetings used for evaluation..
Since uncompressed video was directly written to hard-disk at a resolution of 640x480pixels, video could only be captured at a frame-rate of 2-3 images per second.
Altogether, six short meetings were recorded. In four of the meetings, four personsparticipated and in two of the meetings five participants had joined. The recordedmeetings lasted from 5 minutes and 30 seconds to 12 minutes and 50 seconds andcontained between 870 to 2300 video frames. Table 5.1 shows the durations and thenumber of participants in each of the meetings used for evaluation.
Figure 5.4 indicates the locations of the participants around the table in each of therecorded meetings. In meetings A to C the participants were seated symmetrically ateach side of the table. In meeting D, the participants were not symmetrically seated.In meeting E and F, five people were seated around the table as depicted.
In each frame of the recorded meetings, we manually labeled at whom each partici-pants was looking. Labeling of the frames was done by looking at the panoramic viewof the meeting scene and by looking at the perspective views of each of the trackedpersons (see Figures 5.3 and 5.5). In case of the meetings with four participants,these labels could be one of “Left”, “Right” or “Straight”, meaning a person waslooking to the person to his left, to his right, or to the person at the opposite. If the

62 Chapter 5 From Head Orientation to Focus of Attention
Person 3
Person 4 Person 2
Person 1
Meetings A-C
Person 2
Person 4
Person 1
Person 3
Meeting D
Person 5
Person 2
Person 4Person 3
Person 1
Meetings E,F
Figure 5.4: Approximate locations of the participants around the table in the recordedmeetings (viewed from top).
Figure 5.5: Perspective views of two participants. These views were used togetherwith the panoramic view of the scene to label at whom a participant was looking.
person wasn’t looking at one of these targets, e.g., the person was looking down onthe table or was staring up to the ceiling, the label “Other” was assigned. In case ofthe meetings with five participants appropriate labels to label the other four targetpersons were chosen.
In addition, labels indicating whether a person was speaking or not were manuallyassigned for each participant and each video frame. These labels were assigned bylistening to the audio streams of each participant and using the time-stamps thatwere captured with the video stream.
We have evaluated this approach on the evaluation meetings. In each meeting,the faces of the participants were automatically tracked, and head pan was com-puted using the neural network-based system to estimate head orientation describedin Chapter 4.
Then, for each of the participants in each meeting, the class-conditional head pan dis-tribution p(x|Focus), the class-priors P (Focus) and the observation distributions p(x)were automatically adapted as described in the previous section, and the posterior

5.2 Experimental Results 63
probabilities P (Focus = Ti|x) for each person were computed. During evaluation, ineach frame the target with the highest posterior probability was then chosen as thefocus of attention target of the person.
For the evaluation, we manually marked frames where a subject’s face was occludedor where the face was not correctly tracked. These frames were not used for evalua-tion. Face occlusion occurred in 1.6% of the captured images. Occlusion sometimeshappened when a user covered his face with his arms or with a coffee mug for exam-ple; sometimes a face was occluded by one of the posts of the camera. In another4.2% of the frames the face was not correctly tracked. We also did not use frameswhere a subject did not look at one of the other persons at the table. This happenedin 3.8% of the frames. Overall 8.2% of the frames were not used for evaluation sinceat least one of the above indications was given.
5.2.1 Meetings With Four Participants
In the meetings with four participants, the correct focus target could be detectedon average in 72.9% of the frames. This result was obtained by comparing each ofthe computed focus targets of each participant with the manually obtained labels.Table 5.2 shows the average results on the three meetings. In the table, the averageaccuracy on the four participants in each meeting is indicated. The focus detectionaccuracy for the individual participants ranged from 68.8% to 79.5%.
P (Focus|Head Pan)
Meeting A (4 participants) 68.8%Meeting B (4 participants) 73.4%Meeting C (4 participants) 79.5%Meeting D (4 participants) 69.8%
Average 72.9%
Table 5.2: Percentage of correctly assigned focus targets based on computingP (Focus|head pan) in meetings with four participants.
While in meetings A to C the four participants were seated symmetrically around thetable; i.e., each of the participants was seated exactly in the middle of one side of thetable, in meeting D the participants were not evenly distributed around the table.The results show, that our algorithm performs similarly well for different seatingarrangements of the participants.

64 Chapter 5 From Head Orientation to Focus of Attention
5.2.2 Meetings With Five Participants
Table 5.3 summarizes the evaluation results that could be obtained on the two meet-ings with five participants. On average the correct focus target of person could bedetected in 52.5% of the time.
P (Focus|Head Pan)
Meeting E (5 participants) 51.9%Meeting F (5 participants) 53.0%
Average 52.5%
Table 5.3: Percentage of correctly assigned focus targets based on computingP (Focus|head pan) in the meetings with five participants.
As could be expected, this result is worse than the results obtained with four partic-ipants. However, the detection accuracy is of course much better than chance, whichfor the four possible targets would be 25%. An obvious reason for the decreasedresult is that five people are sitting closer together at the same table as do four peo-ple. Therefore, distinguishing at whom someone was looking at based on his headorientation becomes more difficult.
5.2.3 Upper Performance Limits Given Neural Network Out-puts
When looking at the class-conditional head pan distribution p(x|Focus) of the par-ticipants, such as depicted in Figure 5.1 for example, it is clear that there is someoverlap of the distributions.
The overlap in the distribution is due to the subject’s head turning behavior, due tothe noisy neural network based pan estimation and also dependends on the numberof target persons at the table.
By only relying on head pose estimation to detect the focus target of a person, thepossible accuracy of the approach is limited by the overlap of these class-conditionaldistributions.
To evaluate the upper-limit of our approach to detect the focus target based onthe estimated head orientations, we have used the true class-conditional distribu-tions of estimated head pan in order to compute each person’s posterior probabilities

5.2 Experimental Results 65
p(Focus = Ti|x) and to determine the focus targets. These “true” class-conditionalscan be found by looking at the estimated head rotations of a subject, when the subjectwas known to look at a specific target person.
Upper limit with four participants
P (Focus|Head Pan)
Meeting A 75.1%Meeting B 79.5%Meeting C 81.1%Meeting D 75.7%
Average 77.9%
Table 5.4: Upper performance limits of focus of attention detection, given estimatedhead orientations. The percentage of correctly assigned focus targets using true class-conditionals of estimated head pan are indicated. Four subjects participated in eachmeeting.
Table 5.4 summarizes the results of the two meetings. On average, in 77.9% ofthe frames the focus target could be correctly determined. This result indicatesthe accuracy we could obtain, if we knew the true class-conditional distributions ofeach person’s estimated head pan. By estimating the class-conditionals using theunsupervised adaptation approach described above, we obtained an average accuracyof 72.9% on the three meetings, which is 94% of the optimum performance.
Upper limit on Meetings with five people
Table 5.5 summarizes the corresponding baseline results on the meetings with fiveparticipants. On average in 67% of the time the correct focus target can be deter-mined based on the estimated head orientations. Since there is a higher overlap of theclass-conditional head orientation distributions for four targets than for only threetarget persons, the possible accuracy is about 11% lower than for three target persons.Figure 5.6 shows an example of the class-conditional distributions of a participant ofMeeting E.

66 Chapter 5 From Head Orientation to Focus of Attention
-60 -40 -20 0 20 40 60
Cla
ss-C
ondi
tiona
l Pro
bs.
Head Pan [degrees]
Figure 5.6: Class-conditional distributions of horizontal head rotations of one subject,when he or she is looking at four target persons at the table. A high overlap of thedistributions can be observed.
P (Focus|Head Pan)
Meeting E 68.4%Meeting F 65.6%
Average 67.0%
Table 5.5: Upper performance limits of focus of attention detection from estimatedhead orientations with five meeting participants. Percentage of correctly assignedfocus targets using true class-conditionals of estimated head pan are indicated.
5.3 Panoramic Images Versus High-Resolution Im-
ages
In Section 4.6.2 we demonstrated that slightly better head pose estimation resultson new users could be obtained with images captured with a pan-tilt-zoom camera.The best result for head pan estimation with neural networks trained on the omni-directional camera images was 9.5 degrees mean error, whereas with images from thestandard camera 7.1 degrees error could be achieved.
We have also evaluated how much the different types of input images affect theaccuracy of head pose based focus estimation. In order to do this, we have capturedfour meetings both with the panoramic camera and with one additional pan-tilt-zoomcamera facing one person. For those four persons that were captured with both, theomni-directional and the pan-tilt-zoom camera, focus estimation based on the two

5.4 Summary 67
type of facial images could be compared.
Upper performance limit
When the true, manually determined, class-conditional distributions of each person’sestimated head pan was used for focus estimation, the correct focus of attentionbased on images from the omni-directional camera could be estimated for these fourpersons in 78.9% of the frames. When using the higher resolution facial images, andthe neural networks trained for these images, in 79.5% of the frames focus could bedetected correctly.
Results with unsupervised adaptation
When the class-conditional head pan distributions were adapted using k-means clus-tering and the EM-approach as described above, on average in 74.9% of the framesthe correct focus target could be detected on the basis of the images from the omni-directional camera. With the facial images of higher resolution the obtained accuracywas 75.5%.
Discussion
This experiments shows that at least when the participants are not too far away fromthe omni-directional camera, as in our experiment, focus of attention of the partici-pants can be estimated from the omni-directional images with the same accuracy aswhen using separate cameras to capture each user.
When using the omni-directional camera, however, we expect that head pose estima-tion results might decrease when a bigger conference table is used and the participantsof the meeting sit further away from the camera. Consequently focus of attentiondetection will be less accurate. Since with a pan-tilt-zoom camera, the size of theface can be kept constant within the image, no matter how far people sit away fromthe camera, no decrease of focus of attention detection is expected for those cameras.
5.4 Summary
This chapter presented our probabilistic approach to determine focus targets basedon observed head orientations. In our approach, a subject’s head orientation when

68 Chapter 5 From Head Orientation to Focus of Attention
looking at other target is modeled as a mixture of Gaussians. We have demonstratedhow the model parameters can automatically be adapted when the number of targetsis known. We have demonstrated experiments on meetings with four and five par-ticipants. The approach has proven to be able to adapt as well to different seatingarrangements as to different numbers of participants. We have furthermore inves-tigated the upper limit of focus of attention detection accuracy, when the focus isdetermined based on head pan estimations given by the neural nets.

Chapter 6
Head Pose versus Eye-Gaze
In this work, head orientation is used to predict a person’s focus of attention inmeetings. This is done because head orientation is assumed to be a very reliableindicator of the direction of someone’s attention during social interaction, as hasbeen discussed in Chapter 2, and because eye gaze of several meeting participantscannot be easily tracked without the use of intrusive hardware.
Since we estimate where a person is looking based on his head orientation, the fol-lowing question suggests itself: how well can we predict at whom a person is looking,merely on the basis of his or her head orientation?
To answer this question, we have analyzed the gaze of four people in meetings us-ing special hardware equipment to measure their eye gaze and head orientation[Stiefelhagen & Zhu 2002]. We have then analyzed the gaze and head orientationdata of the four people to answer the following questions:
1. How much does head orientation contribute to gaze?
2. How good can we predict at whom the person was looking, based on his headorientation only?
6.1 Data Collection
The setting in this experiment is a round-table meeting. There are four participantsin the meeting, and a session of data for about ten minutes with each participant iscollected. In every session, one of the participants, the subject, wears a head-mounted
69

70 Chapter 6 Head Pose versus Eye-Gaze
(a) (b)
Figure 6.1: a) Datacollection with eye and head tracking system during a meeting.b) A participant wearing the head-mounted eye and head tracking system.
gaze tracking system from Iscan Inc. [ISC. ]. The system uses a magnetic pose andposition tracking subsystem to track the subject’s head position and orientation. An-other subsystem uses a head-mounted camera to capture images of the subject’s eye.Software provided with this system can estimate and record the following data witha frame rate of 60 Hz: the subject’s head position, head orientation, eye orientation,pupil diameter, and the overall gaze (line of sight) direction. All these estimationshave a precision of better than one degree, which is far beyond the capability of anycurrent non-intrusive tracking methods.
Figure 6.1 (a) shows an image taken during data collection. Note that the secondperson from the right in the image is wearing the head-mounted gaze-tracker. Figure6.1 (b) shows a participant wearing the tracking head gear.
A plot of some data captured from one subject is depicted in Figure 6.2. In the figure,the horizontal head orientation, eye orientation, and overall gaze direction over timeare shown. Figure 6.3 shows a schematic view of a subject’s head orientation, eyeorientation and gaze direction. Gaze direction los is the sum of head orientation hoand eye orientation eo.
6.2 Contribution of Head Orientation to Gaze
First, we analyzed the contribution of head orientation and eye orientation to theoverall gaze direction along the horizontal axis. On the data from the four participants

6.2 Contribution of Head Orientation to Gaze 71
-60
-40
-20
0
20
40
60
80
0 500 1000 1500 2000 2500 3000 3500 4000 4500 5000
Line of SightHead Rotation
Eye Rotation
Figure 6.2: Plot of a subjects horizontal head orientation, eye orientation and overallgaze direction in a meeting. Eye orientation is measured relative to head orientation;i.e., the eye orientation within the eye sockets is indicated. The data was capturedusing an gaze tracking system from Iscan Inc [ISC. ].
eye orientation (eo)
head orientation (ho)
gaze (los)
0
Figure 6.3: Schematic view of head oriention ho, eye orientation eo and gaze directionlos of a subject.
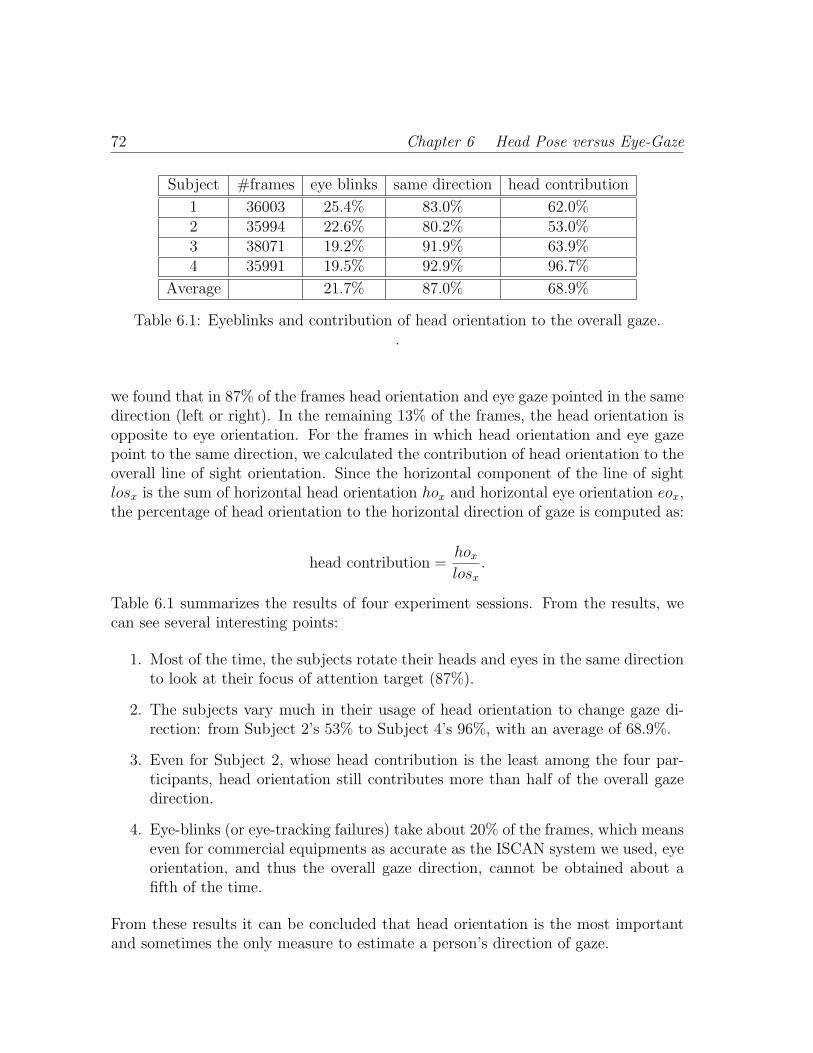
72 Chapter 6 Head Pose versus Eye-Gaze
Subject #frames eye blinks same direction head contribution
1 36003 25.4% 83.0% 62.0%2 35994 22.6% 80.2% 53.0%3 38071 19.2% 91.9% 63.9%4 35991 19.5% 92.9% 96.7%
Average 21.7% 87.0% 68.9%
Table 6.1: Eyeblinks and contribution of head orientation to the overall gaze..
we found that in 87% of the frames head orientation and eye gaze pointed in the samedirection (left or right). In the remaining 13% of the frames, the head orientation isopposite to eye orientation. For the frames in which head orientation and eye gazepoint to the same direction, we calculated the contribution of head orientation to theoverall line of sight orientation. Since the horizontal component of the line of sightlosx is the sum of horizontal head orientation hox and horizontal eye orientation eox,the percentage of head orientation to the horizontal direction of gaze is computed as:
head contribution =hox
losx
.
Table 6.1 summarizes the results of four experiment sessions. From the results, wecan see several interesting points:
1. Most of the time, the subjects rotate their heads and eyes in the same directionto look at their focus of attention target (87%).
2. The subjects vary much in their usage of head orientation to change gaze di-rection: from Subject 2’s 53% to Subject 4’s 96%, with an average of 68.9%.
3. Even for Subject 2, whose head contribution is the least among the four par-ticipants, head orientation still contributes more than half of the overall gazedirection.
4. Eye-blinks (or eye-tracking failures) take about 20% of the frames, which meanseven for commercial equipments as accurate as the ISCAN system we used, eyeorientation, and thus the overall gaze direction, cannot be obtained about afifth of the time.
From these results it can be concluded that head orientation is the most importantand sometimes the only measure to estimate a person’s direction of gaze.

6.3 Predicting the Gaze Target Based on Head Orientation 73
0
500
1000
1500
2000
2500
3000
3500
-100 -80 -60 -40 -20 0 20 40 60 80 100
#Sam
ples
Gaze Direction [degrees]
los_az1
0
500
1000
1500
2000
2500
-100 -80 -60 -40 -20 0 20 40 60 80 100
#Sam
ples
Gaze Direction [degrees]
los_az3
Figure 6.4: Histograms of horizontal gaze directions of two subjects. For both subjectsthree peaks in the distribution of gaze directions can be seen, which correspond tolooking at the three other participants in the meeting.
6.3 Predicting the Gaze Target Based on Head
Orientation
We approached the second question we proposed before in this particular meetingapplication: How good can we predict at whom the subject was looking, on the basisof his head orientation? Answering this question gives us an idea of the upper limitof the accuracy that can be obtained when the focus of attention target is estimatedbased on head orientation alone.
6.3.1 Labeling Based on Gaze Direction
To automatically determine at which target person the subject was looking at (focusof attention), the gaze direction was used. Figure 6.4 shows the histograms of thehorizontal gaze direction of two of the participants. In each of the histograms, it canbe seen that there are three peaks. These belong to the direction where the otherparticipants at the table were sitting.
We have automatically determined the peaks in the horizontal line-of-sight data-filesusing the k-means algorithm. The peaks found were then used as the directionswhere the other persons were sitting, and in each frame, focus of attention labelswere assigned based on the least distance of the actual horizontal line-of-sight to thethree target directions.

74 Chapter 6 Head Pose versus Eye-Gaze
0
0.01
0.02
0.03
0.04
0.05
0.06
-100 -80 -60 -40 -20 0 20 40 60 80 100Head Orientation [degrees]
hoadapted ho
(a)
0
0.01
0.02
0.03
0.04
0.05
0.06
0.07
0.08
-100 -80 -60 -40 -20 0 20 40 60 80 100Head Orientation [degrees]
p(x | Right)p(x | Left)
p(x | Straight)
(b)
0
0.2
0.4
0.6
0.8
1
-100 -80 -60 -40 -20 0 20 40 60 80 100Head Orientation [degrees]
p(x | Right)p(x | Left)
p(x | Straight)
(c)
Figure 6.5: a) The distribution of all head orientation observations p(x) from onesubject and the found mixture of Gaussians. b) The three components of the mixtureof Gaussians are taken as class-conditional head pan distributions. c) the posteriorprobability distributions P (Focus|x) resulting from the found mixture of Gaussians.
6.3.2 Prediction Results
To see how accurate the focus target can be estimated based on observing headorientation alone, we used exactly the same method to find the focus targets asdescribed in Chapter 5. The only difference now is, that in the previous chapter, focuswas determined based on noisy head pan estimates as given by the neural networks,whereas now, focus targets are found based on accurate head pan measurements asgiven from the gaze tracking equipment.
Figure 6.3.2 depicts the unsupervised approach to determine focus posterior proba-bilites based on head orientations for one subject. As described in Chapter 5, firstthe EM-approach was used to fit a mixture of three Gaussians to the horizontal headorientation observations of each person (Figure 6.3.2 (a)). The found componentsof the Gaussian mixuture are then used as class-conditional head pan distributionsp(x|Focus) (Figure 6.3.2 (b)) and the mixture weights are used as the focus priors.From these, the posterior probabilities P (Focus = Ti|head orientation = x) are com-puted (Figure 6.3.2 (c)). In each frame, the focus target Ti with the highest posteriorprobability is then chosen for each person.
Finally, focus detection accuracy was determined by comparing the found focus tar-gets with the focus labels. Table 6.2 summarizes the results.
The accuracy result shows that the focus of attention target can be correctly estimatedwith only head orientation data in 82.6% (Subject 2) to 93.2% (Subject 3 and 4) of theframes, with an average of 88.7%. This can be seen as the upper limit of accuracythat we can get in head orientation based focus of attention estimation in such ascenario.

6.4 Discussion 75
Subject accuracy
1 85.7%2 82.6%3 93.2%4 93.2%
Average 88.7%
Table 6.2: Focus detection based on horizontal head orientation measurements..
6.4 Discussion
The experiments presented in this chapter show that head orientation is a reliable cuefor detecting at whom participants look in meetings. In the recorded meetings, focusof attention of four subjects could be detected 89% of the time based on accurate headorientation measurements. This result also gives an idea of the possible accuracy offocus detection with this approach: Even if we had a near-perfect method to estimatehead orientation, focus estimation based on head orientation alone would fail in 11%of the frames in our data.
These experimental results are in accordance with several behavioral studies whichsuggest that head orientation is in fact a sufficient indicator for attention direction[Emery 2000, Argyle & Cook ’76, Cranach ’71] (see also Section 2.4).

76 Chapter 6 Head Pose versus Eye-Gaze

Chapter 7
Combining Pose Tracking withLikely Targets of Attention
In previous chapters we have discussed that a person’s head orientation is coupledwith his or her attention, and have presented methods to estimate focus of attentionbased on head orientation in meetings. As we have seen, however, the proposedapproach for focus of attention tracking is of course not perfect. Since eye gaze is notused in our approach, a certain amount of uncertainty is introduced. In addition, thenoisy estimation of head orientations from camera images introduces errors.
To improve the performance of focus of attention tracking, we therefore would liketo combine various sources of information.
As we have argued before, attention is clearly influenced by external stimuli, such asnoises, movements or speech of other persons. Monitoring and using such cues mighttherefore help us to bias certain targets of interests against others.
Information about who is currently talking in a meeting clearly could be useful for theprediction of where people are attending to. It seems intuitive that participants tendto look at the speaker. Argyle, for instance pointed out, that listeners use glancesto signal continued attention, and that gaze patterns of speakers and listeners areclosely linked to the words spoken [Argyle & Cook ’76].
Support for this idea comes also from a recent study of Vertegaal et al.[Vertegaal et al. 2001]. Their study investigated the relationship of where peoplelook and whom they attend to during multi-party conversations. It was found thatsubjects looked about 7 times more at the individual they listened to than at others,and that subjects looked about 3 times more at individuals they spoke to. They con-clude that information about who is looking at whom is an ideal candidate to provide
77

78 Chapter 7 Combining Pose Tracking with Likely Targets of Attention
addressee information and that it can also be used to predict to whom someone islistening.
7.1 Predicting Focus Based on Sound
We have investigated whether and to what extent it is possible to predict a person’sfocus of attention based on information about who is speaking.
In our first experiment to predict focus from sound we analyzed at whom the four par-ticipants in the recorded meetings were looking during certain “speaking” conditions.Here, “speaking” was treated as a binary vector; i.e., each of the four participants waseither labeled as “speaking” or “not speaking” in each video frame. Now, using thisbinary “speaking” vector and having four participants, there exist 24 possible “speak-ing” conditions in each frame, ranging from none of the participants is speaking toall of the participants are speaking.
Table 7.1 summarizes at whom subjects in our three meetings were looking, based onwho was speaking. In the first columns, the different possible speaking conditions arerepresented. Here, the speakers can be any combination of the participants, which arethe subject itself (“Self”), the person sitting left to the subject (“Left”), the personsitting opposite to the subject (“Center”) or the person sitting right to the subject(“Right”). The speakers are marked with an “x” in the corresponding columns.
On the right side of the table, the percentages of how often the subject looked at thedifferent other participants during the speaker constellations is indicated. For eachperson and each case we counted how often the subjects looked to the right, lookedstraight or looked to the person to their left. For example, when only the person tothe subject’s left was speaking, in 59% of the cases the subject was looking to theleft person (the speaker), in 28% of the cases he was looking straight to the oppositeperson and in 11% of the cases he was looking to the person to his right.
Overall it can be seen that if there was only one speaker, subjects most often lookedto that speaker. This also holds for cases were there was only one additional speakerwhen the subject itself was speaking. The percentages for these cases are indicatedin bold font in Table 7.1.
The last row of Table 7.1 indicates in which direction subjects looked on average,regardless of speaking conditions. It can be seen that there is a bias towards lookingstraight; i.e., regardless who was speaking, in 44% of the cases the person oppositehas been looked at, whereas the persons sitting to the side have been looked at inonly 26% of the cases.

7.1 Predicting Focus Based on Sound 79
Speakers Focus TargetsSelf Left Center Right Left Center Right
0.26 0.49 0.23x 0.11 0.27 0.60
x 0.12 0.74 0.11x x 0.07 0.49 0.40
x 0.59 0.28 0.11x x 0.35 0.24 0.37x x 0.33 0.60 0.05x x x 0.21 0.41 0.38
x 0.24 0.48 0.25x x 0.09 0.34 0.53x x 0.18 0.61 0.18x x x 0.08 0.59 0.30x x 0.60 0.24 0.11x x x 0.29 0.44 0.26x x x 0.35 0.56 0.08x x x x 0.50 0.50 0.00
all cases 0.26 0.44 0.26
Table 7.1: Table summarizes, how often subjects looked to participants in certaindirections, during the different speaking conditions (see text for further explanation).
The entries of Table 7.1 can be directly interpreted as the probability that a subjectS was looking to a certain person T , based on a binary audio-observation vector ~Aencoding which of the participants are speaking:
P (Focus|Sound) = P (FocusS = Tj| ~A),
where Tj with j ∈ { “Left”, “Straight”, “Right” } denote the possible persons to lookat, and where
~A = (aSelf , aLeft, aCenter, aRight)
denotes the audio-observation vector with binary components ai, indicating whetherthe subject itself, the person to his right, left, or the person opposite (center) to thesubject was speaking.
The probability P (Focus|Sound) can be used directly to predict at whom a participantis looking in a frame, based on who was speaking during that video frame. In eachframe, for each subject S the person Ti was chosen as the focus of person S, whichmaximized P (FocusS = Ti| ~A).

80 Chapter 7 Combining Pose Tracking with Likely Targets of Attention
P (Focus|Sound)
Meeting A 57.7%Meeting B 57.6%Meeting C 46.9%Meeting D 63.2%
Average 56.3%
(a) Four participants
P (Focus|Sound)
Meeting E 61.3%Meeting F 54.2%
Average 57.8%
(b) Five participants
Table 7.2: Focus-prediction using sound only. Percentage of correct assigned focustargets by computing P (Focus|Sound). a) Results with four participants in meetingsA to D. b) Results with five participants (Meeting F and G).
7.1.1 Sound-Only Based Prediction Results
By using only the speaker labels to make a sound-based focus prediction, the correctfocus of each participants could be predicted with an average accuracy of 56.3% onevaluation meetings with four participants. Table 7.2 (a) summarizes the results onthose meetings.
We also investigated how the sound-based prediction performs on the two meetingswith five participants. Here, the posterior probabilities used for evaluation on oneof the two meetings were adjusted on the other meeting. Table 7.2 (b) shows thecorresponding results. Here, the correct focus target could be predicted in 57.8% ofthe cases on average.
7.2 Combining Head Pose and Sound to Predict
Focus
In the previous section it was shown how we can determine the probabilityP (Focus|Sound); i.e., the probability that a person is looking towards a certain otherperson, based on the information, about who is currently speaking. By choosing ineach frame the target person Ti which maximized P (FocusS = Ti| ~A) as the focus ofperson S, a focus prediction accuracy of 56.3% could be achieved on the meetingswith four participants.
In section 5 we showed how to compute P (FocusS = Ti|xS), the posterior probability,that a person S is looking towards person Ti, based on his estimated head rotation

7.3 Using Temporal Speaker Information to Predict Focus 81
xS. There, by again choosing in each frame the target person Ti which maximizedP (FocusS = Ti|xS) as the focus of person S, we achieved correct focus prediction in72.9% of the frames on the same meetings with four participants.
These two independent predictions of a person’s focus – P (Focus|Sound) andP (Focus|HeadPose) – can be combined to obtain a multimodal prediction of a per-son’s focus which is based on both the observation, who is speaking, and based onthe estimation of the person’s head rotation.
A straightforward way to obtain a combined result is to compute the weighted sumof both prediction probabilities:
p(Focus) = (1− α)P (Focus|Head Pose) + αP (Focus|Sound).
We have evaluated the combined prediction results on our meetings for different valuesof α, ranging from 0.0 to 1.0. On the four meetings, the optimal values of α rangedfrom 0.3 to 0.6. By setting α to 0.6, good results could be achieved on all meetings.Using this multimodal prediction, an accuracy of 73.6% was achieved on the meetingswith four participants. The results are shown in table 7.3 (a). Table 7.3 (b) showsthe corresponding results on the meetings with five participants. Here, the combinedfocus prediction accuracy of 65.1% is 7.4% better than the focus prediction which isbased on speaker information alone.
While the presented combination of head pose- and sound-based prediction is doneheuristically by choosing a weighting parameter, we expect that by using more ad-vanced and adaptive fusion methods, better combination results will be obtained. Ap-propriate fusion methods to be investigated could be to train neural networks for fu-sion of the two modalities, to determine the weighting parameters using error informa-tion of the two models or to investigate other feature dependent combinations meth-ods [Miller & Yan ’99, Woods et al. ’97, Kittler et al. ’98, Hansen & Salamon ’90].
7.3 Using Temporal Speaker Information to Pre-
dict Focus
In the previous section we demonstrated how focus of attention can be estimatedbased on speaker information alone. The computation of P (Focus|Sound) was basedon the observation which participants speak at a given moment.
It is, however, reasonable to assume that temporal information about the speakerswill affect the looking behaviour of the participants. When a new speaker starts to

82 Chapter 7 Combining Pose Tracking with Likely Targets of Attention
Head Pose only Sound only Combined
Meeting A 68.8% 57.7% 69.7 %Meeting B 73.4% 57.6% 75.3 %Meeting C 79.5% 46.9% 79.5 %Meeting D 69.8% 63.2% 70.0 %
Average 72.9% 56.3% 73.6 %
(a) Meetings with four participants
Head Pose only Sound only Combined
Meeting E 53.3% 61.1% 66.7 %Meeting F 53.0% 54.2% 63.5 %
Average 53.2% 57.7% 65.1%
(b) Meetings with five participants
Table 7.3: Focus-prediction using only head orientation, using only sound and pre-diction using both head orientation and sound.
talk, the other participants, for instance, might need some time to shift their focus ofattention to the new speaker. On the other hand, if a speaker is addressing severalpeople, he might look at everyone for a while and the probability that the speakerwill focus on the same person might decrease over time.
We assume that the prediction of the speaker’s focus of attention could benefit fromtemporal information. Thus we would like to find P (Focus|At, At−1, ..., At−N), theprobability of looking at a focus target, based on having observed a history of audioevents At, At−1, ..., At−N .
In this work we estimate P (Focus|At, At−1, ..., At−N) using neural networks. It iswell known that neural networks can be trained so as to estimate the a posterioriprobabilities of target classes, given the input to the neural nets. This can be ac-complished by using a neural network in classification mode, using a mean square er-ror criterion and a 1-of-N output representation [Richard & Lippmann ’91, Gish ’90,Bourlard & Morgan ’93].
We trained neural networks to estimate at which target person a subject is look-ing, given a history of audio-observations as input. Figure 7.1 depicts the resultingarchitecture of a neural network to predict the focus target for meetings with fourparticipants.

7.3 Using Temporal Speaker Information to Predict Focus 83
Audio Vectors
At-N t-2 At-1 tA
....
....
StraightRightLeft
A
........ Hidden Layer
Focus Target
Input:Sequence of N+1
Figure 7.1: Neural net to predict focus target based on who is speaking. A sequenceof binary vectors describing who is speaking at a given moment is used as input.
The neural net consists of an input layer of (N+1)*4 input units, corresponding tothe (N+1) audio-observation vectors, one hidden layer and three output units, corre-sponding to the three target persons that a subject can look at. As audio-observationsat each time step, again the binary audio-observation vectors ~A = (aS, aL, aC, aR),described in the previous section, were chosen.
As output representation a 1-of-N representation was used; i.e., during training theoutput corresponding to the correct target class was set to 1 and the other outputunits were set to zero. As error criterion, the commonly used mean square errorcriterion was used.
After training, such a network will approximate the a posteriori probabilitiesof the focus targets Fi given the observered audio-information At, At−1, ..., At−N :P (Focus|At, At−1, ..., At−N).
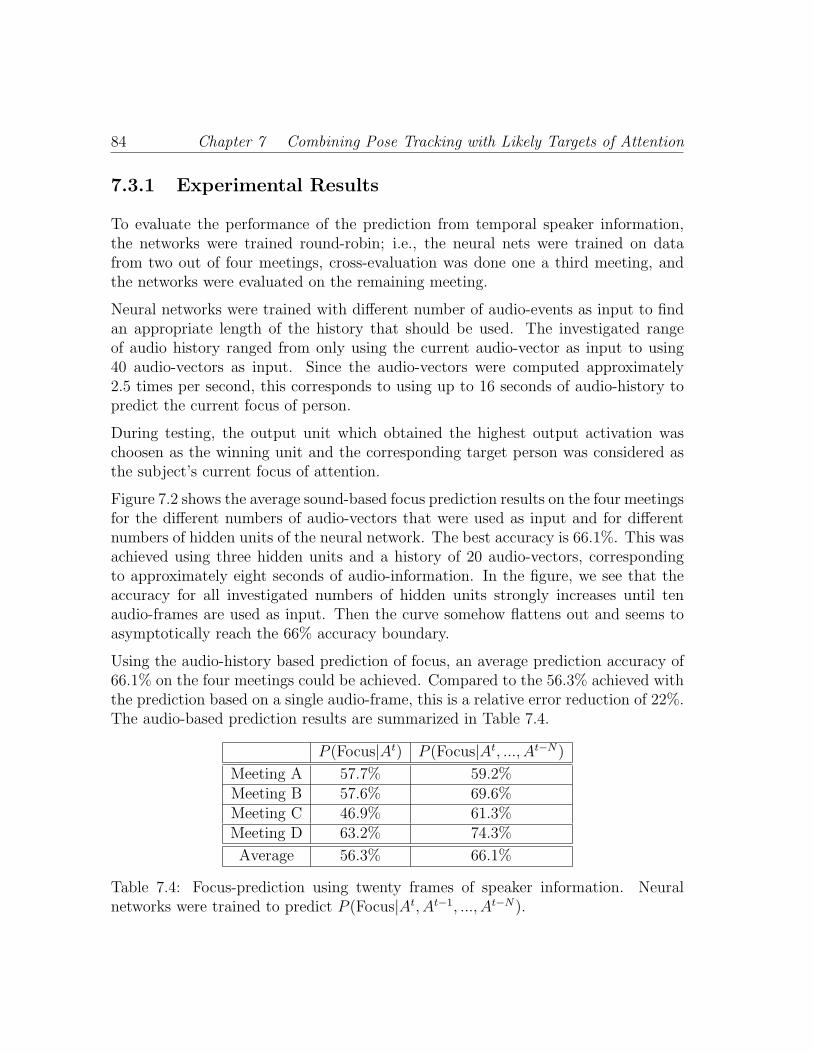
84 Chapter 7 Combining Pose Tracking with Likely Targets of Attention
7.3.1 Experimental Results
To evaluate the performance of the prediction from temporal speaker information,the networks were trained round-robin; i.e., the neural nets were trained on datafrom two out of four meetings, cross-evaluation was done one a third meeting, andthe networks were evaluated on the remaining meeting.
Neural networks were trained with different number of audio-events as input to findan appropriate length of the history that should be used. The investigated rangeof audio history ranged from only using the current audio-vector as input to using40 audio-vectors as input. Since the audio-vectors were computed approximately2.5 times per second, this corresponds to using up to 16 seconds of audio-history topredict the current focus of person.
During testing, the output unit which obtained the highest output activation waschoosen as the winning unit and the corresponding target person was considered asthe subject’s current focus of attention.
Figure 7.2 shows the average sound-based focus prediction results on the four meetingsfor the different numbers of audio-vectors that were used as input and for differentnumbers of hidden units of the neural network. The best accuracy is 66.1%. This wasachieved using three hidden units and a history of 20 audio-vectors, correspondingto approximately eight seconds of audio-information. In the figure, we see that theaccuracy for all investigated numbers of hidden units strongly increases until tenaudio-frames are used as input. Then the curve somehow flattens out and seems toasymptotically reach the 66% accuracy boundary.
Using the audio-history based prediction of focus, an average prediction accuracy of66.1% on the four meetings could be achieved. Compared to the 56.3% achieved withthe prediction based on a single audio-frame, this is a relative error reduction of 22%.The audio-based prediction results are summarized in Table 7.4.
P (Focus|At) P (Focus|At, ..., At−N)
Meeting A 57.7% 59.2%Meeting B 57.6% 69.6%Meeting C 46.9% 61.3%Meeting D 63.2% 74.3%
Average 56.3% 66.1%
Table 7.4: Focus-prediction using twenty frames of speaker information. Neuralnetworks were trained to predict P (Focus|At, At−1, ..., At−N).

7.3 Using Temporal Speaker Information to Predict Focus 85
Figure 7.2: Sound-based focus prediction results with different audio-history lengthsand different number of hidden units.
7.3.2 Combined Prediction Results
Again we can compute a combined, head orientation- and sound-based prediction bycomputing the weighted sum of P (Focus|Head Pose) and P (Focus|Sound):
P (Focus) = (1− α)P (Focus|Head Pose) + αP (Focus|At, ..., At−N).
By setting α to 0.6, we achieved an average accuracy of 75.6% on the meetingswith four participants. Table 7.5(a) summarizes the results we obtained by usingsound-only based focus prediction, head orientation-only based focus estimation andcombined estimation.
Meetings with five participants
We also trained neural networks to predict a subject’s focus of attention for themeetings with five participants. In this case a subject could look at four other par-ticipants. The output of the neural networks therefore consisted of four output unitscorresponding to the four possible targets. For the five participants case, we didn’tevaluate different network architectures, but chose five hidden units and a history of10 audio frames.

86 Chapter 7 Combining Pose Tracking with Likely Targets of Attention
Head Pose only Sound only Combined
Meeting A 68.8 59.2% 69.1%Meeting B 73.4 69.6% 77.8%Meeting C 79.5 61.3% 80.6%Meeting D 69.8 74.3% 74.7%
Average 72.9 66.1% 75.6%
(a) Meetings with four participants
Head Pose only Sound only Combined
Meeting E 51.9 65.4% 69.7%Meeting F 53.0 59.7% 68.0%
Average 52.5 62.6% 68.9%
(b) Meetings with five participants
Table 7.5: Focus-prediction using only head orientation, only sound and predictionusing both. Sound-based focus prediction is done with a neural network, using twentyframes of speaker information as input. Four persons participated in the meetings.
As in the four-participants case, the best accuracy was obtained by setting alphato 0.6. Using the focus prediction based on head pose and sound, 68.9% accuracywas achieved on the two meetings. Compared to the focus prediction accuracy of52.5% when using head orientation alone on these meetings, this is a huge increasein performance. Table 7.5(b) summarizes the results on the two meetings with fiveparticipants.
7.4 Summary
In this chapter we introduced the idea of estimating focus of attention from variouscues in addition to a subject’s head orientation.
We demonstrated that information about who is speaking is a good cue to predictthe participants focus of attention in meetings and discussed two methods how focusof attention could be probabilistically predicted based on information who is speak-ing. We showed how neural networks can be used to predict focus from temporalspeaker information. Experimental results indicate that temporal information aboutthe speakers improves sound-only based focus prediction accuracy.

7.4 Summary 87
The combination of head-orientation based and speaker-based focus of attention pre-diction lead to significantly improved accuracy of focus prediction as compared tousing one modality alone.
We think that the accuracy of focus of attention prediction can be furthermore im-proved by investigating more sophisticated fusion methods.
In addition, other cues such as movements, gesture tracking, or detecting certainkeywords in the spoken content, such as the names of the participants, could be usedin a similiar way to bias certain focus targets against others.

88 Chapter 7 Combining Pose Tracking with Likely Targets of Attention

Chapter 8
Portability
In this chapter we discuss how the presented system for focus of attention trackingcan be installed in a new location.
The focus of attention tracking experiments reported so far in this thesis were allperformed using training data and recored meetings collected in our lab at the Uni-versitat Karlsruhe. To investigate which steps are necessary to successfully move thefocus of attention tracking system to a new location, we have also installed the systemin our lab at Carnegie Mellon University in Pittsburgh, USA.
The main problem when installing the system in a new location is that the illumina-tion conditions in the new location might be completely different from the conditionsin which the training data for the neural networks for head orientation estimationwas collected. As we have already discussed in Section 4.5.2, the accuracy of headorientation estimation then seriously degrades under the new conditions.
One possibility to make the focus of attention tracking system perform well in a newlocation, is to collect training data in the new location and train a neural network forhead orientation estimation by either using only the new images for training or byusing them together with the training images that were collected in the other room.Such experiments were described in Chapter 4.5.2.
In this chapter we discuss how a neural network for head pan estimation can beadapted to work under new conditions by using some adaptation data collected in thenew location. We examine how much adaptation data is necessary to obtain reason-able focus of attention tracking performance and compare the adaptation results tothe results obtained with neural networks that are trained from scratch with the newdata.
89

90 Chapter 8 Portability
Figure 8.1: The data collection setup at CMU (see text).
8.1 Data Collection at CMU
In order to train neural networks for head pan estimation, we have collected trainingimages from twelve users in our lab at CMU (the new location).
As during the data collection in Karlsruhe, subjects had to wear a head band witha Polhemus pose tracker sensor attached to it so that true head pose could be deter-mined. Images of the person’s head were captured with an omni-directional camera asdescribed in Chapter 4 and were recorded together with the person’s head pose. Fromeach person, we collected training images at several locations around the meeting ta-ble. The data collection took about fifteen minutes for each participant. Altogetherwe collected around 27,000 training images from twelve persons.
Figure 8.1 shows an image of the data collection setup at CMU. The subject wearsa head band to which the Polhemus pose tracking sensor is attached. To the rightof the subject, the magnetic emitter is placed on a tripod. On the table, the omni-directional camera system can be seen.
8.2 Head Pan Estimation Experiments
Having collected the data at CMU we performed the following experiments:

8.2 Head Pan Estimation Experiments 91
1. First, the head pan estimation accuracy of a neural network which was trainedon images that were taken in our lab in Karlsruhe (the “UKA-net”) was deter-mined on a test set of the new data from CMU. Using the UKA-net the averageerror for head pan estimation was 19 degrees on the data from CMU.
2. New neural networks to estimate head pan were trained using increasing amountsof training data from CMU.
3. The UKA-network was adapted using increasing amounts of data from collectedat CMU.
For all experiments, we used three pre-processed facial images together as input to theneural networks: the histogram-normalized image, the horizontal edge image and thevertical edge image. Details on these pre-processing methods were given in Chapter4.
8.2.1 Training New Networks from Scratch
We first trained neural networks for head pan estimation using only the data thatwas collected at CMU. To see how much training data is necessary for reasonablegeneralization, we trained different networks using increasing subsets of the data. Toevaluate the performance of the networks, data from four subjects was kept aside asa user-independent test set.
We trained networks on images from one up to all eight subjects in the trainingset. The neural network architecture and training was identical to those used withthe networks trained with the data from Karlsruhe as described in Chapter 4. Thenetworks were trained on the training data set and a cross-evaluation set was usedto determine the number of training iterations.
Figure 8.2 shows the results obtained on the user independent test set from CMU(top curve). It can be seen that the average pan estimation error on the test set isas high as twenty degrees when only images from one subject were used for training.The pan estimation error then gradually decreases, when training images from moresubjects are added. When all eight subjects were used for training, an average panestimation error of 13 degrees was obtained.
We also trained one neural network on images on all the available twelve subjects.For training we used 80% of all the images. 10% of the images were used for cross-evaluation and the remaining 10% of the images were used as a test set. With thismulti-user network for pan estimation, we achieved an average error of 7.6 degreeson the test-set.

92 Chapter 8 Portability
10
12
14
16
18
20
22
0 1 2 3 4 5 6 7 8
Ave
rage
Err
or [d
egre
es]
Used Training Data (#Persons)
CMU onlyUKA all weights adapted
Figure 8.2: Pan estimation results on a user-independent test set from CMU. Shownare the results for networks trained from scratch with data from CMU and the re-sults of the UKA-network when all weights were adapted using the data from CMU.For both approaches, results using images from an increasing number of persons fortraining/adaptation are shown.
8.2.2 Adapting a Trained Network
We then investigated whether and how well the network which was previously trainedon data collected in Karlsruhe – the “UKA-network”’ – could be adapted to the newCMU images, by using the different training data sets from CMU for adaptation.
We adapted the UKA-net using the images from one to all eight subjects of the CMUtraining set for adaptation. The performance of the adapted networks was thenalso evaluated on the four other persons in the user-independent test-set collected atCMU.
Adapting All Weights
We first adapted the UKA-network by retraining all its weights on the different adap-tation data sets from CMU. Training was done using standard back-propagation witha learning parameter of 0.1. To determine when the adaptation process should stop,a cross-evaluation set containing images from an additional subject was used. The
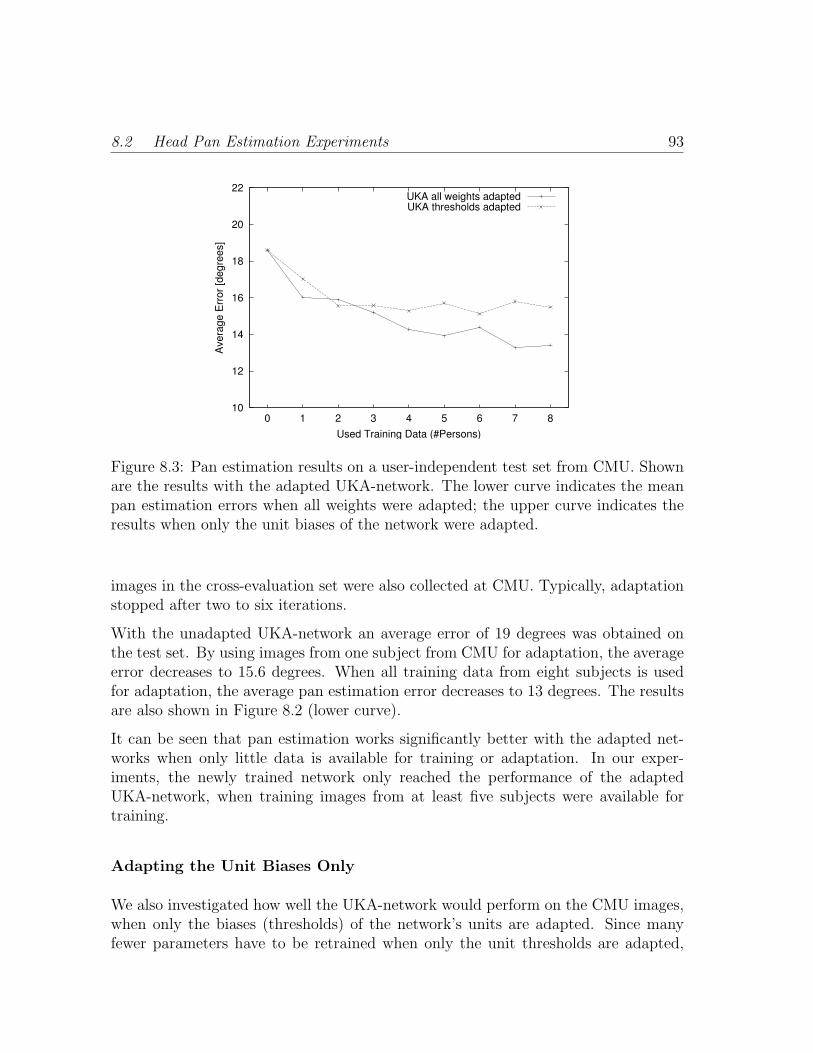
8.2 Head Pan Estimation Experiments 93
10
12
14
16
18
20
22
0 1 2 3 4 5 6 7 8
Ave
rage
Err
or [d
egre
es]
Used Training Data (#Persons)
UKA all weights adaptedUKA thresholds adapted
Figure 8.3: Pan estimation results on a user-independent test set from CMU. Shownare the results with the adapted UKA-network. The lower curve indicates the meanpan estimation errors when all weights were adapted; the upper curve indicates theresults when only the unit biases of the network were adapted.
images in the cross-evaluation set were also collected at CMU. Typically, adaptationstopped after two to six iterations.
With the unadapted UKA-network an average error of 19 degrees was obtained onthe test set. By using images from one subject from CMU for adaptation, the averageerror decreases to 15.6 degrees. When all training data from eight subjects is usedfor adaptation, the average pan estimation error decreases to 13 degrees. The resultsare also shown in Figure 8.2 (lower curve).
It can be seen that pan estimation works significantly better with the adapted net-works when only little data is available for training or adaptation. In our exper-iments, the newly trained network only reached the performance of the adaptedUKA-network, when training images from at least five subjects were available fortraining.
Adapting the Unit Biases Only
We also investigated how well the UKA-network would perform on the CMU images,when only the biases (thresholds) of the network’s units are adapted. Since manyfewer parameters have to be retrained when only the unit thresholds are adapted,

94 Chapter 8 Portability
12
13
14
15
16
17
18
19
0 5 10 15 20
Ave
rage
Err
or [d
egre
es]
#Adaption Iterations
UKA + 1UKA + 2UKA + 3UKA + 4UKA + 5UKA + 6UKA + 7UKA + 8
(a)
12
13
14
15
16
17
18
19
0 5 10 15 20
Ave
rage
Err
or [d
egre
es]
#Adaption Iterations
UKA + 1UKA + 2UKA + 3UKA + 4UKA + 5UKA + 6UKA + 7UKA + 8
(b)
Figure 8.4: Adaption results when adapting all weights (a) or unit biases only (b).Shown are the average pan estimation errors for increasing numbers of training iter-ations and using images from an increasing number of subjects for adaptation.
this approach might lead to better generalization when only little training data isavailable for adaptation.
Figure 8.3 compares the results obtained when only the unit biases of the UKA-network were adapted with the results obtained when all weights were adapted. Forboth approaches, the pan estimation results when images from more and more sub-jects were used for adaptation are shown.
It can be seen that some gain in pan estimation performance can be obtained byadapting only the unit biases. By using images from only two subjects for adapta-tion, the average error for pan estimation already decreased from 18.6 degrees to 15.6degrees. This result is in fact slightly better than the the pan estimation result thatwas obtained when all network parameters were adapted using the same training set.When more data was used for adaptation, however, no further significant improve-ment could be achieve when only the unit thresholds were adapted. Thus, adaptingall network parameters led to significantly better pan estimation results when moretraining data was available.
Figure 8.4 shows the pan estimation results on the CMU test set for increasing numberof adaptation iterations and for increasing numbers of images used for adaptation.In Figure 8.4 (a) the results when all weights are adapted are shown. It can be seenthat for all adaptation sets, the pan estimation error is close to its minimum alreadyafter two training iterations. We furthermore see, that the pan estimation error isdecreasing when images from more subjects are used for adaptation. Figure 8.4(b)shows the results when only the unit biases are adapted. Here, the learning curve

8.3 Focus of Attention Detection Results 95
40
45
50
55
60
65
70
75
80
85
90
UKA-net UKA + 1 UKA + 2 UKA + 3 UKA + 4 CMU-net
Cor
rect
FoA
[%]
Used Network
Upper LimitUnsupervised
Figure 8.5: Accuracy of focus of attention detection on a meeting recorded at CMU.Both the upper limit and the result using unsupervised adaptation of the modelparameters is indicated for the different neural networks (see text).
flattens out after nine to ten iterations for most adaptation sets containing more thanone person. We again see that the performance does not improve when more thantwo subjects are used in the adaptation set.
8.3 Focus of Attention Detection Results
To measure how well focus of attention can be estimated using the different neuralnetworks, we have collected two meetings with four participants in our lab at CMU.
The focus of attention tracking system was run on the recorded meetings with dif-ferent networks for pan estimation. For the evaluation we used the unadapted UKA-network, the UKA-networks where all weights were adapted with images from oneto four subjects and the neural network that was trained on images from all twelvesubjects in our data set from CMU.
For each network we evaluated the focus of attention detection accuracy using themixture of Gaussian approach presented in Chapter 5. All parameters of the Gaussianmixture model were adapted completely unsupervised. We also measured the upperlimit of focus of attention detection accuracy that is possible given the estimated headpan observations from the different networks (see section 5.2.3 for more details).

96 Chapter 8 Portability
40
45
50
55
60
65
70
75
80
85
90
UKA-net UKA+1 UKA+2 UKA+3 UKA+4 CMU-net UKA + 4 new
CMU + 4 new
Cor
rect
FoA
[%]
Used Network
Upper LimitUnsupervised
Figure 8.6: Accuracy of focus of attention detection on a second meeting recordedat CMU. Both the upper limit and the result using unsupervised adaptation of themodel parameters is indicated for the different neural networks (see text).
Figure 8.5 shows focus of attention detection accuracy on the first meeting for thedifferent networks used for head pan estimation. In the figure as well the unsuper-vised focus of attention detection results as the supervised upper focus of attentiondetection limits are indicated.
Using the UKA-network for head pan estimation, focus of attention could be detectedin only 60% of the time on the meeting, with a possible upper limit of 76%. Byadapting the UKA-network with data collected at CMU the performance increasesto 75% focus of attention detection accuracy when images from four subjects werein the adaptation set (“UKA + 4”). This performance is already as good as theperformance obtained with the CMU-network, which was trained on images fromtwelve subjects collected at CMU.
Figure 8.6 shows the results on the second meeting. On this meeting both the resultswith the CMU-network and the adapted UKA-networks are worse than the results onthe first meeting. Using the best adapted network – using two subjects for adaptation– we obtained 66% focus of attention detection accuracy. Using the CMU-network67% accuracy could be achieved.
This second meeting was recorded approximately two weeks after the training imagesat CMU were collected. After recording (and evaluating) the meeting, we discoveredthat the camera gain and the focus of the omni-directional camera system had been

8.4 Discussion 97
changed since the training data for the neural networks was collected at CMU. Thismost likely caused the poorer results.
In order to improve focus of attention tracking we therefore again collected trainingimages from four subjects with the current camera settings to adapt the neural net-works with the new data. Only one of the subjects from which we collected furthertraining data was a participant of this evaluation meeting. Figure 8.6 also indicatesthe obtained focus of attention tracking results obtained with the UKA-network thatwas adapted using only this new adaptation data (“UKA + new”) and the results withadapted CMU-network (“CMU + new”). With the newly adapted UKA-network,71% accuracy was obtained (78% upper limit), with the adapted CMU-network weachieved 73% accuracy, with a possible upper limit of 80%.
8.4 Discussion
In this chapter we discussed how the system for focus of attention tracking can beported to a new location. Our experiments suggest that a network which has alreadybeen trained to estimate head pan from images taken in one location can be adaptedto work in a new location and under different illumination conditions by collectinga limited number of images in the new location and adapting the networks’ weightswith the new images. In our experiments we achieved good focus of attention trackingresults in the new location by using adaptation images from only four subjects. Theseimages could be collected in approximately one hour. Our experiments also showedthat adapting an existing network for pan estimation, which has been trained on im-ages taken in different lighting and camera conditions, leads to better pan estimationresults than training networks from scratch with images from the new location whenonly a small amount of training images are available.

98 Chapter 8 Portability

Chapter 9
Focus of Attention inContext-Aware MultimodalInteraction
The components to estimate a user’s focus of attention can also be applied toother situations than meetings. To demonstrate the generality of our approach,we have applied the developed components to a human-robot interaction scenario[Stiefelhagen et al. 2001b].
Advancing human-robot interaction has been an active research field in recentyears [Perzanowski et al. 2001, Agah 2001, Koku et al. 2000, Adams et al. 2000,Matsusaka et al. ’99]. A major challenge is to develop robots that can behave likeand interact with humans. In an intelligent working space, social robots should be ca-pable of detecting and understanding human communicative cues. Tracking a user’sfocus of attention can be useful to improve human-robot interaction.
In an intelligent working space, where humans and robots may interact with eachother, information about a user’s focus of attention could for instance be useful tointerpret what object or place a person is referring to when talking with a robot, orto determine whether a person is talking to the robot or not.
We have built a prototype system to demonstrate focus of attention aware interactionwith a household robot and other smart appliances in a room using the componentsfor focus of attention tracking presented in this thesis.
Figure 9.1 outlines the idea of the demonstration system.
In the demonstration environment, a subject could interact with a simulated house-hold robot, a speech-enabled VCR or with other people in the room, and the recipient
99

100 Chapter 9 Focus of Attention in Context-Aware Multimodal Interaction
Figure 9.1: A demonstration prototype system to show focus of attention awareinteraction with several appliances in a smart room. See text for details.
of the subject’s speech was disambiguated using focus of attention tracking.
The system consisted of the following main components:
Robot Visualization For the demonstration we have simulated a robot using a 3Dvisualization toolkit and projected the robot onto one of the walls of our lab.
Speech Recognition A speaker independent large-vocabulary continuous speechrecognizer was used for understanding the users’ commands [Soltau et al. 2001].
Parser A parser based on the system described in [Gavalda 2000] was used to analyzethe hypothesis received from the speech recognition module and to generateaction commands that were sent to the robot visualization module.
Dialog Manager This module enabled the virtual robot to lead simple clarificationdialogues, if necessary information is missing.
Speech Synthesis A Speech synthesis system [Black & Taylor ’97] is used to pro-vide spoken feedback to the user.
Focus of Attention Tracker To observe the user’s focus of attention, a pan-tilt-zoom camera was placed next to the simulated robot. The face of the user wastracked in the camera image and the user’s head pose was estimated with aneural net as described in Chapter 4.

101
Communication of all the components - recording, speech recognizer, parser, dialoguemanager, visualization and focus-of-attention-tracker - was done using a client-serverarchitecture that we adapted from [Fugen et al. 2001].
For the demonstration three focus-targets were chosen: a) the robot, which wasdisplayed in the front of the user, next to the camera; b) the VCR located at the leftand c) an area right to the user, where other people in the room were located.
During an initialization phase, the user had to look at each of the three targets forwhile. During this phase, his head orientation was continuously estimated and storedto a file. From the observed head orientations during the initialization phase, theclass-conditional probability density functions of his head orientations when lookingat the three targets could then automatically be determined using the approachdescribed in Chapter 5.
After initialization, the most likely target could continously be determined basedon the user’s head orientation and the class-conditionals found during initializa-tion. Since we assumed equal priors for each of the targets, the computation ofthe most likely target could be simplified to choosing the target which maximizedclass-conditional probability for the users’ observed horizontal head orientation.
Now, whenever the user was looking towards where the VCR was placed, the focus ofattention module identified the VCR as target and the output of the speech recognizerwas sent to the the VCR.
Whenever the user was looking towards the simulated robot, the robot was chosen asthe focus target, and therefore recognized speech was directed to the robot; i.e., therobot’s parser, dialogue and visualization module, to generate appropriate actions ofthe robot simulation. Whenever the user was neither looking at the VCR nor to therobot the user’s speech was not recorded at all and neither the robot nor the VCRwere responding.
This demonstration shows how the developed components for focus of attention track-ing can be used to enhance interaction with smart appliances such as household robotor a speech enabled VCR.
In the presented demonstration, a user’s focus of attention is only used to determinethe current addressee of the user’s speech. Focus of attention, however, could alsobe used during multimodal communication to determine to what object or place aperson is referring to (“Put that there!”).
The demonstration also shows one limitation of the developed approach for attentiontracking. Within the current approach, it is assumed that the subject (the user) andthe focus targets do not change their position after an initialization phase. While

102 Chapter 9 Focus of Attention in Context-Aware Multimodal Interaction
this can be assumed for meetings, where people sit around a table, this assumptionis too restrictive when a person is interacting with appliances in a smart room. Ina smart room, the user will most likely not stand at the same position in the roomwhen he is interacting with appliances. A less restrictive system should allow theuser to move freely in a room. A possibility to overcome this problem could forinstance be to develop some sort of online-adaptation of the class-conditional headpose distributions and to use a 3D model of the scene and the interesting targets init in order to facilitate the detection of the correct focus target based on the user’shead orientation at a give position in the room.

Chapter 10
Conclusions
This thesis has addressed the problem of tracking focus of attention of participantsin meetings. In this we work we studied why and how focus of attention tracking inmeetings could be beneficial. To our knowledge, this is the first work presenting asystem capable of tracking focus of attention in meetings.
In our system, focus of attention of each meeting participant is estimated based onhis or her head orientation. We have discussed relevant literature suggesting thathead orientation is a reliable cue for detecting to whom someone is attending. Inaddition we have experimentally demonstrated that head orientation can be used topredict where a person is attending in meetings. A user study has has been conductedinvestigating how precisely focus of attention can be predicted in a meeting with fourparticipants by using only the participants’ head orientation. The user study clearlydemonstrated that head orientation is a very reliable cue to detect to whom someoneis attending. In the meetings which we recorded for this study, we were able tocorrectly determine at whom the subject was looking 89% of the time based solelyon the subject’s head orientation.
In order to build a working system to track the participants’ focus of attention basedon their head orientation, the following problems were addressed in this thesis:
1. Detecting and tracking the locations and the faces of all the participants in ameeting.
2. Estimating each participants’ head orientation from facial images.
3. Building a general probabilistic framework to determine at whom each partici-pant is looking based on his or her observed head orientation.
103

104 Chapter 10 Conclusions
In the system developed an omni-directional camera is used to capture the scenearound a meeting table. Participants and their faces are detected and tracked usinga skin-color based face tracker.
To estimate participants’ head orientations, a neural network-based system for esti-mating head orientations has been developed. We have demonstrated that this systemis capable of predicting head orientation from both high- and low-resolution imagesthat were obtained from an omni-directional camera. With a multi-user system thatwas trained to estimate head orientations of 12 different users from images taken withan omni-directional camera, an average error in estimating horizontal head rotationof only 3.1 degrees was obtained. On new users we achieved an average error of9.5 degrees for estimating horizontal head orientation. Using higher-resolution facialimages, an average error of 7.1 degrees could be obtained for new users. This com-pares favorably with the results obtained with other vision-based head orientationestimation systems reported in the literature.
A major contribution of this thesis is the design of a probabilistic framework todetermine at which target a person is attending, based on his or her head orientation.With the proposed model, we estimate the a-posteriori probability that a person islooking at a certain target, given the subject’s observed head pose. Furthermore, wehave presented an approach as to how the underlying class-conditional probabilitydensity functions and priors can be adapted in an unsupervised, data-driven way,given that the number of possible targets at which the subject might have beenlooking is known. The proposed approach automatically adapts to different numbersof participants and to different locations of the participants relative to each other. Wehave experimentally evaluated this focus of attention detection approach on severalrecorded meetings, each containing four or five participants. On the meetings withfour participants 72% accuracy in detecting the correct focus of attention of eachparticipant could be achieved. On meetings with five participants, 53% accuracycould be achieved.
Another important contribution of this thesis is the investigation of whether a per-son’s focus of attention in meetings can be predicted based on information aboutwho is speaking. Our work demonstrates that information about who is speaking isa good cue to predict where participants are looking. On our recorded meetings withfour participants we have demonstrated that the participants’ focus of attention canbe predicted based only on information about which participants are speaking at agiven moment. Based on this information, we were able to correctly predict focusof attention 56% of the time. In addition we have demonstrated that this sound- orspeaker-based prediction can be significantly improved by also taking into accountwho was talking before a given moment. By training neural networks to predict fo-cus of attention based on a time window of information about who was speaking,

10.1 Future Work 105
sound-based prediction of focus could be increased to 66% accuracy on the recordedmeetings.
Finally, we have shown that head pose-based and sound-based prediction of focus ofattention can be combined in order to get an improved accuracy of focus of attentiondetection. By combining the head pose-based and sound-based posterior probabilitiesof the different targets, we have achieved 77% accuracy in detecting focus of attentionon the recorded meetings with four participants. This amounts to a relative errorreduction of 18% compared to using only head orientation for prediction (72% accu-racy). On the meetings with five participants the accuracy achieved by combiningboth methods resulted in 69% accuracy versus 63% accuracy using only sound and53% using only head orientation for focus estimation.
The presented system for focus of attention tracking has been successfully installedin both our labs at the Universitat Karlsruhe, Germany and at Carnegie Mellon Uni-versity in Pittsburgh, USA. A problem when porting the system to a new locationis the need for appropriate training images for the neural network based approachfor head orientation estimation. We have therefore investigated how a neural net-work for head pan estimation can be adapted to work under new conditions by usingsome adaptation data collected in the new location. We have examined how muchadaptation data is necessary to obtain reasonable performance and have comparedthe adaptation results to the results obtained with neural networks that are trainedfrom scratch with the new data. Our experiments showed that adaptation imagesfrom only four subjects were sufficient to achieve good focus of attention detectionaccuracy in a new location with completely different illumination conditions.
Tracking a user’s focus of attention could also be useful for several other appli-cation areas such as gaze-aware human-computer interaction, shared collaborativeworkspaces or psychological experiments where monitoring a subject’s focus of atten-tion might be of interest.
To demonstrate how our approach for focus of attention tracking can be used toenhance multimodal human-computer interaction, we have integrated the developedcomponents into a prototype system for multimodal focus-aware human computerinteraction in a smart room. In the demonstration scenario, we showed how focus ofattention tracking can be used to determine which of several possible speech-enabledappliances the user addressed.
10.1 Future Work
The work presented in this thesis could lay the foundation for many future studies.

106 Chapter 10 Conclusions
The investigation of how focus of attention can be used for the analysis and the betterunderstanding of meetings opens new research directions. A number of suggestionshow focus of attention can be used here have been given in this study: to deliverdeictic information, which is often missing in the spoken content; to monitor activityand attentiveness of participants; perhaps focus of attention could also be a good cuefor the classification and analysis of meeting types and discourse segments.
Focus-of-attention-tracking could be used in many ways to enhance human-computerinteraction. A straightforward example is given in this thesis. There, focus of at-tention is used to disambiguate between a number of possible target applications,which can be controlled via speech. However, many other uses could be thought of(dimming room lights when a user is looking at the TV screen for a while, switchingon and off computer displays based on the user’s focus, ...).
This work has presented a first system for focus of attention tracking in meetings.The developed system of course has several limitations which should be addressed infuture work:
In order to reliably estimate head orientation from facial images, unoccluded andmore or less correctly extracted facial images are necessary. As we have discussedin Chapter 3, our – and probably any other – automatic face detection method willsometimes wrongly detect outliers as a face, such as a subject’s hands for example;sometimes only parts of a face are detected, for example due to extreme shadow inthe face; in other cases, the face might be occluded by the subject’s hand or arms forexample. In order to reliably estimate the subject’s head orientation, such outliersshould be detected automatically in the future.
The current approach to estimate a person’s focus of attention target assumes thatthe locations of the subject and the target persons remains relatively stable, which istrue for the meetings we evaluated and which is likely to be a reasonable assumptionfor many meetings. For other applications of focus of attention tracking, such asfor focus-aware human-computer interaction in smart rooms, we, however, cannotassume the user to remain standing at the same location when interacting with smartappliances. For such scenarios, the current approach will have to be extended.

Bibliography
Abowd Gregory D., Atkeson Chris, Feinstein Ami, Hmelo Cindy,Kooper Rob, Long Sue, Sawhney Nitin, Tani Mikiya (1996). Teachingand Learning as Multimedia Authoring: The Classroom 2000 Project. In Pro-ceedings of the ACM Multimedia’96 Conference, pp. 187–198, November 1996.
Adams B., Breazeal C., Brooks B.A., Scassellati B. (2000). Humanoidrobots: a new kind of tool. IEEE Intelligent Systems, 15(4):25–31.
Agah A. (2001). Human interactions with intelligent systems: research taxonomy.Computers and Electrical Engineering, 27(1):71–107.
Argyle Michael, Cook Mark (1976). Gaze and Mutual Gaze. Cambridge Uni-versity Press.
Argyle Michael (1969). Social Interaction. Methuen, London.
ARR (). Arrington Research. http://www.arringtonresearch.com/.
Ascension (). Ascension Technology Corporation. http://www.ascension-tech.com/.
ASL (). Applied Science Laboratories. http://www.a-s-l.com/.
Baker S., Nayar S. K. (1998). A Theory of Catadioptric Image Formation. InProceedings of the 6th International Conference on Computer Vision , ICCV98, pp. 35–42, Bombay, India, January 1998.
Baldwin D. (1991). Infants’ contribution to the achievement of joint reference.Child Development, 62:875–890.
Ballard Dana H., Brown Christopher M. (1982). Computer Vision. PrenticeHall, New Jersey.
107

108 BIBLIOGRAPHY
Baluja Shumet, Pomerleau Dean (1994). Non-Intrusive Gaze Tracking UsingArtificial Neural Networks. Technical Report CMU-CS-94-102, Carnegie MellonUniversity, 1994.
Barber P.J., Legge D. (1976). Perception and Information, chapter 4: Informa-tion Acquisition. Methuen, London, 1976.
Bett Michael, Gross Ralph, Yu Hua, Zhu Xiaojin, Pan Yue, Yang Jie,Waibel Alex (2000). Multimodal Meeting Tracker. In RIAO 2000 : Content-Based Multimedia Information Access, pp. 32–45, Paris, France, April 2000.
Beymer D., Shashua A., Poggio T. (1993). Example-based Image Analysis andSynthesis. Technical Report TR-1431, MIT AI Lab, 1993.
Bishop Christopher M. (1995). Neural Networks for Pattern Recognition. Claren-don Press.
Black A.W., Taylor P. (1997). The Festival Speech Synthesis System: systemdocumentation. Technical Report, Human Communication Research Center,University of Edinburgh, UK, 1997.
Black M., Brard F., Jepson A., Newman W., Saund E., Socher G., Tay-lor M. (1998). The Digital Office: Overview. In Proceedings of the 1998 AAAISpring Symposium on Intelligent Environments, volume AAAI Technical Re-port SS-98-02. AAAI, AAAI Press, March 1998.
Bourlard H., Morgan N. (1993). Connectionist Speech Recognition. KluwerAcademic Publishers, Boston.
Broadbent D. E. (1958). Perception and communication. Pergamon Press, London.
Brumitt B., Krumm J., Meyers B., Shafer S. (2000a). Let There Be Light:Comparing Interfaces for Homes of the Future. IEEE Personal Communica-tions.
Brumitt B., Meyers B., Krumm J., Kern A., Shafer S. (2000b). EasyLiv-ing: Technologies for Intelligent Environments. In Handheld and UbiquitousComputing, September 2000.
Burroughs W., Schultz W., Aubrey S. (1973). Quality of argument, leader-ship roles and eye contact in three person leaderless groups. Journal of SocialPsychology, 90:89–93.

BIBLIOGRAPHY 109
Calhoun Gloria L., McMillan Grant R. (1998). Hands-free input devices forwearable computers. In Proceedings of Fourth Annual Symposium on HumanInteraction with Complex Systems, pp. 118–123. IEEE, 1998.
Cascia M. La, Isidoro J., Sclaroff S. (1998). Head tracking via robust regis-tration in texture map images. In Proceedings of the Conference on ComputerVision and Pattern Recognition, Santa Barbara, CA, 1998.
Cherry E.C. (1957). On human communication: A review, a summary and acriticism. MIT Press, Cambridge, MA.
Cranach von M. (1971). The role of orienting behaviour in human interaction. InEsser A. H. (Eds.), Environmental Space and Behaviour. Plenum Press, NewYork, 1971.
Drees A. (1995). Visuelle Erkennung von Handstellungen mit neuronalen Netzen.PhD Thesis, Univ. Bielefeld, Germany, 1995.
Emery N.J. (2000). The eyes have it: the neuroethology, function and evolution ofsocial gaze. Neuroscience and Biobehavioral Reviews, 24:581–604.
Encyclopaedia Britannica, 2002. http://www.britannica.com.
Eriksen C. W., Yeh Y. Y. (1985). Allocation of attention in the visual field. Jour-nal of Experimental Psychology: Human Perception and Performance, 11:583–597.
Exine R.V., Winter L.C. (1966). Affect, Cognition and Personality, chapterAffective relations and mutual glances in dyads. Tavistock, London, 1966.
Frey L. A., K. P. White jr., Hutchinson T. E. (1990). Eye-gaze word pro-cessing. IEEE Transactions on Systems, Man and Cybernetics, 20(4):944–950.
Fugen Christian, Westphal Martin, Schneider Mike, Schultz Tanja,Waibel Alex (2001). LingWear: A Mobil Tourist Information System. InProceedings of the of the First International Conference on Human LanguageTechnology (HLT 2001), San Diego, March 2001.
Gavalda M. (2000). SOUP: A parser for Real-World Spontaneous Speech. InProceedings of the 6th International Workshop on Parsing Technologies, IWPT-2000, Trento, Italy, February 2000.
Gee Andrew H., Cipolla Roberto (1994). Non-Intrusive Gaze Tracking forHuman-Computer Interaction. In Proc. Mechatronics and Machine Vision inPractise, pp. 112–117, 1994.
110 BIBLIOGRAPHY
Gee Andrew H., Cipolla Roberto (1995). Fast Visual Tracking by TemporalConsensus. Technical Report CUED/F-INFENG/TR-207, University of Cam-bridge, February 1995.
Gips J., Olivieri P., Tecce J. (1993). Direct control of the computer throughelectrodes placed around the eyes. In Porceedings of the Fifth InternationalConference on Human-Computer Interaction, 1993.
Gish Herbert (1990). A probabilistic approach to the understanding and trainingof neural network classifiers. In Proceedings of IEEE Conference on AcousticsSpeech and Signal Processing, pp. 1361–1364, 1990.
Glenstrup Arne John, Engell-Nielsen Theo (1995). Eye Controlled Me-dia: Present and Future State. Technical Report, University of Copenhagen,http://www.diku.dk/users/panic/eyegaze/, 1995.
Goodwin Charles (1981). Conversational Organization: Interaction betweenSpeakers and Hearers. New York: Academic Press.
Gopher Daniel (1990). The Blackwell dictionary of Cognitive Psychology, chapterAttention, pp. 23–28. Basil Blackwell Inc., 1990.
Gross Ralph, Bett Michael, Yu Hua, Zhu Xiaojin, Pan Yue, Yang Jie,Waibel Alex (2000). Towards a Multimodal Meeting Record. In IEEE In-ternational Conference on Multimedia and Expo, pp. 1593–1596, 2000.
Hansen L.K., Salamon P. (1990). Neural network ensembles. IEEE Transactionson Pattern Analysis and Machine Intelligence, 12:993–1001.
Haralick R. B., Joo H., Lee C-N., Zhuang X., Vaidya V.G., Kim M. B.(1989). Pose estimation from corresponding point data. IEEE Transactions onSystems, Man, and Cybernetics, 19(6):1426–1445.
Heinzmann Jochen, Zelinsky Alexander (1998). 3-D Facial Pose and GazePoint Estimation using a robust real-time tracking paradigm. In InternationalConference on Face and Gesture Recognition, pp. 142–147, Nara, Japan, April,14-16 1998.
Hunke Martin, Waibel Alex (1994). Face Locating and Tracking for Human-Computer Interaction. In Twenty-Eight Asilomar Conference on Signals, Sys-tems and Computers, Monterey, California, November 1994.

BIBLIOGRAPHY 111
Hutchinson T. E., K. P. White jr., Martin W. N., Reichert K. C., FreyL. A. (1989). Human-computer interaction using eye-gaze input. In IEEETransaction on Systems, Man, and Cybernetics, volume 19, pp. 1527–1534,1989.
iReality (). iReality.com, Inc. http://www.genreality.com/.
ISC. (). Iscan Inc. http://www.iscaninc.com/.
Itti L., Koch C. (2000). A saliency-based search mechanism for overt and covertshifts of visual attention. Vision Res., 40(10-12):1489–1506.
Itti L., Koch C., Niebur E. (1998). A model of saliency-based visual-attentionfor rapid scene analysis. IEEE Transactions on Pattern Analysis and MachineIntelligence.
Jacob R. J. K. (1993). Eye-movement-based human-computer interaction tech-niques. In Hartson H. R., Hix D. (Eds.), Advances in Human-ComputerInteraction, volume 4, pp. 151–190. Ablex Publishing Corporation, Norwood,NJ, 1993.
Jacob R. J. K. (1995). Eye tracking in advanced interface design. In BarfieldW., Furness T. A. (Eds.), Virtual Environments and Advanced Interfaces,pp. 258–288. Oxford University Press, New York, 1995.
James William (1890/1981). The Principles of Psychology. Harvard UP, Cam-bridge,MA.
Jebara T.S., Pentland A. (1997). Parametrized structure from motion for 3Dadaptive feedback tracking of faces. In Proceedings of Computer Vision andPattern Recognition, 1997.
John Hertz Richard G. Palmer, Anders Krogh (1991). Introduction to theTheory of Neural Computation. Addison-Wesley.
J.W.Tankard (1970). Effects of eye position on person perception. Perc. Mot.Skills, (31):883–93.
Kittler J., Hatef M., Duin R.P.W., Matas J. (1998). On combining classifiers.IEEE Transactions on Pattern Analysis and Machine Intelligence, 20:226–239.
Kleinke C. L., Bustos A. A., Meeker F. B., Staneski R. A. (1973). Effects ofself-attributed and other-attributed gaze in interpersonal evaluations betweenmales and females. Journal of experimental social Psychology, (9):154–63.

112 BIBLIOGRAPHY
Koch C., Ullman S. (1985). Shifts in selective visual attention: towards theunderlying circuitry. Human Neurobiology, 4:219–227.
Koku A.B., Sekmen A., Alford A. (2000). Towards socially acceptable robots.In Proceedings of 2000 IEEE International Conference on Systems, Man andCybernetics, pp. 894–899, 2000.
Kwong J., Gong S. (1999). Learning support vector machines for a multi-view facemodel. In Pridmore T., Elliman D. (Eds.), 10 th British Machine VisonConference, volume 2, pp. 503–512, Notthingham, UK, Sept. 1999.
LaBerge D. (1983). Spatial extent of attention to letters and words. Journal ofExperimental Psychology: Human Perception and Performance, 9:371–379.
Langton Stephen R.H., Watt Roger J., Bruce Vicki (2000). Do the eyeshave it? Cues to the direction of social attention. Trends in Cognitive Neuro-science, 4(2):50–58.
Langton Stephen R. H. (2000). The mutual influence of gaze and head orien-tation in the analysis of social attention direction. The Quaterly Journal ofExperimental Psychology, 53A(3):825–845.
LCT (). LC Technologies. http://www.eyegaze.com/.
Maglio Paul P., Matlock Teenie, Campbell Christopher S., ZhaiShumin, Smith Barton A. (2000). Gaze and speech in attentive user inter-faces. In Proceedings of the International Conference on Multimodal Interfaces,volume 1948 from LNCS. Springer, 2000.
Matsusaka Y., Tojo T., Kubota S., Furukawa K., Tamiya D., HayataK., Nakano Y., Kobayashi T. (1999). Multi-person conversation via multi-modal interface -A robot who communicate with multi-user-. In Proc. Eu-rospeech 99, volume 4, pp. 1723–1726, Sep. 1999.
Meier Uwe, Stiefelhagen Rainer, Yang Jie (1997). Preprocessing of visualspeech under real world conditions. In Proceedings of European Tutorial &Research Workshop on Audio-Visual Speech Processing, pp. 113–116, 1997.
Meier Uwe, Stiefelhagen Rainer, Yang Jie, Waibel Alex (1999). Towardsunrestricted Lipreading. In Tang Y. (Eds.), Proceedings of the Second In-ternational Conference on Multimodal Interfaces, Hong Kong, China, January1999.
BIBLIOGRAPHY 113
Meier Uwe, Stiefelhagen Rainer, Yang Jie, Waibel Alex (2000). TowardsUnrestricted Lipreading. International Journal of Pattern Recognition and Ar-tificial Intelligence, 14(5):571–785.
Meyering A., Ritter H. (1992). Learning 3-D-shape perception with local linearmaps. In Proceedings of the International Joint Conference on Neural Networks,Baltimore, MD, 1992.
Miller David J., Yan Lian (1999). Critic-driven ensemble classification. IEEETransactions on Pattern Analysis and Machine Intelligence, 47(10):2833–2844.
Mozer Michael (1998). The neural network house: An Environment that adaptsto its Inhabitants. In Intelligent Environments, Papers from the 1998 AAAISpring Symposium, number Technical Report SS-98-92, pp. 110–114. AAAI,AAAI Press, 1998.
Ong Eng-Jon, McKenna Stephen, Gong Shaogang (1998). Tracking HeadPose for Inferring Intention. In Procceedings ECCV 98 Workshop on Perceptionof Human Action, University of Freiburg, Germany, June 1998.
Pentland A., Moghaddam B., Starner T. (1994). View-based and Modu-lar Eigenspaces for Face Recognition. In Proceedings of IEEE Conference onComputer Vision and Pattern Recognition, 1994.
Perret D.I., Emery N.J. (1994). Understanding the intentions of others fromvisual signals: neurophysiological evidence. Cahiers de Psychologie Cognitive,13:683–694.
Perzanowski D., Schultz A.C., Adams W., Marsh E., Bugajska M.(2001). Building a multimodal human-robot interface. IEEE Intelligent Sys-tems, 16(1):16–21.
Polhemus (). http://www.polhemus.com.
Pomerleau Dean (1992). Neural Network Perception for Mobile Robot Guidance.PhD Thesis, Carnegie Mellon University, Pittsburgh, PA, February 1992.
Posner M. I., Snyder C.R.R., Davidson B.J. (1980). Attention and the detec-tion of signals. Journal of Experimental Psychology: General, 109:160–174.
Rae Robert, Ritter Helge J. (1998). Recognition of Human Head Orientationbased on Artificial Neural Networks. IEEE Transactions on neural networks,9(2):257–265.

114 BIBLIOGRAPHY
Rao R.P.N., Zelinsky G.J., Hayhoe M.M., Ballard D.H. (1995). Model-ing Saccadic Targeting in Visual Searchd. In Advances in Neural InformationProcessing Systems 8 (NIPS 95). MIT Press, 1995.
Richard M. D., Lippmann R. P. (1991). Neural network classifiers estimateBayesian a posteriori probabilities. Neural Computation, 3:461–483.
Ries Klaus, Waibel Alex (2001). Activity Detection for Information Access toOral Communication. In Proceedings of the of the First International Con-ference on Human Language Technology Conference (HLT 2001, San Diego,March 2001.
Rosenblum M., Yacoob Y., Davis L.S. (1996). Human Expression Recognitionfrom Motion Using a Radial Basis Function Network Architecture. IEEE Trans.on Neural Networks, 7(5):1121–1138.
Rowley H. A., Baluja S., Kanade T. (1995). Human face detection in visualscenes. Technical Report CMU-CS-95-158R, CMU, 1995.
Rowley Henry A., Baluja Shumeet, Kanade Takeo (1998). Neural Network-Based Face Detection. IEEE Transactions on Pattern Analysis and MachineIntelligence, 20(1):23–38.
Ruusuvuori Johanna (2001). Looking means listening: coordinating displays ofengagement in doctor-patient interaction. Social Science & Medicine, 52:1093–1108.
Salvucci Dario D. (1999). Inferring Intent in Eye-Based Interfaces: Tracing EyeMovements with Process Models. In Human Factors in Computing Systems:CHI 99, 1999.
Schiele Bernt, Waibel Alex (1995). Gaze Tracking Based on Face-Color. InInternational Workshop on Automatic Face- and Gesture-Recognition, pp. 344–348, 1995.
Schneiderman Henry, Kanade Takeo (2000). A Statistical Method for 3DObject Detection Applied to Faces and Cars. In IEEE Conference on ComputerVision and Pattern Recognition, pp. 746–751, 2000.
Shiffrin R., Schneider W. (1977). Controlled and automatic human informationprocessing: II. Perceptual learning, automatic attending, and a general theory.Psychological Review, 84:127–190.
SMI (). SensoMotoric Instruments. http://www.smi.de/.

BIBLIOGRAPHY 115
Soltau Hagen, Schaaf Thomas, Metze Florian, Waibel Alex (2001). TheISL Evaluation System for Verbmobil - II. In ICASSP 2001, Salt Lake City,May 2001.
SRR (). SR Research. http://www.eyelinkinfo.com/.
Stiefelhagen Rainer, Yang Jie (1997). Gaze Tracking for Multimodal Human-Computer Interaction. In Proceedings of International Conf. on Acoustics,Speech, and Signal Processing, April 1997.
Stiefelhagen Rainer, Zhu Jie (2002). Head Orientation and Gaze Direction inMeetings. In Conference on Human Factors in Computing Systems (CHI2002),Minneapolis, April 2002.
Stiefelhagen Rainer, Yang Jie, Waibel Alex (1996). A Model-Based GazeTracking System. In Proceedings of IEEE International Joint Symposia onIntelligence and Systems, pp. 304 – 310, 1996.
Stiefelhagen Rainer, Meier Uwe, Yang Jie (1997a). Real-Time Lip-Trackingfor Lipreading. In Proc. of Eurospeech, Rhodes, Greece, 1997. lipreading, liptracking.
Stiefelhagen Rainer, Yang Jie, Waibel Alex (1997b). A Model-BasedGaze Tracking System. International Journal of Artificial Intelligence Tools,6(2):193–209.
Stiefelhagen Rainer, Yang Jie, Waibel Alex (1997c). Tracking Eyes andMonitoring Eye Gaze. In Workshop on Perceptual User Interfaces, Banff,Canada, October 1997.
Stiefelhagen Rainer, Finke Michael, Yang Jie, Waibel Alex (1998a).From Gaze to Focus of Attention. In Turk Matthew (Eds.), Proceedings ofWorkshop on Perceptual User Interfaces: PUI 98, pp. 25–30, San Francisco,CA, November, 4-6th 1998.
Stiefelhagen Rainer, Yang Jie, Waibel Alex (1998b). Towards TrackingInteraction Between People. In Intelligent Environments. Papers from the 1998AAAI Spring Symposium, Technical Report SS-98-02, pp. 123–127, Menlo Park,California 94025, March 1998. AAAI, AAAI Press.
Stiefelhagen Rainer, Finke Michael, Yang Jie, Waibel Alex (1999a).From Gaze to Focus of Attention. Lecture Notes in Computer Science,1614:761–768.

116 BIBLIOGRAPHY
Stiefelhagen Rainer, Finke Michael, Yang Jie, Waibel Alex (1999b).From Gaze to Focus of Attention. In Huijsmans D. P., SmeuldersA. W. M. (Eds.), Visual Information and Information Systems, Third Inter-national Conference, VISUAL ’99, number 1614 in Lecture Notes in ComputerScience, pp. 761–768. Springer, June 1999.
Stiefelhagen Rainer, Yang Jie, Waibel Alex (1999c). Modeling Focus ofAttention for Meeting Indexing. In Proceedings of ACM Multimedia ’99, pp.3–10. ACM, 1999.
Stiefelhagen Rainer, Yang Jie, Waibel Alex (2000). Simultaneous Trackingof Head Poses in a Panoramic View. In International Conference on PatternRecognition, volume 3, pp. 726–729, September 2000.
Stiefelhagen Rainer, Yang Jie, Waibel Alex (2001a). Estimating Focus ofAttention based on Gaze and Sound. In Workshop on Perceptive User Interfaces(PUI’01), Orlando, Florida, November 2001.
Stiefelhagen Rainer, Yang Jie, Waibel Alex (2001b). Tracking Focus of At-tention for Human-Robot Communication. In IEEE-RAS International Con-ference on Humanoid Robots - Humanoids 2001, 2001.
Stiefelhagen Rainer, Yang Jie, Waibel Alex (2002). Modeling Focus ofAttention for Meeting Indexing based on Multiple Cues. IEEE Transactionson Neural Networks. Special Issue on Intelligent Multimedia Processing.
Stiefelhagen Rainer (1996). Gaze Tracking for Multimodal Human Computer In-teraction. Master’s thesis, Universitat Karlsruhe (Technische Hochschule), Ger-many, http://werner.ira.uka.de/ISL.multimodal.publications.html, July 1996.Diplomarbeit.
Sung K., Poggio T. (1994). Example-based learning for view-bawsed human facedetection. Technical Report 1521, MIT AI Lab, 1994. face detection.
Theeuwes J. (1993). Visual selective attention: A theoretical analysis. Acta Psy-chologica, 83:93–154.
Turk Matthew A., Pentland Alex (1991). Face recognition using eigenfaces. InIEEE Conference on Computer Vision and Pattern Recognition, pp. 586–591,Maui, HI, USA, 1991.
Vertegaal Roel, Slagter Robert, Veer van der Gerrit, Nijholt Anton(2001). Eye gaze patterns in conversations: There is more to conversationalagents than meets the eyes. In SIGCHI’01, Seattle, March 2001. ACM.

BIBLIOGRAPHY 117
Vioal Paul, Jones Michael (2001). Rapid Object Detection using a BoostedCascade of Simple Features. In Proceedings of the 2001 IEEE Computer So-ciety Conference on Computer Vision and Pattern Recognition - CVPR 2001,volume 1, pp. 511–518, 2001.
Waibel Alex, Bett Michael, Finke Michael, Stiefelhagen Rainer (1998).Meeting Browser: Tracking and Summarizing Meetings. In Penrose DeniseE. M. (Eds.), Proceedings of the Broadcast News Transcription and Under-standing Workshop, pp. 281–286, Lansdowne, Virginia, February. 8-11 1998.DARPA, Morgan Kaufmann.
Waibel Alex, Bett Michael, Metze Florian, Ries Klaus, SchaafThomas, Schultz Tanja, Soltau Hagen, Yu Hua, Zechner Klaus(2001a). Advances in Automatic Meeting Record Creation and Access. InICASSP 2001, Salt Lake City, May 2001.
Waibel Alex, Yue Hua, Soltau Hagen, Schultz Tanja, Schaaf Thomas,Pan Yue, Metze Florian, , Bett Michael (2001b). Advances in MeetingRecognition. In Proceedings of the Human Technology Conference, San Diego,2001.
Wohler C., Aulanf J. K., Portner T., Franke U. (1998). A time delayneural network algorithm for real-time pedestrian recognition. In Int. Conf.Intelligent Vehicle, Germany, 1998.
Wolfe J. (1994). Guided Search 2.0: A Revised Model of Visual Search. Psycho-nomic Bulltetin and Review, 1(2):202–238.
Woods K., W.P. Kegelmeyer Jr., Bowyer K. (1997). Combination of mul-tiple classifiers using local accuracy estimates. IEEE Transactions on PatternAnalysis and Machine Intelligence, 19:405–410.
Wyszecki G., Styles W. S. (1982). Color Science: Concepts and Methods, Quan-titative Data and Formulae. John Wiley and Sons, New York, second edition.
Yang Jie, Waibel Alex (1996). A real-time face tracker. In Proceedings of WACV,pp. 142–147, 1996.
Yang Jie, Stiefelhagen Rainer, Meier Uwe, Waibel Alex (1998a). Real-Time Face and Facial Feature Tracking and Applications. In Proceedingsof Auditory-Visual Speech Processing Conference, pp. 79–84, Terrigal, SouthWales, Australia, December 1998.

118 BIBLIOGRAPHY
Yang Jie, Stiefelhagen Rainer, Meier Uwe, Waibel Alex (1998b). VisualTracking for Multimodal Human Computer Interaction. In Karat Clare-Marie, Karat John, Horrocks Ian (Eds.), Human Factors in Comput-ing Systems: CHI 98, pp. 140–147, Los Angeles, CA, USA, April 1998. ACMSIGCHI, Addison-Wesley Pub. Co.
Yang Jie, Zhu Xiojin, Gross Ralph, Kominek John, Pan Yue, WaibelAlex (1999). Multimodal People ID for a Multimedia Meeting Browser. InProceedings of ACM Multimedia ’99. ACM, 1999.
Yarbus A. L. (1967). Eye movements during perception of complex objects. InRiggs L.A. (Eds.), Eye Movements and Vision, pp. 171–196. Plenum Press,New York, 1967.
Zhao L., Thorpe C. (1999). Stereo and Neural Network-Based Pedestrian Detec-tion. In Proc. Int’l Conf. on Intelligent Transportation Systems, Tokyo, Japan,October 1999.