tracker reconstruction softwareperformance review, oct 16, 2002 core software “performance...
Post on 20-Dec-2015
213 views
TRANSCRIPT

Tracker Reconstruction Software
Performance Review, Oct 16, 2002
Core SoftwareCore Software“Performance Review”“Performance Review”
TkrReconTkrReconHow do we know the Tracking is working?How do we know the Tracking is working?
GLAST Core SoftwareWednesday, Oct 16, 2002
The TkrRecon Group

Tracker Reconstruction Software
Performance Review, Oct 16, 2002
2
Is the Tracking working?Is the Tracking working?
YES!

Tracker Reconstruction Software
Performance Review, Oct 16, 2002
3
How well is the Tracking is working?How well is the Tracking is working?
We know the tracking is working to a certain level:– The event display tells us we are not that far off most of the time– We can make basic distributions of TkrRecon output quantities– Output from merit doesn’t crash– More importantly, see Bill Atwood’s presentation from last week
• Studies of track fits with muons• Studies of 100 MeV gammas• Some initial PSF plots
– Gut feeling is that base performance already better than PDR
Detailed studies of TkrRecon performance are in the early stages– Simulation/Digitization – See Leon’s talk– Track Finding/Fitting
• Working towards details of “requirements” (using Monte Carlo information)• Developing tools to help understand the performance of different algorithms
– Vertexing/gamma reconstruction• PDR inspired reconstruction working well• Working on developing new techniques
– Algorithm timing

Tracker Reconstruction Software
Performance Review, Oct 16, 2002
4
Event DisplayEvent Display
1 GeV downward going muon
Launch point at z = 1000
Generated into a cone – 0.8 < cos(theta) < 1.

Tracker Reconstruction Software
Performance Review, Oct 16, 2002
5
Event DisplayEvent Display
100 MeV downward going gamma
Launch point at z = 1000 Generated into a cone
– 0.8 < cos(theta) < 1.

Tracker Reconstruction Software
Performance Review, Oct 16, 2002
6
McHits from Default MuonsMcHits from Default Muons
muon
positron
electron
photon

Tracker Reconstruction Software
Performance Review, Oct 16, 2002
7
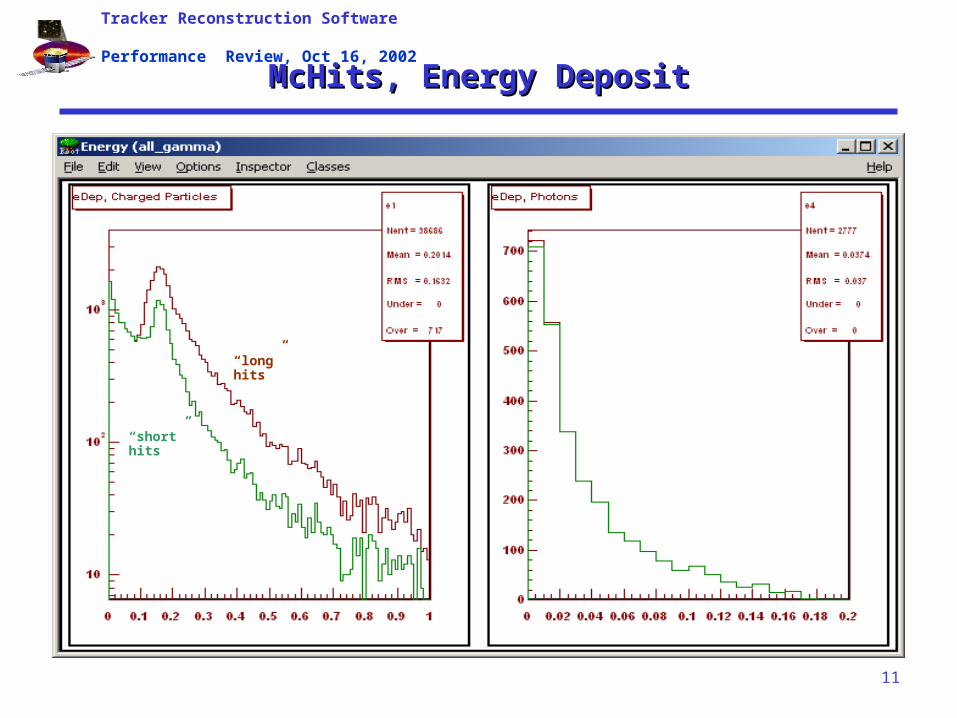
McHits, Energy DepositMcHits, Energy Deposit
“long” hits
“short” hits

Tracker Reconstruction Software
Performance Review, Oct 16, 2002
8
McHits, Fit to Landau DistributionMcHits, Fit to Landau Distribution

Tracker Reconstruction Software
Performance Review, Oct 16, 2002
9
ClustersClusters

Tracker Reconstruction Software
Performance Review, Oct 16, 2002
10
McHits from All_gammaMcHits from All_gamma
electron
positron
photon
Tracker Reconstruction Software
Performance Review, Oct 16, 2002
11
McHits, Energy DepositMcHits, Energy Deposit
“long” hits
“short” hits
“long” hits

Tracker Reconstruction Software
Performance Review, Oct 16, 2002
12
McHits, Fit to Landau DistributionMcHits, Fit to Landau Distribution

Tracker Reconstruction Software
Performance Review, Oct 16, 2002
13
ClustersClusters
Tracker Reconstruction Software
Performance Review, Oct 16, 2002
14
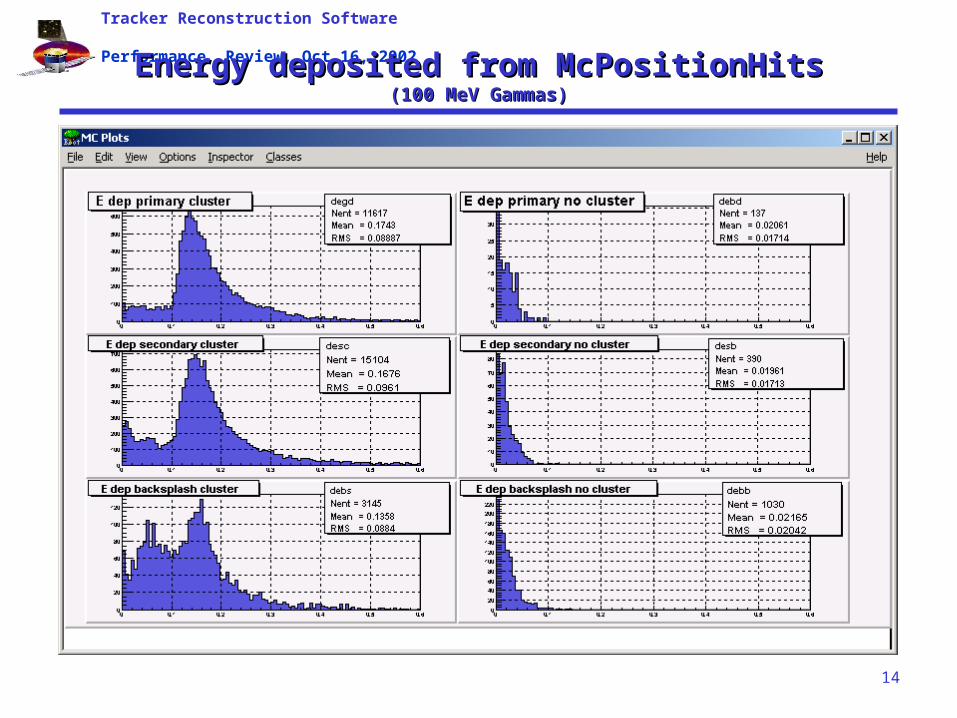
Energy deposited from McPositionHitsEnergy deposited from McPositionHits(100 MeV Gammas)(100 MeV Gammas)

Tracker Reconstruction Software
Performance Review, Oct 16, 2002
15
An Aside – Backsplash ClustersAn Aside – Backsplash Clusters(100 MeV Gammas)(100 MeV Gammas)
Geant4 with default settings100 MeV Downward going gammas
Clusters from backsplash <0.5%

Tracker Reconstruction Software
Performance Review, Oct 16, 2002
16
Total Energy deposited in clusters Total Energy deposited in clusters (100 MeV Gammas)(100 MeV Gammas)

Tracker Reconstruction Software
Performance Review, Oct 16, 2002
17
TkrRecon – Basic Recon Plots TkrRecon – Basic Recon Plots

Tracker Reconstruction Software
Performance Review, Oct 16, 2002
18
TkrRecon / Monte Carlo Comparisons TkrRecon / Monte Carlo Comparisons 100 MeV Gammas100 MeV Gammas
Blue is Recon
Red is MC

Tracker Reconstruction Software
Performance Review, Oct 16, 2002
19
TkrRecon / Monte Carlo ComparisonsTkrRecon / Monte Carlo Comparisons100 MeV Gammas100 MeV Gammas
Blue is MC
Red is Recon

Tracker Reconstruction Software
Performance Review, Oct 16, 2002
20
TkrRecon Algorithm TimingTkrRecon Algorithm Timing
~10 ms resolution Reconstruction time dominated by Track Finding (No surprise)

Tracker Reconstruction Software
Performance Review, Oct 16, 2002
21
TkrRecon Algorithm TimingTkrRecon Algorithm Timing(100 MeV Gammas)(100 MeV Gammas)
****************************************************************************************************
*****Chrono***** INFO The Final CPU consumption ( Chrono ) Table (ordered)
*****Chrono***** INFO
****************************************************************************************************
TkrVertexTime INFO Time User : Tot= 0.51 [s] Ave/Min/Max= 173(+-1.3e+03)/ 0/ 1e+04 [us] #=2946
TkrClusterTime INFO Time User : Tot= 7.2 [s] Ave/Min/Max= 2.44(+- 4.3)/ 0/ 10 [ms] #=2946
TkrSimpleDigiAl... INFO Time User : Tot= 15 [s] Ave/Min/Max= 3.01(+- 4.63)/ 0/ 40 [ms] #=5000
TkrFitTime INFO Time User : Tot= 23 [s] Ave/Min/Max= 7.8(+- 7.27)/ 0/ 50 [ms] #=2946
TkrFindTime INFO Time User : Tot= 19.2[min] Ave/Min/Max= 390(+- 665)/ 0/ 1.03e+04 [ms] #=2946
TkrReconTime INFO Time User : Tot= 19.7[min] Ave/Min/Max= 401(+- 670) /0/ 1.04e+04 [ms] #=2946
TkrReconAlg:exe... INFO Time User : Tot= 19.7[min] Ave/Min/Max= 401(+- 670)/ 0/ 1.04e+04 [ms] #=2946
Tkr:execute INFO Time User : Tot= 19.7[min] Ave/Min/Max= 401(+- 670)/ 0/ 1.04e+04 [ms] #=2946
ChronoStatSvc INFO Time User : Tot= 23.3[min]
#= 1
*****Chrono***** INFO
****************************************************************************************************

Tracker Reconstruction Software
Performance Review, Oct 16, 2002
22
Output from MeritOutput from Merit(100 MeV Gammas)(100 MeV Gammas)
Layers 0-11
Events used : 1566
eff. proj. sigma : nan deg = nan arc-min
68% contained : 4.65 deg = nan*(1.51*sigma)
95% contained : 19.3 deg = nan*(2.45*sigma)
Energy: meas/gen : 0.26
std : 0.161
events w/ no data : 9
effective area : 9396 cm^2
Figure of merit : -2147483648 cm-------------------------------------------------------
Found in tuple : 2946
Generated energy--mean : 0.1
rms : 2.22321e-08
min : 0.1
max : 0.1
Elapsed time (sec): : 663.216
TKR_No_Tracks>0 : 2822
Accepted for analysis : 2822
-------------------------------------------------------
Layers 12-15
Events used : 1256
eff. proj. sigma : 4.7 deg = 282 arc-min
68% contained : 8.54 deg = 1.2*(1.51*sigma)
95% contained : 24.7 deg = 2.15*(2.45*sigma)
Energy: meas/gen : 0.478
std : 0.201
events w/ no data : 14
effective area : 7536 cm^2
Figure of merit : 1058 cm
-------------------------------------------------------
total effective area : 16932 cm^2
Combined FOM : -2147483648 cm