tracer transport in fractures: analysis of field data based on a
TRANSCRIPT

PROJECT 9114
Tracer Transport in Fractures:Analysis of Field Data Based on aVariable — Aperture Channel Model
C-F. TsangY.W. TsangFV. Hale
LBL, University of California, Berkeley, USA
June 1991
TECHNICAL REPORTAn OECD/NEA International project managed by:SWEDISH NUCLEAR FUEL AND WASTE MANAGEMENT CODivision of Research and Development
Mailing address:Box 5864, S-102 48 Stockholm. Telephone: 08-665 28 00

TRACER TRANSPORT IN FRACTURES: ANALYSISOF FIELD DATA BASED ON A VARIABLE-
APERTURE CHANNEL MODEL
C.F. TsangY.W. TsangF.V. Hale
LBL, University of California, Berkeley,USA
June 1991
This report concerns a study which was conducted for the StripaProject. The conclusions and viewpoints presented in the reportare those of the authors, and do not necessarily coincide withthose of the client.
A list of other reports published in this series is attached atthe end of the report. Information on previous reports is avail-able through SKB.

ABSTRACT
A variable-aperture channel model is used as thebasis to interpret data from a. three-year tr-.«c rtransport experiment in t'rectured rocks. Th? o?t-.come from the sc-called Stripa-3D sxpcin »nvperformed by Mc-v-etnieks and cowor^ers. Within theframework of the variable-aperture Civnnel conceptualmodel, tracers are envisioned HE travelling along anumber of varias2e-aperture I low channels, vhcseproperties sre related to the mean b and standarddeviation C5u of the fracture aperture distribution.
T we methods are developed to address tl)e presence ofstrong time variation of the tracer \nj«vjtior> flowrate in this experiment. The rirtt approximates theearly part of the injection history bv an exponentialdecay fraction and is applicabDe to the early timetracer breakrhrough data. The se:ond is adecor*volution »netl.od involving the us» of Toeplitzlatrices and Is applicable ove.-.. the complete periodof variable injection of th'- tracers. Both methodsgivo consistent results. These results include not
only estimates o£ o ?>r.d O, but .Iso ranges of Pecletrn.inhers, dispersiA'ity and cin estimate of the numbero: channels involved -~o tb*- tracer transport. Ani ^resting arc. surprising observation is that thef c i indicate that the P^clet: number increases with.i mean travel time; i.e., dispersivity decreasing\'.h moan travel time. This trend is consistent with.jiculatsd results of tracer transport in multiple7? riabJe-aparture fractures in series. The meaning of•t nis trend is discussed in terms of the strongheterogeneity of the flow system.

Ill
TABLE OF CONTENTS
Page
ABSTRACT ii
1 INTRODUCTION 1
2 A SUMMARY OF STRIPA 3D EXPERIMENT 3
3 A SUMMARY OF THE VARIABLE-APERTURE CHANNEL MODEL 4
4 DATA ANALYSIS METHODS 7
4.1 ANALYSIS OF FIRST PEAK EARLY ARRIVAL DATA S
4.2 TOEPLITZ ANALYSIS OF TRACER DATA 11
5 DISCUSSION 16
6 SUMMARY AND CONCLUSIONS 20
7 ACKNOWLEDGMENTS 21
8 REFERENCES 22

INTRODUCTION
Tracer transport in fractured media is quitedifferent from that in porous media. The latter isoften studied as a homogeneous three-dimensional (3D)flow and transport problem. For the former, on theocher hand, if the matrix permeability is negligiblysmall compared to the fracture permeability, the flowand transport are in two-dimensional (2D) planes(representing fractures) in a highly heterogeneousthree-dimensional space. A representative elementaryvolume may be defined for a homogeneous porousmedium, but for fracture systems a representativeelementary volume usually cannot be defined.Furthermore, recent experimental studies /Abelin etal., 1985, 1987; Bourke, 1987/ have demonstrated thatchanneling effects occur in flow in the fractureplane. Thus the whole fracture plane is not uniformlyconductive to water, but majority of flow occurs inflow paths of least resistance (or channels) . Withall these special features, tracer transport infracture systems is a subject of active research,both experimental and theoretical.
One of the most comprehensive, multi-year tracertransport experiments in fractured rocks wasperformed by Neretnieks and co-workers /Neretnieks,1987; Abelin et al., 1987/ in the Stripa Mine inSweden over the years 1984-1987. The experiment,commonly referred to as the Stripa-3D Experiment,unveiled a number of interesting and importantcharacteristics of flow and transport in fracturedsystems. In this paper we are mainly concerned withthe analysis of these tracer data.
Since the conventional three-dimensional homogeneousporous model is not an appropriate representation ofthe fracture system, a new theoretical approach hasto be adopted as a basis for the analysis of Stripa-3D data. A number of approaches for transport infractured media have beer, proposed in the literature/Endo et al., 1984; Robinson, 1984; Schwartz andSmith, 1988/. In this paper we extend and apply avariable-aperture channel model /Tsang and Tsang,1987; Tsang et al., 1988; Tsang and Tsang, 1989/ asthe basis for the analysis of the Stripa-3D data.

In the experiment, due to various constraints, thetracer injection flow rates are strongly fluctuating.We developed two analytic methods to take this intoaccount. The first method, representing a preliminaryand crude analysis, considers only the early timeportion of the data where the injection can beapproximated by an exponential decay function,followed by a constant rate. An analytic solution tosuch a case is fitted to the early part of the tracerbreakthrough curves to obtain estimates for both thedispersion coefficient and the mean transportvelocity. The second method applies a deconvolutionprocedure to the variable injection flow rate and thecorresponding tracer breakthrough curves to obtainthe equivalent breakthrough curves for a deltafunction pulse injection. Both analytic methods willbe developed below.
The purpose of the paper is three-fold. First, wewould like to study the usefulness of the recentlydeveloped variable-aperture channel conceptual modelfor the analysis of transport data in fractures.Second, we develop th« necessary analytic tools andcomputer codes for such an analysis. Third, we obtainestimates for the parameters which characterizetransport in the Stripa system of fractures.

A SUMMARY OF STRIPA-3D EXPERIMENT
Details of the Stripa-3D experiment are given byNeretnieks /1987/ and Abelin, et al. /1987/. Theexperiment was carried out in the Stripa mine in twodrifts in the form of a cross, as shown in Figure 2-la. The longer drift is 75 m long and the shorterintersecting drift is 25 m long. Each drift is 4.5 min width and 3 m in maximum height. Three verticalboreholes are drilled into the ceilings of thedrifts; and in these boreholes nine packered offsections (1 m long) were identified as having largeenough local hydraulic conductivity to be suitablefor tracer injection. Nine tracers were used and weredistributed among the three boreholes as shown inFigure 2-lb. These tracers were collected in over 300plastic sheets of 1x2 m each, covering the ceilingand sides of the drifts. The flow rates at thecollection plastic sheets are approximately constantin time, indicating that steady state flow conditionsprevail. However, the majority of these sheets didnot receive significant flow, and tracer mass tendedto concentrate at discrete regions of the drift (seeFigures 2-2a and 2-2b).
Only five of the nine tracers are found insignificant concentrations in the different plasticcollection sheets during the first 30 months of theexperiment. These were eosin B, eosin Y, uranine,elbenyl and iodine. The apparent linear transportdistances ranged from 10 m to 45 m. Figure 2-3 showsthe injection flow rates as a function of time. Thetracer breakthrough into the sheets is localized to asmall number of sheets around the X location of 24 to36 m, where X is measured along the axis of thelonger drift. This is illustrated in Figures 2-4a and2-4b, where the tracer mass return rate over all thesheets as a function of time is plotted and comparedwith the tracer mass return rate over only the sheetsbetween X = 24 to 36 m. It is apparent that nearlyall the tracer mass is collected in this limitedsection.

A S OMMAR Y OF THE VARIABLE-APERTURE CHANNE1,MODEL
The concept of flow channels was introduced to thestudy of fractured rocks by Neretnieks and coworkers/Neretnieks, 1983, 1987; Abelin et a l . , 1985/ basedon their experiments in single and multiple fracturesin Stripa. Motivated by this, Tsang and Tsang /1987/developed the model in which transport throughfractured rocks is controlled by a number ofchannels, each of which has variable apertures alongi ts length. These variable apertures define anaperture probability distribution function whichdescribes the aperture distribution over the two-dimensional plane of a single fracture Later, Tsangand Tsang /1989/ pointed out that these channels arenot physical pipes in the fracture plane, but thatthey arise directly from the wide range of aperturesdistributed over each fracture. Figure 3-1 showsschematically a square section of fracture with aspatial distribution of apertures (Fig. 3-la) and theflow channeling that results by imposing a potentialdifference from left to right (Fig. 3-lb). In Figure3-lb, the thickness of lines is made arbitrarilyproportional to the square root of the flow ratealong the flow path. Thus flow channeling ismanifested by the occurrence of a few tortuouschannels, each of which is composed of a number offlow paths of comparable mean velocities.
Flow and transport through a system of fractures canthen be envisioned as occurring through thesetortuous channels of flow paths from fracture tofracture in the three-dimensional space (Fig. 3-2).These channels may intersect each other within afracture plane and also between fractures whenfractures intersect in a fracture network. Thehydraulic conductivity of each channel is controlledby constrictions along the channel, and which istherefore not directly related to the volume oraverage aperture value of the channel. Transport inthe system is then hypothesized to be dependent onthe aperture probability density distribution with amean aperture value b and a spread or standarddeviation Gb, and on the spatial arrangement of theapertures characterized by the spatial correlationlength X.

In many tracer transport experiments the measuringscale is such that the transport distances cover onlya few fracture spacings in a fracture network, inwhich case transport can be studied as flow through anumber of fractures in series. A large number offractures may be generated by a geostatistical methodwith a specified aperture probability densitydistribution and a spatial correlation length, andthe local flow rates in each of these fractures maybe solved separately following our earlier model/Moreno et al. 1988/. Then the fracture may be put inseries, satisfying the continuity requirement thatthe identical total flow rate must occur in eachfracture. Particle tracking is then carried out inthe series of fractures. This conceptualization offracture-in-series calculations requires theintersection between two fractures to be anequipotential line, which is a reasonableapproximation based on the common observation inmines and drifts that the most conductive zone oftenoccurs at intersection of fractures /Abelin et al.,1987/. We have carried out calculations for two,three, four, and up to 100 fractures in series. Thelarger numbers of fractures are of theoreticalinterest only, since for that many fractures the 3Dfracture network effect starts to dominate, andthereby invalidating the fracture in seriesapproximation.
The flow results for two fractures in series areshown in Fig. 3-3, where the channeling from fractureto fracture is clearly shown. Now let us introducetracer particles on the left side of the series offractures and measure tracer breakthrough on theright. If observation is over only a small window onthe right-hand edge of the fractures, the observedtracer breakthrough will depend sensitively on thewindow location, with the maximum concentrationranging from zero to a large amount and with verydifferent dispersion characteristics. However, if theobservation window is larger, or in other words, aspatial average is taken over a tracer emergence lineor surface, the variation of the dispersionproperties is reduced drastically /Tsang, 1989/. Itwas demonstrated that this averaging should be over
two or three spatial correlation iengths X. Thedispersion value of such averaged tracer breakthroughmay then be related to fracture aperture parameters band Ob /Tsang et al., 1988/. In data analysisdiscussed below, the spatial averaging is done bysumming the products of the concentration of a

particular tracer and the instanteous flow rate ateach collection sheet, and then dividing by the sur?.of flow rates from all the contributing collectionsheets. In this way, we arrive at one breakthroughcurve for each tracer, averaged over the collectionsheets, as shown in Figure 2-4.
For a breakthrough curve where the concentration isplotted against time, the quantity (t(0.9)-t (0.1))/t(0.5) is a measure of the dispersion, wheret (p) denoting the time when a fraction, p, of themaximum tracer concentration arrives at the exitline. An interesting result for the calculateddispersion in the breakthrough for a system offractures in series is shown in Figure 3-4 where weplot the value of (t (0 .9)-t(0.1))/t(0.5) versus thenumber of fractures in series traversed by thetracer. A decrease of this dispersion measure isfound with travel distance and hence, travel time.One possible physical explanation for this trend isas follows. Before the 3D network effect becomesimportant the characteristic dispersive lengthdepends only on O b and X. These parameterscharacterize the fracture apertures in a singlefracture and are assumed to be applicable to all thefractures in series. The dispersion of advectivetransport is then a measure of the different possiblepaths a tracer particle can t=ike in traveling fromthe injection to the observation locations, and anincrease in travel distance implies that each ofthese paths would sample a better statistical averageof the variations. Thus travel times along thesepaths become more and more similar and a decrease ofdispersion with travel distance is expected. Thisholds true only when tracer transport distance isless than a certain number of fracture spacings inthe fracture network, prior to the setting in of 3Dnetwork effect, at which point we would expect themeasure of dispersion to increase again. The numberof fractures for which the fracture in series pictureis applicable is not yet well established and a MonteCarlo calculation is underway to define it. Ourpreliminary results show that the number may be ofthe order of 5 to 8, depending on the ratio offracture size to fracture spacing.

DATA ANALYSIS METHODS
We proceed to study and analyze the Stripa-3D databased on the insight gained from the variable-aperture channel model. The model suggests that wecan consider the tracers to travel along severaltortuous channels in a three-dimensional space, eachof which is composed of a number of flow paths ofcomparable but not identical mean velocities, thusgiving rise to some kind of dispersion within the•flow channel'. Of the flow paths which make up thechannel, each flow path has variable apertures alongits length. No dispersion (Taylor dispersion) isconsidered within each flow path, and we have ignoredpossible matrix diffusion and chemical retardationprocesses with the implicit assumption that thetracers used are conservative over the relativelysmall travel times (as compared with the time frameof matrix diffusion and chemical retardationprocesses), so that these are not significantfactors. Furthermore, we assume that the traveldistances cover only a few fracture spacings so thatthe 3D fracture network effects are not important.Under all these assumptions, flow velocities anddispersion measures of these ID channels will beobtained and will be shown to be related to eachother and to the basic fracture parameters b and Cb,characterizing the variable-aperture channel model.
Our conceptual model of the Stripa-3D experiment isas follows. Because the underground drift ismaintained at atmospheric pressure, it is a majorsink for water from the rock around it. The largerange of aperture values in the fractures gives riseto flow channeling so that the majority of flow takesplace in only selected flow paths of least flowresistance which comprise only a small fraction ofthe total 3D flow region. When a tracer is injectedat a particular location in the flow field, theresultant solution moves downstream along thesepreferred flow paths toward the drift and emerges ina number of plastic collection sheets. From theexperimental measurements we do not have knowledge ofthe actual flow paths connecting the tracer injectionand the particular collection sheet of traceremergence. However, from the time dependence of thetracer collection, it will be shown below that we can

8
identify channels or groups of flow paths which havecomparable residence times.
At Stripa, dilution of the injected tracers isclearly present because the tracer injection flowrate q is much smaller than the total exit flow ratesat the drift, and also, while the injection flow rateis strongly varying, the collection flow rate isfairly constant over time. Because of the unknowndilution effect of the channel flow, the absolutevalue of the concentration of the breakthrough curveswill not be investigated, and actually this is notneeded to obtain the relevant parameters such as meanand standard deviation of aperture values along theflow paths which govern and characterize theadvective transport in the fractured medium. In ouranalysis below, we used the rate of tracer massaccumulation as the observed quantity rather than themore commonly used tracer concentration.
Thus in this conceptual picture, one has a flowchannel with emerging flow rate Q at the collectionlocation while tracer is injected with a given massper unit time at an upstream location. The tracermass injected per unit time is proportional toinjection flow rate q if the injected tracerconcentration is constant, as is the case in thisexperiment. Assuming that the one-dimensionaladvective-diffusive transport equation holds in theID channels, well knov.*n analytic solutions areavailable for the analysis of tracer transport data.The main complication with the present data set isthe strong temporal variation of the tracer injectionflow rate (Figure 2-3). Two approaches are developedto address this, which are described in the next twosubsections.

4 . 1 ANALYSIS OF FIRST PEAK EARLY ARRIVAL DATA
The injection flow rate data (Figure 2-3) varystrongly with time, but all of the early time datadisplay a sharp decline which may be closelyapproximated by an exponential r- -:ay and then aperiod of stabilization (see Figure 4-1). As apreliminary analysis of Stripa 3D field data, westudy this early part of injection data and thecorresponding early part of the tracer breakthroughcurves. The early time injection input may be writtenas:
'Co
constant = e~at° t > to (4.1)
where C^ is the concentration of injected solute at
the injection point and CQ = Ci(t=0). The time t o is
chosen to be the time at which the injection flowrate is near the first major minimum. Then the
parameter a is obtained by fitting the area under thecurve q(t)/q0 to that of field data over the intervalt = 0, to. Sensitivity studies show that the analysisresults are not sensitive to the exact values of t0
chosen so long as t o is larger than the time at firstminimum and the early drop of q(t)/q0 values isreasonably reproduced. An analytic solution of theadvective-diffusive equation for the injection rategiven by Equation (4.1) is available /see, e.g.,Javandel et al., 1984/; it is
C(x,t) = Coe'at Ax(x,t) 0 < t < to
C(x,t) = C0[e-a t A1(x,t)-e~a t A1(x,t-to>+e~ato
A2(x,t-to)] for t 0 < t (4.2)
where

Ai(x,t) =Lv+UJ
x(v-U)
e 2D erfc
10
x-Ut
x(v+U)+ r_v_| e 2D erfc
Lv+UJx+Ut
LV4DTJ
L2DaJ
A2(x,t) = 1/2 erfc x-vtLV3DT.
(xvt)2
x+vt
and
U = Vv2 - 4Da.
Th2 solution has two parameters: the mean flowvelocity in the channel v, and the channellongitudinal dispersion coeffcient D arising from theslightly different velocities of the various flowpaths that comprise the channel. Figure 4-2 displaysthis solution for a fixed value of v = .01 m/hr and
as a function of D which ranged from 10~4 to 1 m2/hr.The range of values used for D yields either real orimaginary values for U, but they all result in realvalues for Al. The calculational procedure involvesthe realization that equation (4.2) contains terms of
the form ea<erfc(b), where a and b are complexnumbers. For certain values of parameters the complexcomplementary error function in this term can take onvery small values while the exponential function verylarge values. Hence the evaluation of this term iscarried out by regrouping the factors:
e a erfc(b)
where
w(ib) = erfc(b).
The function w(z) may be evaluated either with alibrary subroutine or a continued fractionapproximation. Figure 4-2 shows the special case thatC^/CQ = 0 for t>t0. The broadening of the break-through curves with increasing long tail as the valueof D increases is clearly displayed. The longitudinaldispersion coefficient D controls the shape (or

11
sp ad) of the early part of the breakthrough curves,wh_ie the mean tracer transport velocity v determinesthe arrival time of the first concentration peak inthe breakthrough curve. These two parameters areadjusted to match the early-time data of the measuredtracer arrival breakthrough curves by an iterativeprocess using initial guess values. The early timedata used for fitting covers the data points up tothe first peak. A typical fit is shown in Figure 4-3.The results for the five tracers are given in Table4-1, which also shows the apparent linear distance Xfrom injection point to the weighted center of exitlocations in the drift ceiling, and the arrival timeof the first peak tp.
From the fitted D and v values obtained one maycalculate the mean arrival time, t, corresponding toa delta pulse injection at time t=0, where t is givenby /see e.g., Robinson, 1984/.
V V2
The dispersivity a and Peclet number Pe arecalculated according to the formulae.
a = D/V
and
Pe = vx/D,
and they are listed in Table 4-1. The dispersivityvalues from the five tracer injection tests rangefrom 1.8 to 6.8 m, and the corresponding Pe values,from 3.0 to 24. A further discussion of these resultswill be given later.
4.2 TOEPLITZ ANALYSIS OF TRACER DATA
To analyze the full time range of tracer breakthroughdata for the variable injection flow rate, we resortto a deconvolution method similar to that used insignal processing and information theories and to theunit hydrograph method of surface hydrology /Eaglesonet al., 1966; Dreiss, 1982; Neuman and de Marsily,1976/. We have developed a simplified formulationwhich is particularly suited to discretized data. Themethod, given below, assumes that the system responseis linear and that it is stable with time.

12
Let the variable tracer incremental injection massflow rate mj be discretized so that mj=(qCi)j, wherej is the index for successive times and q is thetemporally variable tracer input flow rate (L3/T) andC± is the constant input concentration (dimension
M/L3) . Let M^ be the discretized incremental tracermass breakthrough at the observation location, wherei is again the index for successive times. For eachinput element mj at time tj, we may define a unitresponse function a. j which gives the observedbreakthrough (QC)i=Mi at time t^. In general, foreach j, there is a range of i values for which a^j isnonzero. Since the response function should be in-variant to time translation (i->i+n and j->j+n), a^jshould only be a function of t^-tj, i.e., aij=ai_.j.Hence the matrix a.^ may be completely defined by acolumn vector a^_j. Furthermore, the response time i,should always be later than input time j due tocausality, so that a^j = 0 if i<j . Then for all theinput elements mj, the output M^ is given by thesuperposition:
•i-Ij
(4.3)
where
aij ~ij ~ ai+n,j+n
= 0 if i
and
The a^j defined this way is the Toeplitz matrix/Gohberg, 1982; Gray, 1977/, which has theinteresting property that it can be completelydefined by a column vector. It can be shown thatequation (4.3) may be rewritten with the response ofthe system, a, represented by a vector, and theinjection rate, m, represented as a Toeplitz matrix:
mj = m
and
is'
misas

13
In matrix form, this equation may be denoted by
M = m-a (4.5)
so that
a = m"1 M (4.6)
The vector a. is the unit response function or tracerbreakthrough curve (whose elements are aj with indexj denoting the time sequence) due to a unit deltafunction pulse tracer injection at t = 0. For ahomogeneous ID porous medium, the response aj issimply the Green's function to an advective diffusiveequation for the unit delta function source /see e.g.Kreft and Zuber, 1978/:
(4.7)
where R is a constant proportional to the initialmass injected per unit channel cross-section area atthe input location. For a fractured medium with flowchanneling, the reponse aj will display multiplepeaks as illustrated in Figure 4-4. Each of thesepeaks can be described by Equation (4.7).
In principle, given the input tracer injectionvariable function and the measured tracerbreakthrough curves, they can be discretized intotime-stepped values to form the column vectors m andH respectively. Then the Toeplitz matrix m can beformed from the vector m. by setting m^j=ms, where s =i-j. Then equation (4.6) can be solved for a. directlyand exactly.
In practice, however, both m_ and M. containmeasurement errors, and these errors may easilymultiply in the solution for a, and negative valuesof a^ are sometimes obtained. To ensure that a± arepositive, as they should be on physical grounds, andto reduce the influence of erro; ,, we go back toequation (4.4) and employ a least square fit method.
N
s=l
(4.8)
where as may be adjusted within the positive-value
domain to minimize the function f(as). As a further

14
practical step, if the fir.-1 of tracer arrival timei? denoted by the index s.,, we can set all as = 0where s<so and take them out of the fitting andmir.imizaticn process.
We have applied the above procedure to the five setsof tracer aata under study. Data were digitized toaveraging steps of 500 hours. We have also USP'1
averaging steps of 1000 hours in a sensitivity stuwhi-:h shows little effect en the final solution. 1this procedure, equation (4.6) is first solved toobtain an initial set of guess solutions for as, andany negative as values obtained are arbitrarily setto a very small positive value. The equation (4.8) isthen minimized with the condition that as must bepositive. Stable unique solutions for as were foundin all cases. The results of the deconvolutionprocedures are shorn in Figures 4-5 to 4-9, with thecircles denoting the derived response of thefractured medium to a unit delta function pulseinjection
To test the stability of these solutions to errors inbreakthrough data, ron-systematic random errors wereintroduced into the discretized data up to 20% oftheir value. Figure 4-10 shows the results of thestudy, where aj obtained from 50 realizations ofthese data sets with randomized errors are shown.Very similar results in aj were obtained.
The data aj in Figures 4-5 to 4-9 clearly unveil themultiple channel nature of the tracer transport inthe Stripa-3D data. Over the range of distances andobservation time periods, eosin-B apparently has fourmajor channels, while the other tracers have twochannels each. Note that we have defined a channel asa group of nearby flow paths with comparable meanvelocities. These results were obtained by applyingthe Toeplitz analysis to the mean concentrationbreakthrough curves averaged over all the collectionsheets where the tracer arrived. The same analysiswas also applied to tracer breakthrough curves for afew specific collection sheets at a single X distancealong the experimental drift. The same patterns asthose shown in Figures 4-5 - 4-9 are obtained. Inother words, take the example of eosin B, the four-channel pattern shown in Figure 4-5 is also found ifone applies Toeplitz analysis to only sheets at X =27 or only to those at X = 43 m. Thus the channels donot correspond to different flow tubes arriving at

15
different collection sheets, but rather all sheetsappear to display the same multi-channel structure intheir respective tracer breakthrough curves.
To quantitatively characterize the channels, we fitthe solution cf the ID advective diffusive equationwith a delta function tracer injection, given byequation (4.7), to each of these peaks in Figures 4-5to 5-9. That is, the data in these figures are fittedto
(4.9)
where we have allowed v and D in Equation (4.7) to bedifferent for different channels and denoted themwith the subscript n. Thus v and D for each channelare obtained, and a Peclet number is derived for eachchannel as before. The results are tabulated in Table4-2. The results point out (1) indeed the variable-aperture channel model seems to be confirmed by theStripa-3D data, with travel distances from 1C-43 mand mean travel times from 2600 to 16000 hours; (2)the number of channels involved in tracer transportat this site under conditions of this set ofexperiments ranges from two to four, (3) dispersivityvalues range from very small to 2.9m.

16
DISCUSSION
In the last section we showed that afterdeconvolution, the tracer breakthrough curvescorresponding to delta function input displaymultiple peaks. We calculated the Peclet numbercorresponding to each peak. This is in contrast tothe usual practice which involves the calculation ofPeclet: number and dispersion for the tracerbreakthrough curve in its entirety for a deltafunction tracer injection. In that case the Pecletnumber would be much smaller and dispersion larger.Tn the discussion of Peclet number below it is to beemphasized that we do not refer to the Peclet numberin the usual sense, but to the Peclet number for eachchanneled transport within the framework of thechannel model. In examining Table 4-1 and Table 4-2,we do not find a clear simple dependence of Pe numberwith the apparent linear travel distance over therange studied. However, if we plot Pe against themean travel time from results obtained by bothmethods of analysis we find an interesting behavior.Figure 4-11 shows Pe values versus mean arrival timein a log-log plot. In this figure we see that pointsfor results from the Toeplitz analysis and from thefirst peak initial data analysis display the sametrend. Consistency of results from these two ratherdifferent methods provides some confidence on thevalidity of this trend. Thus there appears to be ageneral increase of Pe number as a function of meantravel time, implying a decrease of dispersion withtravel time. This is in qualitative agreement withthe multi-fracture modeling study results (Figure 3-4) discussed in an earlier section. Furthermore, inthe log-log plot (Figure 4-11) the points fallroughly between two straight lines with slopes of 1.7and 2.7 respectively. Hence these results indicate arelationship between Pe number and mean travel timet as follows:
log Pe = n log t + constant
so that
Pe <*tn, where n = 2.2±0.5

17
However we do not believe that the data are goodenough to determine the n value to this degree ofcertainty. We could equally well state that
Pe = t2.
The values of <X=x/Pe obtained for each individualchannel are also displayed in Figure 4-12 as afunction of mean travel time in a log-log plot. Thisfigure shows that the Stripa-3D data appears to
indicate a = (t)~2.
The values of a calculated by the Toeplitz method(Table 4-2) range from 0.03 to 2.9 meters. Howeverthe values for the first channels (for early times)for all the tracers, which may be subject to lessanalysis error than those of the later channels,range from 0.6 to 2.9 m. These are consistent withthose from the first peak initial data analysis.
The surprising result that Pe = t2 or a = 1/t2 is adirect result of the analysis of the field data. Itis in contrast to the case of a porous medium wherethe Peclet number is usually assumed to be constantwith respect to mean travel time t. It is alsodifferent from the result for flow in a constant-diameter pipe, where the time dependence is given bythe Taylor's dispersion, which for small moleculardispersion gives Pe =t. In Stripa 3D data, we find amuch stronger dependence for transport throughvariable-aperture fractures. The basis andimplication of this interesting result are yet to bestudied. One possible explanation is as follows.Consider the results of deconvolution for all fivesets of data shown in Figures 4-5 - 4-9. It can be
seen that the standard deviation at of tracerparticle arrival times for each of the peaks is aboutthe same with the other peaks in each case, i.e., Otappears to be independent of the mean travel times ofthe peaks. Since the Peclet number for ID transportalong a channel may be expressed /Levenspiel, 1972/as:

18
then Pe = t2. Now, ct is dependent on the variance offracture apertures or local permeabilities over the2D fracture plane, i or tracer transport alongdifferent channels between injection and collectionpoints, this may be approximately the same, since thetortuosity is not expected to affect the real travelpath length by more than a factor of two or so.However, the mean travel times of these channels maybe strongly effected by the local heterogeneity. Thusa local constriction or a relatively large localaperture volume along a flow channel will stronglyaffect the mean travel times. In other words, for astrongly 2D heterogeneous system as in our case, themean travel time and the travel time standarddeviation may be decoupled. If we extrapolate thisline of reasoning, we may conjecture that for thetype of system under study, we should not focus onthe Peclet number or the dispersivity. Rather, weshould determine the travel time standard deviations
at and mean travel times t of the groups of flow
paths, or channels. The former, a t, is closelycorrelated to aperture or permeability variance, andcan be estimated for the case of Stripa-3D datadiscussed above. The latter, t, is strongly affectedby the local heterogeneity around the injectionlocation and has not been correlated to aperturedistribution parameters in our case study. However,if one is able to study the t values for a largernumber of such transport channels, we expect that themean of these t values can be correlated to the basicaperture probability distribution parameters.
The mean apertures b of the flow channels responsiblefor transport may be estimated from the experimentalflow rates Q to the 1 x 2 m tracer collection sheetsand the calculated velocities v from the first peaksor first channels in Table 4-1 or 4-2. At acollection sheet on the drift ceiling, the observedincoming flow rate is fed by flows with differenttracers with velocities v±. If the average channelwidth covered by the collection sheet is w and themean fracture aperture is b, then

19
where A is the cross-sectional area of the conducting
fractures in the collection sheet and ^ v± is thei
sum of velocities or tracers that arrive at thesheet. From Abelin et al. /1987/, the averaged inflowrate Q is about 20 ml/hr for those sheets with largeflow rates (distance along the drift X=24-36 m) . Theaverage width of the flow channels, w, is notdetermined within the present data set. For sheets inregion X = 24 - 36 m where there were large flowrates, we assumed that the relevant width w=l m is artasonable estimate. Then from Table 4-1, £ v. for
i
all 5 tracers is 59 mm/hr. Combining all numbers, we
find A = Q/£ v^O^xlO" 3 m2 and b = A/w=300 Jim. If wei
use just the first channel velocities from Table 4-2,2^V£ = 38 mm /hr and we obtain A = 0.5xl0~3 m2 and_ ib = 500 (im. The calculations were also made for eachsheet independently. Seme of the detailed resultswere shown in Table 4-3.
Another quantity that we can estimate from theseresults is <Tb, the standard deviation of the aperturedistribution function. For this, we follow theprocedure presented in Tsang et al. /1988/. Startingwith the Pe numbers for the first peak or firstchannels given in Tables 4-1 and 4-2, and assumingthat the channel flow obeys ID advective dispersiveequation /see e.g. Neretnieks et al., 1982/, we findthat the dispersion measure (t(0.9)-t(0.1))/t (0 . 5)ranges from 0.5 to 1.7. Tsang et al. /1988/ give agraphical relationship between this dispersion
measure and the aperture variance s =G/b. Applying
that relationship, we obtain values of Gb/b ranging
from 0.35 to 0.75. Thus if b = 300 \im, a b for the
Stripa fracture system is estimated to be 105-225 |im.
Table 4-4 summarizes the major conclusions from bothanalysis methods on the Stripa-3D tracer data.

20
SUMMARY AND CONCLUSIONS
A fractured medium represents a stronglyheterogeneous system. Tracer transport in such amedium cannot usually be understood by assuming flowand transport in a 3D homogeneous permeable system.In the Stripa-3D experiment the heterogeneity of themedium causes tracers to emerge at the experimentaldrift ceiling and walls in isolated spots. This kindof channelized flow path requires new approaches forits analysis. In this paper we applied the variableaperture channel model /Tsang and Tsang, 1987,1989;Tsang et al., 1988/, which assumes that flow in afractured medium is dominated by flow through a fewvariable-aperture channels, each of which is definedby a number of flow paths with comparable traveltines. One may characterize the transport in eachchannel by a mean travel time and the dispersioncoefficient. These parameters for the differentchannels are related to each other and to the basicparameters describing the fracture aperture
distribution, b and Cb.
This approach is applied to the analysis of theStripa-3D data. Two analysis methods were developedand applied; (1) the first peak early arrival dataanalysis and (2) the Toeplitz analysis. The resultsled to a confirmation of the concept of multiplevariable-aperture channels and to the determinationof a number of parameter values that characterize thefractures. These parameters, summarized in Table 4-4,represent some of the important inputs that areneeded for calculating travel times and dispersioncharacteristics of tracers traversing the medium. Onesurprising and interesting feature that emerges fromthese results is the time dependence of Peclet numberor the apparent disper^ivity. It is qualitativelyconsistent with the results from the channel modelfor fractures in series with larger and larger traveldistances and travel times, and may imply a time-independent Ot for the particle arrival time in theflow channels. Further study, both experimental andtheoretical, is needed to test this hypothesis and tounderstand its full significance.

21
ACKNOWLEDGMENTS
We have benefitted from the careful review andcomments from G.B. Bodvarsson and C. Carnahan ofLawrence Berkeley Laboratory, Berkeley, California,and from L. Moreno and I. Neretnieks of the RoyalInstitute of Technology (KTH), Stockholm, Sweden. Thepaper was concluded during an extended visit of thefirst two authors to KTH in 1990. The hospitality andassistance of KTH staff, especially I. Neretnieks, L.Moreno and Margareta Lundberg are gratefullyacknowledged. Work is jointly supported by theDirector of Office of Energy Research, Office ofBasic Energy Sciences, Engineering and GeosciencesDivision, and by the Director, Office of CivilianRadioactive Management, Office of Facilities Sitingand Development, Siting and Facilities TechnologyDivision of the U. S. Department of Energy undercontract No. DE-AC03-76SF00098.
22
REFERENCES
\be l in , H., Eirgers.son, L., Gidlund, J . , Moreno, L.,Neretnieks, I . , Widen, H., and Ågren, T., 1987. 3Dmigra t ion experiment - r e p o r t 3 : performedexperiments, r e s u l t s and evaluat ion. Stripa ProjectTechnical Report 87-21. Swedish Nuclear Fuel andWaste Management Company (SKB), Stockholm, Sweden,November 1987.
Abelin, H., Neretnieks, I . , Tunbrant, S., and Moreno,L., 1985. Final report or the migration in a singlef r a c t u r e , Experimental r e s u l t s and eva lua t ions ,Svensk Kärnbränslehanter ing, Tech. Report 85-03,Nucl. Fuel Safety P r o j . , Stockholm.
Bourke, P . J . , 1987. Channeling of flow throughf r a c t u r e s in rock, Proceedings of GEOVAL-87,Internat ional Symposium, Stockholm, Sweden, April 7-9, 1987.
Dre i s s , S . J . , 1982. Linear ke rne l s for kars taqui fers , Water Resour. Res. , Vol. 18, No. 4, pp.865-876.
Eagleson, P .S . , Mejia-r, R., and March, F . , 1966Computation of optimum rea l i zab le unit hydrographs,Water Resour. Res. , Vol. 2(4), pp. 755-764.
Endo, H.K., Long, J . C . S . , Wilson, C.R., andWitherspoon, P.A., 1984. A model for inves t igat ingmechanical t r anspo r t in f r ac tu re networks, WaterResour. Res., Vol. 20 (10), pp. 1390-1400.
Gohberg, I . , 1982. Editor , Proceedings of ToeplitzCentennial: Toeplitz Memorial Conference in OperatorTheory, Tel Aviv, May 11-15, 1981, BirkhaeuserVerlag, Basel.
Gray, R.M., 1977. Toeplitz and c i rculant matrices I I ,Information Systems Laboratory, Stanford ElectronicsLaboratory, Technica.1 Report SEL 77-011, Apri l ,Stanford, California.
Javandel, 1 . , Doughty, C , and Tsar.g, C.F., 1984.Groundwater t r a n s p o r t : Handbook of mathematicalmodels, Water Resources Monograph 10, AmericanGeophysical Union, Washington, D.C.
Kreft, A. and Zuber A., 1978. On the physical meaningof the dispersion equation and i t s solut ions for

23
different initial and boundary conditions, ChemicalEngineering Science, Vol. 33, 1471-1480.
Levenspiel, O. 1972. Chemical reaction engineering,Second Edition, p. 275, John Wiley Publishers, NewYork.
Moreno, L., Tsang, Y.W., Tsang, C.F., Hale, F.V., andNeretnieks, I., 1988. Flow and tracer transport in asingle fracture: A stochastic model and its relationto some field observations, Water Resour. Res., Vol.24(12), pp. 2033-3048.
Neretnieks, I., 1983. A note on fracture flowdispersion mechanisms in the ground, Water Resour.Res., Vol. 19(2), pp. 364-370.
Neretnieks, I., 1987 Channeling effects in flow andtransport in fractured rocks - some recentobservations and models, Proceedings of GEOVAL-87,International Symposium, Stockholm, Sweden, April 7-9, 1987.
Neretnieks, I., Eriksen, T. and Tähtinen, P., 1982.Tracer movement in a single fissure in granitic rock:some experimental results and their interpretation,Water Resour. Res. Vol. 18 (4), pp. 849-858.
Neuman, S.P., and de Marsily, G., 1976.Identification of linear systems response byparametric programming, Water Resour. Res., Vol.12(2), pp. 253-262.
Robinson, P.C., 1984. Connectivity, flow andtransport in network models of fractured media, Ph.D.thesis, Oxford University, London.
Schwartz, F.W., and Smith, L., 1988. A continuumapproach for modeling mass transport in fracturedmedia, Water Resour. Res., Vol. 24(8), pp. 1360-1372.
Tsang, C.F., 1989. Tracer travel time and modelvalidation, International Journal of RadioactiveWaste Management and the Nuclear Fuel Cycle, Vol.13(1-4), pp. 311-323.
Tsang, Y.W., and Tsang, C.F., 1987. Channel model offlow through fractured media, Water Resour. Res.,Vol. 23(3), pp. 467-479.
Tsang, Y.W., and Tsang, C.F., 1989. Flow channelingin a single fracture as a two-dimensional strongly

24
heterogeneous permeable medium, Water Rescur. Res.,Vol. 25(9), pp. 2076-2080.
Tsang, Y.W., Tsang, C.F., Neretnieks, I., and Moreno,L., 1988. Flow and tracer transport in fracturedmedia - A variable aperture channel model and itsproperties, Water Resources Research, Vol. 24, no.12, pp. 2049-2060.

Table 4-1 Results of Analysis of First Peak Early Time Data
x/t. CC=D/v Pec
Tracer (m) (hr) (m-nun/hr) (mm/hr) (mm/hr) (hr) (m) =vx/D
Elbenyl 10.7 2500Eosin Y 24.6 8500Eosin B 33.3 4000Uranine 36.4 7000Iodide 42.8 9000
14.07.567.015.09.5
3.83.29.85.65.3
4.32.98.35.24.8
37008300410069008400
3.62.36.82.71.8
3.011.04.913.024.0

Table 4-2 Results of Toeplitz Analysis
Tracer
Elbenyl
Eosin Y
Eosin B
Uranine
Iodide
X
(m)
10.7
24.6
33.3
36.4
42.8
Channel
1st2nd
1st2nd
1st2nd3rd4th
1st2nd
1st2nd
t
(hr)
261214447
647810440
281471981198016212
36406053
747314990
D
(m-mm/hr)
8.10.02
12.40.2
24.81.90.20.1
5.91.8
9.06.2
V
(nun/hr)
4.70.74
4.22.4
12.54.72.82.1
10.26.1
5.92.9
Pe =
xv/D
6.3323.
8.4314.
16.882.6411.507.
62.2119.
28.31980.
a =D/v(m)
1.70.03
2.90.1
2.00.40.10.1
0.60.3
1.50.02
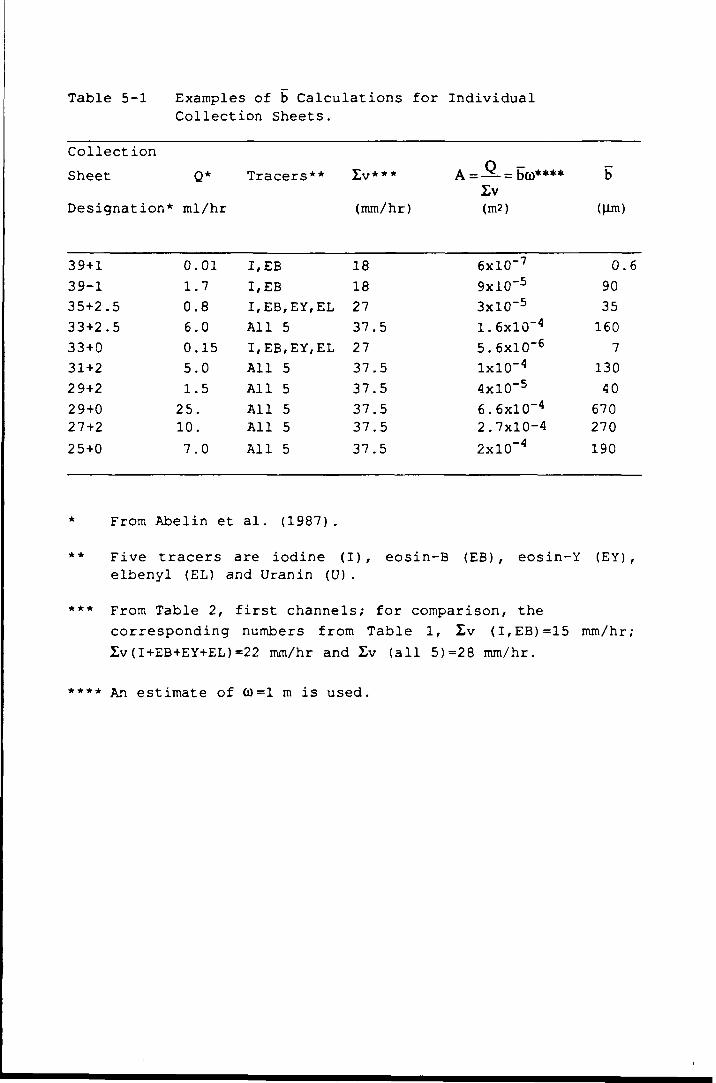
Table 5-1 Examples of b Calculations for IndividualCollection Sheets.
Collection
Sheet Q* Tracers**
Designation* ml/hr (mm/hr)
A=-Q- = bco**** bIv(m2) (\im)
6xlO~7
9xlO"5
3xlO~5
1.6xlO"4
5.6xlO"6
lxlO"4
4xlO~5
6.6xlO"4
2.7x10⁻⁴
2xlO"4
39+139-1
35+2.5
33+2.5
33+0
31+2
2 9+2
29+027+2
25+0
0.011.7
0.8
6.0
0.15
5.0
1.5
25.10.
7.0
I,EBI,EB
I,EB,EY,EL
All 5
I,EB,EY,EL
All 5
All 5
All 5All 5
All 5
1818
27
37.5
27
37.5
37.5
37.537.5
37.5
0.6
90
35
160
7
130
40670270
190
* From Abelin et al. (1987).
** Five tracers are iodine (I), eosin-B (EB), eosin-Y (EY) ,elbenyl (EL) and Uranin (U).
*** From Table 2, first channels; for comparison, the
corresponding numbers from Table 1, £v (I,EB)=15 mm/hr;
Zv(I+EB+EY+EL)=22 mm/hr and iv (all 5)=28 mm/hr.
**** An estimate of (0=1 m is used.
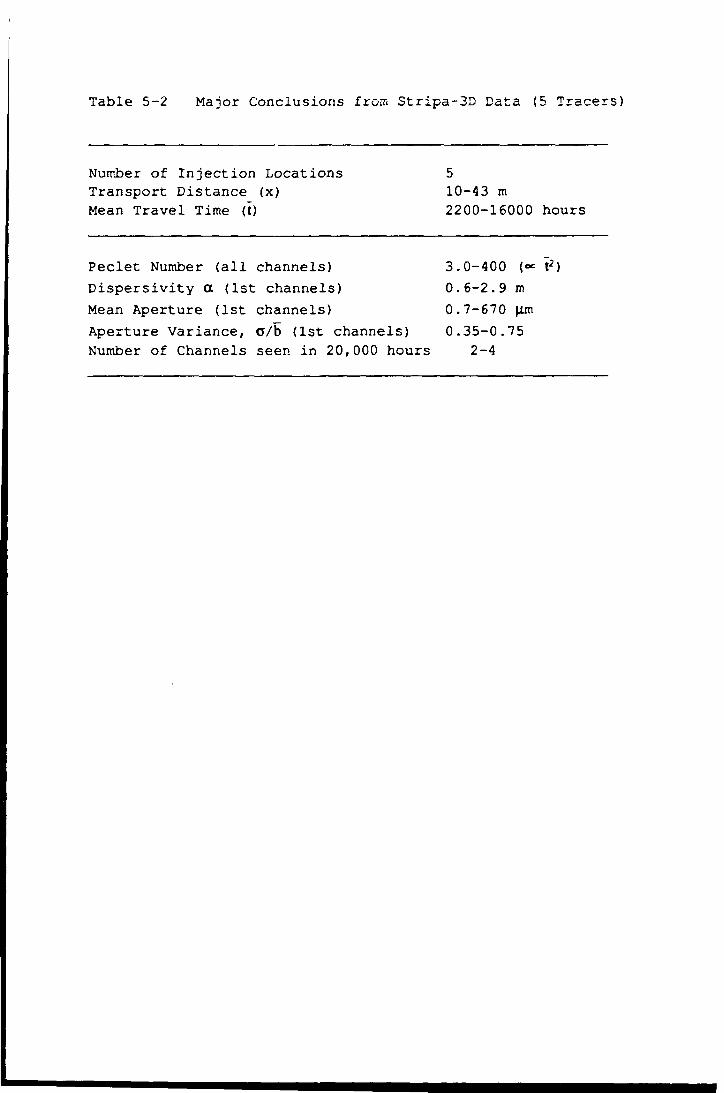
Table 5-2 Major Conclusions from Stripa-3D Data (5 Tracers)
Number of Injection Locations 5Transport Distance (x) 10-43 mMean Travel Time (t) 2200-16000 hours
Peclet Number (all channels) 3.0-400 (« t2)
Dispersivity a (1st channels) 0.6-2.9 m
Mean Aperture (1st channels) 0.7-670 |im
Aperture Variance, C/b (1st channels) 0.35-0.75Number of Channels seen in 20,000 hours 2-4

EOSINYC)
I
C)PHLOXINE
URANINEC) £ 2 ? Q PRED 94
ELBENYLC)
n n
ODUASYN
C) IODIDE
OEOSINB
O BROMIDE
Figure 2-1
XBL 905-1749
The layout of the Stripa 3D test site with threevertical injection holes is shown above, and thelocation of tracer injection zones in the threevertical injection holes is shown below.

SAMPLING ARRANGEMENT
ED
fl. • • 11
m •
Figure 2-2 The Stripa 3D sampling arrangement showingplacement of plastic sheets for tracer collectionis shown above, and a diagram showing tracerdistribution in the Stripa 3D test site is shownbelow. The arrows indicate the positions of theinjection holes; dots indicate sheets withsignificant water flow; and squares indicatesheets where tracers were collected.

30
^ 25 L^
* - »
DC
20
15
10C
oo-£ 5
A Enbenyl
x Eosin Y
5000 10000Time (hr)
15000 20000
Figure 2-3 Injection flow rates in ml/hr for the fivetracers; points are estimates for average flowrates over 500 hour intervals.

1.25
O)
Flux
(0
ion
\le
ctC
ol
0.75
0.5
0.25
0 B
o Eosin Y-AII Sheets
• Eosin B-AII Sheets
o Eosin Y-24 to 36m
• Eosin B-24 to 36m
0 5000 10000Time (hr)
15000 20000
Figure 2-4a Mass collection rates for Eosin Y and Eosin B.Note that almost all of the mass is collected inthe section from 25 to 36 meters in the tunnel.

O 35
0.30
mg
/h
X
uZ</)<Ö
ion
N/
Col
lect
0
0
0
0
.25
20
.15
.10
0.05
0.00
o lodide-All Sheets
• Uranine-AII Sheets
A Elbenyl-AII Sheets
o lodide-24 to 36m
• Uranine-24 to 36m
A Elbenyl-24 to 36m
5000 10000
Time (hr)15000 20000
Figure 2-4b Mass collection rates for Iodide, Uranine andElbenyl. Note that almost all of the mass iscollected in the section from 25 to 36 meters inthe tunnel. In fact, all of the Elbenyl wascollected in the section. Tne vertical scale hasbeen changed by a factor of 3.5 from Figure 2-4a.
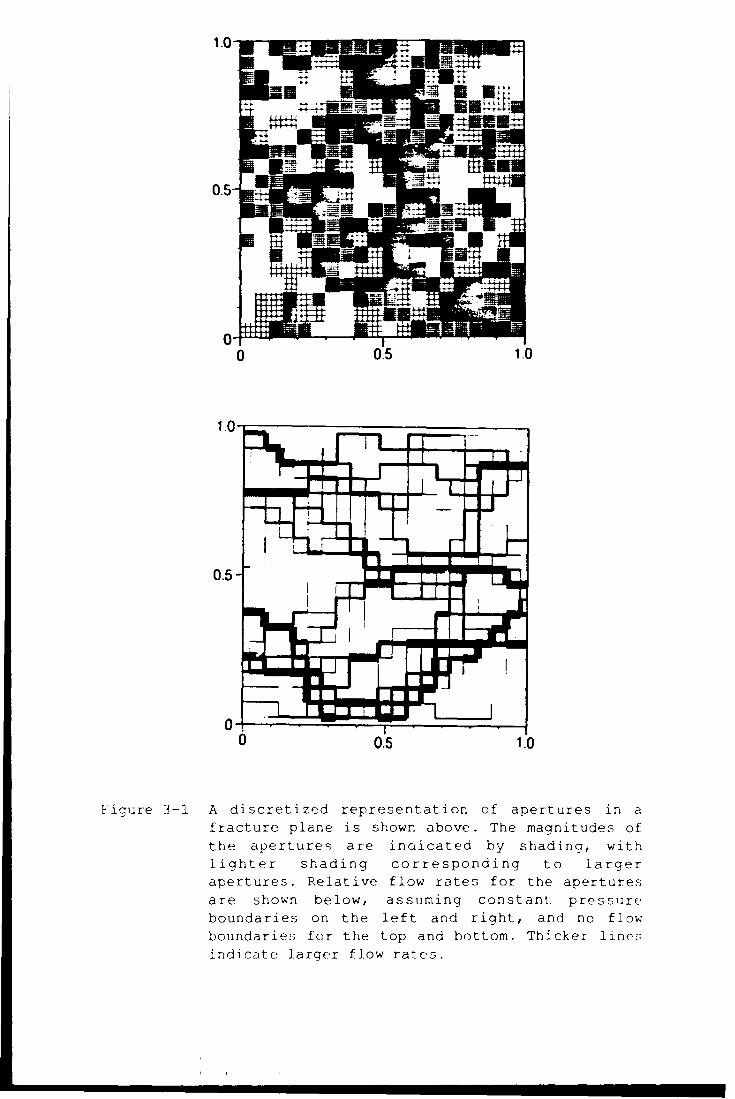
0.5-
Figure 3-1 A discretized representation of apertures in afracture plane is shown above. The magnitudes ofthe apertures are inoicated by shading, withlighter shading corresponding to largerapertures. Relative flow rates for the aperturesare shown below, assuming constant pressureboundaries on the left and right, and no flowboundaries for the top and bottom. Thicker linesindicate larger flow rates.
L

Figure 3-2 Conceptual model of flow channeling through threefractures in series.

0.0 0.2 0.1 0.6 0.8 l.O 1.2 1.8 2.0 2.2
Figure 3-3 The aperture distribution for the 2D channelmodel with two connected fractures is shownabove. Darker areas have smaller apertures, andlighter areas have larger apertures. Thefractures intersect ir. a line in the center ofthe figure. Relative flow rates for the aperturesare shown below, assuming constant pressureboundaries on the left side of the first fractureand the right side of the second fracture. Flowis from left to right with upper and lowerboundaries closed. Thicker lines indicate largerflow rates.

Stream Tubes
o>
20 40 60 80 100
Number of Fractures Traversed
Figure 3-4 Relationship of measure of dispersion to thenumber of intersecting fractures traversed. Atthe intersection two different schemes, totalmixing and stream tubes with no mixing, givesimilar results.

1 2
(O
E
ooo
O 8
0 «
0.4
0 2
• Injection 0/0o
Injection Est
o Production C/Cmax0®* *
%
t
t
5000 10000
Time (hr)15000 20000
Figure 4-1 Injection and production data for Eosin B. Theinjection rates are normalized using the initialinjection rate. The collection concentrationvalues are normalized to the maximumconcentration at 16,500 hours. The estimate ofthe injection rate for use with the first peakanalysis is based on the injection data up to t0
= 2,000 hours, and matches the injection volumeup to that time.

0.8
OO 0.6O
OOO
0.4
0.2 -
0
Injection rate
Response varying D
2000 4000 6000Time (hr)
8000 10000
Figure 4-2 Sensitivity of analytical solution to thedispersion coefficient. The injection rate dropsto zero at 1,000 hours. For this particular setof solutions, x = 30 m, a = 1.39xlO"3 hr"1, v =0.01 m/hr, and D ranges from 10~4 to 1 m2/hr.Sharper peaks correspond to smaller D values. ForD values larger than 0.018 m2/hr, the value of Uis imaginary.

1 2b
0 7fi
a.i
Do r.
0.2'j
5000
• Collection Data
First Peak Fit
10000
Time (hr)15000 20000
Figure 4-3 Results of fit to first peak using analyticalsolution for Eosin B.

Tracer Input Tracer Breakthrough
iDelta FunctionTracer Input Porous
medium
J V
Fractured mediumwith channeling
Figure 4-4 The top two schematic diagrams show the observedtracer injection and breakthrough. The results ofdeconvolution of the tracer injection data areshown below, as indicated by a pulse tracerinjection and the resulting breakthrough curvesfor a porous medium (single peak) and a fracturedmedium with channeling (multiple peaks).

; c/c
O
(U
4.&
4
3.5
3
2 b
2
t b
t
0 6
-
-
O
A
>Q£ L-
A\A /VcN-'
p in
O Toeplitz
1-D
I
v AV \
1 QQ
0 5000 10000
Time (hr)15000 20000
Figure 4-5 Results of Toeplitz analysis method for Eosin B.The circles are the normalized results of theToeplitz analysis, and the solid line is the fitof the ID advection-diffusion equation to thenormalized results, separated into distinctpeaks.

oo
u
9
B
7
6
4
3
2
1
0 <
-
-
O
-
A°kf\1, V
O Toeplitz
1-D
3600000000060000000 '0 5000 10000
Time (hr)15000 20000
Figure 4-6 Results of Toeplitz analysis method for Uranine,their fit by equation (4.9). Note that a Toeplitzsolution point at 2,000 hrs is off-scale. Thispoint probably represents an early peak, butthere is not sufficient data to determine itscharacteristics.

5ÖQQ 10000
Time (hr)15000 20000
Figure 4-7 Results of Toeplitz analysis method for Elbenyl,their fit by equation (4.9).

20 -
IbO
10
0<S
o
°d
7
oo0
^ \o
V\ ° AV
O
G
(\
/r
i
O Toeplitz
1-D
i
\
oooooodiooooooö5000 10000 15000
Time (hr)20000
Figure 4-8 Results of Toeplitz analysis method for Eosin Y,their fit by equation (4.9) .

c/cO
1 p
1 t*
1.4
1 Z
1
0 P
U 6
0 4
0 2
0(
-
-
I
To /
o Toeplilz
1-D
/ °\ °' V\
\ A'00000000 I O9O000
o 5000 10000
Time (hr)15000 20000
Figure 4-9 Results of Toeplitz analysis method for Iodide,their fit by equation (4.9).

0.0100
0.0076
E 0 0060
O»
o
r 0.0026o•o
oX
OJ0 0000
-0.0026
•0 0060
0
Injection Data
Random +/-20% Error
5000 10000Time (hr)
15000 20000
Figure 4-10 Sensitivity of Toeplitz analysis results torandom variability in injection rate data. Arandom error of ±20% was added to each injectionrate for Eosin B, and the effects of fifty setsof random errors on the exact solution are shownhere. The solid line shows the exact solutionusing the original data.

• Eosm B 1st pk
D Eosin B: Tueptitz
• Uranine. 1st pk
O Uranine: Toeplitz
AEIbenyl: 1st pk
x Elbenyl. Toeplitz
• Eosin Y: 1st pk
+ Eosin Y: Toeplitz
• Iodide 1st pk
o Iodide: Toeplitz
Slope=2
1000 10000
Mean Time (hr)100000
Figure 4-11 Log-log plot of Peclet number versus mean arrivaltime of each channel. The broken lines indicate aslope of +2.

• Eosin B tsl pk
D Eosin B Toeplitz
• Uranine: 1st pk
O Uraninc Toeplitz
A Etbenyl 1st pk
x Elbenyl Toeplnz
• Eosin Y: 1st pk
+ Eosin Y Toeplitz
• Iodide: 1st pk
o Iodide: Toeplitz
Slope = -2
10000
Mean Time (hr)100000
Figure 4-12 Log-log plot of 0C=D/v versus mean arrival time ofeach channel. The broken lines indicate a slopeof -2.

Strips Project - Previously Published Reports
1980TR 81-01"Summary of defined programs"L Carlsson and T OlssonGeological Survey of Sweden. UppsalaI NeretmeksRoyal Institute of Technology. StockholmR PuschUniversity of LuleåSweden November 1980
1981TR 81-02"Annual Report 1980"Swedish Nuclear Fuel Supply Co Division KBSStocknolm, Sweden 1981
IR 81-03"Migration in a single fracturePreliminary experiments in Stripa"Harald Abelin, Ivars NeretmeksRoyal institute of TechnologyStockholm. Sweden April 1981
IR 82-02"Buffer Mass Test - Data Acquisition andData Processing Systems"B HagvaliUniversity of Luleå. Sweden Ajgust 1982
IR 82-03"Buffer Mass Test - Software for the DataAcquisition System"B HagvaliUniversity of Luleå. Sweden August 1982
IR 82-04"Core-logs of the SubhorizontalBoreholes N1 and E1"L Carlsson. V StejskaiGeological Survey of Sweden. UppsalaT OlssonK-Konsult. Engineers and Architects. StockholmSweden August 1982
IR 81-04"Equipment for hydraulic testing"Lars Jacobsson. Henrik NorlanderStällbergs Grufve ABStripa. Sweden July 1981
IR 81-05Part I "Core-logs of borehole VIdown to 505 m"L Carlsson. V StejskaiGeological Survey of Sweden. UppsalaTOissonK-Xonsult, Stockholm
Part II "Measurement of Triaxial rockstresses in borehole VI"L Strindeii, M AnderssonSwedish State Power Board. StockholmSweden July 1981
1982TR 82-01"Annual Report 1981"Swedish Nuclear Fuel Supply Co'Division KBSStockhcl; -,. Sweden February 1082
IR 82-05"Core-logs of the Vertical Borehole V2"L Carlsson, T Eggert. B Westlur.dGeological Survey of Sweden, UppsalaT OlssonK-Konsult. Engineers and Arcrrtects. StockholmSweden August 1982
IR 82-06"Buffer Mass Test - Buffer Materials"R Pusch. L BorgessonUniversity of LuieåJ NilssonAB Jacobson & Widmark, LjleåSweden August 1982
IR 82-07"Buffer Mass Test - Rock Drilling andCivil Engineering"R PuschUniversity of LuleåJ NilssonAB Jacobson & Widmark. LuleåSweuen S ' b '081

IR 82-08"Buffer Mass Test - Predictions of thebehaviour of the bentonite-based buffermaterials"L BörgessonUniversity of LuleåSweden August 1982
1983IR 83-01"Geochemica.' jnd isotope characteriza-tion of the Stripa groundwaters -Progress report"Leif Carlsson,Swedish Geological, GöteborgTommy Olsson,Geological Survey of Sweden, UppsalaJohn Andrews,University of Bath, UKJean-Charles Fontes,Université, Paris-Sud, Paris, FranceJean LMichelot.Université, Paris-Sud, Paris, FranceKirk Nordstrom,United states Geological Survey, Menlo ParkCalifornia, USAFebruary 1983
TR 83-02"Annual Report 1982"Swedish Nuclear Fuel Supply Co/ Division KBSStockholm, Sweden April 1983
IR 83-03"Buffer Mass Test - Thermal calculationsfor the high temperature test"Sven KnutssonUniversity of LuleåSweden May 1983
IR 83-04"Buffer Mass Test- Site Documentation"
Roland PuschUniveristy of Luleå and Swedish State Power BoardJan NilssonAB Jacobson & Widmark. Luleå,Sweden October 1983
IR 83-05"Buffer Mass Test - Improved Models forWater Uptake and Redistribution in theHeater Holes and Tunnel Backfill"R PuschSwedish State Power BoardL Börgesson, S KnutssonUniversity of LuleåSweden, October 1983
IR 83-06"Crosshole Investigations — The Use ofBorehole Radar for the Detection of Frac-ture Zones in Crystalline Rock"Olle OlssonErik SandbergSwedish GeologicalBruno NilssonBoliden Mineral AB, SwedenOctober 1983
1984TR 84-01"Annual Report 1983"Swedish Nuclear Fuel Supply Co/Division KBSStockholm, Sweden, May 1984.
IR 84-02"Buffer Mass Test — Heater Designand Operation"Jan NilssonSwedish Geological CoGunnar RamqvistEI-teknoABRoland PuschSwedish State Power BoardJune 1984
IR 84-03"Hydrogeological and HydrogeochemicalInvestigations—Geophysical BoreholeMeasurements"Olle OlssonAnte JämtlidSwedish Geological Co.August 1984
IR 84-04"Crosshole investigations—PreliminaryDesign of a New Borehole Radar System"O. OlssonE.SandbergSwedish Geological Co.August 1984
IR 84-05"Crosshole Investigations—EquipmentDesign Considerations for SinusoidalPressure Tests"David C. r iolmesBritish Geological SurveySeptember 1984

IR 84-06"Buffer Mass Test — Instrumentation"Roland Pusch, Thomas ForsbergUniversity of Luleå, SwedenJan NilssonSwedish Geological, LuleåGunnar Ramqvist, Sven-Erik TegelmarkStripa Mine Service, StoraSeptember 1984
IR 84-07"Hydrogeological and Hydrogeochemical"Investigations in Boreholes — FluidInclusion Studies in the Stripa GraniteSten LindblomStockholm University, SwedenOctober 1984
IR 84-08"Crosshole investigations — Tomographyand its Application to Crosshole SeismicMeasurements"Sven IvanssonNational Defence Research Institute,SwedenNovember 1984
1985IR 85-01"Borehole and Shaft Sealing — Sitedocumentation"Roland PuschJan NilssonSwedish Geological CoGunnar RamqvistElteknoABSwedenFebruary 1985
IR 85-02"Migration in a Single Fracture —Instrumentation and site description"Harald AbelinJardGidlundRoyal Institute of TechnologyStockholm, SwedenFebruary 1985
TR 85-03"Final Report of the Migration in a SingleFracture — Experimental results andevaluation"H. AbelinI.NeretnieksS.TunbrantL. MorenoRoyal Institute of TechnologyStockholm, SwedenMay 1985
IR 85-04"Hydrogeological and HydrogeochemicalInvestigations in Boreholes —Compilation of geological data"Seje CarlstenSwedish Geological CoUppsala, SwedenJune 1985
IR 85-05"Crosshole Investigations —Description of the smali scale site"Seje CarlstenKurt-Åke MagnussonOlle OlssonSwedish Geological CoUppsala, SwedenJune 1985
TR 85-06"Hydrogeological and HydrogeochemicalInvestigations in Boreholes — Final reportot the phase I geochemical investigationsof the Stripa groundwaters"O.K. Nordstrom, US Geological Survey, USAJ.N. Andrews, University of Bath, United KingdomL Carlsson, Swedish Geological Co, SwedenJ-C. Fontes, Universite Paris-Sud, FranceP. Fritz, University of Waterloo, CanadaH. Moser. Gesellschaft furStrahlen- undUmweltforschung, West GermanyT. Olsson, Geosystem AB, SwedenJuly 1985
TR 85-07"Annual Report 1984"Swedish Nuclear Fuel and Waste Management Co.Stockholm, July 1985
IR 85-08"Hydrogeological and HydrogeochemicalInvestigations in Boreholes—Shut-in tests"L. CarlssonSwedish Geological CoT. OlssonUppsala Geosystem ABJuly 1985
IR 85-09"Hydrogeological and HydrogeochemicalInvestigations in Boreholes—Injection-recovery tests and interference tests"L. CarlssonSwedish Geological CoT OlssonUppsala Geosystem ABJuly 1985

TR 85-10"Hydrogeological and HydrogeochemicalInvestigations in Boreholes—Final report"L. CarlssonSwedish Geological CoT. OlssonUppsala Geosystem ABJuly 1985
1986IR 86-01"Crosshole Investigations —Descriptionof the large scale site"Göran NilssonOlleOissonSwedish Geological Co, SwedenFebruary 1986
TR 85-11"Final Report of the Buffer Mass Test-Volume I: scope, preparative field work,and test arrangement"R.PuschSwedish Geological Co, SwedenJ.NilssonSwedish Geological Co, SwedenG. RamqvistEl-tekno Co, SwedenJuly 1985
TR 85-12"Final Report of the Buffer Mass Test-Volume II: test results"R.PuschSwedish Geological Co, SwedenL. BörgessonSwedish Geological Co, SwedenG. Ramqvist, El-tekno Co, SwedenAugust 1985
IR 85-13"Crosshole Investigations — Compilationof core log data from F1-F6"S. Carlsten.A. Stråhle.Swedish Geological Co, SwedenSeptember 1985
TR 85-14"Final Report of the Buffer Mass Test-Volume III: Chemical and physical stabilityof the buffer materials"Roland PuschSwedish Geological Co.SwedenNovember 1985
IR 86-02"Hydrogeological Characterization of theVentilation Drift (Buffer Mass Test) Area, Stripa,Sweden"J.E. GaleMemorial University, Nfld., CanadaA. RouleauEnvironment Canada, Ottawa, CanadaFebruary 1986
IR 86-03"Crosshole Investigations—The method,theory and analysis of crosshole sinusoidalpressure tests in fissured rock"JohnH BlackJohn A Barker*David J.NoyBritish Geological Survey, Keyworth, Nottingham,United Kingdom"Wallingford, Oxon, United KingdomJune 1986
TR 86-04"Executive Summary of Phase 1"Swedish Nuclear Fuel and Waste Management Co.Stockholm, July 1986
TR 86-05"Annual Report 1985"Swedish Nuclear Fuel and Waste Management Co.Stockholm, August 1986

1987TR 87-01"Final Report of the Borehole,Shaft, and Tunnel Sealing Test —Volume I: Borehole plugging"R. PuschL. BörgessonSwedish Geological Co, SwedenG. RamqvistEl-Tekno Co, SwedenJanuary 1987
TR 87-06"Crosshole Investigations — Resultsfrom Seismic Borehole Tomography"J.PihlM. HammarströmS. IvanssonP. MorénNational Defence Research Institute,SwedenDecember 1986
TR 87-02"Final Report of the Borehole,Shaft, and Tunnel Sealing Test —Volume II: Shaft plugging"R. PuschL. BörgessonSwedish Geological Co, SwedenG. RamqvistEl-Tekno Co, SwedenJanuary 1987
TR 87-03"Final Report of the Borehole,Shaft, and Tunnel Sealing Test —Volume III: Tunnel plugging"R. PuschL. BörgessonSwedish Geological Co, SwedenG. RamqvistEl-Tekno Co, SwedenFebruary 1987
TR 87-04"Crosshole Investigations—Details ofthe Construction and Operation of theHydraulic Testing System"D. HolmesBritish Geological Survey, United KingdomM. SehlstedtSwedish Geological Co., SwedenMay 1986
IR 87-05"Workshop on Sealing Techniques,tested in the Stripa Project and being ofGeneral Potential use for Rock Sealing"R. PuschSwedish Geological Co., SwedenFebruary 1987
TR 87-07"Reflection and Tubewave Analysisof the Seismic Data from the StripaCrosshole Site"C. CosmaVibrometric OY, FinlandS. BählerM. HammarströmJ.PihlNational Defence Research Institute.SwedenDecember 1986
TR 87-08"Crosshole Investigations — Shortand Medium Range SeismicTomography"C. CosmaVibrometric OY, FinlandFebruary 1987
TR 87-09"Program for the Stripa ProjectPhase 3,1986-1991"Swedish Nuclear Fuel and Waste Manage-ment Co. Stockholm, May 1987
TR 87-10"Crosshole Investigations — Physi-cal Properties of Core Samples fromBoreholes F1 and F2"K-Å. MagnussonS. CarlstenO.OlssonSwedish Geological Co, SwedenJune 1987

TR 87-11"Crosshole Investigations—Results fromBorehole Radar Investigations"O Olsson, L Falk, O Forslund, L Lundmark,E SandbergSwedish Geological Co, SwedenMay 1987
TR 87-18"Crosshole Investigations -Hydrogeological Results and Interpretations"J. BlackD. HolmesM. BrightmanBritish Geological Survey, United KingdomDecember 1987
TR 87-12"State-of-the-Art Report on PotentiallyUseful Materials for Sealing NuclearWaste Repositories"Swedish Nuclear Fuel and Waste ManagementCo, StockholmJune 1987
IR 87-13"Rock Stress Measurements in Borehole V3"B. BjamasonG. RaillardUniversity of Luleå, SwedenJuly 1987
TR 87-14"Annual Report 1986"August 1987
TR 87-15"Hydrogeological Characterization of theStripa Site"J. GaleR. MacLeodJ. WelhanMemorial University, Nfld., CanadaC. ColeL. VailBattelle Pacific Northwest Lab.Richland, Wash., USAJune 1987
TR 87-16"Crosshole Investigations - Final Report"O. OlssonSwedish Geological Co, SwedenJ. BlackBritish Geological Survey, United KingdomC. CosmaVibrometric OY, FinlandJ.PhilNational Defence Research Institute, SwedenSeptember 1987
TR 87-17"Site Characterization and Validation -Geophysical Single Hole LoggingB. FridhSwedish Geological Co, SwedenDecember 1987
TR 87-19"3-D Migration Experiment -Report 1Site Preparation and Documentation"H. AbelinL BirgerssonRoyal Institute of Technology, SwedenNovember 1987
TR 87-20"3-D Migration Experiment -Report 2Instrumentation and Tracers"H. AlbelinL BirgerssonJ. GidlundRoyal Institute of Technology, SwedenNovember 1987
TR 87-21Part I "3-D Migration Experiment •Report 3Performed Experiments,Results and Evaluation"H. AbelinL. BirgerssonJ. GidlundL. MorenoI. NeretnieksH. WidenT. AgrenRoyal institute of Technology, SwedenNovember 1987
Part II "3-D Migration ExperimentReport 3Performed Experiments,Results and EvaluationsAppendices 15,16 and 17"H. AbelinL. BirgerssonJ. GidiundL Morenoi. NeretnieksH. WidenT. ÅgrenRoyal Institute of Technology, SwedenNovember 1987

TR 87-22"3-D Migration Experiment -Report 4Fracture Network ModellingoftheStripa3-DSite"J. AnderssonB. DverstorpRoyal Institute of Technology, SwedenNovember 1987
7988
TR 88-01"Crosshole Investigations -Implementation and FractionalDimension Interpretation ofSinusoidal Tests"D. NoyJ. BarkerJ. BlackD. HolmesBritish Geological Survey, United KingdomFebruary 1988
IR 88-02"Site Characterization and Validation -Monitoring of Head in the Stripa MineDuring 1987"S. CarlstenO. OlssonO. PerssonM. SehlstedtSwedish Geological Co., SwedenApril 1988
TR 88-03"Site Characterization and Validation -Borehole Rodar Investigations, Stage I"O. OlssonJ. ErikssonL FalkE. SandbergSwedish Geological Co., SwedenApril 1988
TR 88-04"Rock Sealing - Large Scale Field Testand Accessory Investigations"R. PuschClay Technology, SwedenMarch 1988
TR 88-05"Hydrogeochemical Assessment ofCrystalline Rock for Radioactive WasteDisposa The Stripa Experience"J. AndrewsUniversity of Bath, United KingdomJ-C. FontesUniversité Paris-Sud, FranceP. FritzUniversity of Waterloo, CanadaK. NordstromUS Geological Survey, USAAugust 1988
TR 88-06"Annual Report 1987"June 1988
IR 88-07"Site Characterization and Validation —Results From Seismic Crossholeand Reflection Measurements, Stage I"C. CosmaR. KorhonenVibrometric Oy, FinlandM. HammarströmP. MorénJ. PihlNational Defence Research Institute, SwedenSeptember 1988
IR 88-08"Stage I Joint Characterization andStage II Preliminary Prediction usingSmall Core Samples"G. VikN. BartonNorwegian Geotechnical Institute, NorwayAugust 1988
IR 88-09"Site Characterization and Validation -Hydrochemical Investigations in Stage I"P. WikbergM. LaaksoharjuJ. BrunoA. SandinoRoyal Institute of Technology, SwedenSeptember 1988

IR 88-10"Site Characterization and Validation —Drift and Borehole Fracture Data Stage I"J. GaleFracflow Consultants Inc., Nfld., CanadaA. StråhleSwedish Geological Co, Uppsala, SwedenSeptember 1988
TR 88-11"Rock Sealing - Interim Report on theRock Sealing Project (Stage I)"R. PuschL BörgessonA. FredriksonClay Technology, SwedenI. MarkströmM. ErlströmSwedish Geological Co, SwedenG. RamqvistEl-Tekno AB, SwedenM. GrayAECL, CanadaW. CoonsIT Corp., USASeptember 1988
IR 89-04"Site Characterization and Validation -Single Borehole Hydraulic Testing"D. HolmesBri'ish Geological Survey, U.K.March 1989
TR 89-05"Annual Report 1983"Swedish Nuclear Fuel and Waste Management Co.StockholmMay 1989
IR 89-06"Site Characterization and Validation —Monitoring of Head in the Stripa MineDuring 1988"O. PerssonSwedish Geological Co., Uppsala, SwedenO. OlssonABEM AB, Uppsala, SwedenM. SehlstedtSwedish Geological Co., Mala, SwedenApril 1989
1989TR 89-01"Executive Summary of Phase 2"Swedish Nuclear Fuel and Waste Management Co.,StockholmFebruary 1989
IR 89-07"Site Characterization and Validation -Geophysical Single Hole Logging,Stage 3"P. AnderssonSwedish Geological Co., Uppsala, SwedenMay 1989
TR 89-02"Fracture Flow Code Cross - VerificationPlan"W. DershowitzGolder Associates Inc., USAA. HerbertAERE Harwell Laboratory, U. K.J. LongLawrence Berkeley Laboratory, USAMarch 1989
TR 89-03"Site Characterization and ValidationStage 2 - Prelimiary Predictions"O. OlssonABEM AB, SwedenJ. BlackGolder Associates, U. K.J. GaleFracflow Inc., CanadaD. HolmesBritish Geological Survey, U. K.May 1989
TR 89-08"Water Row in Single Rock Joints"E. HakamiLuleå University of Technology, Luleå, SwedenMay 1989
1990TR 90-01"Site Characterization and Validation -Borehole Radar Investigations, Stage 3"F. SandbergO. OlssonL. FalkABEM AB, Uppsala, SwedenNovember 1989

IR 90-02"Site Characterization and Validation -Drift and Borehole Fracture Data.Stage 3"J. GaleR. MacLeodFracflow Consultants Inc., Nfld., CanadaA. StråhleS. CarlstenSwedish Geological Co., Uppsala, SwedenFebruary 1990
IR 90-03"High Voltage Microscopy Study ofthe Hydration of Cement with SpecialRespect to the Influence of Super-plasticizers"R. PuschA. FredriksonClay Technology AB, Lund SwedenFebruary 1990
TR 90-04"Preliminary Prediction of Inflow into theD-Holes at the Stripa Mine"J. LongK. KarasakiA. DaveyJ. PetersonM.LandsfeldJ. KemenyS. MartelLawrence Berkeley Laboratory, Berkeley, USAFebruary 1990
TR 90-05"Hydrogeochemical investigations withinthe Stripa Project"Reprint fromGEOCHIMICA ET COSMOCHIMICA ACTAVol. 53, No. 8August 1989
TR 90-06"Prediction of Inflow into theD-Holes at the Stripa Mine"J. GeierW. DershowitzG. SharpGolder Associates Inc. Redmond, USAApril 1990
TR 90-07"Site Characterization and Validation —Coupled Stress-Row Testing ofMineralized Joints of 200 mm and1400 mm Length in the Laboratory andIn Situ, Stage 3"A. MakuratN. BartonG.VikL TunbridgeNGI, Oslo, NorwayFebruary 1990
TR 90-08"Site Characterization and Validation —Hydrochemical Investigations, Stage 3"M. LaaksoharjuRoyal Institute of Technology, Stockholm, SwedenFebruary 1990
TR 90-09"Site Characterization and Validation —Stress Field in the SCV Block andAround the Validation Drift, Stage 3"S. McKinnonP. CarrJAA AB, Luleå, SwedenApril 1990
TR 90-10"Site Characterization and Validation —Single Borehole Hydraulic Testing of"C Boreholes, Simulated Drift and SmallScale Hydraulic Testing, Stage 3"D. HolmesM.AbDottM. BrightmanBGS, Nottingham, EnglandApril 1990
TR 90-11"Site Characterization and Validation -Measurement of Flowrate, SoluteVelocities and Aperture Variation inNatural Fractures as a Function ofNormal and Shear Stress, Stage 3"J. GaleR. MacLeodFracflow Consultants Inc., Nfld., CanadaP. LeMessurierMemorial University, St. John's, Nfld., CanadaApril 1990
TR 90-12"The Channeling Experiment —Instrumentation and Site Preparation"H. AbelinL. BirgerssonT. ÅgrenChemflow AB, Stockholm, SwedenJanuary 1990

TR 90-13"Channeling Experiment"H. AbelinL BirgerssonH. WidenT. ÅgrenChemflow AB, Stockholm, SwedenL MorenoI. NeretnieksDepartment of Chemical EngineeringRoyal Institute of Technology, Stockholm, SwedenJuly 1990
TR 90-14"Prediction of Inflow into theD-Holes at the Stripa Mine"A. HerbertB. SplawskiAEA InTec, Harwell Laboratory, Didcot, EnglandAugust 1990
TR 90-15"Analysis of Hydraulic ConnectionsBetween BMT and SCV Areas"T. DoeJ. GeierW. DershowitzGolder Associates Inc. Redmond, Wash. USAJuly 1990
TR 90-16"Annual Report 1989"Swedish Nuclear Fuel and Waste Management Co.StockholmMay 1990
1991TR 91-01"Distinct Element Method Modeling ofFracture Behavior in Near Field Rock"H. HökmarkClay Technology, SwedenDecember 1990
IR 91-02"Site Characterization ?n4 Validation -Monitoring of Head in * Stripa MineDuring 1989"S. CarlstenG. NybergO. OlssonM. SehlstedtP-T. TammelaSwedish Geological Co., SwedenNovember 1990
TR 91-03"Interpretation of Fracture SystemGeometry Using Well Test Data"T. DoeJ. GeierGolder Associates Inc. Redmond, Wash. USANovember 1990
TR 91-04"Application of Computer Aided Design(CADD) in Data Display and Integrationof Numerical and Reid Results —Stripa Phase 3"D. PressS. HallidayJ. GaleFractlow Consultants Inc. St. John's, Nfld.,CanadaDecember 1990
TR 91-05"Disturbed Zone Modelling of SVCValidation Drift Using UDEC- BB,Models 1 to 8 - Stripa Phase 3"K. MonsenA. MakuratN. BartonNGI, Oslo, NorwayJanuary 1991
TR 91-06"Evaporation Measurement in theValidation Dr i f t -Par t i "K. WatanabeSatarna University, Urawa, Saitama, JapanJanuary 1991
TR 91-07"Site Characterization and Validation -Results From Seismic Crosshole andReflection Measurements — Stage 3"C. CosmaP. HeikkinenJ. KeskinenR. KorhonenVibrometric Oy, Helsinki, FinlandJanuary 1991
TR 91-08"Site Characterization and Validation -Stage 4 - Preliminary Assessment andDetail Predictions"J. BlackO. OlssonJ. GaleD. HolmesDecember 1990

TR 91-09"Site Characterization and Validation -Monitoring of Saline Tracer Transport byBorehole Radar Measurements- Phase 1"O. OlssonConterra AB, Uppsala, SwedenP. AnderssonE. GustafssonSGAB, Uppsala, SwedenFebruary 1991
TR 91-10"A Comparison of Predictions andMeasurements for the StripaSimulated Drift Experiment"D. HodgkinsonIntera Sciences, Henley-on-Thames,United KingdomFebruary 1991
TR 91-11"Annual Report 1990"Swedish Nuclear Fuel and Waste Management CoStockholmJuly 1991
IR 91-12"Site Characterization and Validation -Monitoring of Head in the Stripa MineDuring 1990"S. CarlstenG. NybergP. TammelaSGAB, Uppsala, SwedenO. OlssonConterra AB, Uppsala, SwedenApril 1991
TR 91-13"Improvement of High ResolutionBorehole SeismicsPart I Development of ProcessingMethods for VSP SurveysPart II Piezoelectric Signal Transmitterfor Seismic Measurements"C. CosmaP. HeikkinenS. PekonenVibrometric Oy, Helsinki, FinlandMay 1991

ISSN 0349-5698
CM-Tryck AB. Bromma 199'