trace-element modeling of the petrogenesis of granophyres and aplites in the notch peak granitic
TRANSCRIPT
American Mineralogist, Volume 71, pages 460-47 I, 1986
Trace-element modeling of the petrogenesis of granophyres andaplites in the Notch Peak granitic stocko Utah
Pnrnn I. Nlrelr.Department of Geology, University of Missouri-Columbia, Columbia, Missouri 6521I
AssrRAcr
The petrogeneses of a granophyre and an aplite in the Notch Peak stock, lJtah, weremodeled using published experimental data for mineral/melt, mineraVfluid, and melVfluidpartitioning of alkali, alkaline-earth and rare-earth elements. The stock ranges in compo-sition from granite to quartz monzonite. The granophyre occurs along a horizontal contactof the granite with overlying impermeable limestones and contains graphic intergrowthsofalkali feldspar and quartz, displaying unidirectional solidification structures. Calculationssuggest that the granophyre formed by 2-l3o/o crystallization from an aqueous fluid thatexsolved from the magma during emplacement and was trapped beneath the limestones.The observed strong enrichment of Ba and Sr in the granophyre relative to the ganite isdue to large alkali feldspar/fluid partition coefficients for these elements, while the depletionof large-ionJithophile elements is due to their small solubility in aqueous fluids. On theother hand, the aplite, one of many crosscutting the stock, is depleted in Ba, Sr, and theREEs, while the concentration of highly charged elements, Zr,Ta, Hf, Th, and IJ, is aboutthe same as in the major lithologic units in the stock. It is not possible to explain thealkaline-earth element and REE concentrations in the aplite by any model that employsmineral/melt partition coefrcients for anhydrous melts. However, the "minimum granite"composition and the large concentration of the highly charged elements are difficult toexplain by direct crystallization from aqueous fluids. It is apparent that the partitioncoefficients of Ba, Sr, and the REEs between minerals and melt significantly increase whenthe system becomes saturated with chlorine-rich aqueous fluids.
The results of this study have implications for the petrogenesis of pegmatites and otheraplites because many have depletion and enrichment characteristics similar to the apliteand granophyre at Notch Peak. It is shown that rocks that are the result offractionationoffanhydrous melts can be distinguished on the basis of their major- and trace-elementchemistries from those that crystallized in the presence of aqueous fluids or those thatcrystallized directly from the fluids.
INrnonucrroN to modeling crystaVmelt processes mainly in mafic andThe common association of pegmatites, aplites, and intermediaterocks(Arth, 1976; Hanson, 1980).Recently
granophyres with granitic rocks has been recognized for published experimental data on partitioning of severala long time, but it was the work of Richard Jahns and trace elements between minerals and fluid and melt andcoworkers that demonstrated the importance of aqueous fluid (e.g., Carron and Lagache, 1980; Volfinger, 1976)fluids in the petrogenesis of these rock types. Jahns and also permit the modeling of crystallization processes thatBurnham (1957, 1969) suggested on the basis of experi- involve fluids.mental work that pegmatites and aplites crystallize when The purpose of this paper is to model the petrogenesisa separate supercritical aqueous-fluid phase forms during of aplites and granophyres associated with the Notch Peakthe late stages of crystallization of a granite. The time of granitic stock, House Range, western Utah, and to dem-separation depends on the solubility of fluids (e.g., water) onstrate the feasibility of using trace elements in modelingin the magma at a given confining pressure on the system. the petrogenesis of pegmatitic rocks. Pegmatites in theA review of pegmatite petrogenesis (eerni, 1982) shows Notch Peak stock occur only as occasional pods; thus, itthat pegmatites and associated rocks have been described is difficult to obtain a representative whole-rock sample.primarily in terms of mineralogy and major-element It is, however, easier to model the petrogenesis of apliteschemistry; however, the abundances oftrace elements have and granophyres because they can be sampled as wholenot been generally used to their full potential to further rocks. Furthernore, the clearly defined mutual relation-elucidate the petrogenesis of these rocks. ships among the aplites, granophyres, and the host intru-
The use of trace elements to model the petrogenesis of sion can be used to constrain possible petrogenetic models.igneous rocks has been extensive but generally confined In addition, the petrogenesis ofthe stock and the nature
0003{04x/86/03044460$02.00 460

NABELEK: TRACE-ELEMENT MODELING 461
A,
n-El camb,isn s€drmontary
"**" l. IU T A H
Fig. L Geologic map of the Notch Peak stock with locationsof the aplite and granophyre samples discussed in this article.
of fluid flow in the Notch Peak complex are well under-stood from previous studies (Nabelek et al., 1983, 1984,ms.).
AN.cl,YTrcAl, METHoDS
The analyses of Si, Ti, Fe, Mn, Ca, K, Nb, Cu, Ga, Y, and Pbwere conducted at Battelle-Northwest, Richland, Washington,using an energy-dispersive X-ray fluorescence Kevex Model 8 l0system with zirconium and silver secondary sources. Al, Mg, andNa were analyzed on samples dissolved in lithium metaborateflux by atomic absorption. U.S. Geological Survey standards wereused as working standards. Replicate standard and sample anal-yses yield uncertainties of less than 100/o for Mn, Nb, Cu, andGa; 590 for Si and Ti; 30lo for K, Ca, Al, Na, Mg, Pb, and Y; andlolo for Fe.
Other elements were analyzed by instrumental neutron acti-vation analyses (INAA) of 0.5-1.0-g irradiated aliquots of about5-kg homogenized whole-rock powders. The gamma-rays emit-ted from the samples were counted by Ge(Li) detectors using thesequential counting technique described by Laul (197 9). Zn, Sb,Rb, Sr, and Zr data were obtained by coincidence-noncoincidencecounting, which resulted in reduction of the Compton back-ground. Corrections were made for Ia, Ce, Nd, Sm, and Zr formedby fission of235U and as activation products of23EIJ as a resultof irradiation. U.S. Geological Survey standards GSP-I, BHVO-I , and International Atomic Energy Agency standard Soil-5 wereused to monitor the accuracy and precision of the results. Theone-standard-deviation uncertainties on replicate standard anal-yses are l-2o/o for Na, Ce, Co, Sc, and Zn; 3o/o for Ba, Eu, Tb,and Rb; 4-5o/o for Sr, La, Sm, Yb, Lu, Hf, Ta, Th, U, and Cs;and less than l0Yo for Nd and Zr. K, Na, Rb, Ba, Sr, and Znwere analyzed by more than one method. The replicates are wellwithin the stated analytical uncertainties. For consistency, onlythe INAA data are reported.
Gnor,ocy
The geology ofthe Notch Peak stock is described in detail inNabelek et al. (ms.) and therefore only a short summary is pre-sented here. The Jurassic stock intruded interbedded Cambrian
NWFig. 2. Cross-section through the granite body. Note the 1o-
cation ofthe granophyre below limestone beds.
limestones and argillites at a depth of approximately ,l-6 km.The stock is a composite body consisting of a granite and twoditrerent intrusions ofquartz monzonite. The crosscutting rela-tions indicate rhat the granite intruded first, followed by quartzmonzonite I and then by quartz monzonite II (Fig. l).
AIl three lithologic units are texturally and mineralogicallysimilar. The granite tends to be porphyritic (Fig. 3a), while quartzmonzonite I has a seriate texture and is mineralogically and tex-turally the most homogeneous of the three intrusions. Quartzmonzonite II is porphyritic near the contact with quartz mon-zonite I but becomes seriate toward the core. Euhedral oligoclase,equant qrurtz, and minor biotite crystallized early in the para-genetic sequence in all three lithologic units. Although perthitegrains are the largest, they apparently crystallized late in theparagenetic sequence. Titanite, apatite, and zircon are accesso-ries. The core ofquartz monzonite II contains extensively chlori-tized biotite and sericitized plagioclase. Nabelek et al. ( I 983) haveshown that this alteration is primarily due to interaction withfluids that exsolved during crystallization from deeper parts ofthe magma chamber. The presence of a free fluid phase is alsosuggested by miarolitic cavities, containing quartz and micro-cline, that are especially common in the granite. In addition, thegranite is cut by quartz veins, one about 3 m across. The petro-genetic modeling of major- and trace-element data from the stock(Nabelek et al., ms.) suggests that the three intrusions are coge-netic and represent various stages of crystallization and emplace-ment of a chemically fractionated diapir.
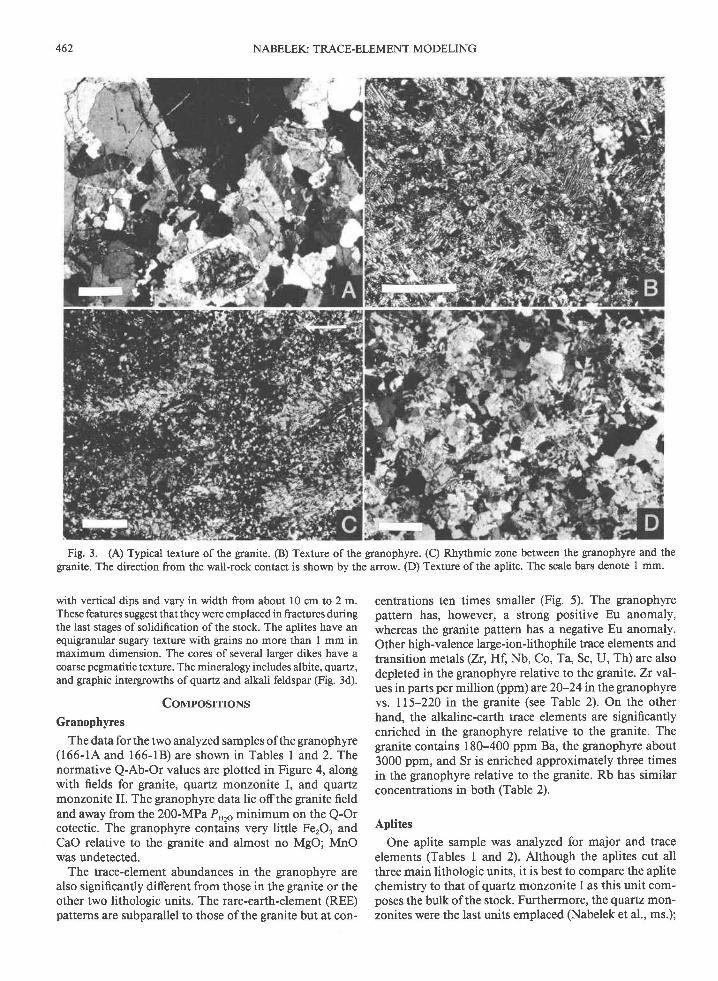
The granophyres are located at horizontal contacts with sedi-mentary rocks. Particularly good examples are the samples 166-1A and 166-18. These sample were collected from an approxi-mately l-m-wide granophyre that occurs along the horizontalcontact between the granite and the limestone layers of the wallrock which form the roof of the magma chamber (Fig. 2). Thelocation of the granophyre near the top of the granite intrusionis similar to that in other plutons, including gabbros (e.g., Car-michael et al., 1974). The granophyre consists solely ofgraphicintergrowths of alkali feldspar and quartz (Fig. 3b). The contactbetween the granophyre and sedimentary layers is sharp. Thecontact between the granophyre and the granite is about l0 cmthick and is characterized by rhythmic, about l-cm-thick grano-phyric and aplitic layers (Fig. 3c). The fine-grained aplitic layers(not to be confused with the aplite dikes discussed below) appearto have acted as nucleation sites for fanning-out alkali feldsparswith intergrown quartz. The $owth direction of the feldspars isaway from the wall-rock contact.
Aplites occur as dikes cutting all three lithologic units and oftencross contacts between the units. The dikes generally strike north
g r a n o P h Y r e
462 NABELEK: TRACE-ELEMENT MODELING
Fig. 3. (A) Typical texture ofthe gxanite. (B) Texture ofthe granophyre. (C) Rhythmic zone between the granophyre and thegranite. The direction from the wall-rock contact is shown by the arrow. (D) Texture of the aplite. The scale bars denote I mm.
with vertical dips and vary in width from about l0 cm to 2 m.These features suggest that they were emplaced in fractures duringthe last stages of solidification of the stock. The aplites have anequigranular sugary texture with grains no more than I mm inmaximum dimension. The cores of several larger dikes have acoarse pegmatitictexture. The mineralogy includes albite, quartz,and graphic intergrowhs of quartz and alkali feldspar (Fig. 3d).
CoprposrrroNs
Granophl'res
The data for the two analyzed samples of the granophyre(166-lA and 166-lB) are shown in Tables I and 2. Thenormative Q-Ab-Or values are plotted in Figure 4, alongwith fields for granite, qvartz morlzonite I, and quartzmonzonite II. The granophyre data lie of the granite fieldand away from the 200-MPa P"ro minimum on the Q-Orcotectic. The granophyre contains very little FerO, andCaO relative to the granite and almost no MgO; MnOwas undetected.
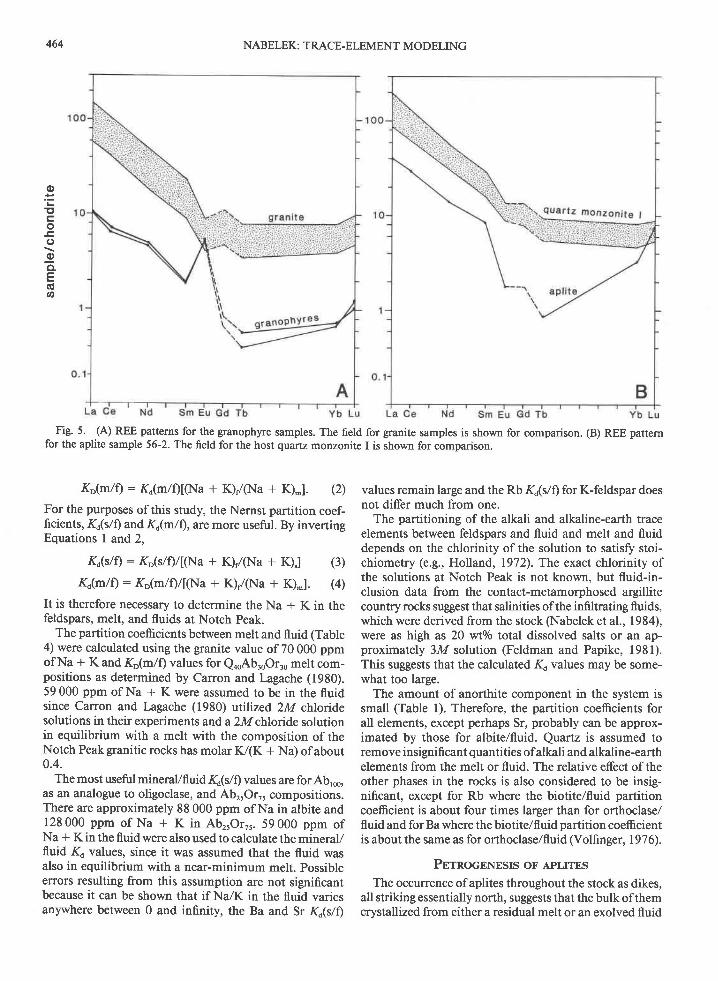
The trace-element abundances in the granophyre arealso significantly different from those in the granite or theother two lithologic units. The rare-earth-element (REE)patterns are subparallel to those ofthe granite but at con-
centrations ten times smaller (Fig. 5). The granophyrepattern has, however, a strong positive Eu anomaly,whereas the granite pattern has a negative Eu anomaly.Other high-valence large-ionJithophile trace elements andtransition metals (Zr,Hf, Nb, Co, Ta, Sc, U, Th) are alsodepleted in the granophyre relative to the granite. Zr val-ues in parts per million (ppm) are 2D-24inthegranophyrevs. I 15-220 in the granite (see Table 2). On the otherhand, the alkaline-earth trace elements are significantlyenriched in the granophyre relative to the granite. Thegranite contains 180-400 ppm Ba, the granophyre about3000 ppm, and Sr is enriched approximately three timesin the granophyre relative to the granite. Rb has similarconcentrations in both (Table 2).
Aplites
One aplite sample was analyzed for major and traceelements (Tables I and 2). Although the aplites cut allthree main lithologic units, it is best to compare the aplitechemistry to that of quartz monzonite I as this unit com-poses the bulk of the stock. Furthefinore, the quartz mon-zonites were the last units emplaced (Nabelek et al., ms.);

NABELEK: TRACE-ELEMENT MODELING 463
Table l. Major-element concentrations and normative values Table 2. Trace-element concentrations in parts per million(ppm)
granophyres apl i te1 6 6 - - r A 1 6 6 - 1 8 5 6 - 2
9 r a n r t er a n g e a
g r a n o p h y r e sr 66-',r A 1 66-1 B
a p l i t e56-2
a v e r a g e a v e r a g eg r a n i t e Q M I QTlI
range_
7 q q
1 2 , 60 . 1 9' 1 . 1 9
0 . 2 11 . 1 03 . 5 65 , 2 10 . 0 7
( w r . Z )S i 0 2A1 203T i 02Fe2b3l'4s0Ca0Na20
Iz9Y 2U5
1 1 . 3 1 1 . 51 0 . 9 1 1 . 80 , 1 6 0 . 1 30 , 3 8 0 . 3 60 . 0 3 0 , 0 1a . ? 1 0 , 2 82 , 0 7 2 . 4 81 , 7 8 8 . r 5N . A . A N . A . A
98.8 r 00 . 7
Y 1 . 3 1 , 3Sr 450 410Rb 210 r80Ba 3320 2760C s 3 . 5 I . 3T h 5 4u 1 . 0 1 . 8Zr 24 20Hf 0 .82 0 .63N b 3 . 4 2 . 6Ta 0 . 56 0 .43G a 1 4 1 3Sc 0 .23 0 . I 7C o 0 . 3 1 0 . 2 6sb 0 .08 0 .09Pb 28 34C u 7 9Z n 4 0 . 4
L a 3 . 3 8 3 . 3 5Ce 5 .93 5 .26N d 3 , i 2 . 8Sm 0 .36 0 .36Eu 0 ,40 0 .38Tb 0 .03 0 . 02Y b 0 . 1 5 0 . ' r 4L u 0 . 0 4 0 . 0 4
6.4- ' ,13 ,9100-190 ( r50)195-345 (260)180-400 (270)2 0 _ 0 q
22-403 . 8 - 1 4 , 01 1 5-?203.4-4 .820-31
1 . 1 - 2 . 7l 5 - 1 7
2 . 1 - 3 . 11 . 4 - 2 . 9
0 .07-0 .7422-366-45
10-22
1 8 . 5 - 3 9 . 135-84 (62)1 r - 3 0 ( 1 8 )
1 . 1 3 - 5 . 1 9 ( 2 . 1 2 )0 .32-0 .85 (0 ,45)0 .1 6 -0 .40b0 . 8 3 - 1 . 7 5 ( 1 . 1 4 )0 . r 6 - 0 . 3 3 ( 0 . 2 4 )
8 . 1 - 1 4 . 6260-410 (300)160-230 (200)260-7 i0 (s00)? .8-9 ,421-49
3 . 4 - 8 . 691-170
2 . 6 - 4 , 216-321 . 3 -8 .614-',18
2.8-4 .02 .5-4 ,2
0 .07-0 .2820-356- r0
I t - J o
27 .2 -48 .548- r30 (84)18-34 (26)
2 . 4 5 - 5 . 5 1 ( 3 . 9 8 )0 . 6 7 - 0 . 9 8 ( 0 . 7 6 )0 .25-0 .45b0 . 8 9 - 1 . 5 2 ( 1 . 2 4 )0 . 1 1 - 0 , 2 9 ( 0 . 2 4 )
7 8 . 012,60 . 0 90 . 9 2Ob0 . 3 73 . 4 84 . 9 00 . 0 2
1 0 0 . 4
3 8 . 42 9 . 029.4
1 . 1
0 . 2 6
0 , 9 2
1 3 , 91 3 . 90 , 2 12 , 0 90 . 5 3' 1 . 6 8
3 . 9 33. s',r0 . 1 l
9 9 . 9
3 3 . 42 0 . 83 3 . 37 . 6
1 1
2 . 0
0 . 0 90 . 2 3
0 . 2 60 . 8 1
9 9 . 8
N . A ,26
29050
2222
2203 . 1
N . A .1 . 8
N . A .2 . 40 . 6 70 . 9 7
N , A .N, A .t 0
37.44 6 . 012.9
1 , 10 . 7 80 , 1 60 . 1 2
0 . 0 1
0, 38
9 8 . 8
3 4 . 44 8 . 11 5 . 2
1 . 0t . t0 . 0 50 . 3 7
0 . 0 1
0. 3't
1 0 0 . 5
T o t a I
(CIPl, , l norm)a0 rAb
N S
D i
n yF CM tI IR uT nA pc
T o t a l
0 , 0 50 . 9 4
1 0 0 . 8
0 . 1 7
1 0 0 . 0
9 9 . 3
32.63 1 . 130. 1
2 a
1 . 7
0 . 3 6
' t4 .2
248 , 41 . 5 80 , r 30 . 0 40.640 . ? 4- 0 . 67
0 .02 0 . 370 .08
a P h o s p h o r u s w a s n o t a n a l y z e d i c t h e g r a n o p h y r e .o B e l o w d e t e c t i o n l i m r t .
therefore, the aplites most likely formed in the last stagesof crystallization of the quartz monzonites. For these rea-sons, the aplite that is modeled was collected in quartzmonzonite I (Fig. l). The aplite contains very little Fe2o3and CaO and contains no measurable MgO and only traceamounts ofMnO and PrOr. Its normative values plot nearthe piercing point for Ab/An : 5.2 on the Q-Ab-Or dia-
$am (Fig.4).The trace-element systematics of the aplite are quite
different from those in the granophyre. The concentrationsof Zr,U, Th, Sc, Ta, and Hf are similar to the ones inquartz monzonite I but are significantly higher than in thegranophyre. Ba and Sr have very low concentrations inthe aplite at 50 and 26 ppm, respectively. The 290 ppmof Rb are within the range of the concentrations in thequartz monzonite I and are only slightly larger than in thegranophyre. The light REEs are depleted approximatelyfive times relative to the quartz monzonite I, and the REEpattern has a slightly negative Eu anomaly (Fig. 5). Thereis a pronounced relative enrichment of the heavy REEs.
PlnrrrroN coEFFrcrENTS
Several models for the petrogenesis of the granophyreand the aplite that include mineraVmelt, fluid/melt, andfluid/mineral equilibria are explored in this paper. Min-eral/melt trace-element partition coeftcients for the phas-es involved (Table 3) are fairly well known and have beenused with success in many petrogenetic studies. The dataofCarron and Lagache (1980) for the partitioning ofRb,Sr, and Ba between hydrothermal solutions and feldsparsand hydrothermal solutions and melts at 700-800'C and200 MPa permit numerical modeling of processes that
a P a r e n t h e s e s i n d i c a t e a v e r a g e v a l u e s u s e d i n c a l c u l a t i o n s a s c o ' s .b E x t r a p o l a t e d v a l u e s o f G d w e r e u s e d i n s t e a d o f T b i n c a l c u l a t i o n s . T h e
v a l u e s w e r e 1 . 6 7 f o r g r a n i t e a n d 2 , 4 9 f o r q u a r t z m o n z o n i t e I .N . A . s i g n i f i e s " n o t a n a i y z e d " .
involve fluids. Unfortunately, these authors did not give
the analytical data but presented only exchange distri-bution coemcients that they defined as
K"G/O: K"G/0tNa + K)"2(Na + K)J, (l)
where Ko(s/fl is C"/C'; C, is the concentration of a traceelement in the fluid, and C. is the concentration in themineral in weight proportions. Carron and Lagache de-fined an analogous equation for the partitioning ofa traceelement between melt and fluid:
Ab or
Fig. 4. Diagram of the normative Q-Ab-Or values. Shown
are frelds for the major units in the stock and values for the aplite
sample 56-2 and the $anophyre samples 166-14 and 166-18.The boundary for Ab/An : 5.2 is after von Platen (1965); Ab/
An = oo is after Tuttle and Bowen (1958); both are at 200-MPapressure.
464 NABELEK: TRACE-ELEMENT MODELING
Fig. 5. (A) REE patterns for the granophyre samples. The field for granite samples is shown for comparison. (B) REE patternfor the aplite sample 56-2. The field for the host quartz monzonite I is shown for comparison.
o=ttco-c()oo.Ecl(t,
K"(m/f): K"(m/|tNa + K),/(Na + K)-1. (2)
For the purposes of this study, the Nernst partition coef-ficients, &(s/0 and Ko(m/f), are more useful. By invertingEquations I ard 2,
&G/0 : K"(s/f)/[(Na + K),/(Na + K)"] (3)
K"(m/|: K"(m/f)/tNa + K),/(Na + K)-1. (4)
It is therefore necessary to determine the Na + K in thefeldspars, melt, and fluids at Notch Peak.
The partition coefrcients between melt and fluid (Table4) were calculated using the granite value of 70 000 ppmof Na + K and Ko(m/f) values for QooAbroOrro melt com-positions as determined by Carron and Lagache (1980).59 000 ppm of Na + K were assumed to be in the fluidsince Carron and Iagache (1980) utilized,2M chloidesolutions in their experiments and a 2M chloide solutionin equilibrium with a melt with the composition of theNotch Peak granitic rocks has molar W(K + Na) of about0.4.
The most usefrrl mineraVfluidKu(s/f) values are forAb,-,as an analogue to oligoclase, and AbrrOr^ compositions.There are approximately 88 000 ppm of Na in albite and128000 ppm of Na + K in AbrrOrr,. 59000 ppm ofNa + K in the fluid were also used to calculate the mineraVfluid K. values, since it was assumed that the fluid wasalso in equilibrium with a near-minimum melt. possibleerrors resulting from this assumption are not significantbecause it can be shown that if Na/K in the fluid variesanywhere between 0 and infinity, the Ba and Sr K"(s/fl
values remain large and the Rb K.(s/| for K-feldspar doesnot differ much from one.
The partitioning of the alkali and alkaline-earth traceelements between feldspars and fluid and melt and fluiddepends on the chlorinity of the solution to satisfy stoi-chiometry (e.g., Holland, 1972). The exact chlorinity ofthe solutions at Notch Peak is not known, but fluid-in-clusion data from the contact-metamorphosed argillitecountry rocks suggest that salinities ofthe infiltrating fluids,which were derived from the stock (Nabelek et al., 1984),were as high as 20 wto/o total dissolved salts or an ap-proximately 3M solution (Feldman and Papike, l98l).This suggests that the calculated Ku values may be some-what too large.
The amount of anorthite component in the system issmall (Table l). Therefore, the partition coefrcients forall elements, except perhaps Sr, probably can be approx-imated by those for albite/fluid. Quartz is assumed toremove insignificant quantities of alkali and alkaline-earthelements from the melt or fluid. The relative efect of theother phases in the rocks is also considered to be insig-nificant, except for Rb where the biotite/fluid partitioncoefficient is about four times larger than for orthoclase/fluid and for Ba where the biotite/fluid partition coefficientis about the same as for orthoclase/fluid (Volfinger,1976).
PnrnocnNrsrs oF ApLrrEs
The occurrence ofaplites throughout the stock as dikes,all striking essentially north, suggests that the bulk ofthemcrystallized from either a residual melt or an exolved fluid
NABELEK: TRACE-ELEMENT MODELING 465
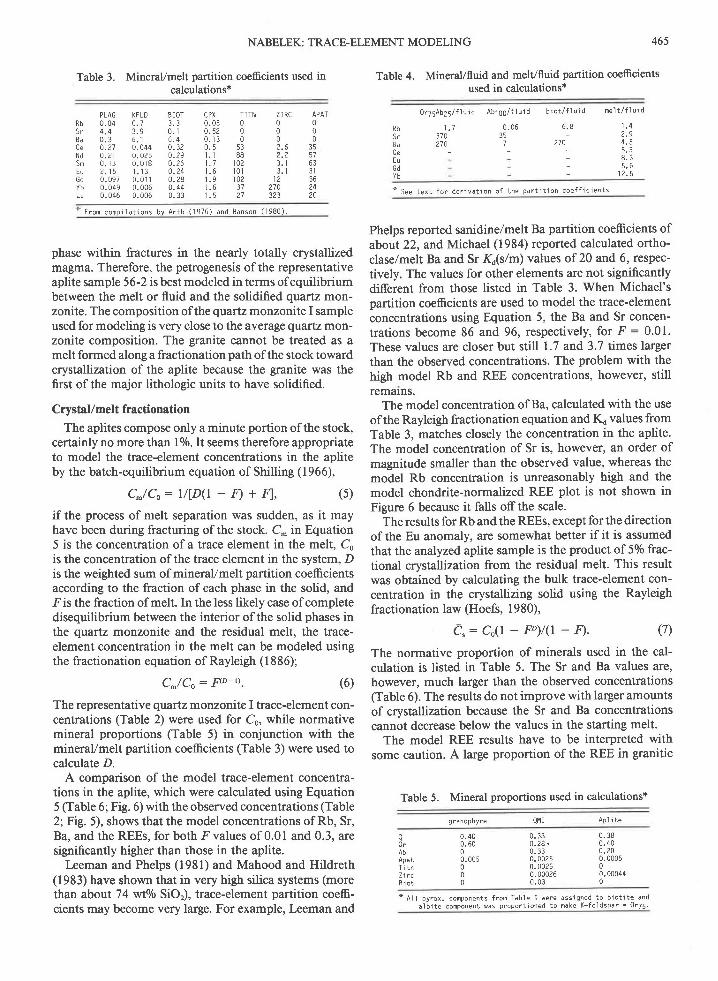
Table 3. MineraVmelt partition coefficients used incalculations*
Table 4. MineraVfluid and melVfluid partition coefrcientsused in calculations*
PLAG KFLD BIOTR b 0 . 0 4 4 . 1 3 , 35 r 4 . 4 3 . 9 0 . 1B a 0 . 3 6 . ' 1 6 . 4Ce 0 .27 0 .044 0 .32N d 0 . 2 1 0 . 0 2 5 0 . 2 9S m 0 . 1 3 0 . 0 1 8 0 . 2 6E u 2 . 1 5 l . ' 1 3 0 . 2 4G d 0 , 0 9 7 0 . 0 i 1 0 , 2 8Yb 0 .049 0 .006 0 . 44Lu 0 .046 0 .006 0 . 33
CPX TITN0 . 0 3 00 , 5 2 00 . 1 3 00 . 5 5 31 . 1 8 81 . 7 1 0 21 . 6 1 0 1r ,9 102r . 6 3 7' 1 . 5 2 1
Z I R C000
2 . 21 1
3 . 11 2
270323
APAT000
3 557633 1562420
RbS rB aC eE uG dY b
0r75Ab25/ f1u id Ab169/ f lu id
1 , 1 0 . 0 6370 35270
_
b i o t / f l u i d m e l t / f l u i d
6 . 8 I . 4t o
2 1 0 4 . 5- q ?- 8 . 3- 5 . 6_ 1 2 . 5
F r o n c o m p i l a t i o n s b v A r t h ( 1 9 7 6 ) a n d H a n s o n ( 1 9 8 0 ) .
phase within fractures in the nearly totally crystallizedmagma. Therefore, the petrogenesis of the representativeaplite sample 56-2 is best modeled in terms ofequilibriumbetween the melt or fluid and the solidified quartz mon-zonite. The composition of the quartz monzonite I sampleused for modeling is very close to the average quartz mon-zonite composition. The ganite cannot be treated as amelt formed along a fractionation path ofthe stock towardcrystallization of the aplite because the granite was thefirst of the major lithologic units to have solidified.
Crystal/melt fractionation
The aplites compose only a minute portion of the stock,certainly no more than l0l0. It seems therefore appropriateto model the trace-element concentrations in the apliteby the batch-equilibrium equation ofShilling (1966),
c^ /Co : t / lD ( l - n+ r f , ( 5 )
if the process of melt separation was sudden, as it mayhave been during fracturing ofthe stock. C- in Equation5 is the concentration of a trace element in the melt, Cois the concentration of the trace element in the system, Dis the weighted sum of mineral/melt partition coemcientsaccording to the fraction of each phase in the solid, andFis the fraction of melt. In the less likely case of completedisequilibrium between the interior of the solid phases inthe quartz monzonite and the residual melt, the trace-element concentration in the melt can be modeled usingthe fractionation equation of Rayleigh ( I 8 86);
C^/Co: I'ro-rt. (6)
The representative quartz monzonite I trace-element con-centrations (Table 2) were used for Co, while normativemineral proportions (Table 5) in conjunction with themineraVmelt partition coefrcients (Table 3) were used tocalculate D.
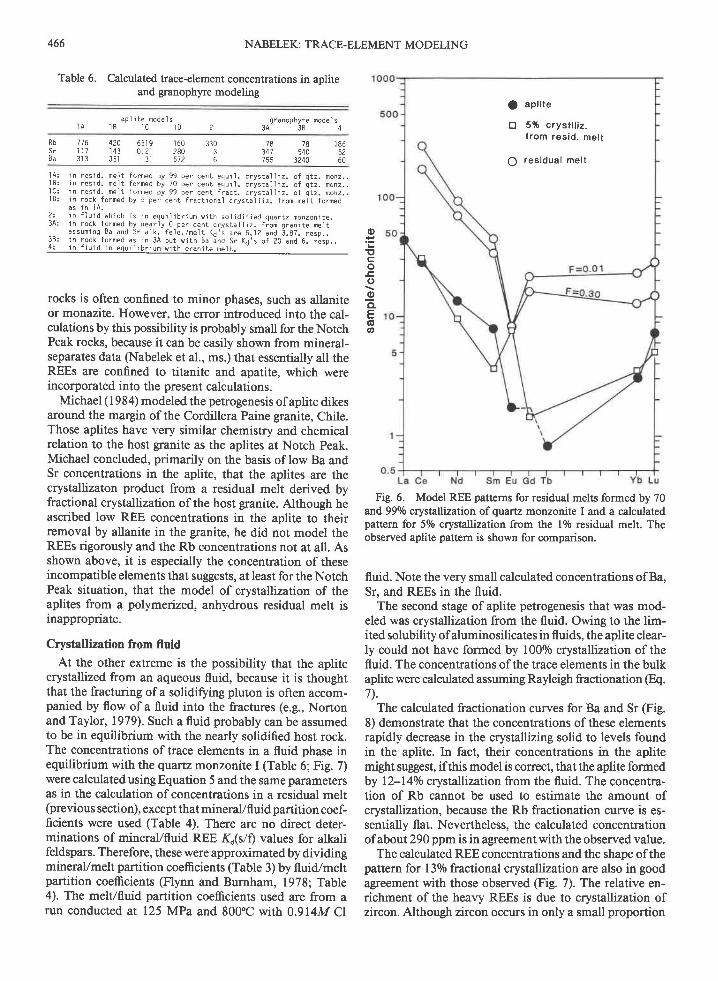
A comparison of the model trace-element concentra-tions in the aplite, which were calculated using Equation5 (Table 6; Fig. 6) with the observed concentrations (Table2;Fig. 5), shows that the model concentrations of Rb, Sr,Ba, and the REEs, for both F values of 0.01 and 0.3, aresignificantly higher than those in the aplite.
keman and Phelps (1981) and Mahood and Hildreth(1983) have shown that in very high silica systems (morethan about 74 wto/o SiOr), trace-element partition coeffi-cients may become very large. For example, Leeman and
* S e e t e x t f o r d e r i v a t i o n o f t h e p d r t i t i o n c o e f f i c i e n t s
Phelps reported sanidine/melt Ba partition coefficients ofabout 22, and Michael (1984) reported calculated ortho-clase/melt Ba and Sr Ko(s/m) values of 20 and 6, respec-tively. The values for other elements are not significantlydifferent from those listed in Table 3. When Michael'spartition coefficients are used to model the trace-elementconcentrations using Equation 5, the Ba and Sr concen-trations become 86 and 96, respectively, for .F : 0.01.These values are closer but still 1.7 and 3.7 times largerthan the observed concentrations. The problem with thehigh model Rb and REE concentrations, however, stillremams.
The model concentration of Ba, calculated with the useofthe Rayleigh fractionation equation and IQ values fromTable 3, matches closely the concentration in the aplite.The model concentration of Sr is, however, an order ofmagnitude smaller than the observed value, whereas themodel Rb concentration is unreasonably htgh and themodel chondrite-normalized REE plot is not shown inFigure 6 because it falls offthe scale.
The results for Rb and the REEs, except for the directionof the Eu anomaly, are somewhat better if it is assumedthat the analyzed aplite sample is the product of 5olo frac-tional crystallization from the residual melt. This resultwas obtained by calculating the bulk trace-element con-centration in the crystallizing solid using the Rayleighfractionation law (Hoefs, 1980),
e": co(l - FD)/Q - n.The normative proportion of minerals used in the cal-culation is listed in Table 5. The Sr and Ba values are,however, much larger than the observed concentrations(Table 6). The results do not improve with larger amountsof crystallization because the Sr and Ba concentrationscannot decrease below the values in the starting melt.
The model REE results have to be interpreted withsome caution. A large proportion of the REE in granitic
Table 5. Mineral proportions used in calculations*
granophyre Ql '4I
(7)
Apl i te
a0rAbApatT i t nZ i r cB i o t
0 . 4 00 , 6 000.005000
0 . 3 30 . 2 8 .0 . 3 30.00250.00250.000260 . 0 3
0 . 3 80 . 4 00 . 2 00.000500.000440
* A 1 1 p y r o x . c o m p o n e n t s f r o m T a b l e 1 w e r e a s s i g n e d t o b i o t i t e a n da l 6 i t e c o m p o n e n t w a s p r o p o r t i o n e d t o m a k e K - f e l d s p a r = 0 1 7 5 .
466 NABELEK: TRACE-ELEMENT MODELING
Rb 116 420 6319 ',160 330 78 78 186
Sr 1 1 7 1 43 0.21 280 3 341 540 528a 31 3 351 31 572 6 755 3Z4O 60
Table 6. Calculated trace-element concentrations in apliteand granophyre modeling
a p l i t e n o d e l sr A
' t B ' l c t D 2
granophyre mode' l s3 4 3 8 4
1 A : i n r e s i d . m e l t f o r m e d b y 9 9 p e r c e n t e q u i l . c r y s t a l l i z , o f q t z . m o n z , .1 B : i n r e s i d . f , e l t f o r m e d b y 7 0 p e r c e n t e q u i l . c r y s t a l l i z . o f q t z . m o n z . .' l C :
i n r e s i d , m e l t f o r m e d b y 9 9 p e r c e n t f r a c t . c r y s t a l l i z . o f q t z . n o n z . .l D ; i n r o c k f o r m e d b y 5 p e r c e n t f r a c t i o n a l c r y s t a l l i z . f r o m m e l t f o r m e d
d s i n 1 4 ,2 : i n f l u i d w h i c h i s j n e q u r ' l i b r i u n w i t h s o l i d i f i e d q u a r t z m o n z o n j t e ,3 A : i n r o c k f o r m e d b y n e a r l y 0 p e r c e n t c r y s t a l l r z . f r o m q r a n i t e m e l t
- a s s u m i n g B a a n d S r a l k . f e l d . / m e l t K 6 ' s a r e 6 . 1 2 a n d 3 . g 7 , r e s p . .3 8 : i n r o c k f o r m e d a s i n 3 4 b u t w i t h B a i n d S r K ; ' s o f 2 0 a n d 6 , r e s p . ,4 ! i n f l u i d i n e q u i l l b r i u m w i t h q r a n i t e m e l t . "
rocks is often confined to minor phases, such as allaniteor monazite. However, the error introduced into the cal-culations by this possibility is probably small for the NotchPeak rocks, because it can be easily shown from mineral-separates data (Nabelek et al., ms.) that essentially all theREEs are confined to titanite and apatite, which wereincorporated into the present calculations.
Michael (1984) modeled the petrogenesis of aplite dikesaround the margin of the Cordillera Paine granite, Chile.Those aplites have very similar chemistry and chemicalrelation to the host granite as the aplites at Notch Peak.Michael concluded, primarily on the basis of low Ba andSr concentrations in the aplite, that the aplites are thecrystallizaton product from a residual melt derived byfractional crystallization of the host granite. Although heascribed low REE concentrations in the aplite to theirremoval by allanite in the granite, he did not model theREEs rigorously and the Rb concentrations not at all. Asshown above, it is especially the concentration of theseincompatible elements that suggests, at least for the NotchPeak situation, that the model of crystallization of theaplites from a polymerized, anhydrous residual melt isinappropriate.
Crystallization from fluid
At the other extreme is the possibility that the aplitecrystallized from an aqueous fluid, because it is thoughtthat the fracturing of a solidifying pluton is often accom-panied by flow of a fluid into the fractures (e.g., Nortonand Taylor, 1979). Such a fluid probably can be assumedto be in equilibrium with the nearly solidified host rock.The concentrations of trace elements in a fluid phase inequilibrium with the quartz monzonite I (Table 6;Fig.7)were calculated using Equation 5 and the same parametersas in the calculation of concentrations in a residual melt(previous section), except that mineral/fluid partition coef-ficients were used (Table 4). There are no direct deter-minations of mineral/fluid REE K.G/| values for alkalifeldspars. Therefore, these were approximated by dividingmineraVmelt partition coefrcients (Table 3) by fluid.zmeltpartition coefficients (Flynn and Burnham, 1978; Table4). The melt/fluid partition coefficients used are from arun conducted at 125 MPa and 800.C with 0.914M Cl
Fig. 6. Model REE patterns for residual melts formed by 70and 990/o crystallization of quartz monzonite I and a calculatedpattern for 5o/o crystzlllzation from the 1% residual melt. Theobserved aplite pattern is shown for comparison.
fluid. Note the very small calculated concentrations of Ba,Sr, and REEs in the fluid.
The second stage of aplite petrogenesis that was mod-eled was crystallization from the fluid. Owing to the lim-ited solubility of aluminosilicates in fluids, the aplite clear-ly could not have formed by l00o/o crystallization of thefluid. The concentrations of the trace elements in the bulkaplite were calculated assuming Rayleigh fractionation @q.7).
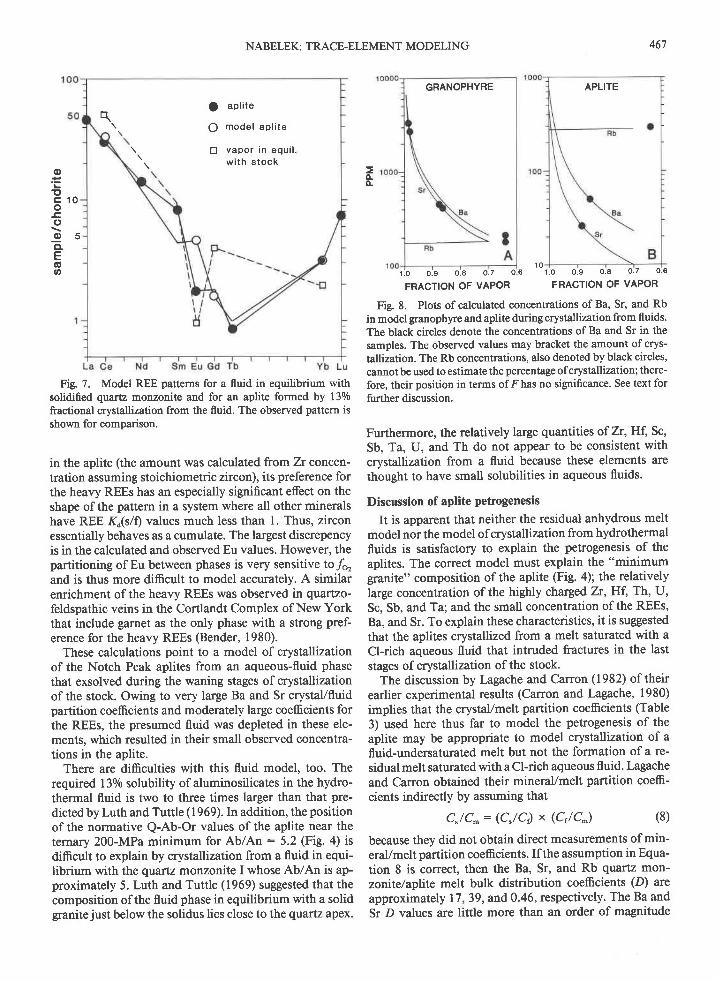
The calculated fractionation curves for Ba and Sr (Fig.8) demonstrate that the concentrations of these elementsrapidly decrease in the crystallizing solid to levels foundin the aplite. In fact, their concentrations in the aplitemight suggest, ifthis model is correct, that the aplite formedby l2-l4o/o crystallization from the fluid. The concentra-tion of Rb cannot be used to estimate the amount ofcrystallization, because the Rb fractionation curve is es-sentially flat. Nevertheless, the calculated concentrationof about 290 ppm is in agreement with the observed value.
The calculated REE concentrations and the shape ofthepattern for 130/o fractional crystallization are also in goodagreement vrith those observed (Fig. 7). The relative en-richment of the heavy REEs is due to crystallization ofzircon. Although zircon occurs in only a small proportion
o.=Eco-cooCLEcto
O ap l i t e
t r 5% cryst l l iz .t r om res i d . me l t
Q res i dua l me l t
n I aP l i t e
\ . Q mode l ap l i t e
\ t r vapo r i n equ i l .t t w i t h s t ock
o.=!tc 1 0o
Eoo 5ctE6o
NABELEK: TRACE-ELEMENT MODELING 467
APLITE
1 0
o-o-
GRANOPHYRE
Fig. 7. Model REE patterns for a fluid in equilibrium withsolidified quartz monzonite and for an aplite formed by 130/ofractional crystallization from the fluid. The observed pattern isshown for comparison.
in the aplite (the amount was calculated from Zr concen-tration assuming stoichiometric zircon), its preference forthe heavy REEs has an especially significant effect on theshape of the pattern in a system where all other mineralshave REE Ku(s/| values much less than l. Thus, zirconessentially behaves as a cumulate. The largest discrepencyis in the calculated and observed Eu values. However, thepartitioning ofEu between phases is very sensitive to/o,and is thus more difrcult to model accurately. A similarenrichment of the heavy REEs was observed in quartzo-feldspathic veins in the Cortlandt Complex of New Yorkthat include garnet as the only phase with a strong pref-erence for the heavy REEs (Bender, 1980).
These calculations point to a model of crystallizationof the Notch Peak aplites from an aqueous-fluid phasethat exsolved during the waning stages of crystallizationof the stock. Owing to very large Ba and Sr crystaVfluidpartition coefficients and moderately large coefficients forthe REEs, the presumed fluid was depleted in these ele-ments, which resulted in their small observed concentra-tions in the aplite.
There are difrculties with this fluid model, too. Therequired I 30lo solubility of aluminosilicates in the hydro-thermal fluid is two to three times larger than that pre-dicted by Luth and Tuttle (1969). In addition, the positionof the normative Q-Ab-Or values of the aplite near theternary 200-MPa minimum for Ab/An : 5.2 (Fig. 4) isdifrcult to explain by crystallization from a fluid in equi-librium with the quartz monzonite I whose Ab/An is ap-proximately 5. Luth and Tuttle (1969) suggested that thecomposition of the fluid phase in equilibrium with a solidgranitejust below the solidus lies close to the quartz apex.
l .o o .g 0 .8 0 .7 0 6 r .o 0 .9 0 .8 0 .7 0 .6
FRACTION OF VAPORFRACTION OF VAPOR
Fig. 8. Plots ofcalculated concentrations ofBa, Sr, and Rbin model granophyre and aplite during crystallization from fluids.The black circles denote the concentrations ofBa and Sr in thesamples. Thc observed values may bracket the amount of crys-tallization. The Rb concentrations, also denoted by black circles,cannot be used to estimate the percentage ofcrystallization; there-fore, their position in terms ofF has no significance. See text forfurther discussion.
Furthermore, the relatively large quantities of Zr, Hf, Sc'Sb, Ta, U, and Th do not appear to be consistent withcrystallization from a fluid because these elements arethought to have small solubilities in aqueous fluids.
Discussion of aplite petrogenesis
It is apparent that neither the residual anhydrous meltmodel nor the model of crystallization from hydrothermalfluids is satisfactory to explain the petrogenesis of theaplites. The correct model must explain the "minimumgranite" composition of the aplite (Fig. a); the relativelylarge concentration of the highly charged Zx, Hf, Th, U,Sc, Sb, and Ta; and the small concentration of the REEs,Ba, and Sr. To explain these characteristics, it is suggestedthat the aplites crystallized from a melt saturated with aCl-rich aqueous fluid that intruded fractures in the laststages of crystallization of the stock.
The discussion by Lagache and Carron (1982) oftheirearlier experimental results (Carron and Lagache, 1980)implies that the crystaVmelt partition coefficients (Table
3) used here thus far to model the petrogenesis of theaplite may be appropriate to model crystallization of afluid-undersaturated melt but not the formation of a re-sidual melt saturated with a Cl-rich aqueous fluid. Lagacheand Carron obtained their mineraVmelt partition coefr-cients indirectly by assuming that
C"/C^: (C"/C) x (C'/C^) (8)
because they did not obtain direct measurements of min-erallmelt partition coefrcients. Ifthe assumption in Equa-tion 8 is correct, then the Ba, Sr, and Rb quartz mon-zonitelaplite melt bulk distribution coefficients (D) areapproximately 17 ,39, and 0.46, respectively. The Ba andSr D values are little more than an order of magnitude
468 NABELEK: TRACE-ELEMENT MODELING
larger than the D values derived using partition coem-cients from Table 3, while the Rb D is about twice aslarge. If these D values and an,F value of 0.01 are usedin Equation 5, the model melt has 30, 9, and 430 ppm ofBa, Sr, and Rb, respectively. These values are reasonablyclose to the measured concentrations. Iflagache and Car-ron's partition coeftcients are correct, then these resultssuggest that the aplite did indeed crystallize from anaqueous-fluid-saturated melt.
The reason for the apparent difference between mineral/anhydrous melt and mineral/Cl-rich-fl uid-saturated meltpartition coefficients is not clear. Chlorine does not greatlyaffect the melt structure because it partitions preferentiallyinto the aqueous-fluid phase (e.9., Kilinc and Burnham,1972). However, a large concentration of chlorine in thefluid phase may affect the partitioning of alkaline-earthelements in the solid-melt-fluid system.
The partitioning between minerals and melt may bealso affected by changes in the melt structure when as-sociated with a free fluid phase. Stolper (1982) has shownthat at high water contents, a substantial fraction ofwaterdissolved in a silicate melt may be in the form of molecularHrO. Perhaps under such conditions, alkaline-earth ele-ments are substantially rejected from the melt structurewhile the effect on Rb and Cs is smaller, as evidenced bytheir similar concentrations in the quartz monzonite andthe aplite.
The structure of the silicate melt may also be affectedby fluorine, which preferentially dissolves in melts (e.g.,Bailey, 1977). However, there is no strong evidence forsubstantial amounts of fluorine in the Notch Peak com-plex. Thus, its efect remains speculative.
It appears, therefore, that the retention characteristicsof Ba, Sr, and Rb in a melt saturated with a Cl-rich fluidare similar to those in an aqueous fluid. This is substan-tiated by melVfluid partition coefficients that are no morethan 5 (Table 4). The REE melt/fluid partition coefrcientsare not much larger; therefore, the REE bulk partitioncoefficients (D) between the quartz monzonite and a meltsaturated with a Cl-rich fluid may also be greater thanunity. The melt should have, therefore, a REE patternsimilar to the one calculated for a fluid in equilibriumwith the solidified quartz monzonite (Fig. 7). The relativeenrichment of the heavy REEs, which is observed in theaplite pattern, nevertheless needs to be explained by ac-cumulation of zircon.
The partitioning behavior of highly charged elementssuch as Zr,Th, Hf, Ta, and U between minerals and meltmay not be affected much by saturation of the system withCl-rich fluids because these elements may behave as net-work-formers. In a melt with a high HrO content, theirsolubility may in fact increase to a limited extent, as itdoes, for example, for Zr (Watson and Harrison, 1983).
The model for the petrogenesis of the Notch Peak aplitemay be applicable to the petrogenesis ofmany pegmatites.Aplites throughout the world have elemental enrichmentand depletion characteristics, relative to the host granites,similar to those of the Notch Peak aplites. Moreover many
large pegmatites also have generally small concentrationsof alkaline-earth elements and lower concentrations of theREEs than the associated parental rocks and tend to beenriched in highly charged elements (e.g., Walker, 1984).However, the petrogenesis of such pegmatites may be dif-ficult to model numerically to a large precision because,as shown here, the partition coefficients of trace elementsbetween minerals and anhydrous granitic melts may notbe applicable. Furthermore, direct measurements of par-tition coefficients between minerals and melts saturatedwith Cl-rich fluids are still lacking. Mineral/fluid and melVfluid coefficients may nevertheless be used to bracket themost plausible models.
Prrnocnutsrs oF GRANopHyRE
The very low concentrations oflarge-ion-lithophile ele-ments in the granophyre preclude that the granophyrerepresents a residual melt formed on crystallization of thestock, because crystal/melt fractionation processes ingranitic rocks generally lead to enrichment of such ele-ments (see, for example, the previous section on aplites).However, the granophyre may be an early-crystallizedrock that formed by fractionation from the granite melt,or it may be a rock that crystallized from an aqueous fluidthat exsolved sometime during solidification of the stockand subsequently pooled under a limestone bed (Fig. 2)that was impermeable to fluids (Nabelek et al., 1984). Bothpossibilities are numerically modeled here.
Crystallization from melt
The position of the normative composition of thegranophyre on the 200-MPa Q-Or cotectic boundary onthe granite ternary diagram (Fig. a) and the positive Euanomaly in the REE pattern (Fig. 5) could be consistentwith crystal accumulation from the granite magma. Crys-tal accumulation is best modeled by Rayleigh fractiona-tion where the average concentration of a trace elementin the solid, C., is given by Equation 7. The maximumand minimum possible concentrations of compatible andincompatible trace elements, respectively, in the grano-phyre (Fig. 9, Table 6) were obtained by multiplying Dby Co using the average trace-element concentrations inthe granite (Table 2) for Co, the partition coefficients listedin Table 3, and the normative mineral proportions in thegranophyre (Table 5) for D. The proportion of apatite wasobtained by point counting because phosphorus analyseswere not obtained for the granophyre samples.
The calculated Ba and Sr concentrations are not as largeas in the granophyre, whereas the calculated Rb concen-tration is about three times less than the observed value(compare with Table 2). The calculated REE pattern is,however, very close to the observed pattern. When Mi-chael's (1984) Ba and Sr K"(s/f) values of 20 and 6, re-spectively, are used, the calculated concentrations arc 3240ppm for Ba and 540 ppm for Sr. These values are closeenough to the measured concentrations to suggest that thegranophyre may have formed by fractional crystallizationof the granite magma. However, other features of the
NABELEK: TRACE-ELEMENT MODELING 469
granophyre, which are discussed below, preclude this pos-sibility.
Crystallization from fluid
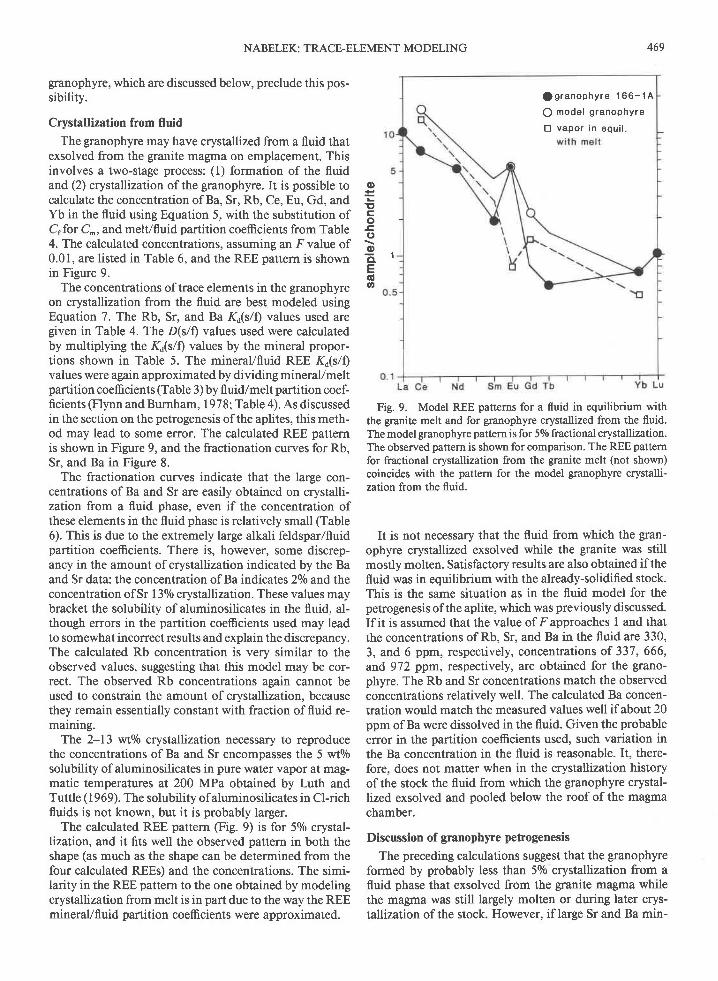
The granophyre may have crystallized from a fluid thatexsolved from the granite magma on emplacement. Thisinvolves a two-stage process: (1) formation of the fluidand (2) crystallization of the granophyre. It is possible tocalculate the concentration of Ba, Sr, Rb, Ce, Eu, Gd, andYb in the fluid using Equation 5, with the substitution ofCrfor C^, and melt/fluid partition coefficients from Table4. The calculated concentrations, assuming an f' value of0.01, are listed in Table 6, and the REE pattern is shownin Figure 9.
The concentrations of trace elements in the granophyreon crystallization from the fluid are best modeled usingEquation 7. The Rb, Sr, and Ba K.(s/| values used aregiven in Table 4. The D(s/f) values used were calculatedby multiplying the Kd(s/0 values by the mineral propor-tions shown in Table 5. The mineral/fluid REE K"(s/f)values were again approximated by dividing mineral/meltpartition coefficients (Table 3) by fluid/melt partition coef-ficients (Flynn and Burnham,19781, Table 4). As discussedin the section on the petrogenesis of the aplites, this meth-od may lead to some error. The calculated REE patternis shown in Figure 9, and the fractionation curves for Rb,Sr, and Ba in Figure 8.
The fractionation curves indicate that the large con-centrations of Ba and Sr are easily obtained on crystalli-zation from a fluid phase, even if the concentration ofthese elements in the fluid phase is relatively small (Table6). This is due to the extremely large alkali feldspar/fluidpartition coefficients. There is, however, some discrep-ancy in the amount of crystallization indicated by the Baand Sr data: the concentration ofBa indicates 20lo and theconcentration of Sr 130/o crystallization. These values maybracket the solubility of aluminosilicates in the fluid, al-though errors in the partition coefficients used may leadto somewhat incorrect results and explain the discrepancy.The calculated Rb concentration is very similar to theobserved values, suggesting that this model may be cor-rect. The observed Rb concentrations again cannot beused to constrain the amount of crystallization, becausethey remain essentially constant with fraction of fluid re-maining.
The 2-13 wto/o crystallization necessary to reproducethe concentrations of Ba and Sr encompasses the 5 wto/osolubility of aluminosilicates in pure water vapor at mag-matic temperatures at 200 MPa obtained by Luth andTuttle (1969). The solubility of aluminosilicates in Cl-richfluids is not known, but it is probably larger.
The calculated REE pattern (Fig. 9) is for 5olo crystal-lization, and it fits well the observed pattern in both theshape (as much as the shape can be determined from thefour calculated REEs) and the concentrations. The simi-Iarity in the REE pattern to the one obtained by modelingcrystallization from melt is in part due to the way the REEmineral/fluid partition coefficients were approximated.
Fig. 9. Model REE patterns for a fluid in equilibrium withthe granite melt and for granophyre crystallized from the fluid.The model granophyre pattern is for 590 fractional crystallization.The observed pattern is shown for comparison. The REE patternfor fractional crystallization from the granite melt (not shown)coincides with the pattern for the model granophyre crystalli-zation from the fluid.
It is not necessary that the fluid from which the gran-ophyre crystallized exsolved while the granite was stillmostly molten. Satisfactory results are also obtained if thefluid was in equilibrium with the already-solidified stock.This is the same situation as in the fluid model for thepetrogenesis ofthe aplite, which was previously discussed.If it is assumed that the value of -Fapproaches 1 and thatthe concentrations of Rb, Sr, and Ba in the fluid are 330,3, and 6 ppm, respectively, concentrations of 337, 666,and 972 ppm, respectively, are obtained for the grano-phyre. The Rb and Sr concentrations match the observedconcentrations relatively well. The calculated Ba concen-tration would match the measured values well if about 20ppm of Ba were dissolved in the fluid. Given the probableerror in the partition coefficients used, such variation inthe Ba concentration in the fluid is reasonable. It, there-fore, does not matter when in the crystallization historyof the stock the fluid from which the granophyre crystal-lized exsolved and pooled below the roof of the magmachamber.
Discussion of granophyre petrogenesis
The preceding calculations suggest that the granophyreformed by probably less than 5o/o crystallization from afluid phase that exsolved from the granite magma whilethe magma was still largely molten or during later crys-tallization of the stock. However, if large Sr and Ba min-
o=
L
!,co
E(,oCLEoo
f g r a n o p h y r e 1 6 6 - 1 A
Q mode l g ranophy re
D vapo r i n equ i l .
470 NABELEK: TRACE-ELEMENT MODELING
o t* r,l*o*o t?itporlo't
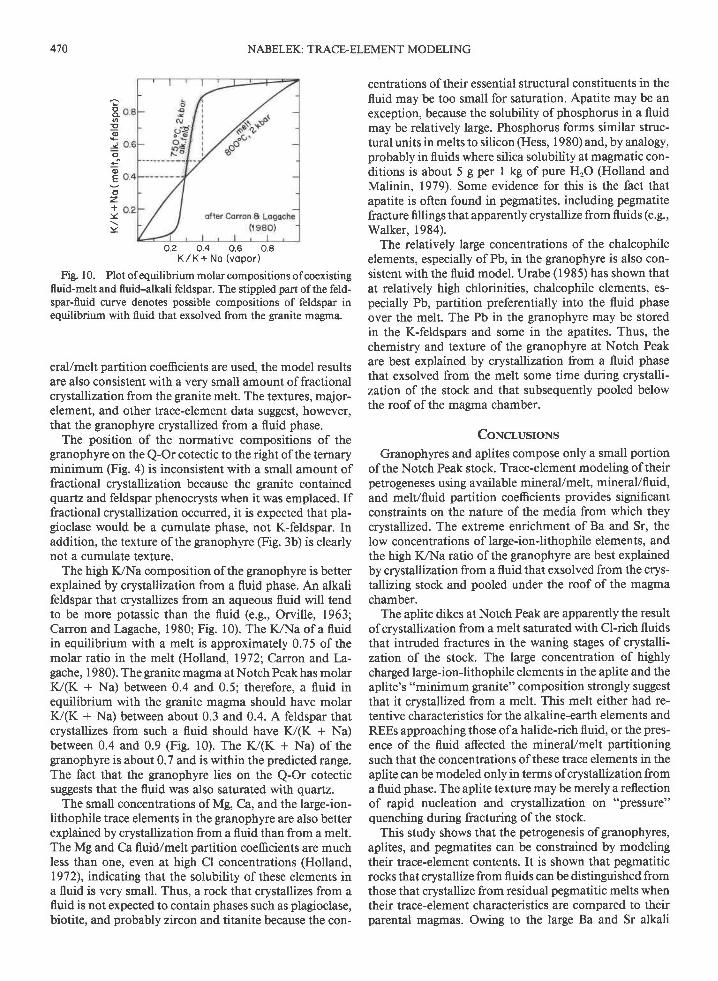
Fig. 10. Plot ofequilibrium molar compositions of coexistingfluid-melt and fluid-alkali feldspar. The stippled part ofthe feld-spar-fluid curve denotes possible compositions of feldspar inequilibrium with fluid that exsolved from the granite magma.
erallmelt partition coemcients are used, the model resultsare also consistent with a very small amount of fractionalcrystallization from the granite melt. The textures, major-element, and other trace-element data suggest, however,that the granophyre crystallized from a fluid phase.
The position of the normative compositions of thegranophyre on the Q-Or cotectic to the right of the ternaryminimum (Fig. a) is inconsistent with a small amount offractional crystallization because the granite containedquartz and feldspar phenocrysts when it was emplaced. Iffractional crystallization occurred, it is expected that pla-gioclase would be a cumulate phase, not K-feldspar. Inaddition, the texture ofthe granophyre (Fig. 3b) is clearlynot a cumulate texture.
The high K./Na composition of the granophyre is betterexplained by crystallization from a fluid phase. An alkalifeldspar that crystallizes from an aqueous fluid will tendto be more potassic than the fluid (e.g., Orville, 1963;Carron and Lagache, 1980; Fig. l0). The K,rNa of a fluidin equilibrium with a melt is approximately 0.75 of themolar ratio in the melt (Holland, 19721' Carron and La-gache, 1980). The granite magma at Notch Peak has molarK/(K + Na) between 0.4 and 0.5; therefore, a fluid inequilibrium with the granite magma should have molarK/(K + Na) between about 0.3 and 0.4. A feldspar thatcrystallizes from such a fluid should have K/(K + Na)between 0.4 and 0.9 (Fig. l0). The K/(K + Na) of thegranophyre is about 0.7 and is within the predicted range.The fact that the granophyre lies on the Q-Or cotecticsuggests that the fluid was also saturated with quartz.
The small concentrations of Mg, Ca, and the large-ion-lithophile trace elements in the granophyre are also betterexplained by crystallization from a fluid than from a melt.The Mg and Ca fluid/melt partition coefficients are muchless than one, even at high Cl concentrations (Holland,1972), indrcating that the solubility of these elements ina fluid is very small. Thus, a rock that crystallizes from afluid is not expected to contain phases such as plagioclase,biotite, and probably zircon and titanite because the con-
centrations of their essential structural constituents in thefluid may be too small for saturation. Apatite may be anexception, because the solubility of phosphorus in a fluidmay be relatively large. Phosphorus forms similar struc-tural units in melts to silicon (Hess, 1980) and, by analogy,probably in fluids where silica solubility at magmatic con-ditions is about 5 g per I kg of pure HrO (Holland andMalinin, 1979). Some evidence for this is the fact thatapatite is often found in pegmatites, including pegmatitefracture frllings that apparently crystallize from fluids (e.g.,Walker, 1984).
The relatively large concentrations of the chalcophileelements, especially of Pb, in the granophyre is also con-sistent with the fluid model. Urabe (1985) has shown thatat relatively high chlorinities, chalcophile elements, es-pecially Pb, partition preferentially into the fluid phaseover the melt. The Pb in the granophyre may be storedin the K-feldspars and some in the apatites. Thus, thechemistry and texture of the granophyre at Notch Peakare best explained by crystallization from a fluid phasethat exsolved from the melt some time during crystalli-zation of the stock and that subsequently pooled belowthe roof of the magma chamber.
CoNcr,usroNs
Granophyres and aplites compose only a small portionof the Notch Peak stock. Trace-element modeling of theirpetrogeneses using available mineral/melt, mineral/fluid,and melVfluid partition coefficients provides significantconstraints on the nature of the media from which theycrystallized. The extreme enrichment of Ba and Sr, thelow concentrations of large-ion-lithophile elements, andthe high K/Na ratio of the granophyre are best explainedby crystallization from a fluid that exsolved from the crys-tallizing stock and pooled under the roof of the magmachamber.
The aplite dikes at Notch Peak are apparently the resultof crystallization from a melt saturated with Cl-rich fluidsthat intruded fractures in the waning stages of crystalli-zation of the stock. The large concentration of highlycharged large-ionJithophile elements in the aplite and theaplite's "minimum granite" composition strongly suggestthat it crystallized from a melt. This melt either had re-tentive characteristics for the alkaline-earth elements andREEs approaching those ofa halide-rich fluid, or the pres-ence of the fluid affected the mineral/melt partitioningsuch that the concentrations of these trace elements in theaplite can be modeled only in terms ofcrystallization froma fluid phase. The aplite texture may be merely a reflectionof rapid nucleation and crystallization on "pressure"quenching during fracturing ofthe stock.
This study shows that the petrogenesis ofgranophyres,aplites, and pegmatites can be constrained by modelingtheir trace-element contents. It is shown that pegrnatiticrocks that crystallize from fluids can be distinguished fromthose that crystallize from residual pegmatitic melts whentheir trace-element characteristics are compared to theirparental magmas. Owing to the large Ba and Sr alkali
ocl6
E'o
I
o
oEoz+:<
)<
NABELEK: TRACE-ELEMENT MODELING 471
feldspar/fluid paftition coefrcients and the apparently largealkali feldspar/pegmatitic melt partition coefficients, frac-tional crystallization from pegmatitic melts and fluids canlead to large gradients of Ba and Sr in large pegmatites.It is also shown that irrespective of which medium thepegmatites crystallize from, their REE concentrationsprobably will be lower than those in the parental magma.Direct measurements of trace-element partition coeffi-cients between minerals and fluids saturated with Cl-richfluids and the determination of the concentration of allthe elements in such fluids are needed for more precisemodeling.
AcrNowr,nocMENTS
This research was funded by a fellowship at Battelle-PacificNorthwest Laboratories with the Northwest College and Uni-versity Association for Science (University ofWashington) underContract EY-76-S-06-2225 with the Department of Energy. Ad-ditional support was provided by the University of MissouriGeology Development Fund. Many thanks go to Jim Papike andGil Hanson for discussions on the subject, Neal White for assis-tance in the field, and to Rich Walker and Carol Nabelek forreviews of an earlier version of the manuscript. Two anonymousreviewers and Gordon E. Brown, Jr., provided many useful sug-gestions.
RnrnnnNcnsfuth, J.G. (1976) Behavior of trace elements during magmatic
processes-A summary of theoretical models and their appli-cations. U.S. Geological Survey Journal of Research,4, 4l-47 .
Bailey, J.C. ( I 977) Fluorine in granitic rocks and melts: A review.Chemical Geology, 19, l-42.
Bender, J.F. (1980) Petrogenesis of the Cortlandt Complex. Ph.D.thesis, State University of New York at Stony Brook.
Carmichael, I.S.E., Turner, F.J., and Verhoogen, J. 097q h-neous petrology. McGraw-Hill, New York.
Carron, J-P., and lagache, M. (1980) Etude exp6rimentale dufractionnement des 6l6ments Rb, Cs, Sr, et Ba entre feldspathsalkalins, solutions hydrothermales et liquides silicat6s dans lesysteme Q.Ab.Or.HrO i 2 kbar entre 700 et 800'C. Bulletin
- de Min€ralogie, 103, 571-578.Cernf, Petr, Ed. (1982) Granitic pegmatites in science and in-
dustry. Mineralogical Association of Canada, Short CourseHandbook 8.
Feldman, M.D., and Papike, J.J. (1981) Metamorphic fluid com-positions from the Notch Peak aureole, Utah. (abs.) EOS(American Geophysical Union Transactions), 62, 435.
Flynn, R.T., and Burnham, C.W. (1978) An experimental de-termination of rare earth partition coefrcients between a chlo-ride containing vapor phase and silicate melts. Geochimica etCosmochimica Acta, 42, 685-701.
Hanson, G.H. (1980) Rare earth elements in petrogenetic studiesof igneous systems. Annual Reviews of Earth and PlanetarySciences, 8,371-406.
Hess, P.C. (1980) Polymerization model for silicate melts. InR.B. Hargraves, Ed. Physics of magrnatic processes, 3-48.Princeton University Press, Princeton, New Jersey.
Hoefs, Jochen (1980) Stable isotope geochemistry. Springer-Ver-lag, New York.
Holland, H.D. (1972) Granites, solutions, and base metal de-posits. Economic Geology, 67, 281-301.
Holland, H.D., and Malinin, S.D. (1979) The solubility and oc-currence of non-ore minerals. In H.E. Barnes, Ed. Geochem-istry ofhydrothermal ore deposits, 2nd edition, 46 1-508. JohnWiley, New York.
Jahns, R.H., and Burnham, C.W. (1957) Preliminaryresultsfrom
experimental melting and crystallization of Harding, NewMexico, pegmatite. Geological Society ofAmerica Bulletin, 68,r7 5r-17 52.
- (1969) Experimental studies of pegmatite genesis: l. Amodel for the derivation and crystallization of granite peg-matites. Economic Geology, 64, 843-864.
Kilinc, I.A., and Burnham, C.W. (1972) Partitioning of chloridebetween a silicate melt and coexisting aqueous phase from 2to 8 kbars. Economic Geology, 67,231-235.
Lagache, M., and Carron, J.-P. (1982) Zonation des dl€ments entrace au cours de la croissance des cristaux dans les bainssilicatEs: L'example de Rb, Cs, Sr et Ba dans le systdme Qz-Ab-Or-HrO. Geochimica et Cosmochimica Acta, 46, 2I5l-2158.
Laul, J.C. (1979) Neutron activation analysis of geological ma-terials. Atomic Energy Review, I7, 603-695.
Leeman, W.P., and Phelps, D.W. (1981) Partitioning of rare earthsand other trace elements between sanidine and coexisting vol-canic glass. Journal ofGeophysical Research, 86, 10193-10199.
Luth, W.C., and Tuttle, O.F. (1969) The hydrous vapor phasein equilibrium with granite and granite magmas. GeologicalSociety of America Memoir 115, 513-548.
Mahood, Gail, and Hildreth, W. (1983) Large partition coefr-cients for elements in high-silica rhyolites. Geochimica et Cos-mochimica Aclz, 47, l l-30.
Michael, P.J. (1984) Chemical differentiation of the CordilleraPaine granite (southern Chile) by in situ crystallization. Con-tributions to Mineralogy and Petrology, 87, 179-195.
Nabelek, P.I., O'Neil, J.R., and Papike, J.J. (1983) Vapor phaseexsolution as a controlling factor in hydrogen isotope variationin granitic rocks: The Notch Peak granitic stock, Utah. Earthand Planetary Science Letters, 66, 137-150.
Nabelek, P.I., tabotka, T.C., O'Neil, J.R., and Papike, J.J. (1984)Contrasting fluid/rock interaction between the Notch Peakgranitic intrusion and argillites and limestones in western Utah:Evidence from stable isotopes and phase assemblages. Con-tributions to Mineralogy and Petrology, 86,25-34.
Norton, D., and Taylor, H.P., Jr. (1979) Quantitative simulationof the hydrothermal systems of crystallizing magmas on thebasis oftransport theory and oxygen isotope data: An analysisofthe Skaergaard intrusion. Journal ofPetrology, 20, 421-486.
Orville, P.M. (1963) Alkali ion exchange between vapor andfeldspar phases. American Journal of Science, 26I, 201-237 .
Rayleigh, J.W.S. (1886) Theoretical considerations respecting theseparation ofgases by difrrsion and similar processes. Philo-sophical Magazine, 42, 7 7 -lO7 .
Shilling, J.-G. (1966) Rare earth fractionation in Hawaiian vol-canic rocks. Ph.D. thesis, Massachusetts Institute of Technol-ogy, Cambridge, Massachusetts.
Stolper, Edward (1982) The speciation of water in silicate melts.Geochimica et Cosmochimica Acta, 46, 2609-2620.
Tuttle, O.F., and Bowen, N.L. (1958) The origin of granite inlight of experimental studies in the system NaAlSirOr-KAl-Si3Os-SiOr-HrO. Geological Society of America Memoir 74.
Urabe, Tetsuro (1985) Aluminous granite as a source magma ofhydrothermal ore deposits: An experimental study. EconomicGeology,80, 148-157.
Volfinger, M. (1976) Etret de la temp6rature sur les distributionsde Na, Rb et Cs entre la sanidine, la muscovite, la phlogopiteet une solution hydrothermale sous une pression de I kbar.Geochimica et Cosmochimica Acta, 40,267-282.
von Platen, H. (1965) Kristallisation granitischer Schmelzen.Contributions to Mineralogy and Petrology, 11, 334-381.
Walker, R.J. (1984) The origin of the Tin Mountain pegmatite,Black Hills, South Dakota. Ph.D. thesis. State University ofNew York at Stony Brook.
Watson, 8.B., and Harrison, T.M. (1 983)Zircon saturation: Tem-perature and composition efects in a variety of crustal magmatypes. Earth and Planetary Science L€tters, 64,295-304.
MlNuscnrpr REcETvED Fpnnuenv 28, 1985MeNuscnrpr AccEp'rED Ocrosrn I, 1985