trace element characteristics of zircon: a means of
TRANSCRIPT

AN ABSTRACT OF THE THESIS OF
Lucian P Farmer for the degree of Master of Science in Geology presented on
November 29, 2012.
Title: Trace Element Characteristics of Zircon: A Means of Assessing Mineralization Potential of Intrusions in Northern Nevada
Abstract approved:
John H. Dilles Adam J.R. Kent
Oxidized hydrous intermediate composition magmas are responsible for
porphyry copper (Cu ±Mo ±Au) deposits and epithermal Au ore deposits formed
globally in the shallow crust (Sillitoe, 2010; Seedorff et al., 2005). Recently, zircon
geochemistry has been used to characterize both productive and barren intrusions
associated with porphyry Cu-Au ore deposits. Zircon composition differs slightly
between the two intrusive groups, and researchers have proposed that zircon in
productive intrusions has crystallized from a relatively more oxidized melt compared
to barren intrusions (Ballard et al., 2002; Muñoz et al., 2012). Zircon rare earth
elements record anomalies in Ce and Eu contents that allow estimation of the ratio of
oxidized versus reduced species, i.e. Ce4+/Ce3+ (CeIV/CeIII) and Eu3+/Eu2+ (Eu/Eu*)CN.

This study focuses on understanding the compositions of Eocene magmas
associated with sediment hosted Carlin gold deposits and the gold-copper ores of the
Battle Mountain porphyry Cu-Au-skarn district in northern Nevada. Zircon trace
element composition was analyzed using LA-ICP-MS and SHRIMP-RG to determine
differences between mineralizing and non-mineralizing intrusions in northern Nevada
and to compare these compositions with known porphyry Cu-Au type magmas. These
zircon and rock compositional data was then used to test the hypothesis of a magmatic
origin of the Carlin type gold deposits (Muntean et al., 2011).
Zircon U-Pb ages were calculated using multiple SHRIMP-RG spot analyses
of each sample for two Carlin biotite porphyry dikes, two Battle Mountain porphyry
dikes and the granodiorite of the Copper Canyon stock. The new U-Pb age dates for
Carlin porphyry dikes are 38.7 ± 0.5 Ma and 38.8 ± 0.4 Ma. The age of the Copper
Canyon stock is 38.0 ± 0.7 Ma, and the age of the Battle Mountain porphyry dikes are
40.2 ± 0.4 Ma and 41.3 ± 0.4 Ma. The Carlin dike ages are the same age, within
uncertainty, with previous studies conducted (Mortensesn et al., 2000).
The productive porphyry dikes from the Battle Mountain district have
Ce(IV)/Ce(III) ratios of 500 to 10000 and a wide range of (Eu/Eu*)CN values between
0.3 and 0.7 respectively. Carlin porphyry dikes have Ce(IV)/Ce(III) values between
100 and 1000, and a more limited (Eu/Eu*)CN range of 0.5 to 0.7. Barren Eocene
intrusions at Harrison Pass and Caetano have much lower Ce(IV)/Ce(III) ratios that
range from 20 to 500, and have a very large span of (Eu/Eu*)CN from 0.03 to 0.6.

Calculated Ce(IV)/Ce(III) and (Eu/Eu*)CN of zircon of this study illustrate a
distinction between productive and barren intrusions in northern Nevada, and
demonstrate a geochemical link between porphyry type magmas and dikes associated
with Carlin type gold deposits. These ratios may provide a useful means of evaluating
potentially economic geologic terranes and serving as a method to infer relative
oxidation state of zircon bearing intrusive rocks.

©Copyright by Lucian P. Farmer
November 29, 2012
All Rights Reserved

Trace Element Characteristics of Zircon: A Means of Assessing Mineralization Potential of Intrusions in Northern Nevada
by
Lucian P. Farmer
A THESIS
Submitted to
Oregon State University
in partial fulfillment of
the requirements for the
degree of
Master of Science
Presented November 29, 2012
Commencement June 2013

Master of Science thesis of Lucian P. Farmer presented on November 29, 2012
APPROVED:
Major Professor, representing Geology
Dean of the College of Earth, Ocean and Atmospheric Sciences
Dean of the Graduate School
I understand that my thesis will become part of the permanent collection of Oregon State University libraries. My signature below authorizes release of my thesis to any reader upon request.
Lucian P. Farmer, Author
ACKNOWLEDGEMENTS
First and foremost I would like to thank my advisors, Dr. Adam J.R. Kent and Dr. John H. Dilles for their incredible level of support throughout this project. I have learned much and grown as a geoscientist. My gratitude also goes to committee members Dr. Anita Grunder and Dr. David Finch.
Secondly I would like to thank my industry sponsors, Barrick Gold Corporation and Newmont Mining for their financial and logistical support of this project. Special thanks is due to Dick Reid, Ronald Lujan and Jeff Nichols at Newmont, and Bill Wright, Richard Hipsley and Paul Dobak at Barrick. Without their commitment to academic research in the field of economic geology this project would have not had the success it has.
I would like to thank Alison Koleszar and Matthew Loewen for their help and support in conducting analysis using the LA-ICPMS instrument in the Keck Lab for mass spectrometry. Their assistance with this project was crucial for success.
I would also like to thank Joe Wooden and Eric Gottlieb for their assistance while collecting data on the SHRIMP-RG during an analytical session at Stanford-United States Geologic Survey Microanalyses Center at Stanford University.
To Dr. Frank Tepley and Dale Burns for their assistance and accommodation in conducting Cathodoluminesence imaging at the OSU Electron Microprobe Laboratory.
My gratitude goes out to all the amazing VIPERS, friends and associates that have made my time at Oregon State University so enriching. It was an honor to be colleagues with so many talented geoscientists.
Finally, I would like to thank my wonderful wife, Julie, and my parents, Chris and Pippa, for their endless support and encouragement during the final stages of this thesis.

TABLE OF CONTENTS Page
Introduction .................................................................................................... 1
Scope of study and previous work ............................................................................. 3
Geologic background.................................................................................................. 5
Hypothesis .................................................................................................................. 9
Methods ....................................................................................................... 10
Sample collection ..................................................................................................... 10
Sample preparation ................................................................................................... 14
Cathodoluminesence imaging .................................................................................. 15
SHRIMP-RG ............................................................................................................ 17
Laser Ablation-Inductively Coupled Plasma Mass Spectrometry ............................ 18
Whole rock compositions ......................................................................................... 25
Results ......................................................................................................... 26
Petrography and petrology of dikes .......................................................................... 26
Whole rock trace element compositions ................................................................... 32
Zircon U/Pb ages ...................................................................................................... 37
Zircon rare earth element compositions ................................................................... 46

TABLE OF CONTENTS (Continued)
Page
Ce(IV)/Ce(III) and Eu/Eu* ratios ............................................................................. 49
Zircon geothermometry ............................................................................................ 57
Discussion .................................................................................................... 60
Zircon ages ............................................................................................................... 60
Zircon trace element compositions ........................................................................... 62
Ce(IV)/Ce(III) and Eu/Eu* of zircon ....................................................................... 63
Possible sources of mineralizing magmas ................................................................ 69
Implications for mineral exploration ........................................................................ 71
Conclusions .................................................................................................. 72
References .................................................................................................... 74
Appendices……………………………………………………………………………81

LIST OF FIGURES
Figure Page
Figure 1. Nevada Overview map………………………….…………….……8
Figure 2. Overview of Battle Mountain district, Nevada, simplified
Geologic map and rock sample locations……………... ………………..… ..12
Figure 3. Geologic map of the Goldstrike mine (Post-Betze pit)……..…..…14
Figure 4. Example CL image of zircons………………………………….….16
Figure 5. LaserTRAM screenshot…………………………………….……...21
Figure 6. LA-ICPMS and SHRIMP_RG data comparison…………….…….24
Figure 7. Photomicrographs of representative rock types……………….…...27
Figure 8. Silica versus total alkalis for each sample…………………….…...29
Figure 9. Geochemical discrimination diagrams for each sample……….…..31
Figure 10. Whole rock trace element chemistry for each sample…………....34
Figure 11. Terra-Wasserburg diagrams and individual zircon age
Histograms for all samples……………………………………………….…..39
Figure 12. Rare earth element plots for selected samples……………….…...45

LIST OF FIGURES (Continued)
Figure Page
Figure 13 LA-ICPMS zircon trace element data for individual grains
showing Yb/Dy vs. Th/U and Yb/Dy vs. Hf (ppm)…………………………47
Figure 14. LA-ICPMS zircon trace element data for individual grains
Showing Th/U vs. Hf (ppm)………………………………………… ….….48
Figure 15. Onuma (1968) diagram of zircon-melt partition coefficient
plotted versus ionic radius……………………………………………….….51
Figure 16. Uncertainty associated with calculation of Ce(IV)/Ce(III)….…..53
Figure 17. Ce/Ce* versus Hf (ppm)………………………………….….…..54
Figure 18. Single grain Ce(IV)/Ce(III) versus Eu/Eu* ratios for all
samples analyzed by SHRIMP-RG……………………………………...…..55
Figure 19. Plots of Eu/Eu* versus Hf concentration and
Ce(IV)/Ce(III) versus Hf……………………………………………..……..56
Figure 20. CL Images of representative grains from Battle Mountain
(LF-BM3) and Carlin (Bu05-1c)………………………………………..….57
Figure 21. Hf concentration versus temperature for cores and rims of
each Battle Mountain (LF-BM3) and Carlin sample (Bu05-1c)………..…..59

LIST OF FIGURES (Continued)
Figure Page
Figure 22. SHRIMP-RG data of Eu/Eu* versus Hf concentration for two
different Carlin type deposits, Goldstrike and Cortez………………….…..65
Figure 23. Plot showing Ce(IV)/Ce(III) versus age (Ma)………………….66
Figure 24. SHRIMP data of Eu/Eu* vs. Ce(IV)/Ce(III) compared
to sample averages of Ballard (2002)……………………..……………..…69

LIST OF TABLES
Table Page
Table 1. Location and general lithology of each sample…………………….13
Table 2. Dwell times for each isotope measured on LA-ICPMS………...….20
Table 3. Modal mineralogy of each sample………………………………….28
Table 4. Whole rock major, minor and trace element chemistry…………….35
Table 5. SHRIMP-RG U-Pb age data………………………………………..42
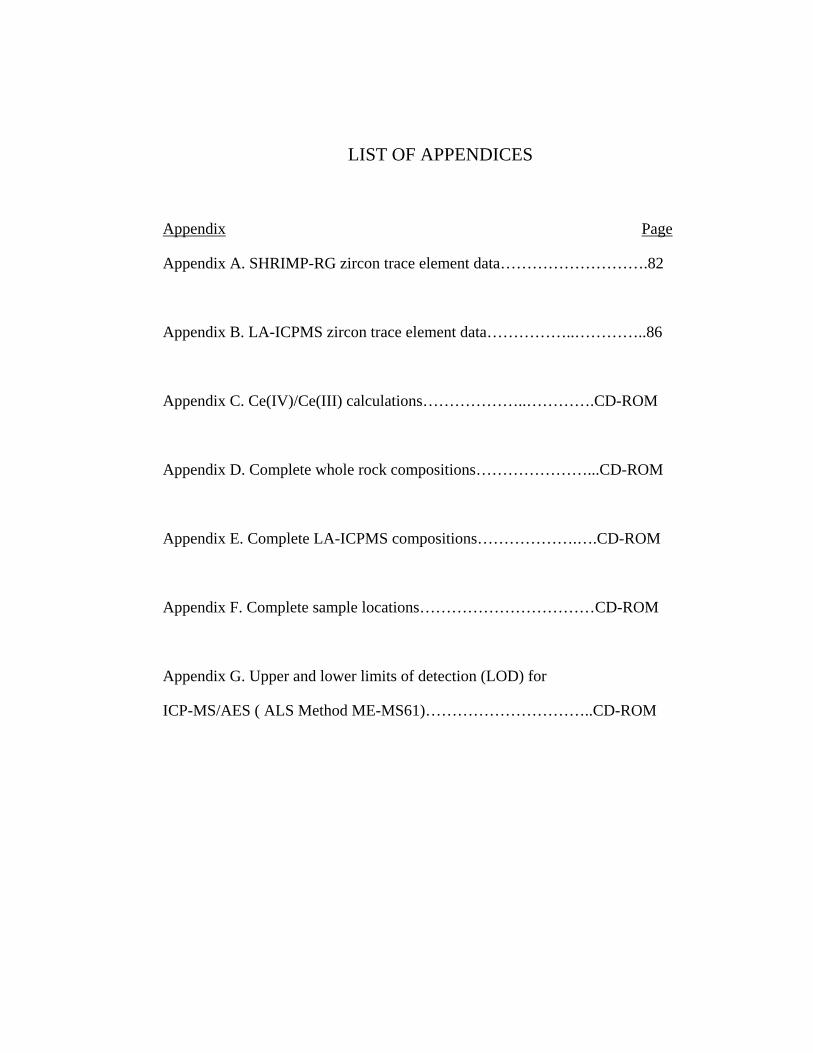
LIST OF APPENDICES
Appendix Page
Appendix A. SHRIMP-RG zircon trace element data……………………….82
Appendix B. LA-ICPMS zircon trace element data……………..…………..86
Appendix C. Ce(IV)/Ce(III) calculations………………..………….CD-ROM
Appendix D. Complete whole rock compositions…………………...CD-ROM
Appendix E. Complete LA-ICPMS compositions……………….….CD-ROM
Appendix F. Complete sample locations……………………………CD-ROM
Appendix G. Upper and lower limits of detection (LOD) for
ICP-MS/AES ( ALS Method ME-MS61)…………………………..CD-ROM

Trace Element Characteristics of Zircon: A Means of Assessing Mineralization Potential of Intrusions in Northern Nevada
Introduction
Understanding the magmatic processes that lead to the formation of economic
porphyry Cu-(Au-Mo) deposits in convergent arc settings is crucial to identifying
favorable geologic terranes for minerals exploration. While typical arc magmatism is
capable of generating intermediate to felsic magmatism on a relatively large spatial
and temporal scale, the generation of productive magmas, with metal-bearing
magmatic-hydrothermal fluids, is generally sparse in comparison (Hedenquist and
Lowenstern, 1994; Richards, 2003; Seedorff et al., 2005; Sillitoe, 2010). The
cumulative effort of many workers investigating porphyry systems across the globe
has led to an understanding of some shared characteristics by most porphyry systems.
Hydrous, relatively oxidized, sulfur-rich and metaliferous magmas tend to form
porphyry Cu-(Au-Mo) deposits. While not a single control on the formation of ore
deposits, oxidation states in porphyry Cu-(Au-Mo) magmas have been observed to be
an important factor across differing tectonic and geologic settings (Dilles, 1987;
Ballard et al., 2002). Due to the fact that in some cases primary minerals, whole rock
chemical compositions and textures become destroyed and/or modified during the
extensive hydrothermal alteration during the formation of an ore deposit, it is
2
commonly necessary to use proxies to elucidate primary magmatic conditions at the
time of emplacement. The oxidation state has been determined to be a primary control
on sulfur speciation in ore forming and other magmas (Carroll and Rutherford, 1985).
More recently, further development of the role of magmatic sulfate by Jugo (Jugo,
2009; 2005), was able to show that at oxidation states higher than >NNO+1 the
predominant species of sulfur is sulfate and the sulfur capacity of the melt increased.
The presence of magmatic sulfate has since been shown by multiple authors since first
being observed in eruptive products of Pinatubo and El Chicon volcanoes and as
anhydrite inclusions in various minerals (Luhr, 1990; Parat et al., 2002). The presence
of anhydrite was recently observed in andesites and dacites from Yanacocha, Peru,
indicating that sulfate-rich magmas may be required to produce sulfur-rich magmatic-
hydrothermal mineral deposits (Chambefort et al., 2008) The presence of sulfur in the
oxidized state bears importance on magmatic-hydrothermal ore deposits due in part to
sustaining the metal budget of a silicic melt, as the presence of reduced sulfur leads to
metals partitioning into an immiscible sulfide phase and the subsequent removal of
chalcophile metals (Jugo, 2009; Botcharnikov et al., 2010). Magmatic anhydrite rarely
survives long in weathering environments, so it is necessary to use other methods to
determine relative oxidation states in potentially productive magmas (Streck and
Dilles, 1998). Recently, zircon geochemistry has been used as an approach to quantify
the geochemistry and understand magmas that generate porphyry deposits (Ballard et
al., 2002; Lee, 2008; Muñoz et al., 2012), and this approach will be the primary focus
of this study.

3
Scope of Study and Previous Work
Zircon is a nearly ubiquitous trace phase in intermediate to felsic igneous rocks
and is a robust mineral commonly capable of surviving subsolidus hydrothermal
alteration, chemical and physical weathering, and is resistant to high temperature re-
equilibration through diffusion (Cherniak and Watson, 2007). It is more so important
due to its ability to contain trace amounts of several trace elements that preserve
geochemical characteristics of the parental magma, as well as incorporating uranium
isotopes 235U and 238U for radiometric age determinations. All of these parameters
make zircon an ideal tool to track and characterize magmatic conditions and evolution
through time.
Part of the usefulness of zircon is how it incorporates trace elements, especially
the lanthanides, with an increasing affinity for the heavy rare earth elements (HREE).
Cerium (III and IV valence) and europium (II and III valence) are incorporated into
zircon in a differential manner, with the oxidation state of each element dictating the
partitioning of each element into the zircon structure. Ballard et al. (2002) sampled
14 barren and 7 ore-bearing intrusions from the Chuquicamata and El Abra porphyry
Cu districts in northern Chile and used laser ablation-inductively coupled plasma mass
spectrometry (LA-ICPMS) to measure U/Pb ages and trace element concentrations in
zircon. On the basis of calculated EuN/EuN*, a measure of the magnitude of negative
europium anomaly in zircon, and Ce(IV)/Ce(III), a modeled ratio of the Ce+4 to Ce+3

4
ions present in zircon, Ballard et al. (2002) concluded that the magnitude of the cerium
anomaly was controlled by the oxidation state of the El Abra magmatic system
increased with time. Using demonstrable crosscutting relations and known ore bearing
intrusions, the late mineralization events occurred in intrusions with relatively higher
EuN/EuN* and Ce(IV)/Ce(III) ratios compared to early, barren intrusions. Ballard
preferred the use of Ce when evaluating oxidation state due to higher sensitivity of Ce
in zircon to changes in valence state. Europium is less sensitive and its budget in a
melt is largely dictated by incorporation into plagioclase. Lee (2008) employed a
similar approach in a study of the El Salvador, Chile, porphyry copper deposits and
was able to demonstrate a similar temporal change of EuN/EuN* ratios over time.
Based on cross-cutting field relations and U-Pb ages, the europium anomalies became
less pronounced with temporal and magmatic evolution and eventual mineralization at
El Salvador. Yet another more recent study of porphyry intrusions at the El Teniente
porphyry Cu-Au deposit in Chile was able to show similar results to those of Ballard
and Lee (2002; 2008), with heightened Eu/Eu* and Ce(IV)/Ce(III) ratios associated
with mineralizing intrusions, and lower vales with non-productive intrusions (Muñoz
et al., 2012). Muñoz et al. was also able to demonstrate that Hf content in zircon
increased as the system evolved, reinforcing previous work showing that Hf in zircon
can be used as a proxy to magmatic crystallization and cooling of the melt (Claiborne
et al., 2006). The purpose of this study is to use the methods and approach of the
aforementioned authors to investigate productive and non-productive Eocene
intrusions in the Great Basin, United States.

5
Geologic Background
Eocene mineralization is widespread in the Great Basin of North America and
comprises a considerable percentage of the gold and copper resources of the United
States. The Carlin-type gold deposits (CTGDs) alone are the second largest
concentration of gold in the world after the Witwatersrand deposits in South Africa,
and represent approximately 6% of total world production of gold. The CTGDs are
disseminated hydrothermal replacement zones hosted in Paleozoic carbonate rocks
usually in the lower plate of the Roberts Mountain thrust, and gold is present as
submicrometer particles in pyrite and arsenopyrite or in solid solution with these
minerals (Cline et al., 2005; Muntean et al., 2011). These deposits are abundant in
north-central Nevada and form linear “trends” (see Figure 1). Temporally and spatially
associated with these deposits are calc-alkaline porphyry dikes that are of Eocene age,
and some of them show evidence of being mineralized as well (Arehart et al., 2003;
Chakurian et al., 2003; Ressel and Henry, 2006a).
Other types of mineralization are present in northern Nevada that are not of the
CTGD type but occur nearby to Carlin type deposits and are associated with
magmatism of Eocene age. The Battle Mountain district consists of copper porphyry,
skarn and distal disseminated gold deposits that lie along the Battle Mountain-Eureka
trend, with the largest single deposit located at the Phoenix or Copper Canyon mine, a
porphyry Cu-skarn that contains a resource of at least 5.7 Moz Au and 0.4 Mt Cu

6
(Theodore et al., 1973; Theodore, 1978; Theodore, 1998; Breit et al., 2009; Reid et al.,
2011). The Tuscarora District is a volcanic hosted silver-gold epithermal deposit that
lies immediately north of the larger Carlin district and is of Eocene age (Castor et al.,
2003). As an explanation for this concentration of gold and related hydrothermal
deposits, the granitoid intrusions of Eocene age that outcrop in Northern Nevada have
been suggested to be temporally related to mineralization, and to possibly be the
source of metaliferous hydrothermal fluids (Henry and Boden, 1998; Mortensesn et
al., 2000; Ressel and Henry, 2006a; Muntean et al., 2011).
Plate margin convergence along the North American margin produced the
Mississippian Antler orogeny, that includes the Roberts Mountain thrust, folds, high
angle faults and fractured clastic and carbonate host rock (see Figure 1). This geologic
sequence has been inferred to be an optimal structural and lithological setting for the
formation of CTGDs (Emsbo et al., 2006; Muntean et al., 2011).
During the late Mesozoic and early Cenozoic, much of what is currently the
Basin and Range province may have had a topography that resembled the central
Andes of Bolivia-Peru, and has been coined the “Nevadoplano” by some authors
(DeCelles, 2004; Ernst, 2010; Henry et al., 2012). This time period was associated
with Laramide compression and was characterized by a much thicker crust than
observed today. This period also saw magmatism along western North America as the
Farallon plate was subducted beneath North America; until the slab began to flatten
around 65 Ma. Magmatism progressively shifted eastward, and during this period the

7
base of the subcontinental lithosphere may have been hydrated and metasomatised by
slab-derived fluids (Humphreys et al., 2003). Rollback and/or delamination of the
Farallon slab renewed magmatism, which semi-discontinuously swept from north to
south starting in the Eocene (Humphreys, 1995). These magmas were generally calc-
alkaline, oxidized, hydrous and cool (<850°C), and derived from mafic parental
magmas generated by dehydration of oceanic lithosphere and melting in the
sublithospheric mantle wedge (Christiansen and McCurry, 2007). There is also
evidence for mixing between oxidized mafic magmas and silicic crustal magmas in
Northern Nevada during this period, and it has been hypothesized that these mafic
magmas may have delivered significant amounts of sulfur and chalcophile metals to
upper crustal magma chambers (Ryskamp et al., 2008). Magmatism in northeast
Nevada occurred between 42 and 34 Ma post-dating the Laramide compressive
tectonic regime, and was concurrent with the beginning of extensional tectonics and
the collapse of the Nevadoplano. Asthenospheric melts may have preferentially
ascended using northwest-striking Paleozoic crustal basement structures, although it
should be noted that the use of basement structures is merely a hypothesis and is based
largely on the linear trend of many of northern Nevada’s ore trends (Tosdal et al.,
2000; Grauch et al., 2003)

8
Figure 1. Overview map of Northern Nevada showing major Carlin-type gold deposits, margin of North American craton, major crustal structures, and the mid- Tertiary magmatic fronts. Also shown in green are the two barren Eocene intrusions in which data are used in this study. Location of Battle Mountain and Goldstrike mine approximated with orange circles. Modified from Muntean et al (2012).

9
Hypothesis
Multiple authors have suggested that Eocene magmatism in northern Nevada is
associated with the formation of Carlin type gold deposits, as well as the porphyry Cu-
Au mineralization located in the Battle Mountain district, and these intrusions may
have supplied metals, fluids and sulfur (Muntean et al., 2011; Ressel and Henry, 2006;
Henry and Boden, 1998). We have tested this by using the zircon trace element
concentrations of Carlin and Battle Mountain porphyry dikes and contrasted these with
other known barren and sub-productive Eocene intrusions in the Great Basin. Whole
rock major, minor and trace element chemistry was also used to complement these
investigations. A brief comparison of data from other known porphyry copper deposits
has been used to test the approach of zircon geochemistry to evaluating productive
versus non-productive intrusions. In a few cases, It has been demonstrated that
mineralizing porphyry magmas have Ce(IV)/Ce(III) and Eu/Eu* ratios that are distinct
from barren or non-productive intrusions (Ballard et al., 2002; Lee, 2008; Muñoz et
al., 2012). To date there have been no similar tests of Eocene intrusions temporally
associated with gold deposition, thus we have used a similar methodology to those
authors described above, and in doing so have tested the recent hypothesis of a
magmatic origin of carlin type gold deposits by Muntean et al. (2011).
10
Methods
Sample Collection
The locations of all samples studied are presented in Figures 1, 2 and 3 and
Table 1, and the sample lithologies are summarized in Table 3. Samples were
collected from drillcore and outcrop in two phases. The first occurred over a week in
March, 2011, at Barrick’s Goldstrike mine in the Carlin gold district and located
approximately 50 km north of Carlin, Nevada.
Samples were chosen by searching through Barrick core logs in order to locate
intercepts of Tertiary dikes. A total of six specific holes of interest were sampled and
re-logged to characterize alteration. Samples for Bald Mountain were provided by Bill
Wright of Barrick.
The second phase of sampling took place between July and August of 2011, at
the Battle Mountain district, located southwest of Battle Mountain, Nevada. Outcrop
samples were collected from the Elders Creek and Copper Basin areas. Drillcore
samples were taken from Newmont’s Phoenix (Copper Canyon) and Buffalo Valley
mines.

11
Data from barren Eocene intrusions include the Harrison Pass pluton (Barnes
et al., 2001; Colgan et al., 2010) as well intrusions related to the Caetano caldera, the
Redrock Canyon pluton and the Carico Lake pluton (John et al., 2008). These data
were provided by David John and Joe Colgan of the United States Geologic Survey in
Menlo Park, California.

12
Figure 2. Simplified geologic map and sample locations of the Battle Mountain area. Modified from GIS data provided by the Nevada Bureau of Mines and Geology.

Table 1. Location of samples collected in this study.
Sample Location Name1 UTM Location2,3 Lithology Notes
LF-EC1 Elders Creek, B.M. 4941505N, 4503710E Granite OutcropLF-EC4 Elders Creek, B.M. 4928318N, 4500938E Granodiorite OutcropLF-EC6 Elders Creek, B.M. 4918233N, 4502339E Granodiorite OutcropLF-CB2 Copper Basin, B.M. 4961388N, 4497427E Granodiorite OutcropLF-CB3 Copper Basin, B.M. 4956725N, 4496265E Granodiorite OutcropLF-CB6 Copper Basin, B.M. 4957093N, 4497214E Granite OutcropLF-10788 Phoenix mine, B.M. 4887637N, 4487784E Granite Drill HoleLF-12171 Phoenix mine, B.M. 4894874N, 4487448E Granodiorite Drill HoleLF-12716 Phoenix mine, B.M. 4891626N, 4486961E Granodiorite Drill HoleLF-BM3 Phoenix mine, B.M. 4894283N, 4487117E Granodiorite OutcropLF-112c Goldstrike mine, Carlin 5526809N, 4539368E Granodiorite Drill HoleLF-Bu05 Goldstrike mine, Carlin 5536731N, 4537159E Diorite Drill HoleLF-BD Bald Mountain 4422387N, 624116E Granodiorite Outcrop
1B.M. = Battle Mountain area
2Represents collar coordinate for drill hole
3UTM grid zone 11
13

14
Figure 3. Geologic map of the Goldstrike mine (Post-Betze pit), showing Carlin drill-core sample locations.
Sample preparation
Samples were cleaned of weathering rinds, and clay-altered fractures were
avoided prior to processing. Samples were initially crushed using a hammer and plate
then aluminum shatter box. Crushed material was then sieved to <500 μm, and heavy
minerals concentrated using water and gold pan. Concentrated minerals were placed in

15
ultrasonic bath for approximately 15 minutes to free grains of remaining matrix and
clay particles. Zircons were isolated using Frantz isodynamic magnetic separator and
if needed, methylene iodide heavy liquid, in the CEOAS mineral separation laboratory
at the Oregon State University. Euhedral, well-formed zircon grains were hand-picked
using a binocular microscope, taking care to pick all size ranges and crystal
morphologies (i.e. equant versus acicular). It should be noted that some acicular grains
were broken during crushing and/or processing, and that these were also included in
separates. Zircon separates that were destined for analyses at the Stanford-USGS
SHRIMP-RG were carefully placed in weigh paper and then mounted in epoxy at
Stanford University, along with a zircon age standard R-33 (419.9 ±1.5 Ma, (Black et
al., 2004), polished and coated with Au. Separates run at Oregon State University by
LA-ICPMS were mounted in 2.5 cm epoxy plugs and carefully polished to expose
grain centers.
Cathodoluminesence Imaging
Cathodoluminesence (CL) imaging was performed at Oregon State University
using a Cameca SX-100 Electron Microprobe operating with a beam current of 30 nA
and an accelerating voltage of 15 keV. CL imaging was also performed on epoxy
plugs at Stanford prior to SHRIMP-RG analysis using a JEOL JSM 5600 scanning
electron microscope operating at 15 keV accelerating potential. Imaging was
16
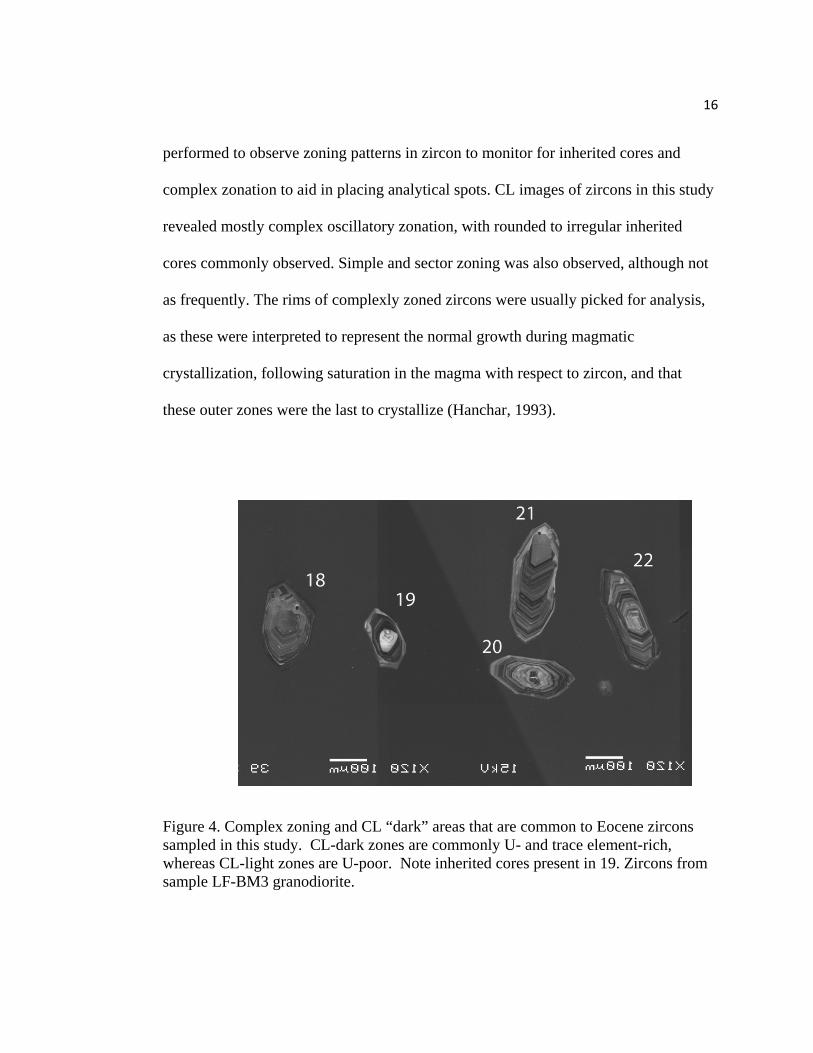
performed to observe zoning patterns in zircon to monitor for inherited cores and
complex zonation to aid in placing analytical spots. CL images of zircons in this study
revealed mostly complex oscillatory zonation, with rounded to irregular inherited
cores commonly observed. Simple and sector zoning was also observed, although not
as frequently. The rims of complexly zoned zircons were usually picked for analysis,
as these were interpreted to represent the normal growth during magmatic
crystallization, following saturation in the magma with respect to zircon, and that
these outer zones were the last to crystallize (Hanchar, 1993).
Figure 4. Complex zoning and CL “dark” areas that are common to Eocene zircons sampled in this study. CL-dark zones are commonly U- and trace element-rich, whereas CL-light zones are U-poor. Note inherited cores present in 19. Zircons from sample LF-BM3 granodiorite.

17
SHRIMP-RG
A subset of high priority samples had U-Th-Pb isotopic and trace element
concentrations measured using a sensitive high resolution ion microprobe reverse
geometry (SHRIMP-RG) at the Stanford United States Geologic Survey Micro
Analysis Center (SUMAC) located at Stanford University and co-operated with the
U.S. Geological Survey. A total of two sessions were run, one in January 2012 for age
data and one in March of 2012 for titanium-in-zircon thermometry and complete trace
element analysis. For detailed procedure of analytical conditions, standardization, and
data reduction see Miller and Wooden (2004).
Prior to each spot analysis, an 8 nA 16O2- ion beam was rastered over the
surface to remove the gold coat and any surface contamination. The selected spots
were then analyzed with a 5.4 nA 16O2- primary ion beam to sputter positive secondary
ions for analysis. The spot size was ~30 μm in diameter, with a depth of analysis of 1-
2 μm. Zircon standard R33 was analyzed on every fourth measurement during the run
(Black et al., 2004). Mass scans of peaks were collected for 90Zr2 16O, 204Pb, 206Pb,
207Pb, 208Pb, 238U, 232Th16O, and 238U16O. A count time of 20s was used for 206Pb, 16s
for 207Pb, 4s for 238U and 2s for all others.
Rare earth elements and Hf concentrations were simultaneously measured and
corrected to the in-house standard Madagascar Green, as described by Mazdab and
Wooden (2006). Mass analyses were collected on: 139La, 140Ce, 146Nd, 147Sm, 153Eu,
155Gd, 163Dy16O, 166Er16O, 172Yb16O, 180Hf16O.
18
The final session in March 2012, obtained a complete set of trace elements as
well as titanium content for zircon thermometry. The same standardization was used
as above, and the following isotopes were measured: 7Li, 9Be, 11B, 19F, 23Na, 24Mg,
27Al, 30Si, 31P, 32S, 35Cl, 39K, 40Ca, 45Sc, 48Ti, 49Ti, 51V, 52Cr, 55Mn, 56Fe, 74Ge, 89Y,
93Nb, 93Zr1H, 96Zr, 139La, 140Ce, 141Pr, 146Nd, 147Sm, 153Eu, 165Ho, 157Gd16O, 159Tb16O,
163Dy16O, 166Er16O, 169Tm16O, 172Yb16O, 175Lu16O, 180Hf16O, and 206Pb. Titanium in
zircon temperatures were calculated using the calibration of Ferry and Watson (2007)
modified from Watson and Harrison (2005), with an activity of TiO2 in melt estimated
to be 0.7.
Laser Ablation-Inductively Coupled Plasma Mass Spectrometry
Trace element concentrations in zircon analyzed prior to July, 2011, were
measured using a NewWave DUV 193 nm ArF Excimer laser on a VG PQ ExCell
quadrupole ICP-MS in the W.M. Keck Collaboratory for Plasma Spectrometry in the
College of Oceanographic and Atmospheric Science at Oregon State University. A
summary of the analytical technique is described by Kent et al. (2004). A spot size of
40 μm, repetition rate of 4 Hz and ablation time of 30 seconds was used on each
analysis. NIST-612 was used as trace element calibration standards, and PL-1 and 91-
500 (Klotzli et al., 2009) were used as U/Pb age standards. Masses analyzed were 29Si,

19
31P, 48Ti, 49Ti, 50Ti, 65Cu, 85Rb, 89Y, 139La, 140Ce, 141Pr, 146Nd, 147Sm, 153Eu, 157Gd,
159Tb, 165Ho, 169Tm, 172Yb, 178Hf, 179Hf, 204Pb, 206Pb, 207Pb, 208Pb, 232Th, 235U, 238U.
Analytical runs after July 2011 were also conducted in the Keck Collaboratory,
but used a Photon Machines G2 short pulse length ArF Excimer laser, coupled with a
Thermo Xseries2 quadrupole ICP-MS. A spot size of 30 μm was used, ablation time
of 30 s and repetition rate of 9 Hz. See Table 2 for specific dwell times for each
mass. Masses analyzed were: 29Si, 31P, 49Ti, 50Ti, 65Cu, 89Y, 93Nb 139La, 140Ce, 141Pr,
146Nd, 147Sm, 153Eu, 157Gd, 159Tb, 163Dy 165Ho, 166Er, 169Tm, 172Yb, 173Yb, 175Lu, 178Hf,
179Hf, 204Pb, 206Pb, 207Pb, 208Pb, 232Th, 235U, 238U. NIST-612 was used as an internal
trace element calibration standard, and PL-1 and 91-500 were used as U/Pb age
standards.

20
Raw count data were processed for trace elements using in-house LaserTRAM
software (Kent et al., 2004), with silica used as an internal standard with an estimated
SiO2 concentration based on zircon stoichiometry (SiO2 = 32.80 wt. %). Data were
screened in LaserTRAM for overall quality, such as an extreme change in zonation
such as a rim/core crossover, and to monitor for presence apatite inclusions. For this
reason, phosphorus (31P) was monitored as a proxy for apatite and any analysis with
significant cps above background of P was discarded (See Figure 5). Due to rigorous
data screening, on average, 30-50% of spots per sample were discarded during data
Table 2. Dwell times for each isotope measured via LA-ICPMS
Element Mass (amu)
Dwell Time (ms) Element Mass
(amu) Dwell Time
(ms) 29Si 28.98 2 165Ho 164.93 10 31P 30.97 10 166Er 165.93 10 49Ti 48.95 10 169Tm 168.93 10 50Ti 49.94 10 172Yb 171.94 10 65Cu 64.93 10 173Yb 172.94 10 89Y 88.91 10 175Lu 174.94 10 93Nb 92.91 10 178Hf 177.94 2 139La 138.91 10 179Hf 178.95 2 140Ce 139.91 20 204Pb 203.97 10 141Pr 140.91 20 206Pb 205.97 10 146Nd 145.91 20 207Pb 206.98 50 147Sm 146.91 50 208Pb 207.98 10 153Eu 152.92 50 232Th 232.04 10 157Gd 156.92 20 235U 235.04 50 159Tb 158.93 10 238U 238.05 10 163Dy 162.93 10

21
Figure 5. Screen shots from LaserTRAM. A. Time-resolved spectrum that encountered a discrete apatite inclusion, as indicated by red peak of P; B. Time-resolved spectrum with multiple REE or core-rim zonation domains encountered at right.

22
processing. It should be noted that a large percentage of grains contained a high
density of mineral inclusions (mostly apatite) and a few minor melt inclusions.
Figure 6 is a selected comparison of both SHRIMP-RG and LA-ICPMS trace
element concentrations for the same sample and grains. To run the comparison, first
spots were analyzed by SHRIMP-RG, then lightly polished to remove the gold coat
and the <2 um pit created in the zircon by ion sputtering, and then run again by LA-
ICPMS on the same spot using same parameters as above. Primary differences in
measured concentrations between each method may be controlled by the sample
volume of each method. During analysis the SHRIMP-RG spot excavates a cylinder
that is ~25-30 μm in diameter and 1-2 μm deep, which equates to a volume of roughly
490 to 1413 μm3. During laser ablation, the volume created is roughly cone shaped
and is ~30 μm diameter and ~20 μm deep, which equates to an approximate volume of
4712 μm3. This difference in sampling volume, coupled with the complexity of zircon
composition zonation may lead to difference in absolute concentrations of trace
elements measured on the same sample between each instrument.
Despite the relative difference in sampling volume, it should be noted that
certain elements, such as Ce (see Figure 6) all fall relatively close to the 1-to-1 line.
Other elements, such as Hf, show a systematic difference that may not be entirely an
instrumental artifact or analytical uncertainty, but reflect the varied distribution of the
element within the zircon structure itself (i.e., oscillatory zoning). Hafnium

23
concentrations measured by LA-ICPMS may represent a mean Hf content of the
zircon based on the larger volume sampled, and the SHRIMP-RG analysis may
represent local compositions that differ slightly in discrete zones. Some elements
show apparent evidence of an instrumental bias, such as Yb, where it seems LA-
ICPMS tends to underestimate the total concentration compared to SHRIMP-RG.
When calculating Ce(IV)/Ce(III) numbers for each sample, LA-ICPMS
appeared to underestimate the cerium anomaly by an order of magnitude. The zircon
data for barren intrusions was collected using the same SHRIMP-RG instrument that
this study used. Based on this, only Ce(IV)/Ce(III) calculations using data collected
using SHRIMP-RG were reported in this thesis.

24
Figure 6. Comparison of same samples and spots between SHRIMP-RG and LA-ICPMS for selected elements. Red points represent Battle Mountain, and blue Carlin samples. If measured concentrations are the same they will fall on black 1-to-1 line.

25
Whole rock compositions
Major and trace element concentrations for 48 elements (9 major and 39 trace)
for 24 rock samples were determined using inductively coupled plasma-mass
spectrometry and inductively coupled plasma-atomic emission spectrometry by ALS
Chemex in Reno, NV (using method ME-MS81d). Each sampled was fused with
lithium metaborate prior to acid dissolution to aid in the dissolution of refractory
minerals, such as zircon. Concentrations of Zr in each sample from Battle Mountain
area were within the same range (~100-150 ppm) as those reported by Theodore
(1973).

26
Results
Petrography and Petrology of Dikes
Goldstrike Mine, Carlin District
LF-Bu05 and LF-112c are fine-grained dikes with 0.5 to 3 mm phenocrysts of
mostly unaltered biotite and 0.5 to 2 mm of clay-altered plagioclase crystals. The
modal abundance of quartz and biotite is slightly different between the two samples
(see Table 3). The groundmass is aplitic and consists of 0.1 to 0.5 mm quartz and
plagioclase crystals. In hand sample the rock appears bleached. Thin, 0.5 to 1 mm
wide calcite and quartz veins are pervasively present throughout the rock. These dikes
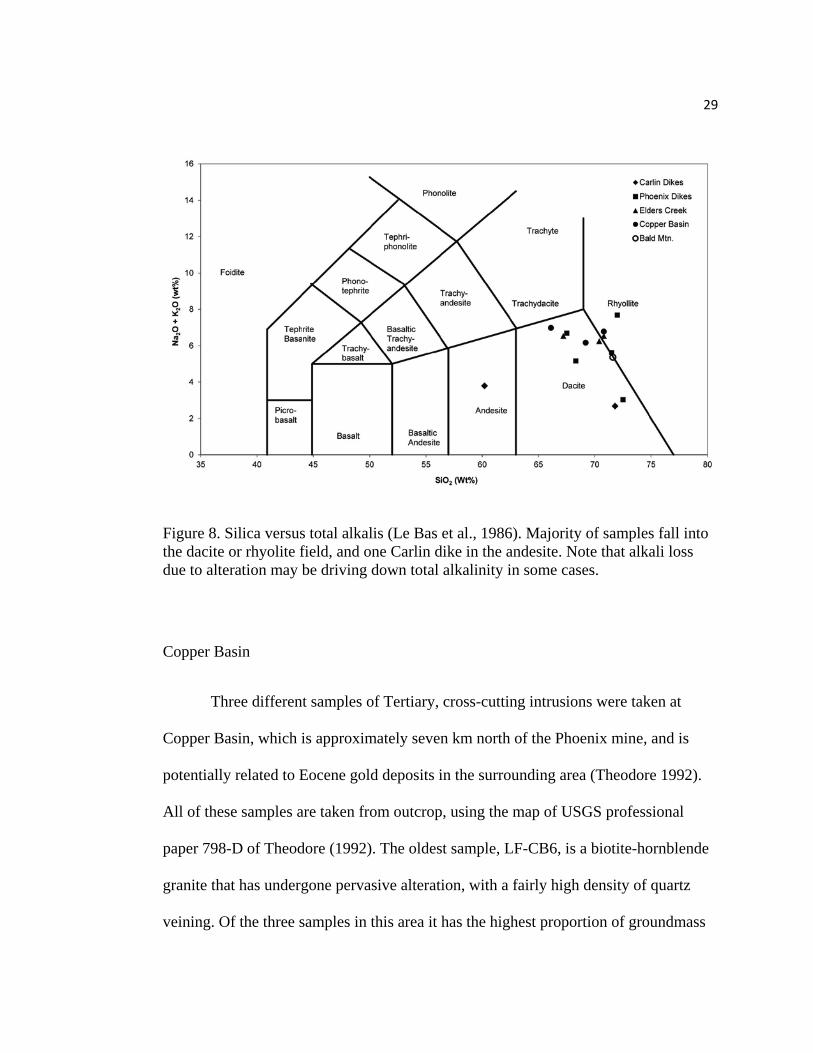
range in width from less than a meter to 4-5 meters. When plotted on a plutonic total-
alkali-silica diagram (see Figure 8), LF-Bu05 plots as a diorite (SiO2= 60.2%,
Na2O+K2O=3.79%) and LF-112c plots off the diagram (SiO2= 71.8%,
Na2O+K2O=2.68%).
Phoenix Mine, Battle Mountain District
Samples LF-BM3, LF-10788, LF-12716, LF-13114 and LF-12171 were taken
from drill cores at Newmont’s Phoenix mine using the same methodology as the
Carlin samples. All of these samples have an aplitic groundmass comprising

27
Figure 7. Photomicrographs of main porphyry types used in this study. Qtz – quartz, Bi – biotite, Plag – plagioclase, Hbl – hornblende. A. LF-10788, quartz porphyry from drill core sample from Phoenix mine. B. LF-BM3, surface exposure of granodiorite of Copper Canyon stock. C. LF-EC06, early granodiorite of Elders Creek. D. LF-EC01, late granodiorite of Elders Creek. E. LF-BU05, biotite-feldspar porphyry from Goldstrike mine. F. LF-CB02, granodiorite from Copper Basin area.

Table 3. Modal mineralogy for each sample (vol %).
Sample Groundmass Plagioclase1 Quartz Biotite Hornblende
LF-BM3 60 20 17 3 0LF-10788 59 26 16 1 3LF-12716 55 25 15 5 0LF-13114 65 18 15 2 0LF-12171 43 25 17 3 2LF-CB2 40 35 15 2 8LF-CB3 37 40 15 3 0LF-CB6 63 19 15 3 0LF-EC1 45 30 15 10 0LF-EC4 45 25 10 8 2LF-EC6 40 35 25 5 5LF-BU05 75 12 3 10 0LF-112C 75 15 5 5 0
1 Represents, albite and anorthite
28

28
quartz and plagioclase and alkali feldspar that varies in grain size from ~0.1 mm to 0.5
mm. LF-BM3 of the Copper Canyon stock is chemically a granite. It is composed of
0.5-3 mm resorbed quartz phenocrysts, 0.25 to 2 mm subhedral plagioclase
phenocrysts that have been altered to pale green clay, and 0.25 to 2 mm relatively
fresh euhedral biotite phenocrysts. All the other Phoenix dikes are chemically
granodiorite of varying alkalinity and modality. LF-10788 is a mineralized and
potassically altered quartz porphyry dike of the deeper level of the Copper Canyon
stock, and is a drillcore intercept from 632 feet to 1055 feet (target depth). LF-13114
is a sample of the Virgin dike at a depth of ~116 feet. LF-12716 is a 19 feet wide dike
that cuts the Harmony formation at a depth of ~730 feet. These drillcore samples have
retained their original identification numbers, and only the prefix has been changed
from PHX to LF for the purpose of this study.
29
Figure 8. Silica versus total alkalis (Le Bas et al., 1986). Majority of samples fall into the dacite or rhyolite field, and one Carlin dike in the andesite. Note that alkali loss due to alteration may be driving down total alkalinity in some cases.
Copper Basin
Three different samples of Tertiary, cross-cutting intrusions were taken at
Copper Basin, which is approximately seven km north of the Phoenix mine, and is
potentially related to Eocene gold deposits in the surrounding area (Theodore 1992).
All of these samples are taken from outcrop, using the map of USGS professional
paper 798-D of Theodore (1992). The oldest sample, LF-CB6, is a biotite-hornblende
granite that has undergone pervasive alteration, with a fairly high density of quartz
veining. Of the three samples in this area it has the highest proportion of groundmass

30
present, with large quartz phenocrysts of 0.2 to 2 cm in diameter. The second intrusion
sampled was LF-CB2, mapped as a porphyritic leucogranite that cuts the mass of LF-
CB6. It is relatively fresh and free of pervasive alteration besides low density quartz
veining, and has phenocrysts of quartz (0.5-1cm), hornblende (0.1-0.5cm) and biotite
(0.1-0.3cm). The final intrusion sampled in this area was LF-CB3, a granodiorite
porphyry, which cuts both units above. It is altered to quartz-sericite-pyrite and has
large quartz phenocrysts that are 0.5 to 2 cm in diameter. The historic Copper Queen
mine of this area has hypogene copper located in the granodiorite porphyry.
Elders Creek
Three samples of granodiorite with mapped, cross-cutting relationships were
sampled in the Elders Creek area, which is on the northern end of the Battle Mountain
range. These exposures are thought to represent a horizontal cross section through the
deeper portions of a porphyry copper system (King 2011). LF-EC6 is a biotite-
hornblende granodiorite and is the oldest intrusion in the area. It is notably the most
crystalline and coarse-grained intrusive unit, and mafic enclaves are sporadically
distributed on an outcrop scale. Samples LF-EC1 and LF-EC4 are quartz porphyry
dikes, with LF-EC4 being younger, based on cross-cutting relationships visible in
outcrop

31
Figure 9. Geochemical discrimination diagrams of samples from this study. A) Y+Nb versus Rb plot defining granitic provenance (Pearce et al., 1984)VAG = volcanic arc granite, ORG = orogenic granite, WPG = within plate granite and syn-COLG = syn-collisional granite. B) Silica versus Ba/La, with boundary between arc and back –arc from (Kay et al., 1994). C) Silica versus K2O after (Peccerillo and Taylor, 1976).

32
Bald Mountain
This sample was furnished by Bill Wright of Barrick Mining Corporation from
the Bald Mountain mine in central Nevada. The sample used for this study is the Bald
Mountain stock, which is a Jurassic, heavily altered, quartz-sericite-pyrite granodiorite
porphyry and all that remains mineralogically are quartz phenocrysts, but relict biotite
and plagioclase phenocrysts are present (Nutt and Hofstra, 2007).
Notes on Petrology
All of the samples above fall into the volcanic arc granite field defined by
Pearce et al. (1984), with the exception of the Jurassic Bald Mountain sample. It
should also be noted that the Carlin samples plot closer to the intersection of the
within-plate granite and collisional granite. Most samples are calc-alkaline, with a few
exceptions that may be a result of potassic addition through hydrothermal alteration.
Whole rock trace element compositions
The whole rock rare earth element suite for selected samples is presented in
Figure 12. Of particular note is the upward concavity and depletion of the heavy REE,
the enrichment in the light REE and the small negative Eu anomaly of the Battle
Mountain and Carlin intrusions. These features are characteristic of productive
intrusions (and some non-productive intrusions), as outlined by Lang and Titley

33
(1998), who compared Laramide age intrusions related to copper mineralization with
contemporaneous barren intrusions in the Southwest USA. They demonstrated
decreasing concentrations of REE, steepening LREE/HREE slope profiles and greater
upward concavity in the transition from barren to productive intrusions. More
importantly, they observed that Eu anomalies changed from negative to less negative
or even positive when transitioning from barren to productive. In Figure 10 below, the
Carlin and Battle Mountain samples share a lot of those previous characteristics, but
so do the Caetano rocks. The marked difference between these barren and productive
intrusions is the magnitude of the Eu anomaly, which is less pronounced in Carlin and
Battle Mountain. Cerium does not exhibit any form of positive or negative anomaly
with the exception of one small negative anomaly in a Caetano sample.

34
Figure 10. Whole rock trace element chemistry for Battle Mountain intrusions and dikes (red), Carlin dikes (blue), Caetano intrusive units (green) and Bald Mountain (purple). All chondrite normalized to McDonough and Sun (1995). Note the increased REE concentration in the Jurassic Bald Mountain sample.

Table 4. Whole rock major, minor and trace element compositions
Sample LF-12171
LF-12716
LF-13114
LF-BM3
LF-10788
LF-Bu05
LF-112c
LF-EC1
LF-EC4
LF-EC6
LF-CB2
LF-CB3
LF-CB6
Major Elements (Wt. %)
SiO2 73.3 68.1 76.1 71.6 73.3 67.9 76.1 71.3 70.2 71.1 69.9 74.6 72.4
Al2O3 13.3 13.8 13.8 14.8 13.8 16.5 17.0 14.9 15.3 13.6 14.2 15.1 14.7
TiO2 0.3 0.4 0.3 0.3 0.3 0.4 0.4 0.4 0.3 0.3 0.3 0.3 0.3
Fe2O3 2.5 5.2 5.8 2.8 2.6 3.8 2.4 2.9 3.0 4.0 2.6 1.7 2.7
CaO 2.1 3.5 0.1 0.8 2.9 4.4 0.8 3.0 2.8 2.6 4.6 0.4 1.2
MnO 0.02 0.05 0.01 0.02 0.02 0.09 0.03 0.02 0.06 0.05 0.04 0.01 0.02
MgO 1.7 3.7 0.7 1.6 1.3 2.4 0.5 1.1 1.4 1.6 2.0 1.0 1.6
Na2O 2.1 2.3 0.0 1.0 3.2 0.7 0.1 3.1 3.6 2.4 3.1 2.6 3.3
K2O 4.7 2.9 3.2 7.0 2.5 3.6 2.8 3.2 3.2 4.2 3.2 4.4 3.7
P2O5 0.1 0.1 0.1 0.1 0.1 0.2 0.3 0.1 0.1 0.1 0.1 0.0 0.1
LOI (%) 1.4 2.5 6.2 2.7 1.6 10.6 5.6 1.5 3.6 0.9 1.2 4.0 2.3
Total 100.6 101.9 100.4 98.3 99.9 99.4 100.4 101.0 99.6 100.2 100.4 99.3 100.2
Trace Elements (ppm)
Ni 50 53 57 32 10 BDL BDL 10 9 18 15 40 18
Cr 90 280 220 90 70 10 10 50 50 80 80 90 110
Ba 1490 1115 1265 2080 373 1140 318 1280 1800 1530 948 1185 888
Rb 175 117 156 237 87 115 141 96 112 115 62 177 115
Sr 354 534 8.1 274 424 114.5 25.6 566 630 557 595 363 396
Zr 103 94 96 143 82 198 207 116 97 98 108 109 100
Cu 592 64 248 3940 589 BDL BDL 537 5 220 88 114 214
Zn 339 72 83 200 26 53 44 33 56 83 27 226 44
Pb 13 36 349 12 26 20 7 11 20 46 12 29 21
35

Sample LF-12171
LF-12716
LF-13114
LF-BM3
LF-10788
LF-Bu05
LF-112c
LF-EC1
LF-EC4
LF-EC6
LF-CB2
LF-CB3
LF-CB6 LF-EP
La 17.8 18.8 17.9 25 6 37.9 43.2 19.2 17.1 15.4 9.5 14.4 82.3 38
Ce 33.3 35.8 33.8 45.1 16 70.6 79.9 37 33.3 30.4 21.9 29.2 146.5 66.8
Pr 4.0 4.4 4.2 5.0 2.4 8.2 9.2 4.4 4.0 3.6 3.0 3.8 16.1 7.6
Nd 15 16.5 17.2 17.2 9.8 30.4 33.9 15.7 14.4 13.3 12.9 14.3 53.2 27.3
Sm 2.8 3.1 3.8 3.3 2.7 5.2 5.8 3.1 2.9 2.7 2.8 2.8 6.8 4.4
Eu 0.6 0.9 0.7 0.7 0.7 1.2 1.3 0.9 0.8 0.8 0.8 0.7 1.1 1.2
Gd 2.2 2.4 3.5 2.8 2.4 3.7 4.2 2.5 2.5 2.2 2.5 2.0 3.8 3.3
Tb 0.3 0.4 0.5 0.4 0.4 0.5 0.6 0.4 0.4 0.3 0.4 0.3 0.5 0.4
Dy 1.8 2.0 2.7 2.3 2.2 2.8 3.2 2.0 2.1 1.8 2.1 1.6 2.3 2.2
Ho 0.4 0.4 0.5 0.5 0.4 0.6 0.6 0.4 0.4 0.4 0.4 0.3 0.4 0.4
Er 1.1 1.2 1.4 1.3 1.4 1.6 1.8 1.2 1.3 1.0 1.3 1.0 1.3 1.1
Tm 0.2 0.2 0.2 0.2 0.2 0.2 0.3 0.2 0.2 0.2 0.2 0.1 0.2 0.2
Yb 1.1 1.2 1.3 1.4 1.4 1.6 1.8 1.3 1.4 1.0 1.3 1.0 1.3 1.1
Lu 0.2 0.2 0.2 0.2 0.2 0.2 0.3 0.2 0.2 0.2 0.2 0.2 0.2 0.2
Th 7.3 7.8 6.8 6.6 7.2 10.2 11.7 6.1 5.0 5.9 5.9 6.4 27.0 10.4
Nb 7.5 7.1 5.2 6.5 6.8 15.5 16.8 9 7 7.2 7.4 7.4 7.9 11
Y 11 11.6 11.6 13.7 13.1 16.3 18.7 11.9 12.6 9.9 12.6 9 12.4 11.7
Hf 3 2.8 2.9 4.6 2.8 5.1 5.4 3.7 3.1 3.2 3.1 3.3 3.2 3.6
Ta 0.7 0.7 0.5 0.7 0.7 1.2 1.3 0.7 0.6 0.6 0.7 0.8 1 0.9
U 4.3 4.6 3.7 4.8 3.6 3.6 4.1 2.3 2.3 6.1 2.3 4.4 9.3 3.7
36

37
Zircon U/Pb ages
A total of five samples were measured by SHRIMP-RG for 238U/206Pb age
determinations, with two coming from Carlin dikes (LF-Bu05 and LF-112c), two from
Battle Mountain dikes (LF-10788 and LF-12716) and one from the Copper Canyon
stock at Battle Mountain (LF-BM3). All ages are reported as weighted mean ages with
a 2 standard deviation error. The Carlin dikes yielded fairly simple age spectra with
little variation around the mean weighted age, whereas all three Battle Mountain
samples are more complex, with multiple age populations present (Figure 11).
The Carlin dike sample LF-Bu05, has a weighted mean age of 38.7 ± 0.5 Ma
(n=11 of 13 spot analyses) with an MSWD of 1.32 (Figure 11A). Sample LF-112c,
has an age of 38.8 ± 0.4 Ma (n=13 of 14 spots) with an MSWD of 1.46 (Figure 11B).
The three excluded zircon analyses from these two samples range from 35 to 36 Ma,
and have been interpreted to be too young due to Pb-loss. Both of these interpreted
ages overlap within analytical uncertainty and can be considered indistinguishable
from each other in age. Both these samples yielded interpreted ages that are within
error of U/Pb TIMS ages determined for a sample of Goldstrike biotite feldspar
porphyry dike (sample: 96-M-208) and the Griffin dacite (sample: G11-12-1) of 37.8
±2.1 and 38.1 ±0.8 by Mortensen et al. (2000).
Sample LF-BM3, taken from outcrop of the Copper Canyon stock at the
Phoenix mine (Battle Mountain), has a weighted mean age of 38.0 ± 0.7 Ma (n=9 of
16 spots) with an MSWD of 1.82 (Figure 11C). This interpreted age generally agrees
38
with three K/Ar ages of biotite of 38.5 ±0.8 Ma, 38.2 ± 0.5 Ma and 38.0 ± 0.8 Ma for
the Copper Canyon stock (Theodore et al., 1973). Samples LF-10788 and LF-12716
are quartz porphyry dikes taken from drill cores at the Phoenix mine. Sample LF-
10788 taken from the Virgin dike that extends to the north from the main Copper
Canyon stock. LF-10788 has a weighted mean age of 41.3 ± 0.4 Ma (n=11of 20 spots)
with an MSWD of 1.28 (Figure 11D). LF-12716, an unnamed porphyry dike, has a
weighted mean age of 40.2 ± 0.4 Ma (n=9 of 14 spots) with an MSWD of 1.58. The
complexities of multiple age populations in the last three samples, especially LF-
10788, will be discussed further in the next section.

39

40

41
Figure 11. Terra-Wasserburg diagrams and individual zircon age histogram for all samples. Error ellipse is at 2 sigma uncertainty, filled circles used for age calculations. Weighted mean age on histogram represented by black line, uncertainty shown in blue shaded region at 2 sigma uncertainty. Individual zircon age uncertainty reported at 2 sigma level, filled markers were used for weighted mean age calculations. A. biotite feldspar hornblende porphyry from Goldstrike mine. B. biotite feldspar dike from Goldstrike mine. C. granodiorite from Copper Canyon Stock. D. Virgin dike, porphyry from Phoenix mine drillcore. E. quartz feldspar porphyry dike from Phoenix mine drillcore.

Table 5. SHRIMP-RG data for each spot analyzed.
Spot Name NoteRad
206Pb U Th 238U/206Pb1 ϭ
207Pb/206Pb1 ϭ 206Pb/238U 1 ϭ
(ppm) (ppm) (ppm) % err % err Age (Ma) error
LF-BM3-21.1R Conc 3.08 678 84 189.263 2.0 0.0470 7.3 34.0 0.7
LF-BM3-25.1R Conc 7.63 1628 356 183.399 1.6 0.0480 3.9 35.0 0.6
LF-BM3-43.1R Conc 4.33 906 98 179.706 1.7 0.0469 4.7 35.8 0.6
LF-BM3-42.1I Disc 3.27 667 62 175.357 1.8 0.0467 5.9 36.7 0.7
LF-BM3-7.1R Conc 2.84 575 351 173.803 1.8 0.0485 4.8 36.9 0.7
LF-BM3-27.1R Conc 6.47 1304 287 173.116 1.9 0.0491 3.2 37.0 0.7
LF-BM3-39.1R Conc 5.80 1168 175 173.179 1.5 0.0451 3.7 37.2 0.6
LF-BM3-41.1R Conc 5.59 1089 128 167.471 1.6 0.0485 4.0 38.3 0.6
LF-BM3-6.1R Conc 6.43 1253 206 167.294 1.5 0.0482 3.0 38.3 0.6
LF-BM3-1.1R Conc 9.11 1763 238 166.193 1.5 0.0507 2.5 38.5 0.6
LF-BM3-15.1R Conc 3.08 591 68 164.954 1.6 0.0461 4.4 39.0 0.6
LF-BM3-23.1R Conc 4.39 842 83 164.634 1.8 0.0460 6.8 39.1 0.7
LF-BM3-8.1R Disc 8.41 1550 189 158.468 1.5 0.0467 2.7 40.6 0.6
LF-BM3-21.1R Disc 5.61 1021 164 156.396 1.5 0.0473 3.3 41.1 0.6
LF-BM3-31.1I Disc 4.60 834 98 155.766 1.8 0.0504 4.9 41.1 0.8
LF-BM3-40.1R Disc 3.83 687 81 154.314 1.9 0.0439 6.1 41.8 0.8
LF-BM3-32.1R Conc 1.33 168 12 108.150 2.1 0.0451 7.2 59.5 1.3
LF-BM3-7.2C Conc 85.93 425 204 4.251 1.4 0.1049 0.5 1334.2 18.1
LF-10788-35.1R Disc 1.82 385 156 181.728 1.8 0.04918 7.0 35.3 0.7
LF-10788-32.1R Conc 9.24 1922 212 178.646 1.5 0.05015 2.3 35.8 0.5
LF-10788-33.1R Conc 4.75 986 102 178.347 1.5 0.05036 3.3 35.9 0.5
LF-10788-26.1R Disc 4.64 925 111 171.329 1.9 0.04911 6.5 37.4 0.7
LF-10788-23.1R Conc 1.47 289 75 169.596 1.9 0.04820 5.6 37.8 0.7
LF-10788-36.1R Conc 0.46 91 20 167.876 2.6 0.04391 10.8 38.4 1.0
LF-10788-39.1R Disc 2.61 502 59 165.241 2.1 0.04970 9.5 38.8 0.8
LF-10788-19.1R Conc 6.40 1176 197 158.019 1.5 0.04939 2.8 40.5 0.6
42

Spot Name NoteRad
206Pb U Th 238U/206Pb1 ϭ
207Pb/206Pb1 ϭ 206Pb/238U 1 ϭ
(ppm) (ppm) (ppm) % err % err Age (Ma) error
LF-10788-27.1R Conc 2.18 401 121 157.625 1.7 0.04989 5.0 40.6 0.7
LF-10788-8.1R Conc 6.69 1231 288 157.932 1.4 0.04645 2.6 40.7 0.6
LF-10788-11.1R Conc 1.64 299 69 156.992 1.8 0.04849 5.5 40.8 0.7
LF-10788-24.1R Conc 4.05 727 90 154.289 3.3 0.05551 6.9 41.2 1.4
LF-10788-20.1R Conc 3.35 604 74 154.922 1.6 0.04932 4.3 41.3 0.7
LF-10788-14.1R Conc 7.61 1372 301 154.835 1.4 0.04672 2.6 41.5 0.6
LF-10788-2.1I Conc 4.07 733 70 154.532 1.5 0.04743 3.5 41.6 0.6
LF-10788-16.1R Conc 5.82 1043 165 154.087 1.5 0.04507 3.2 41.8 0.6
LF-10788-15.1R Conc 7.41 1325 138 153.552 1.5 0.04743 2.7 41.8 0.6
LF-10788-10.1R Conc 6.67 1192 177 153.506 1.5 0.04715 2.8 41.8 0.6
LF-10788-9.1R Disc 7.44 1281 274 148.005 1.4 0.04806 2.5 43.3 0.6
LF-10788-2.2C Conc 3.17 546 113 147.762 1.6 0.04725 3.8 43.5 0.7
LF-10788-26.1R Disc 8.43 1361 171 138.639 1.8 0.04872 5.3 46.2 0.9
LF-12716--16.1R Conc 7.24 1407 173 167.109 2.9 0.05226 3.1 38.2 1.1
LF-12716--16.1R Conc 5.66 1100 81 166.951 2.7 0.04872 4.4 38.4 1.0
LF-12716--28.1R Conc 13.24 2518 470 163.473 1.4 0.04940 1.9 39.2 0.6
LF-12716--13.1R Conc 3.17 595 47 161.345 1.6 0.05011 4.3 39.7 0.6
LF-12716--4.1R Conc 9.81 1839 333 160.991 1.4 0.04810 2.4 39.9 0.6
LF-12716--31.1R Conc 10.04 1879 270 160.823 1.5 0.04789 2.3 39.9 0.6
LF-12716--23.1R Conc 8.25 1540 158 160.348 1.5 0.04747 2.7 40.0 0.6
LF-12716--29.1R Conc 12.58 2340 313 159.797 1.4 0.04714 2.1 40.2 0.6
LF-12716--5.1R Conc 10.99 2037 268 159.274 1.4 0.04738 2.4 40.3 0.6
LF-12716--17.1R Conc 6.72 1238 132 158.184 1.5 0.04847 2.8 40.5 0.6
LF-12716--7.1R Conc 8.51 1561 206 157.593 1.4 0.04757 2.7 40.7 0.6
LF-12716--10.1R Conc 7.98 1431 335 154.113 1.4 0.04755 2.9 41.7 0.6
LF-12716--20.1R Disc 13.37 2395 348 153.935 1.4 0.04778 2.1 41.7 0.6
43

Spot Name NoteRad
206Pb U Th 238U/206Pb1 ϭ
207Pb/206Pb1 ϭ 206Pb/238U 1 ϭ
(ppm) (ppm) (ppm) % err % err Age (Ma) error
LF-12716--18.1R Disc 3.69 652 50 151.834 1.8 0.04844 4.6 42.2 0.8
LF-12716--8.1R Disc 5.20 415 155 68.635 1.6 0.04993 3.7 93.0 1.5
LF-12716--14.1R Disc 10.73 818 567 65.526 1.4 0.04942 2.9 97.5 1.4
LF-Bu05-1.1R Pb loss 0.51 115 42 195.272 2.6 0.05880 10.7 32.4 0.9
LF-Bu05-2.1I Conc 1.30 279 165 184.237 2.0 0.05024 7.0 34.7 0.7
LF-Bu05-25.1R Disc 1.20 254 111 181.463 2.2 0.04412 7.5 35.5 0.8
LF-Bu05-7.1I Conc 1.59 321 210 173.227 1.8 0.05540 5.8 36.7 0.7
LF-Bu05-14.1R Conc 1.12 220 85 168.534 2.0 0.05439 6.9 37.8 0.8
LF-Bu05-40.1I Conc 0.58 115 44 168.546 2.4 0.04824 9.7 38.1 0.9
LF-Bu05-10.1R Conc 1.29 253 186 168.313 2.1 0.04817 7.8 38.1 0.8
LF-Bu05-45.1I Conc 0.97 190 87 167.951 2.1 0.04922 7.8 38.2 0.8
LF-Bu05-20.1R Conc 2.07 402 406 167.216 1.9 0.04756 5.9 38.4 0.8
LF-Bu05-38.1I Conc 1.75 340 158 166.866 1.8 0.04852 5.9 38.4 0.7
LF-Bu05-47.1R Conc 1.44 277 164 165.945 2.0 0.04813 6.7 38.7 0.8
LF-Bu05-21.1R Conc 0.87 167 68 164.186 2.5 0.05154 8.7 38.9 1.0
LF-Bu05-13.1I Conc 2.40 462 345 165.260 1.9 0.04588 5.2 38.9 0.7
LF-Bu05-32.1R Conc 1.27 240 112 162.607 1.9 0.05364 6.4 39.2 0.8
LF-Bu05-33.1R Conc 2.07 385 252 159.973 1.7 0.04883 5.1 40.1 0.7
LF-Bu05-15.1R Conc 11.06 236 24 18.363 1.5 0.07032 1.9 334.7 4.9
LF-Bu05-15.2C Conc 23.43 110 63 4.032 1.6 0.09088 1.3 1427.2 22.4
Conc = concordant, Disc = discordant, I = interior, R = rim and C = core
44

45
Figure 12. Rare earth element (REE) plots for selected samples collected by SHRIMP-RG (A-D & H) and LA-ICPMS (E-G). A and B collected from Carlin dikes, showing small negative Eu anomaly and pronounced positive Ce anomaly, with slightly concave downward HREE pattern. C. Copper Canyon stock and D. Virgin Dike at Phoenix mine showing similar morphology to Carlin, but with lower MREE. E and F from Elders Creek porphyry, with larger Eu anomaly and smaller Ce anomaly. G. The Jurassic Bald Mountain stock, note linear trend from LREE to HREE, as well as variable Eu anomaly. H. Unpublished data from Joe Colgan and Joe Wooden from the Harrison Pass pluton (Colgan et al., 2010).

46
Zircon rare earth element data
Trace element and rare earth element (REE) data presented herein has been
screened and culled in several ways: 1) on the basis of anomalously high phosphorous
content observed in data processing, which indicate the ablation of sizeable apatite
inclusions 2) on the basis of enrichment in the light REE interpreted to result from
micro-apatite inclusions and 3) where multiple light REEs are below detection limit.
Rare earth element concentrations have been normalized to chondrite values of
Anders and Grevesse (1989) multiplied by 1.3596 after Korotev (1996) in construction
of REE diagrams (Figure 12). The samples analyzed have typical zircon patterns with
enrichment in HREE, depletion in LREE and positive Ce and negative Eu anomolies.
The primary visual difference between each sample group is the morphology and
convexity of the middle and heavy REE profile. There is little difference in REE
patterns between each of the Battle Mountain and Carlin samples, but a marked
difference in Eu anomoly when compared with samples from Caetano and Bald
Mountain.

47
Figure 13. LA-ICPMS zircon trace element data for individual grains. A. Yb/Dy vs. Th/U Note increase of heavy rare earth elements (Yb) as Th/U decreases. B. Yb/Dy vs. Hf (ppm), showing loose correlation between crystallization (increasing Hf) and increasing heavy rare earth concentrations.

48
The Hf contents from all samples measure by LA-ICPMS and SHRIMP-RG
range from 7,000 to 14,500 ppm (Appendix A & B), and indicate greater extents of
crystallization and cooling with higher Hf contents which show increased
concentrations of inconpatible trace elements with increased Hf (Claiborne et al.,
2006). Figures 13 and 14 compares Hf content with other trace elements and trace
element ratios.
Figure 14. LA-ICPMS zircon trace element data for individual grains. Th/U versus Hf (ppm), showing decreasing Th/U ratio with crystallization.
Yb/Dy ratios provide a measure of the heavy to middle REE ratio and the
steepness of that part of the REE pattern (Figure 13). The Yb/Dy ratios range from 3

49
to 6 in Carlin samples, 4 to 10 in the Battle mountain samples, and 3 to 6 in the Bald
Mountain sample. The Th/U ratio of sample decreases with the increase of Hf (Figure
14), indicating that reflects normal trends in crystallization. Carlin samples range from
0.4 to 1.4 in Th/U, Battle Mountain 0.1 to 0.8 and Bald Mountain 0.3 to 0.9.
Ce(IV)/Ce(III) and (Eu/Eu*)CN ratios
Ce(IV)/Ce(III) ratios of zircon have been calculated following the methods of
Ballard et al. (2002).The total concentrations of Ce in zircon and melt is considered to
be a sum of Ce(IV) and Ce(III) in each phase. Separate partition coefficients are
modeled for each valence state by assuming that mineral-melt partition coefficients
for cations are a function of ionic radius. The concentration of cerium in the whole
rock is assumed to be the cerium concentration in the crystallizing melt. The partition
coefficients are modeled based on lattice-strain partitioning after Onuma et al (1968).
This assumes that as the ionic radius of a substituting cation becomes closer to the site
radius, the partition coefficient increases (see Figure 15A). To estimate the partition
coefficents of Ce4+ and Ce 3+, a lattice-strain parameter is used along with the
calculated natural logarithm of the partition coefficients of each rare earth element
measured in the zircon, which then forms a straight line (see Figure 15B). Using a
linear regression it is then possible to estimate the partition coefficient of each of the

50
Ce species. The equation below was used to calculate Ce(IV)/Ce(III) ratios of zircon
for all samples (from Ballard et al 2002):
zirconmelt zircon/melt
Ce(III)zircon
zirconmeltzircon/melt
Ce(IV)
CeCeD
Ce(IV)/Ce(III) Ce CeD
−=
−
To solve this eqation four variables are needed: measured concentrations of Ce
in zircon and melt (assumed from the whole rock concentration), and zircon-melt
partition coefficients for Ce(IV) and Ce(III), which are estimated using the method
used by Ballard et al 2002 and described above. Of concern when using this method is
the inherent uncertainty of the estimated Ce(IV)/Ce(III) ratios, such as compounding
analytical errors in the measurement of REEs and the uncertainty of the linear
regression used to calculate the Ce species partition coefficients. The estimates of the
final Ce(IV)/Ce(III) ratio changes by almost an order of magnitude if the minimum or
maximum partition coefficient is used in calculating the regression line. Figure 16
presents an example from Caetano and Battle Mountain where error bars for each
Ce(IV)/Ce(III) ratio has been shown. The error bars are derived from using the
maximum and minimum partition coefficients calculated for each zircon grain in the
sample, which illustrates the sensitivity of the Ce(IV)/Ce(III) ratio to the concentration
of the particular trace element in each zircon. A full digital workbook of calculations
and an investigation of the sensitivity to partitioning is presented in appendix C.

51
Figure 15. A. Onuma (1968) diagram of zircon-melt partition coefficient plotted versus ionic radius. Example shown is taken from LF-BM3, showing trace elements that commonly partition into zircon crystal structure. B. Calculated least square square fit for trivalent and tetravalent cations for LF-BM3, which are used to estimate partition coefficients for Ce3+ and Ce4+.
This approach allows an evaluation of relative oxidation state that is not
controlled by external influences (such as the effect of plagioclase on Eu in the melt
budget), and is preferred by some workers due to the sensitivity of the Ce(IV)/Ce(III)
ratio in zircon to change, varying by almost two orders of magnitude in this and
previous studies. It should be noted that Ce(IV)/Ce(III) ratios calculated for zircon do
not reflect the Ce(IV)/Ce(III) ratio of the parental melt, and that zircon is the only

52
igneous mineral to exhibit a Ce anomaly. This is due in part to the very high
preference of Ce(IV) over Ce(III) for zircon, and a positive Ce anomaly can be
achieved with crystallization of zircon from a melt with a Ce(IV)/Ce(III) ratio on the
order of 10-3 (Hinton and Upton, 1991). This extreme partitioning is due to the 4+
valence state of Ce, which has an ionic radii (0.97 Å) that is very similar to Zr (0.84
Å), compared to the Ce3+ valence state (1.14 Å).
(Eu/Eu*)CN anomalies have been calculated by a geometric mean for Eu* that
estimates the chondrite-normalized concentration of Eu in the absence of a positive or
negative anomaly:
( )* EuEu / EuSm Gd
CNCN
CN CN
=×
It should be noted that all Eu/Eu* ratios are chondrite normalised. Figure 14
illustrates the calculated Ce(IV)/Ce(III) versus (Eu/Eu*)CN of the Carlin and Battle
Mountain samples together. The Battle Mountain data have high Ce(IV)/Ce(III) values
between ~500 and ~10,000 and moderate (Eu/Eu*)CN between 0.3 and 0.7. Carlin
data are between 100 and 1000 for Ce(IV)/Ce(III) and between 0.5 and 0.7 for
(Eu/Eu*)CN.

53
Figure 16. Ce(IV)/Ce(III) versus Hf (ppm) of select data from each Caetano and Battle Mountain samples, showing magnitude of uncertainty associated with the calculation of Ce anomaly.
Bald Mountain and non-productive samples from Harrison Pass and Caetano
intrusions have been binned together, and show a much larger range in (Eu/Eu*)CN,
from ~0.03 to 0.6, and Ce(IV)/Ce(III) values between 20 and 500. Figure 18 shows the
variation of Ce(IV)/Ce(III) and (Eu/Eu*)CN with Hf, which is used as a proxy for
crystallization and cooling of a given magmatic system. Figure 18 illustrates that
different samples have different variations with respect to Ce(IV)/Ce(III) and
(Eu/Eu*)CN as a function of Hf content. Cerium anomolies appear to increase with

54
increasing Hf concentration, whereas (Eu/Eu*)CN anomalies either decrease or stay
constant. Simply stated, a uniform characterisitc of the productive intrusions is that
they have higher Ce(IV)/Ce(III) ratios and (Eu/Eu*)CN anomaly is closer to one.
Figure 17. SHRIMP-RG zircon spot data of Ce/Ce* versus Hf (ppm). Note the general scatter within each sample, and general lack of relationship with Hf concentration. In some instances, such as with LF-Bu05, there may be a general increase in Ce/Ce*CN with increasing Hf concentration.
It should be noted that calculating Ce(IV)/Ce(III) ratios is far more robust than
simply using Ce/Ce* for approximating the cerium anomaly. Using Ce/Ce* relies

55
upon using lanthanum in estimation, and usually this element is present at very low
concentration in zircon, which thus introduces a great deal scatter in Ce/Ce* data
when compared to Ce(IV)/Ce(III) or (Eu/Eu*)CN (see Figure 17).
Figure 18. Single grain Ce(IV)/Ce(III) versus (Eu/Eu*)CN ratios for all samples analyzed by SHRIMP-RG. Red field represents all Battle Mountain. samples, blue field represents all Carlin samples, and green the intrusions of Bald Mountain, Harrison Pass and Caetano caldera.

56
Figure 19. Zircon trace elements. A. (Eu/Eu*)CN versus Hf concentration. B. Ce(IV)/Ce(III) versus Hf (B). Note how both Ce(IV)/Ce(III) and (Eu/Eu*)CN ratios for both Battle Mtn. and Carlin samples are greater at any particular Hf concentration than non-productive samples.

57
Zircon thermal history
Figure 20. CL Images of representative grains A. from Battle Mountain (LF-BM3) and B. Carlin (LF-Bu05). Large white numbers represent grain number. Blue circle represents analytical spot for SHRIMP-RG ages, with corresponding age in Ma (1ϭ). White spots represent SHRIMP-RG Ti-in-zircon spot analyses, with calculated temperatures following Ferry and Watson (2007). A. CL dark grains with high U content, showing complex oscillatory zoning and showing rounded inherited cores in grains 7 and 15. B. CL light grains with weak sector and oscillatory zoning.

58
Titanium-in-zircon thermometry was employed for samples LF-BM3 and LF-
Bu05 (Figure 20) to estimate crystallization temperatures of each zircon spot analyses.
The Ti-in-zircon thermometer of Ferry and Watson (2007) was employed using the
recommended activity of TiO2=0.7 in melt on the basis that Ti activity is buffered by
silicate and oxide phases. Uncertainty in the activity of TiO2 can cause uncertainty of
approximately 10-15 °C in temperature estimations, but assuming that a melt is
saturated in a Ti-bearing phase (titanite, rutile or titanomagnetite), the estimates will
be internally consistent (Claiborne et al., 2006).
A total of 11 core-rim pairs were measured in sample LF-BM3, and gave
temperatures ranging mostly from 643 to 700°C, with two outliers of 908 and 815°C
(see Figure 20A). There was no distinct temperature difference between rim and cores,
with one hotter than the other. Ti-in-zircon temperatures are sometimes greater for
cores than rims and in other cases vice versa.
A total of 10 core- rim pairs were analyzed for sample Bu05-1c, and gave
temperature estimates ranging from 783 to 887°C, systematically higher than LF-
BM3. This is more restricted temperature range than LF-BM3, but again there was no
clear temperature difference between rims and cores. In this case though, when a core
was hotter than a rim, it was 30 to 40°C hotter and no more.
59
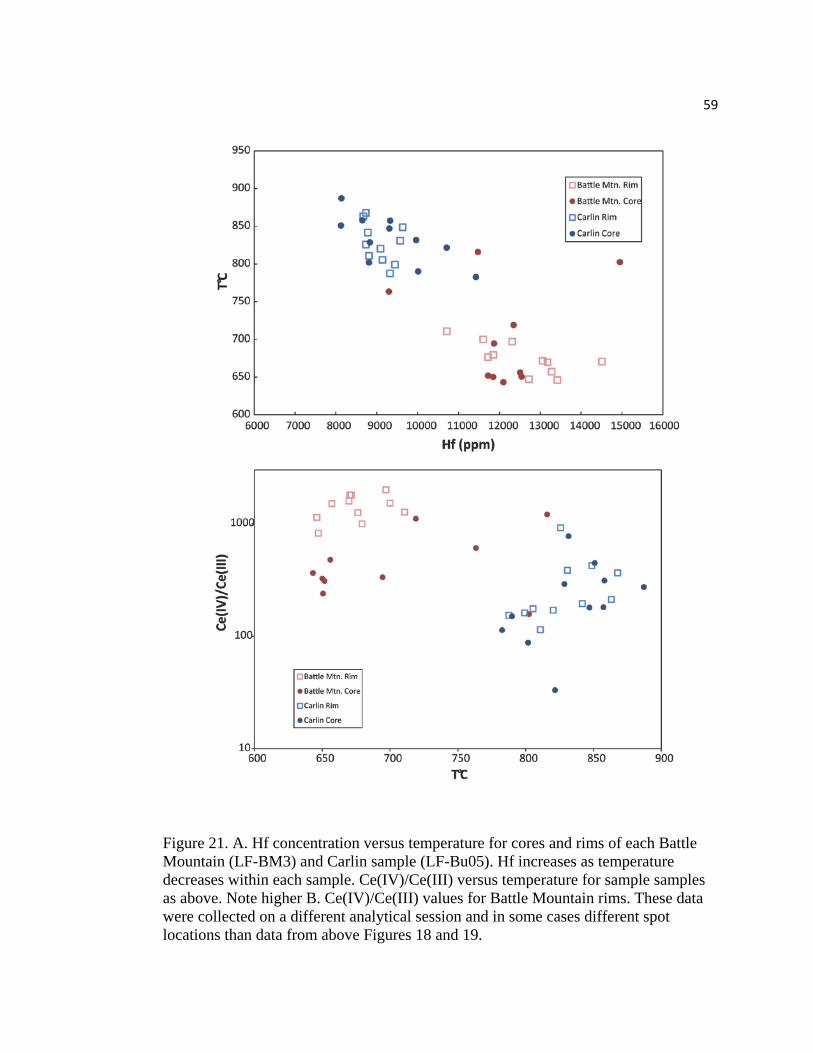
Figure 21. A. Hf concentration versus temperature for cores and rims of each Battle Mountain (LF-BM3) and Carlin sample (LF-Bu05). Hf increases as temperature decreases within each sample. Ce(IV)/Ce(III) versus temperature for sample samples as above. Note higher B. Ce(IV)/Ce(III) values for Battle Mountain rims. These data were collected on a different analytical session and in some cases different spot locations than data from above Figures 18 and 19.

60
In the case of LF-BM3, rims and cores have a similar range of temperatures, but rims
have a higher Ce(IV)/Ce(III) ratio than cores. Such a relationship does not exist for
LF-Bu05 btween core and rim (see Figure 21B).
Discussion
Zircon Ages
Ages reported for each sample are given as a weighted mean age from the
206Pb/238U ages calculated using Isoplot (Ludwig, 2003). All grains shown are
concordant, with the exception of two grains (one in LF-10788 and one in LF-12716),
and the largest grouping of concordant ages have been used to calculate the weighted
mean age. Figure 11D, for example, shows that individual zircon ages in sample LF-
10788 include six grains that are distinctly younger and well outside the 2 sigma
uncertainty level of the largest age population that yields the robust mean noted above.
Recently, new high-precision ID-TIMS ages of zircons have been collected by authors
that argue that a simple weighted mean age from a diverse zircon population is not
necessarily valid to interpret the age of intrusion, and further convincingly that the
youngest concordant grains to crystallize can be interpreted as the maximum intrusion
age (Von Quadt et al., 2011). For this reason, individual concordant grain ages from
this study have been presented in histogram form alongside Terra-Wasserburg plots.

61
The younger zircon ages can be potentially also be attributed to lead-loss, leading to
artificially young ages, and the older zircon ages can potentially be attributed to
antecrysts crystallized in previous magmatic episodes of the same systems, leading to
ages that are too old. It is not uncommon for zircons to crystallize and be recycled in
plutonic systems over long timescales, thus leading to the idea of antecryst zircons
(Miller and Wooden, 2004; Miller et al., 2007).
The ages reported for LF-10788 and LF-12716 may be artificially too old, on
the basis that the main period of zircon growth within the main magma chamber
predates the emplacement of the sampled dike, and thus the true emplacement age of
the dike is not recorded by zircons. In order to accurately estimate the age of
emplacement, it may be necessary to interpret the youngest concordant zircon as an
age of intrusion. These two dikes may contain a considerable population of antecrystic
zircon crystallized from previous late Eocene magmatism, that have been entrained by
younger intrusions. The interpreted ages for these samples has been made on the
abundance of ages, not necessarily on the youngest grain present, and these older ages
may represent a period of zircon saturation and growth within a previous period of
magmatism. It is likely that these two dikes were emplaced around 38 Ma along with
the main Copper Canyon stock, and the younger grains represent and age of
crystallization. The zircon age reported for LF-BM3 agrees with previously reported
K-Ar ages, and therefore may be a case where the crystallization age is the same as the
emplacement age for the Copper Canyon stock. The age spectra of the two Carlin dike
samples are simpler to interpret, and both overlap within error, thus leading to the

62
conclusion that they are potentially contemporaneous with each other and within
uncertainty are geologically the same age.
All of the Carlin dike ages fit within the bounds of previous studies involving
geochronologic methods. (Chakurian et al., 2003; Arehart et al., 2003; Mortensen et
al., 2000). Despite the lack of radiometric age dating in Battle Mountain, the ages
reported within for the Copper Canyon stock agree with those collected in the early
1970’s (Theodore et al., 1973), although dike ages at depth are considerably older.
Zircon Trace Element Compositions
The rare earth element patterns of mineralized and non-mineralized intrusions
(Figure 12) have distinct differences, primarily the smaller negative Eu anomalies and
proportionally lower middle REE present in mineralized intrusions. The Harrison Pass
pluton, for example (Figure12H), is a barren intrusion and has a moderate negative Eu
anomaly and enriched middle REE which produces a convex or ‘humpback’
morphology. The Copper Canyon stock on the other hand has a small Eu anomaly and
a much less convex pattern. The depletion of middle REEs in the productive intrusions
could be attributed to hornblende and/or titanite fractionation (Chambefort et al.,
2008), and the difference in Eu anomalies between the two groups is be attributed to
fractionation of plagioclase. Slight differences in the oxidation state and/or water
content that exists between barren and productive magmas may contribute to this
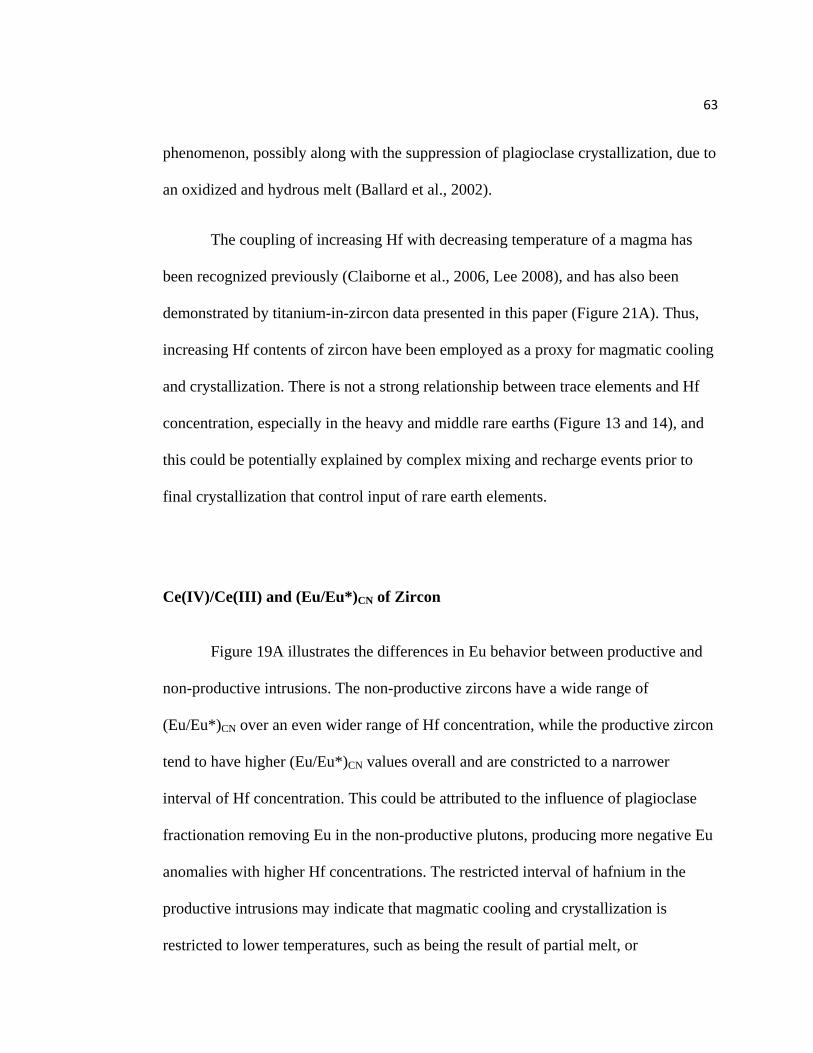
63
phenomenon, possibly along with the suppression of plagioclase crystallization, due to
an oxidized and hydrous melt (Ballard et al., 2002).
The coupling of increasing Hf with decreasing temperature of a magma has
been recognized previously (Claiborne et al., 2006, Lee 2008), and has also been
demonstrated by titanium-in-zircon data presented in this paper (Figure 21A). Thus,
increasing Hf contents of zircon have been employed as a proxy for magmatic cooling
and crystallization. There is not a strong relationship between trace elements and Hf
concentration, especially in the heavy and middle rare earths (Figure 13 and 14), and
this could be potentially explained by complex mixing and recharge events prior to
final crystallization that control input of rare earth elements.
Ce(IV)/Ce(III) and (Eu/Eu*)CN of Zircon
Figure 19A illustrates the differences in Eu behavior between productive and
non-productive intrusions. The non-productive zircons have a wide range of
(Eu/Eu*)CN over an even wider range of Hf concentration, while the productive zircon
tend to have higher (Eu/Eu*)CN values overall and are constricted to a narrower
interval of Hf concentration. This could be attributed to the influence of plagioclase
fractionation removing Eu in the non-productive plutons, producing more negative Eu
anomalies with higher Hf concentrations. The restricted interval of hafnium in the
productive intrusions may indicate that magmatic cooling and crystallization is
restricted to lower temperatures, such as being the result of partial melt, or

64
crystallization due to exsolution of water. Oxidation state can also play a major role in
Eu uptake in plagioclase, as the partition coefficient between plagioclase and Eu2+
drops dramatically when Eu3+ is present compared to Eu2+. Thus, if plagioclase is
crystallizing in a more oxidized environment, the trend of decreasing (Eu/Eu*)CN can
be slowed (Wilke and Behrens, 1999). In Figure 19A, the lack of any change in the
Eu anomaly may suggest that plagioclase was not crystallizing at the same time as
zircon in the mineralizing porphyry type magmas in both the Battle Mountain &
Carlin type, yet this cannot be the case due to observation of zircon inclusions in
plagioclase in both samples. Regardless of origin, the large negative (Eu/Eu*)CN
anomaly does not decrease with increased Hf content in the mineralized magmas,
whereas the (Eu/Eu*)CN anomaly decreases with increased Hf content than in non-
mineralized intrusions. In order to evaluate Carlin zircons, grains from Goldstrike
were compared to those of Cortez mine, both of which are Carlin type gold deposits.
What is notable about this comparison is that both have very little to no decrease in
(Eu/Eu*)CN with increasing concentrations of Hf, even though the magnitude of the Eu
anomaly is different between the two. This same relationship is observed amongst
different Carlin type intrusions, figure 22 shows (Eu/Eu*)CN versus Hf concentration
for Cortez and Goldstrike samples. As Hf concentration increases between each one,
the (Eu/Eu*)CN ratio stays the same. This may indicate a similar process or chemical
state between Carlin magmas of Goldstrike and Cortez.
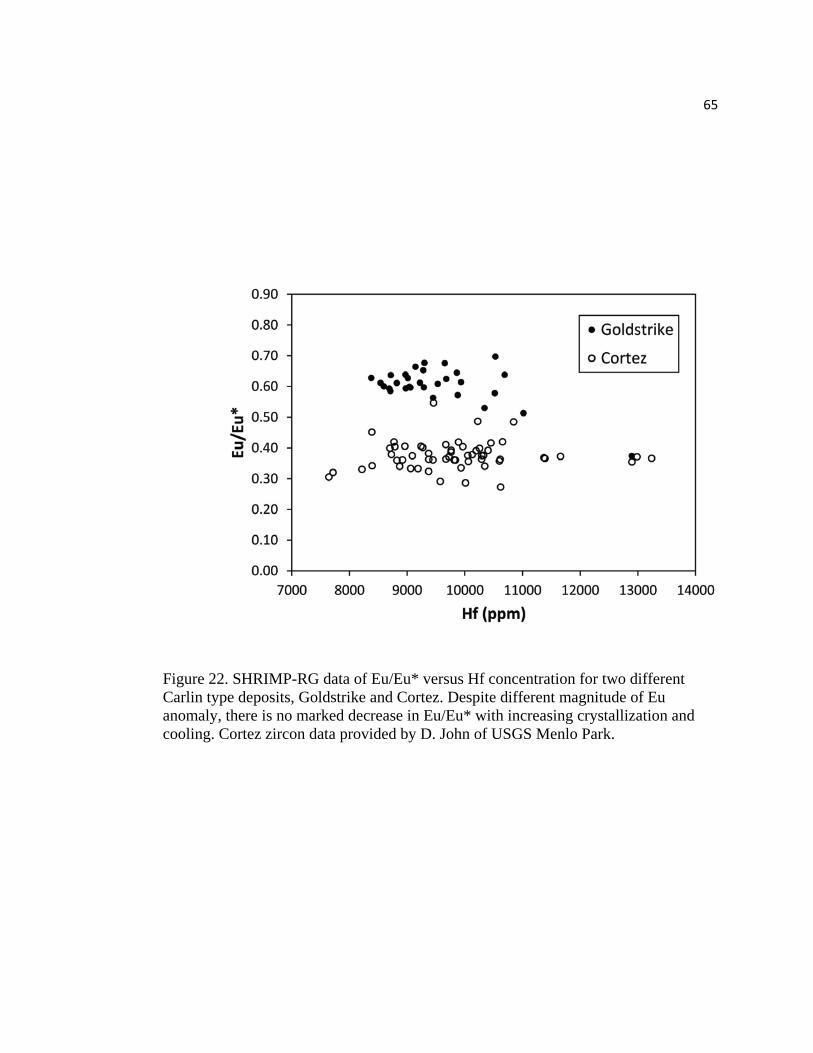
65
Figure 22. SHRIMP-RG data of Eu/Eu* versus Hf concentration for two different Carlin type deposits, Goldstrike and Cortez. Despite different magnitude of Eu anomaly, there is no marked decrease in Eu/Eu* with increasing crystallization and cooling. Cortez zircon data provided by D. John of USGS Menlo Park.
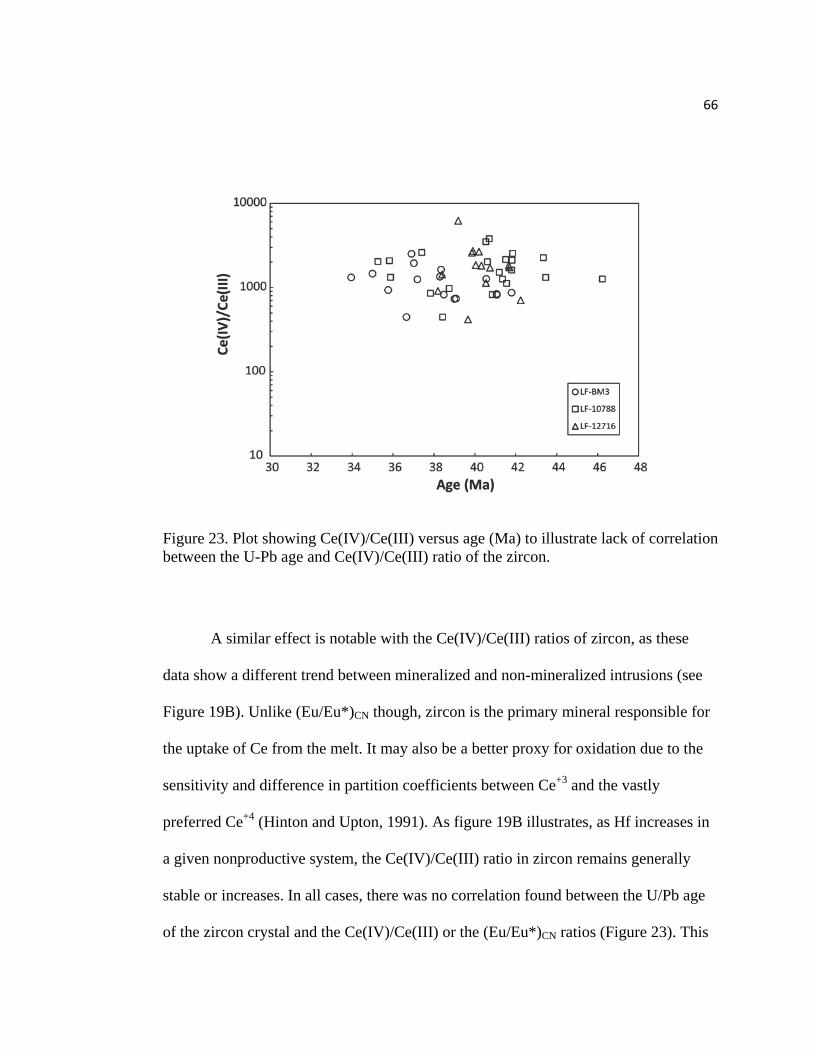
66
Figure 23. Plot showing Ce(IV)/Ce(III) versus age (Ma) to illustrate lack of correlation between the U-Pb age and Ce(IV)/Ce(III) ratio of the zircon.
A similar effect is notable with the Ce(IV)/Ce(III) ratios of zircon, as these
data show a different trend between mineralized and non-mineralized intrusions (see
Figure 19B). Unlike (Eu/Eu*)CN though, zircon is the primary mineral responsible for
the uptake of Ce from the melt. It may also be a better proxy for oxidation due to the
sensitivity and difference in partition coefficients between Ce+3 and the vastly
preferred Ce+4 (Hinton and Upton, 1991). As figure 19B illustrates, as Hf increases in
a given nonproductive system, the Ce(IV)/Ce(III) ratio in zircon remains generally
stable or increases. In all cases, there was no correlation found between the U/Pb age
of the zircon crystal and the Ce(IV)/Ce(III) or the (Eu/Eu*)CN ratios (Figure 23). This

67
may be in part due to analytical error present in both the estimation of the ratios or the
calculation of the U/Pb age
The productive systems behave differently, with increasing Ce(IV)/Ce(III)
ratios in zircon as Hf increases (Figure19B). This is interpreted to be increased
magmatic oxidation state through magmatic crystallization. It should also be noted
that in the rim-core analysis of the Battle Mountain zircon sample (Figure 21) that the
zircon rims had higher Ce(IV)/Ce(III) ratios than the cores, indicating that the
oxidation state in the melt had been higher near the end of the zircon crystal growth.
The Carlin zircons did not show this relationship, but this may be due in part to the
smaller size of those crystals and/or the higher temperatures at which they crystallized.
Figure 24 below shows the Ce(IV)/Ce(III) and (Eu/Eu*)CN data from this study
compared to average data reported by Ballard et al. (2002). Assuming that productive
intrusions have Ce(IV)/Ce(III) ratios greater than ~500 and (Eu/Eu*)CN ratios greater
than ~0.35 (Ballard et al., 2002), the zircons from productive intrusions in Nevada also
lie into this quadrant. Muñoz et al. (2012) conducted a similar study of zircon
geochemistry from the El Teniente porphyry copper deposit in the Chilean Andes and
were also reported similar results, demonstrating that productive intrusions fell into a
similar range of Ce(IV)/Ce(III) and (Eu/Eu*)CN ratios.
The coupling of two oxidation proxies, (Eu/Eu*)CN and Ce(IV)/Ce(III)
provides insight into potential oxidation states between each system. The data
collected and presented in this paper agree with and satisfactorily repeat data collected

68
and presented by previous authors investigating similar problems (Ballard et al., 2002;
Lee, 2008; Muñoz et al., 2012), but more importantly extended this method into the
investigation of intrusions associated with Carlin-style Au mineralization and
contrasting them with porphyry Cu-Au intrusions. Given the previous body of work
on the connection between relatively elevated magmatic oxidation states and related
porphyry copper deposits, the data presented here support the hypothesis that there is a
geochemical link between the two, based on cerium and europium ratios.

69
Figure 24. SHRIMP data of (Eu/Eu*)CN vs. Ce(IV)/Ce(III) compared to sample averages of Ballard (2002), with barren samples in open circles and mineralizing with filled black circles.
Possible sources of mineralizing magmas
At present, it is not certain whether Eocene magmatism is responsible for
mineralization of the Carlin type gold deposits, but some authors have shown evidence
that it is an important factor leading to mineralization (Chakurian et al., 2003; Ressel
and Henry, 2006; Muntean et al., 2011). Data from this study illustrates that there may
be some shared zircon geochemical characteristics between the Carlin and Battle

70
Mountain dikes, and that Carlin magmas may even be related to porphyry type
magmatism that is responsible for the mineralization at the Phoenix Porphyry-skarn
Cu-Au deposit in the Battle Mountain district, and there may be a similar process of
formation. The Ce(IV)/Ce(III) and (Eu/Eu*)CN diagram in figure 18 illustrate that
Carlin zircons are relatively oxidized compared to barren intrusions, and in a field
similar to zircons from porphyry copper magmas. Of important note is that the Carlin
zircons crystallized from a melt that is of a significantly higher temperature (~800°C)
than mineralizing porphyries (~650°C) found elsewhere. These higher temperatures
probably played a role in the partitioning of trace elements into zircon, and could be
partly responsible for the Ce(IV)/Ce(III) ratios of the Carlin zircons.

71
Implications for mineral exploration
As this study and others have shown (Ballard et al., 2002b; Muñoz et al.,
2012), zircons that have crystallized from productive magmas show higher
Ce(IV)/Ce(III) and (Eu/Eu*)CN ratios than other contemporaneous non-productive
intrusions, which this author has attributed to differences in oxidation states at time of
crystallization. This approach may be useful in identifying favorable geologic terranes
for porphyry copper deposits during greenfields exploration. Analyzing zircons
collected from outcrop or even stream sediment concentrate may help to fingerprint
prospective igneous intrusions, and only a relatively small population of zircon (10-15
grains) is necessary. LA-ICPMS provides a relatively cost effective way to analyze
many zircons relatively quickly. This approach may also be helpful in near mine-site
exploration to help identify particular porphyry dikes that may have been mineralizing
or mineralized themselves. Along with valuable geochemical data, the analyses of
zircon can provide an isotopic age, which can be extremely useful in assisting with
interpretations of absolute ages of multi-phase intrusions.
72
Conclusions
Zircon geochemistry from productive and non-productive intrusions of north-
central Nevada provides important new information about the link between
magmatism, porphyry Cu-Au deposits and Carlin-type gold deposits.
1) Zircons from porphyry intrusions from both the Battle Mountain porphyry
Cu-Au district and Carlin Au district fall into a category of potentially
productive magmas, on the basis of calculated Ce(IV)/Ce(III) and
(Eu/Eu*)CN ratios, and are distinctly separated from non-productive
intrusions.
2) Zircon REE compositions from Carlin porphyry dike intrusions are similar
to zircons from the porphyry Cu-Au at Battle Mountain and to other
porphyry type magmas previously studied, and have similar Ce(IV)/Ce(III)
and (Eu/Eu*)CN ratios. These findings support a magmatic-hydrothermal
origin of Carlin-type gold deposits as previously proposed by Muntean et
al. (2011).
3) Ce(IV)/Ce(III) and (Eu/Eu*)CN ratios can potentially be used to determine
prospective intrusions and identify gold producing intrusions.
4) New age data further refines age of magmatism related to gold
mineralization at Carlin. Two biotite-feldspar dikes at Goldstrike give
robust U/Pb SHRIMP-RG ages of 38.7 ± 0.5 Ma. These data improve the

73
age estimate of Carlin dikes, and may actually point to an age of
mineralization/ore deposition at the Goldstrike mine.
5) New U/Pb zircon data for the Copper Canyon stock yield an emplacement
age of 38.0 ± 0.7 Ma. Whereas two related porphyry dikes (Virgin dike)
apparently yield older ages.
74
References
Anders, E., and Grevesse, N., 1989, Abundances of the elements: Meteoritic and solar: Geochimica et Cosmochimica Acta, v. 53, no. 1, p. 197–214.
Arehart, G.B., Chakurian, A.M., Tretbar, D.R., Christensen, J.N., McInnes, B.A., and Donelick, R.A., 2003, Evaluation of radioisotope dating of Carlin-type deposits in the Great Basin, western North America, and implications for deposit genesis: Economic Geology, v. 98, no. 2, p. 235–248.
Ballard, J.R., Palin, M.J., and Campbell, I.H., 2002, Relative oxidation states of magmas inferred from Ce(IV)/Ce(III) in zircon: application to porphyry copper deposits of northern Chile: Contributions to Mineralogy and Petrology, v. 144, no. 3, p. 347–364.
Barnes, C.G., Burton, B.R., Burling, T.C., Wright, J.E., and Karlsson, H.R., 2001, Petrology and geochemistry of the late Eocene Harrison Pass pluton, Ruby Mountains core comples, northeastern Nevada: Journal of Petrology, v. 42, no. 5, p. 901–929.
Le Bas, M.J., Maitre, R.W., Streckeisen, A., and Zanettin, B., 1986, A chemical classification of volcanic rocks based on the total alkali silica diagram: Journal of Petrology, v. 27, no. 3, p. 745–750.
Black, L.P., Kamo, S.L., Allen, C.M., Davis, D.W., Aleinikoff, J.N., Valley, J.W., Mundil, R., Campbell, I.H., Korsch, R.J., Williams, I.S., and others, 2004, Improved 206Pb/238U microprobe geochronology by the monitoring of a trace-element-related matrix effect; SHRIMP, ID–TIMS, ELA–ICP–MS and oxygen isotope documentation for a series of zircon standards: Chemical Geology, v. 205, no. 1, p. 115–140.
Botcharnikov, R.E., Linnen, R.L., Wilke, M., Holtz, F., Jugo, P.J., and Berndt, J., 2010, High gold concentrations in sulphide-bearing magma under oxidizing conditions: Nature Geoscience, v. 4, no. 2, p. 112–115.
Breit, F.J., Alvarez, K.M., Gilmore, A.M., and McComb, M.B., 2009, A geologic update from the Battle Mountain district, Newmont’s Phoenix Project: Geologic Society of Nevada, p. 463–487.

75
Carroll, M.R., and Rutherford, M.J., 1985, Sulfide and sulfate saturation in hydrous silicate melts: Journal of Geophysical Research, v. 90, p. 601–612.
Castor, S.B., Boden, D.R., Henry, C.D., Cline, J.S., Hofstra, A.H., McIntosh, W.C., Tosdal, R.M., and Wooden, J.P., 2003, The Tuscarora Au-Ag district: Eocene volcanic-hosted epithermal deposits in the Carlin gold region, Nevada: Economic Geology, v. 98, no. 2, p. 339–366.
Chakurian, A.M., Arehart, G.B., Donelick, R.A., Zhang, X., and Reiners, P.W., 2003, Timing constraints of gold mineralization along the Carlin trend utilizing apatite fission-track, 40Ar/39Ar, and apatite (U-Th)/He methods: Economic Geology, v. 98, no. 6, p. 1159–1171.
Chambefort, I., Dilles, J.H., and Kent, A.J.R., 2008, Anhydrite-bearing andesite and dacite as a source for sulfur in magmatic-hydrothermal mineral deposits: Geology, v. 36, no. 9, p. 719-722, doi: 10.1130/G24920A.1.
Cherniak, D.J., and Watson, E.B., 2007, Ti diffusion in zircon: Chemical geology, v. 242, no. 3, p. 470–483.
Christiansen, E.H., and McCurry, M., 2007, Contrasting origins of Cenozoic silicic volcanic rocks from the western Cordillera of the United States: Bulletin of Volcanology, v. 70, no. 3, p. 251–267.
Claiborne, L.L., Miller, C.F., Walker, B.A., Wooden, J.L., Mazdab, F.K., and Bea, F., 2006, Tracking magmatic processes through Zr/Hf ratios in rocks and Hf and Ti zoning in zircons: An example from the Spirit Mountain batholith, Nevada: Mineralogical Magazine, v. 70, no. 5, p. 517–543.
Cline, J.S., Hofstra, A.H., Muntean, J.L., Tosdal, R.M., and Hickey, K.A., 2005, Carlin-type gold deposits in Nevada: critical geologic characteristics and viable models: Economic Geology 100th Anniversary Volume, p. 451–484.
Colgan, J.P., Howard, K.A., Fleck, R.J., and Wooden, J.L., 2010, Rapid middle Miocene extension and unroofing of the southern Ruby Mountains, Nevada: Tectonics, v. 29, no. 6, p. 1-38.
DeCelles, P.G., 2004, Late Jurassic to Eocene evolution of the Cordilleran thrust belt and foreland basin system, western USA: American Journal of Science, v. 304, no. 2, p. 105–168.

76
Dilles, J.H., 1987, Petrology of the Yerington Batholith, Nevada: Evidence for Evolution of Porphyry Copper Ore Fluids: Economic Geology, v. 82, p. 1750–1789.
Emsbo, P., Groves, D.I., Hofstra, A.H., and Bierlein, F.P., 2006, The giant Carlin gold province: a protracted interplay of orogenic, basinal, and hydrothermal processes above a lithospheric boundary: Mineralium Deposita, v. 41, no. 6, p. 517–525.
Ernst, W.G., 2010, Young convergent-margin orogens, climate and crustal thickness- A late Cretaceous-Paleogene Nevadaplano in the American Southwest?: Lithospehere, v. 2, no. 2, p. 67–75.
Ferry, J.M., and Watson, E.B., 2007, New thermodynamic models and revised calibrations for the Ti-in-zircon and Zr-in-rutile thermometers: Contributions to Mineralogy and Petrology, v. 154, no. 4, p. 429–437.
Grauch, V., Rodriguez, B.D., and Wooden, J.L., 2003, Geophysical and isotopic constraints on crustal structure related to mineral trends in north-central Nevada and implications for tectonic history: Economic Geology, v. 98, no. 2, p. 269–286.
Hanchar, J.M., 1993, Zircon Zonation Patterns as Revealed by Cathodoluminesence and Backscattered Electron Images; Implications for Interpretation of Complex Crustal Histories: Chemical Geology, v. 110, no. 1-3, p. 1–13.
Hedenquist, J.W., and Lowenstern, J.B., 1994, The Role of Magmas in the Formation of Hydrothermal Ore Deposits: Nature, v. 370, p. 519–527.
Henry, C.D., and Boden, D.R., 1998, Eocene magmatism: The heat source for source for Carlin-type gold deposits of nothern Nevada: Geology, v. 26, no. 12, p. 1067–1070.
Henry, C.D., Hinz, N.H., Faulds, J.E., Colgan, J.P., John, D.A., Brooks, E.R., Cassel, E.J., Garside, L.J., Davis, D.A., and Castor, S.B., 2012, Eocene-early Miocene paleotopography of the Sierra Nevada-Great Basin-Nevadaplano based on widespread ash-flow tuffs and paleovalleys: Geosphere, v. 8, no. 1, p. 1–27.
Humphreys, E.D., 1995, Post-Laramide removal of the Farallon slab, western United States: Geology, v. 23, no. 11, p. 987-990.
Humphreys, E., Hessler, E., Dueker, K., Farmer, G.L., Erslev, E., and Atwater, T., 2003, How Laramide-age hydration of North American lithosphere by the Farallon slab controlled subsequent activity in the western United States: International Geology Review, v. 45, no. 7, p. 575–595.

77
John, D.A., Henry, C.D., and Colgan, J.P., 2008, Magmatic and tectonic evolution of the Caetano caldera, north-central Nevada: A tilted, mid-Tertiary eruptive center and source of the Caetano Tuff: Geosphere, v. 4, no. 1, p. 75-106.
Jugo, P.J., 2009, Sulfur content at sulfide saturation in oxidized magmas: Geology, v. 37, no. 5, p. 415–418.
Jugo, P.J., Luth, R.W., and Richards, J.P., 2005, An experimental study of the sulfur content in basaltic melts saturated with immiscible sulfide or sulfate liquids at 1300 C and 1· 0 GPa: Journal of Petrology, v. 46, no. 4, p. 783.
Kay, S.M., Mpodozis, C., Tittler, A., and Cornejo, P., 1994, Tertiary magmatic evolution of the Maricunga mineral belt in Chile: International Geology Review, v. 36, no. 12, p. 1079–1112.
Kent, A.J.R., Jacobsen, B., Peate, D.W., Waight, T.E., and Baker, J.A., 2004, Isotope dilution MC-ICP-MS rare earth earth element analysis of geochemical reference materials NIST SRM 610, NIST SRM 612, NIST SRM 614, BHVO-2G, BHVO-2, BRC-2G, JB-2, WS-E, W-2, AGV-1 and AGV-2: Geostandards Newsletter, v. 28, no. 3, p. 417–429.
Klotzli, U., Klotzli, E., Gunes, Z., and Kosler, J., 2009, Accuracy of laser ablation U-Pb zircon dating: Results from a test using five different reference zircons: Geostandards and Geoanalytical Research, v. 33, no. 1, p. 5–15.
Lang, J.R., and Titley, S.R., 1998, Isotopic and geochemical charecteristics of Laramide magmatic systems in Arizona and implications for the genesis of porpyry copper deposits: Economic Geology, v. 93, p. 138–170.
Lee, R.G., 2008, Genesis of the El Salvador porphyry copper deposit, Chile and distribution of epithermal alteration at Lassen Peak, California [Ph. D.]: Oregon State University, 322 p.
Ludwig, K.R., 2003, Isoplot version 3.0: A geochronology toolkit for Microsoft Excel:.
Luhr, J.F., 1990, Experimental phase relations of water and sulfur saturated arc magmas and the 1982 eruptions of El Chichon volcano: Journal of Petrology, v. 31, no. 5, p. 1071–1114.
Mazdab, F.K., and Wooden, J.L., 2006, Trace element analysis of accessory and rock forming minerals by ion microprobe (SHRIMP-RG): technique and applications, Geochimica et Cosmochimica Acta Supplement, v. 70, p. 405 McDonough, W.F., and Sun, S.S., 1995, The composition of the Earth: Chemical
Geology, v. 120, no. 3-4, p. 223–253.

78
Miller, J.S., Matzel, J.E.P., Miller, C.F., Burgess, S.D., and Miller, R.B., 2007, Zircon growth and recycling during the assembly of large, composite arc plutons: Journal of Volcanology and Geothermal Research, v. 167, no. 1-4, p. 282–299.
Miller, J.S., and Wooden, J.L., 2004, Residence, resorption and recycling of zircons in Devils Kitchen rhyolite, Coso Volcanic field, California: Journal of Petrology, v. 45, no. 11, p. 2155–2170.
Mortensen, J.K., Thompson, J.F.H., and Tosdal, R.M., 2000, U-Pb age constraints on magmatism and mineralization in the norhtern Great Basin, Nevada, in Geology and Ore Deposits 2000: The Great Basin and Beyond, Geologic Society of Nevada, Reno, Nevada, p. 419–438.
Muñoz, M., Charrier, R., Fanning, C.M., Maksaev, V., and Deckart, K., 2012, Zircon Trace Element and O–Hf Isotope Analyses of Mineralized Intrusions from El Teniente Ore Deposit, Chilean Andes: Constraints on the source and magmatic evolution of porphyry Cu–Mo related magmas: Journal of Petrology, v. 53, no. 6, p. 1091–1122.
Muntean, J.L., Cline, J.S., Simon, A.C., and Longo, A.A., 2011, Magmatic–hydrothermal origin of Nevada’s Carlin-type gold deposits: Nature Geoscience, v. 4, no. 2, p. 122–127.
Nutt, C., and Hofstra, A., 2007, Bald Mountain gold mining district, Nevada: A Jurassic reduced intrusion-related gold system: Economic Geology, v. 102, no. 6, p. 1129–1155.
Onuma, N., Higuchi, H., Wakita, H., and Nagasawa, H., 1968, Trace element partition between two pyroxenes and the host lava: Earth and Planetary Science Letters, v. 5, p. 47–51.
Parat, F., Dungan, M.A., and Streck, M.J., 2002, Anhydrite, pyrrhotite and sulfur-rich apatite: tracing the sulfur evolution of an Oligocene andesite (Eagle Mountain, CO, USA): Lithos, v. 64, p. 63–75.
Pearce, J.A., Harris, N.B., and Tindle, A.G., 1984, Trace element discrimination diagrams for the tectonic interpretation of granitic rocks: Journal of Petrology, v. 25, no. 4, p. 956–983.
Peccerillo, A., and Taylor, S.R., 1976, Geochemistry of Eocene calc-alkaline volcanic rocks from the Kastamonu area, norhtern Turkey: Contributions to Mineralogy and Petrology, v. 58, no. 1, p. 63–81.
John, D.A., Editors: Ayuso, R.A., Barton, M.D., Blakey, R.J., Bodnar, R.J., Dilles, J.H., Gray, F., Graybeal, F.T., Mars, J.C., McPhee, D.K., Seal, R.R., Taylor,
79
R.D. and Vikre, P.G., 2010, Porphyry copper deposit model, United States Geologic Survey Scientific Investigations Report 5070-B.
Von Quadt, A., Erni, M., Martinek, K., Moll, M., Peytcheva, I., and Heinrich, C.A., 2011, Zircon crystallization and the lifetimes of ore-forming magmatic-hydrothermal systems: Geology, v. 39, no. 8, p. 731-734.
Reid, R.F., Nicholes, J., Kofoed, R., McComb, M., and Sechrist, K.J., 2011, Buffalo Valley gold mine: porphyry copper, gold skarn or distal disseminated precious metal deposit, in Great Basin Evolution and Metallogeny: Geological Society of Nevada 2010 Symposium, Reno, Nevada, p. 637-656.
Ressel, M.W., and Henry, C.D., 2006a, Igneous geology of the Carlin trend, Nevada: Development of the Eocene plutonic complex and significance for Carlin-type gold deposits: Economic Geology, v. 101, no. 2, p. 347–383.
Ressel, M.W., and Henry, C.D., 2006b, Igneous geology of the Carlin trend, Nevada: Development of the Eocene plutonic complex and significance for Carlin-type gold deposits: Economic Geology, v. 101, no. 2, p. 347–383.
Richards, J., 2003, Tectono-magmatic precursors for porphyry Cu-(Mo-Au) deposit formation: Economic Geology, v. 98, no. 8, p. 1515–1533.
Richards, J.P., and Kerrich, R., 2007, Special paper: Adakite-like rocks: their diverse origins and questionable role in metallogenesis: Economic Geology, v. 102, no. 4, p. 537–576.
Ryskamp, E.B., Abbott, J.T., Christiansen, E.H., Keith, J.D., Vervoort, J.D., and Tingey, D.G., 2008, Age and petrogenesis of volcanic and intrusive rocks in the Sulphur Spring Range, central Nevada: Comparisons with ore-associated Eocene magma systems in the Great Basin: Geosphere, v. 4, no. 3, p. 496–519.
Seedorff, E., Dilles, J.H., Proffett, J.M., Einaudi, M.T., Zurcher, L., Stavast, W.J.A., Johnson, D.A., and Barton, M.D., 2005, Porphyry deposits: Characteristics and origin of hypogene features: Economic Geology 100th Anniversary Volume,, p. 251–298.
Sillitoe, R.H., 2010, Porphyry copper systems: Economic Geology, v. 105, no. 1, p. 3–41.
Streck, M.J., and Dilles, J.H., 1998, Sulfur evolution of oxidized arc magmas as recorded in apatite from a porphyry copper batholith: Geology, v. 26, no. 6, p. 523-526.

80
Theodore, T.G., 1978, Copper Canyon porphyry deposits, Lander County, Nevada: Journal of Chemical Exploration, v. 9, no. 2-3, p. 154–160.
Theodore, T.G., 1998, Pluton-related gold in the Battle Mountain mining district-an overview: USGS Open-File Report 98-338, 251–252 p.
Theodore, T.G., Silberman, M.L., and Blake, D.W., 1973, Geochemistry and potassium-argon ages of plutonic rocks in the Battle Mountain mining district, Lander County, Nevada: Geological Survey Professional Paper 798-A.
Tosdal, R.M., Wooden, J.L., and Kistler, R.W., 2000, Geometry of the Neoproterozoic continental break-up, and implications for location of Nevadan mineral belts (J. K. Cluer, J. G. Price, E. M. Struhasker, R. F. Hardyman, & C. L. Morris, Eds.): Geology and Ore Deposits 2000: The Great Basin and Beyond.
Watson, E., and Harrison, T., 2005, Zircon thermometer reveals minimum melting conditions on earliest Earth: Science, v. 308, no. 5723, p. 841-844.
Wilke, M., and Behrens, H., 1999, The dependence of the partitioning of iron and europium between plagioclase and hydrous tonalitic melt on oxygen fugacity: Contributions to Mineralogy and Petrology, v. 137, no. 1, p. 102–114.

81
Appendices

Appendix A.. SHRIMP-RG trace element data, Eu/Eu*, Ce/Ce* and Ce(IV)/Ce(III) for each spot analyzed.
Analyzed SpotLa Ce Nd Sm Eu Gd Dy Er Yb Hf Th U
Eu/Eu*Ce(IV)/
(ppm) (ppm) (ppm) (ppm) (ppm) (ppm) (ppm) (ppm) (ppm) (ppm) (ppm) (ppm) Ce(III)
LF-BM3-1.1R 0.02 11.84 0.33 1.42 0.60 17.7 97.2 230 537 12604 271 2006 0.36 825
LF-BM3-15.1R 0.01 10.51 0.28 0.80 0.45 8.8 46.3 125 332 11801 76 656 0.51 731
LF-BM3-21.1R 0.02 18.89 0.44 1.72 0.95 17.3 95.1 227 579 10882 182 1109 0.53 1317
LF-BM3-21.1R 0.01 12.05 0.23 0.77 0.44 8.5 50.0 125 331 12888 95 781 0.52 839
LF-BM3-23.1R 0.01 10.61 0.29 0.96 0.49 12.1 71.5 185 486 12653 96 972 0.44 739
LF-BM3-25.1R 0.01 20.93 0.41 1.37 0.70 14.9 70.4 156 339 12765 410 1883 0.47 1459
LF-BM3-27.1R 0.05 27.87 0.49 2.09 1.08 28.7 165.2 367 780 12840 340 1553 0.42 1944
LF-BM3-31.1I 0.01 11.75 0.17 0.69 0.44 9.0 54.2 133 364 13073 101 913 0.54 819
LF-BM3-32.1R 0.01 1.05 0.05 0.24 0.13 1.9 7.7 15 35 11657 12 187 0.57 72
LF-BM3-39.1R 0.02 17.91 0.43 1.38 0.64 14.7 78.4 194 484 13104 199 1351 0.43 1248
LF-BM3-40.1R 0.02 12.47 0.18 1.05 0.49 10.7 54.0 137 387 12928 93 771 0.44 869
LF-BM3-41.1R 0.02 19.23 0.21 1.18 0.55 14.5 82.5 232 582 13115 147 1232 0.40 1341
LF-BM3-42.1I 0.01 6.40 0.09 0.51 0.30 6.1 39.0 104 276 13317 75 837 0.51 445
LF-BM3-43.1R 0.02 13.38 0.16 0.94 0.51 11.8 67.6 187 491 13283 108 1006 0.46 932
LF-BM3-6.1R 0.02 23.37 0.32 1.33 0.70 13.8 74.7 179 462 13086 222 1413 0.50 1629
LF-BM3-7.1R 0.02 35.98 0.73 2.14 0.89 21.0 77.1 155 299 11043 336 582 0.40 2511
LF-BM3-7.2C 0.03 48.45 1.33 3.47 1.03 27.1 92.7 172 341 11442 237 500 0.32 3383
LF-BM3-8.1R 0.01 18.18 0.28 1.27 0.56 15.7 94.9 243 614 14035 204 1698 0.38 1267
10788-10.1R 0.02 22.08 0.35 1.28 0.62 14.7 77.4 188 474 12453 197 1326 0.43 2541
10788-11.1R 0.02 7.16 0.32 0.86 0.40 7.9 35.3 80 191 11371 75 332 0.47 822
10788-14.1R 0.01 18.66 0.35 1.15 0.60 13.0 62.2 144 355 12591 328 1533 0.47 2148
10788-15.1R 0.02 18.30 0.21 1.16 0.63 15.4 90.5 251 674 13079 155 1490 0.45 2106
10788-16.1R 0.01 14.00 0.34 1.13 0.61 11.9 61.4 154 384 12120 181 1152 0.51 1610
10788-19.1R 0.03 30.34 0.52 1.65 1.01 19.5 109.4 276 684 11435 219 1282 0.54 3495
10788-2.1I 0.01 9.76 0.12 0.67 0.38 8.6 53.5 146 390 12274 76 795 0.49 1122
10788-2.2C 0.04 11.47 0.26 0.86 0.44 9.3 45.0 111 285 11747 105 570 0.47 1319
82

Analyzed SpotLa Ce Nd Sm Eu Gd Dy Er Yb Hf Th U
Eu/Eu*Ce(IV)/
(ppm) (ppm) (ppm) (ppm) (ppm) (ppm) (ppm) (ppm) (ppm) (ppm) (ppm) (ppm) Ce(III)
10788-20.1R 0.01 10.94 0.21 0.79 0.41 9.1 50.4 133 357 13181 82 686 0.46 1258
10788-23.1R 0.01 7.45 0.28 0.79 0.39 8.2 34.7 78 188 11640 87 341 0.47 856
10788-24.1R 0.01 13.20 0.24 1.11 0.59 11.9 58.5 151 413 13230 91 722 0.49 1517
10788-26.1R 0.02 22.63 0.22 1.14 0.69 15.6 95.5 262 700 14176 181 1385 0.50 2606
10788-26.1R 0.01 10.98 0.32 0.96 0.59 10.8 65.3 165 438 13374 121 1033 0.56 1262
10788-27.1R 0.03 17.55 0.61 1.71 0.70 16.1 78.4 184 416 10671 140 466 0.40 2019
10788-32.1R 0.01 18.05 0.26 1.24 0.70 18.1 117.5 309 783 15345 230 2185 0.45 2077
10788-33.1R 0.02 11.51 0.24 0.94 0.48 11.9 71.0 192 485 12767 109 1039 0.44 1322
10788-35.1R 0.02 17.64 0.65 1.84 1.29 16.6 71.9 155 329 10859 145 360 0.71 2029
10788-36.1R 0.02 3.89 0.11 0.25 0.13 2.2 12.3 27 75 12126 21 101 0.55 446
10788-39.1R 0.02 8.48 0.22 0.71 0.33 7.7 41.0 109 286 12840 65 542 0.43 974
10788-8.1R 0.04 32.84 1.31 3.55 1.84 31.2 146.7 323 752 10863 348 1450 0.53 3785
10788-9.1R 0.01 19.64 0.30 1.16 0.63 13.1 62.7 145 353 12486 305 1468 0.49 2260
12716-10.1R 0.04 20.06 0.46 1.42 0.67 14.1 62.2 138 329 12210 365 1585 0.45 1814
12716-13.1R 0.02 4.62 0.13 0.63 0.31 7.6 45.9 123 322 12636 50 650 0.43 416
12716-14.1R 0.02 77.36 1.10 3.83 2.20 35.2 128.0 211 389 11820 568 876 0.57 7013
12716-16.1R 0.00 10.03 0.21 0.82 0.47 9.6 69.3 182 522 14645 92 1239 0.51 906
12716-16.1R 0.06 15.74 0.35 1.44 0.68 17.6 95.3 233 542 12832 206 1665 0.41 1423
12716-17.1R 0.01 12.46 0.28 1.45 0.83 19.4 126.1 299 699 11589 147 1409 0.48 1126
12716-18.1R 0.01 7.77 0.13 0.65 0.31 8.9 47.3 130 322 13068 61 802 0.39 702
12716-20.1R 0.02 19.20 0.26 1.24 0.61 15.7 81.3 188 463 13396 367 2601 0.42 1736
12716-23.1R 0.01 20.32 0.20 1.18 0.58 15.4 86.7 240 632 13524 169 1672 0.42 1837
12716-28.1R 0.04 68.03 0.95 3.44 1.73 38.3 198.8 458 1051 11703 525 2775 0.46 6164
12716-29.1R 0.03 29.35 0.37 1.51 0.79 19.6 103.3 251 636 12449 327 2519 0.44 2656
12716-31.1R 0.03 29.94 0.55 1.88 1.10 23.8 126.7 303 723 11888 293 2049 0.50 2709
12716-4.1R 0.02 28.56 0.50 2.17 0.75 29.0 160.2 361 803 13245 350 2037 0.29 2584
83

Analyzed SpotLa Ce Nd Sm Eu Gd Dy Er Yb Hf Th U
Eu/Eu*Ce(IV)/
(ppm) (ppm) (ppm) (ppm) (ppm) (ppm) (ppm) (ppm) (ppm) (ppm) (ppm) (ppm) Ce(III)
12716-5.1R 0.02 20.04 0.22 1.18 0.57 14.2 71.1 168 421 13875 283 2186 0.42 1812
12716-7.1R 0.02 18.93 0.24 1.09 0.68 13.9 82.0 217 545 13557 214 1668 0.53 1711
12716-8.1R 0.02 34.66 0.62 2.24 1.25 17.0 73.9 151 340 12579 180 475 0.61 3137
Bu05-1.1R 0.03 14.87 0.92 1.97 1.18 16.7 68.3 135 277 8379 46 128 0.63 163
Bu05-10.1R 0.02 23.72 1.08 2.70 1.59 24.2 100.4 194 390 9057 91 242 0.60 261
Bu05-13.1I 0.03 20.98 0.93 2.21 1.32 21.4 84.9 152 303 8710 234 339 0.58 231
Bu05-14.1R 0.04 23.43 2.48 5.03 2.94 39.1 129.2 213 388 8719 135 215 0.64 258
Bu05-15.1R 0.03 8.13 0.32 0.79 0.14 7.4 42.0 87 207 11901 27 253 0.18 89
Bu05-15.2C 0.05 21.97 1.63 4.83 0.38 41.0 175.1 301 461 10662 74 126 0.08 242
Bu05-2.1I 0.03 36.97 1.07 3.21 2.13 33.4 130.8 238 458 9680 167 294 0.62 408
Bu05-20.1R 0.07 81.27 5.27 11.61 7.28 92.1 303.7 463 798 9302 477 459 0.68 900
BU05-21.1R 0.02 19.72 1.12 2.88 1.75 24.9 96.8 189 382 9014 75 187 0.63 217
Bu05-25.1R 0.02 32.20 1.25 3.16 2.13 30.9 136.5 274 531 9280 133 298 0.65 355
Bu05-32.1R 0.02 28.80 1.35 3.21 2.11 31.4 136.6 265 505 8973 121 267 0.64 317
Bu05-33.1R 0.03 51.68 2.29 6.00 3.69 59.6 232.6 393 693 8979 286 440 0.59 571
Bu05-38.1I 0.03 40.37 1.54 3.95 2.34 40.2 162.1 299 557 9451 175 375 0.56 446
Bu05-40.1I 0.01 15.03 0.96 2.23 1.29 19.6 76.3 146 291 8694 50 129 0.59 165
Bu05-45.1I 0.03 23.55 2.33 4.95 2.61 35.7 115.9 190 337 9291 103 211 0.60 259
Bu05-47.1R 0.03 37.94 2.02 4.90 2.88 43.4 166.3 290 530 9041 186 319 0.60 419
Bu05-7.1I 0.06 33.10 3.57 7.46 3.97 54.1 172.1 284 525 8597 203 329 0.60 365
112C-15.1R 0.02 29.00 0.69 1.96 1.09 21.3 95.1 194 384 11019 92 276 0.51 392
112C-16.1R 0.01 32.58 1.19 3.12 2.00 31.4 129.2 259 525 9935 171 387 0.61 440
112C-20.1R 0.02 13.54 0.67 1.57 1.04 14.4 58.9 123 263 9145 40 119 0.66 182
112C-21.1R 0.02 61.54 1.84 5.47 3.22 53.4 207.4 349 621 9880 242 465 0.57 833
112C-22.1R 0.02 43.57 1.28 3.45 2.13 29.7 134.9 294 597 10692 146 331 0.64 589
84
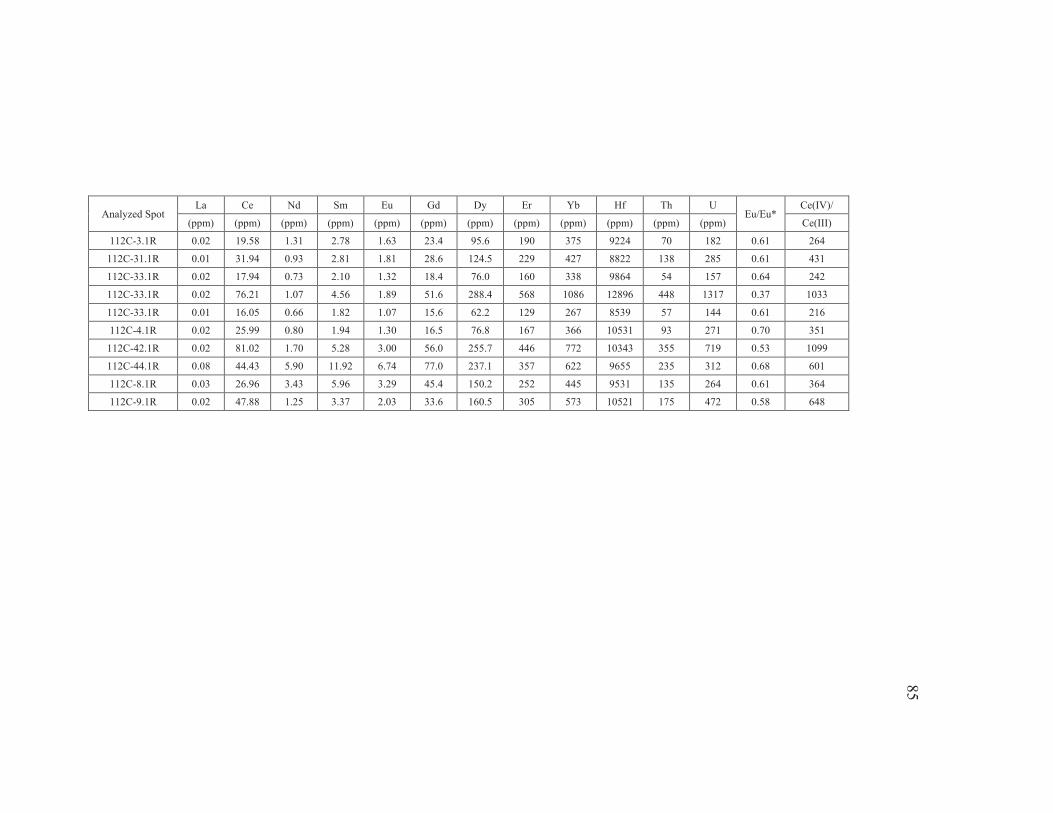
Analyzed SpotLa Ce Nd Sm Eu Gd Dy Er Yb Hf Th U
Eu/Eu*Ce(IV)/
(ppm) (ppm) (ppm) (ppm) (ppm) (ppm) (ppm) (ppm) (ppm) (ppm) (ppm) (ppm) Ce(III)
112C-3.1R 0.02 19.58 1.31 2.78 1.63 23.4 95.6 190 375 9224 70 182 0.61 264
112C-31.1R 0.01 31.94 0.93 2.81 1.81 28.6 124.5 229 427 8822 138 285 0.61 431
112C-33.1R 0.02 17.94 0.73 2.10 1.32 18.4 76.0 160 338 9864 54 157 0.64 242
112C-33.1R 0.02 76.21 1.07 4.56 1.89 51.6 288.4 568 1086 12896 448 1317 0.37 1033
112C-33.1R 0.01 16.05 0.66 1.82 1.07 15.6 62.2 129 267 8539 57 144 0.61 216
112C-4.1R 0.02 25.99 0.80 1.94 1.30 16.5 76.8 167 366 10531 93 271 0.70 351
112C-42.1R 0.02 81.02 1.70 5.28 3.00 56.0 255.7 446 772 10343 355 719 0.53 1099
112C-44.1R 0.08 44.43 5.90 11.92 6.74 77.0 237.1 357 622 9655 235 312 0.68 601
112C-8.1R 0.03 26.96 3.43 5.96 3.29 45.4 150.2 252 445 9531 135 264 0.61 364
112C-9.1R 0.02 47.88 1.25 3.37 2.03 33.6 160.5 305 573 10521 175 472 0.58 648
85

Appendix B. LA-ICPMS trace element data, Eu/Eu*, and Ce(IV)/Ce(III) for each spot analyzed.
Analyzed La Ce Pr Nd Sm Eu Gd Tb Dy Ho Er Tm Yb Hf U ThEu/Eu*
Ce(IV)/
Spot (ppm) (ppm) (ppm) (ppm) (ppm) (ppm) (ppm) (ppm) (ppm) (ppm) (ppm) (ppm) (ppm) (ppm) (ppm) (ppm) Ce(III)
LF-BM-1 0.04 9.60 0.04 0.88 1.86 0.60 9.34 2.85 46 16 84 23 253 11602 457 138 0.44 104
LF-BM-13 0.32 17.54 0.14 1.65 3.79 0.81 15.84 5.28 80 30 161 42 469 12348 1199 321 0.32 191
LF-BM-16 0.06 5.88 0.03 0.70 1.91 0.47 15.72 5.59 92 36 193 49 480 12611 1296 182 0.26 63
LF-BM-18 0.01 3.28 0.10 2.30 4.91 0.94 24.16 8.33 110 41 200 48 475 9861 279 109 0.26 35
LF-BM-19 0.16 42.99 0.69 10.43 14.27 3.46 49.31 13.24 175 53 239 56 506 9677 150 88 0.40 470
LF-BM-2 0.01 14.04 0.05 0.85 3.47 1.00 23.60 10.12 162 65 372 96 1014 11742 1364 259 0.34 153
LF-BM-28 0.03 10.97 0.08 0.93 2.67 0.79 12.33 4.93 61 23 112 29 310 10066 326 129 0.42 119
LF-BM-33 0.07 7.63 0.12 1.14 2.10 0.69 11.59 4.64 79 31 171 45 502 11234 629 160 0.43 82
LF-BM-35 0.08 16.87 0.11 1.07 3.22 1.11 22.83 7.03 115 47 256 74 777 12442 1348 346 0.40 184
LF-BM-44 0.02 8.15 0.06 1.83 3.92 1.22 21.81 8.03 117 43 224 62 679 11476 828 177 0.40 88
LF-BM-52 0.95 8.91 0.10 0.54 2.23 0.58 12.39 4.62 79 32 161 46 520 14065 1062 221 0.34 97
LF-BM-6 0.58 11.18 0.18 1.39 3.40 0.93 19.65 8.53 136 55 320 79 787 12088 987 174 0.35 121
LF-BM-9 0.03 19.01 0.04 1.02 2.05 0.86 12.01 4.82 52 18 75 24 270 12254 316 158 0.53 207
LF-BM-97 0.16 7.33 0.07 0.53 1.66 0.58 15.16 5.85 93 38 204 61 653 12935 713 140 0.35 79
LF-BM-98 0.01 24.03 0.06 0.98 2.68 0.92 14.71 5.63 82 29 151 40 437 10784 339 185 0.45 262
LF-10788-1 0.24 9.84 0.08 0.68 2.07 0.52 8.13 2.64 36 15 74 21 248 12090 270 69 0.39 179
LF-10788-3 0.22 16.47 0.19 1.55 3.05 0.94 15.50 5.04 71 27 131 36 420 11517 727 310 0.42 300
LF-10788-4 0.65 14.16 0.22 1.84 2.72 0.78 14.71 6.02 90 37 191 56 643 12665 1056 178 0.38 258
LF-10788-5 0.01 13.26 0.09 0.86 2.80 0.89 18.31 7.14 103 43 237 66 726 12982 1892 272 0.38 241
LF-10788-8 0.06 19.34 0.10 1.16 3.42 1.02 21.09 8.33 120 49 264 77 909 13369 2090 284 0.37 353
LF-10788-12 0.07 11.17 0.13 1.39 3.24 0.74 15.86 5.89 82 32 154 45 518 10474 793 140 0.31 203
LF-10788-13 0.01 12.03 0.08 0.80 1.84 0.55 10.68 3.97 55 22 120 32 338 13988 742 136 0.38 219
LF-10788-14 1.05 14.39 0.51 3.30 2.90 0.73 14.01 5.82 87 37 202 60 752 14035 1349 155 0.35 262
LF-10788-16 0.03 12.51 0.08 0.62 2.36 0.69 14.93 5.71 89 37 203 60 784 12629 1651 152 0.36 228
LF-10788-19 0.06 13.06 0.10 0.85 2.35 0.72 15.46 5.60 80 33 174 54 643 12227 1434 216 0.36 238
86

Analyzed La Ce Pr Nd Sm Eu Gd Tb Dy Ho Er Tm Yb Hf U ThEu/Eu*
Ce(IV)/
Spot (ppm) (ppm) (ppm) (ppm) (ppm) (ppm) (ppm) (ppm) (ppm) (ppm) (ppm) (ppm) (ppm) (ppm) (ppm) (ppm) Ce(III)
LF-10788-23 0.10 13.08 0.11 0.73 2.55 0.92 16.21 6.02 80 32 165 48 637 11210 1546 193 0.44 238
LF-10788-26 0.03 14.39 0.09 1.02 2.62 0.67 13.00 4.89 68 27 141 41 514 13137 910 160 0.35 262
LF-10788-27 0.18 15.04 0.12 1.11 2.48 0.86 15.37 6.09 88 35 203 61 741 11518 1508 194 0.42 274
LF-10788-28 0.07 13.94 0.06 1.13 2.65 0.89 15.25 6.04 91 33 172 51 618 13311 1245 247 0.43 254
LF-10788-30 0.07 25.83 0.26 2.37 5.65 2.11 43.54 18.47 277 108 556 156 1756 13150 4895 616 0.41 472
LF-10788-31 0.25 12.47 0.11 1.50 2.71 0.75 14.26 5.10 66 25 122 33 388 11955 1266 402 0.37 227
LF-12716-1 0.44 29.65 0.25 2.25 4.63 1.64 34.17 13.99 212 90 479 141 1580 11989 2524 377 0.40 307
LF-12716-3 0.60 15.96 0.23 1.76 2.86 0.80 12.89 4.49 65 26 142 39 461 11939 701 175 0.40 165
LF-12716-5 0.67 11.98 0.32 2.35 2.09 0.74 11.80 4.37 62 25 128 38 425 12285 1223 206 0.45 123
LF-12716-6 1.00 17.37 0.41 3.01 4.50 1.17 28.92 10.91 149 60 291 78 815 11739 1923 561 0.31 179
LF-12716-7 0.01 9.78 0.06 0.76 1.68 0.54 10.93 4.67 70 31 162 49 578 12350 1239 150 0.38 101
LF-12716-13 0.11 16.80 0.06 0.99 2.85 0.83 20.18 7.35 113 50 260 78 887 12593 2001 258 0.34 174
LF-12716-16 0.03 5.10 0.14 1.24 1.54 0.45 8.22 3.14 49 21 102 28 287 9430 334 111 0.39 52
LF-12716-17 0.04 19.83 0.16 1.52 3.33 1.08 22.86 9.23 147 62 341 103 1181 13228 2008 231 0.38 205
LF-12716-18 0.19 2.90 0.24 3.07 5.72 0.68 27.63 7.64 96 33 121 34 310 10256 134 58 0.17 29
LF-12716-19 0.03 12.45 0.15 2.05 6.87 1.66 65.17 24.49 321 118 524 128 1271 10568 1771 454 0.24 128
LF-12716-20 0.07 22.44 0.25 4.17 10.20 1.59 61.46 20.46 271 96 441 107 1025 12105 1687 377 0.19 232
LF-12716-21 0.57 16.54 0.23 1.77 2.96 0.88 16.25 5.61 84 31 164 46 517 11522 1628 409 0.39 171
LF-13114-2 0.13 5.04 0.23 1.00 3.39 1.03 15.09 5.51 75 28 137 37 372 11535 1040 95 0.44 93
LF-13114-3 0.67 16.76 0.26 1.51 4.11 1.12 20.73 8.60 129 54 293 92 972 14146 2317 285 0.37 312
LF-13114-4 0.47 10.73 0.30 1.74 2.77 0.94 15.11 6.04 74 32 156 49 551 13566 1097 94 0.44 199
LF-13114-6 0.14 12.09 0.16 0.85 2.19 0.81 14.35 5.63 84 37 205 60 712 13744 1627 143 0.44 225
LF-13114-9 1.37 19.93 0.28 2.30 6.68 1.48 26.07 10.21 126 51 263 78 896 13500 3457 497 0.34 371
LF-13114-10 0.09 18.96 0.14 0.95 3.64 0.96 26.48 11.36 165 68 344 96 1085 14020 2975 474 0.30 353
LF-13114-11 0.07 8.52 0.08 0.98 2.99 0.80 17.44 6.48 96 38 207 59 639 13966 1531 217 0.34 158 87

Analyzed La Ce Pr Nd Sm Eu Gd Tb Dy Ho Er Tm Yb Hf U ThEu/Eu*
Ce(IV)/
Spot (ppm) (ppm) (ppm) (ppm) (ppm) (ppm) (ppm) (ppm) (ppm) (ppm) (ppm) (ppm) (ppm) (ppm) (ppm) (ppm) Ce(III)
LF-13114-12 0.40 20.47 0.25 1.65 2.87 0.99 19.03 7.64 106 44 242 70 798 13583 2366 331 0.41 381
LF-13114-13 0.06 14.75 0.12 1.56 2.90 0.92 15.80 5.77 76 31 159 45 525 11367 991 242 0.42 274
LF-13114-16 0.04 13.98 0.09 0.86 2.43 0.68 16.46 5.48 78 30 151 43 485 12589 1317 261 0.33 260
LF-12171-2 0.16 6.91 0.04 0.96 1.45 0.46 10.09 4.51 84 39 234 77 944 17582 2903 98 0.37 112
LF-12171-3 0.07 14.11 0.05 0.81 2.56 0.73 16.97 6.71 104 43 228 67 729 13298 2114 363 0.34 229
LF-12171-5 0.06 20.66 0.11 1.02 3.35 1.10 23.64 9.47 138 61 317 94 1032 11923 1658 246 0.38 336
LF-12171-8 0.31 21.65 0.31 2.31 3.42 1.13 20.37 8.28 117 46 235 71 788 12699 1825 386 0.42 352
LF-12171-9 0.21 7.86 0.16 0.78 1.20 0.39 8.94 3.93 64 27 137 42 531 15334 1517 131 0.37 127
LF-12171-10 0.77 20.14 0.33 2.90 3.57 1.02 20.11 7.79 125 50 282 83 929 11849 1385 222 0.37 328
LF-12171-11 0.52 12.75 0.28 2.39 4.55 1.29 22.84 7.27 99 38 197 55 615 11492 990 245 0.39 207
LF-12171-14 0.40 17.88 0.18 1.42 3.23 1.03 27.42 10.80 178 75 412 117 1281 15079 2836 365 0.33 291
LF-CB2-5 0.09 9.87 0.05 0.63 2.52 0.77 16.45 6.69 105 43 232 72 909 14913 1131 219 0.37 174
LF-CB2-8 0.88 12.40 0.32 2.32 2.92 0.95 15.51 5.56 83 33 153 49 583 11970 649 281 0.43 219
LF-CB2-11 0.10 15.56 0.07 0.96 3.35 1.18 22.34 10.06 162 69 363 116 1439 14159 1634 273 0.42 276
LF-CB2-15 0.01 9.84 0.04 0.94 2.40 0.67 13.07 4.91 61 23 125 37 438 13272 539 211 0.36 174
LF-CB2-17 0.82 11.75 0.26 2.00 3.03 0.87 15.42 5.73 79 30 150 44 528 13270 715 247 0.39 208
LF-CB2-18 1.29 18.79 0.43 3.46 3.78 1.11 24.50 9.43 141 56 298 90 1055 14735 1671 366 0.35 333
LF-CB2-19 0.39 15.16 0.15 1.15 3.14 0.97 21.04 8.43 121 50 263 80 977 14165 1751 335 0.37 269
LF-CB2-20 0.04 10.98 0.03 0.64 2.27 0.73 13.95 5.42 77 31 155 46 554 12655 973 297 0.40 194
LF-CB2-22 0.01 3.66 0.01 0.20 0.80 0.24 6.45 2.52 40 17 96 30 381 16472 621 59 0.32 64
LF-CB2-23 0.08 9.56 0.06 0.87 2.37 0.67 12.67 4.51 67 25 130 38 456 13673 874 270 0.37 169
LF-CB2-36 0.02 14.21 0.03 0.74 3.23 0.91 18.21 7.20 102 41 215 63 779 14174 1383 334 0.36 252
LF-CB2-38 0.18 9.80 0.33 5.68 9.66 3.25 33.44 9.84 127 46 217 62 730 9942 342 207 0.55 173
LF-CB2-39 0.02 5.44 0.03 0.89 3.33 0.71 15.16 5.73 105 42 219 64 763 14027 802 152 0.30 96
LF-CB2-40 0.02 25.76 0.23 5.29 12.39 4.79 57.09 17.83 228 80 367 99 1141 9376 1027 748 0.55 457
88

Analyzed La Ce Pr Nd Sm Eu Gd Tb Dy Ho Er Tm Yb Hf U ThEu/Eu*
Ce(IV)/
Spot (ppm) (ppm) (ppm) (ppm) (ppm) (ppm) (ppm) (ppm) (ppm) (ppm) (ppm) (ppm) (ppm) (ppm) (ppm) (ppm) Ce(III)
LF-CB3-1 0.06 6.71 0.01 0.43 1.57 0.58 13.37 5.54 85 36 196 60 740 14722 1105 170 0.39 203
LF-CB3-2 0.01 0.79 0.01 0.22 1.49 0.11 14.43 6.78 108 40 205 57 650 17382 447 39 0.07 23LF-CB3-3 0.01 9.56 0.03 0.65 2.57 0.78 16.77 6.12 91 40 214 67 796 13002 647 151 0.37 290LF-CB3-4 0.02 7.64 0.03 0.51 2.17 0.62 13.06 4.82 74 30 171 49 572 11788 709 170 0.36 232LF-CB3-6 0.02 11.10 0.04 1.03 3.89 1.39 25.24 9.67 143 56 283 78 885 14402 1038 293 0.43 337LF-CB3-12 0.01 8.12 0.03 0.43 1.89 0.58 12.90 5.72 92 37 202 60 731 16789 1250 197 0.36 246
LF-CB3-14 0.37 12.20 0.14 1.38 2.97 0.83 16.66 5.78 82 32 162 48 583 13200 614 243 0.36 371
LF-CB3-24 0.48 13.34 0.20 1.97 3.47 1.05 20.55 8.73 127 52 319 97 1193 15196 1005 190 0.38 406
LF-CB3-27 0.23 2.95 0.15 2.55 9.97 0.26 55.62 18.73 234 80 363 92 917 13994 696 187 0.03 89
LF-CB3-16 0.01 11.11 0.04 0.82 2.60 0.87 17.21 6.81 97 40 213 66 787 13315 954 265 0.40 338
LF-CB6-1 0.00 9.42 0.01 0.42 2.03 0.72 13.04 5.53 91 37 204 65 883 11225 1139 111 0.43 404
LF-CB6-2 0.00 14.21 0.03 0.52 3.09 1.07 19.43 7.79 115 46 245 74 905 11776 2186 376 0.42 610
LF-CB6-3 0.08 9.77 0.06 0.62 1.98 0.73 13.28 6.17 91 43 216 68 900 10588 1187 116 0.43 419
LF-CB6-5 0.11 9.48 0.07 0.75 2.09 0.69 14.43 6.16 98 42 229 71 949 11844 1226 127 0.38 406
LF-CB6-6 0.08 13.78 0.06 0.81 2.84 1.04 18.08 7.66 118 50 274 84 1084 11085 1562 195 0.45 591
LF-CB6-9 0.14 12.60 0.06 0.84 2.73 0.94 18.12 7.34 115 47 255 79 975 12451 1807 227 0.41 541
LF-CB6-10 0.05 10.55 0.05 0.62 2.14 0.86 14.72 6.34 98 42 237 74 933 11965 1287 143 0.47 452
LF-CB6-11 0.16 13.15 0.10 1.00 2.34 0.81 15.90 6.18 92 38 207 62 828 11418 1773 239 0.40 564
LF-CB6-13 0.00 9.20 0.01 0.40 1.82 0.73 14.65 6.01 94 40 228 71 920 10995 1068 118 0.43 394
LF-CB6-14 0.01 6.82 0.01 0.27 1.44 0.54 11.34 4.55 72 32 174 55 673 11587 851 111 0.40 292
LF-CB6-15 0.13 9.60 0.07 0.75 2.10 0.68 12.96 5.06 82 35 181 58 680 10989 716 121 0.40 412
LF-CB6-18 1.14 14.88 0.51 3.32 3.15 0.90 18.83 7.72 120 52 280 87 1036 11729 1357 182 0.36 638
LF-CB6-20 0.01 12.46 0.02 0.50 2.40 0.75 15.93 6.50 96 41 216 64 793 11350 1169 208 0.37 535
LF-CB6-21 0.03 16.84 0.03 0.80 3.28 1.27 20.62 8.18 127 55 302 95 1182 10907 1457 214 0.47 723
LF-CB6-22 0.16 9.33 0.08 0.63 1.79 0.64 12.23 4.74 75 32 178 54 665 12343 1038 124 0.42 400
LF-CB6-25 0.07 10.20 0.05 0.86 2.09 0.73 14.62 5.79 90 39 216 66 801 10788 1120 140 0.41 438
89
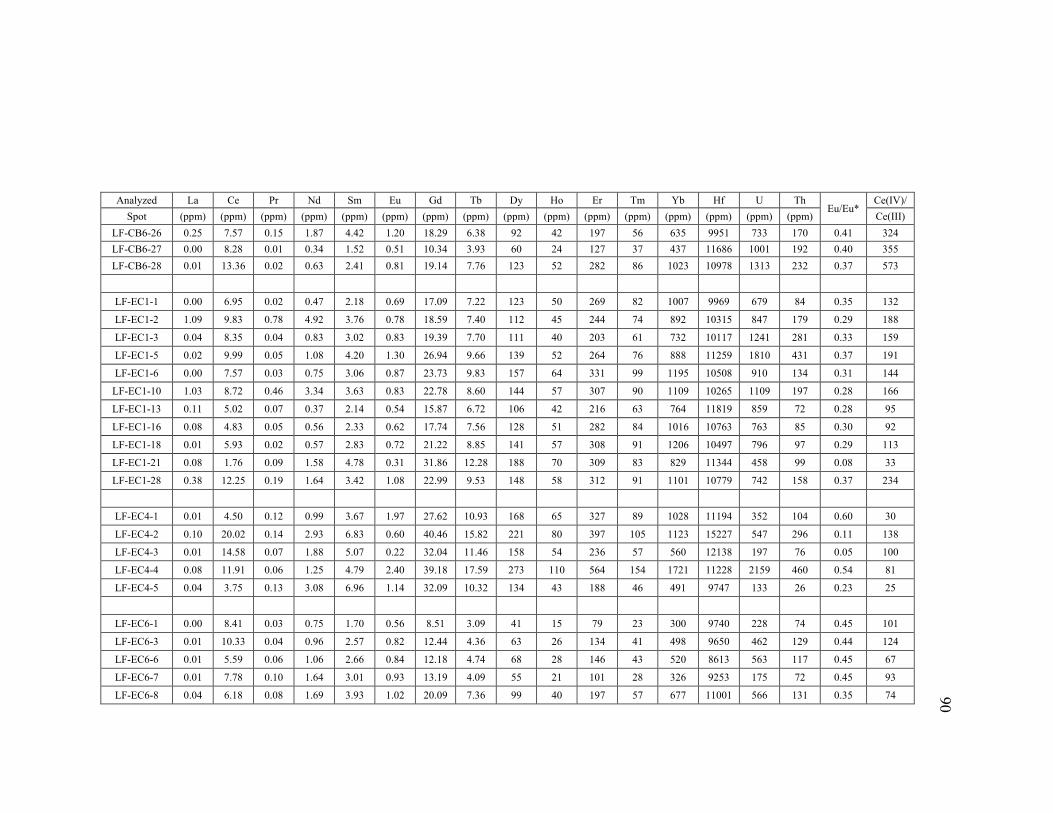
Analyzed La Ce Pr Nd Sm Eu Gd Tb Dy Ho Er Tm Yb Hf U ThEu/Eu*
Ce(IV)/Spot (ppm) (ppm) (ppm) (ppm) (ppm) (ppm) (ppm) (ppm) (ppm) (ppm) (ppm) (ppm) (ppm) (ppm) (ppm) (ppm) Ce(III)
LF-CB6-26 0.25 7.57 0.15 1.87 4.42 1.20 18.29 6.38 92 42 197 56 635 9951 733 170 0.41 324LF-CB6-27 0.00 8.28 0.01 0.34 1.52 0.51 10.34 3.93 60 24 127 37 437 11686 1001 192 0.40 355LF-CB6-28 0.01 13.36 0.02 0.63 2.41 0.81 19.14 7.76 123 52 282 86 1023 10978 1313 232 0.37 573
LF-EC1-1 0.00 6.95 0.02 0.47 2.18 0.69 17.09 7.22 123 50 269 82 1007 9969 679 84 0.35 132
LF-EC1-2 1.09 9.83 0.78 4.92 3.76 0.78 18.59 7.40 112 45 244 74 892 10315 847 179 0.29 188
LF-EC1-3 0.04 8.35 0.04 0.83 3.02 0.83 19.39 7.70 111 40 203 61 732 10117 1241 281 0.33 159
LF-EC1-5 0.02 9.99 0.05 1.08 4.20 1.30 26.94 9.66 139 52 264 76 888 11259 1810 431 0.37 191
LF-EC1-6 0.00 7.57 0.03 0.75 3.06 0.87 23.73 9.83 157 64 331 99 1195 10508 910 134 0.31 144
LF-EC1-10 1.03 8.72 0.46 3.34 3.63 0.83 22.78 8.60 144 57 307 90 1109 10265 1109 197 0.28 166
LF-EC1-13 0.11 5.02 0.07 0.37 2.14 0.54 15.87 6.72 106 42 216 63 764 11819 859 72 0.28 95
LF-EC1-16 0.08 4.83 0.05 0.56 2.33 0.62 17.74 7.56 128 51 282 84 1016 10763 763 85 0.30 92
LF-EC1-18 0.01 5.93 0.02 0.57 2.83 0.72 21.22 8.85 141 57 308 91 1206 10497 796 97 0.29 113
LF-EC1-21 0.08 1.76 0.09 1.58 4.78 0.31 31.86 12.28 188 70 309 83 829 11344 458 99 0.08 33
LF-EC1-28 0.38 12.25 0.19 1.64 3.42 1.08 22.99 9.53 148 58 312 91 1101 10779 742 158 0.37 234
LF-EC4-1 0.01 4.50 0.12 0.99 3.67 1.97 27.62 10.93 168 65 327 89 1028 11194 352 104 0.60 30
LF-EC4-2 0.10 20.02 0.14 2.93 6.83 0.60 40.46 15.82 221 80 397 105 1123 15227 547 296 0.11 138
LF-EC4-3 0.01 14.58 0.07 1.88 5.07 0.22 32.04 11.46 158 54 236 57 560 12138 197 76 0.05 100
LF-EC4-4 0.08 11.91 0.06 1.25 4.79 2.40 39.18 17.59 273 110 564 154 1721 11228 2159 460 0.54 81
LF-EC4-5 0.04 3.75 0.13 3.08 6.96 1.14 32.09 10.32 134 43 188 46 491 9747 133 26 0.23 25
LF-EC6-1 0.00 8.41 0.03 0.75 1.70 0.56 8.51 3.09 41 15 79 23 300 9740 228 74 0.45 101
LF-EC6-3 0.01 10.33 0.04 0.96 2.57 0.82 12.44 4.36 63 26 134 41 498 9650 462 129 0.44 124
LF-EC6-6 0.01 5.59 0.06 1.06 2.66 0.84 12.18 4.74 68 28 146 43 520 8613 563 117 0.45 67
LF-EC6-7 0.01 7.78 0.10 1.64 3.01 0.93 13.19 4.09 55 21 101 28 326 9253 175 72 0.45 93
LF-EC6-8 0.04 6.18 0.08 1.69 3.93 1.02 20.09 7.36 99 40 197 57 677 11001 566 131 0.35 74 90

Analyzed La Ce Pr Nd Sm Eu Gd Tb Dy Ho Er Tm Yb Hf U ThEu/Eu*
Ce(IV)/
Spot (ppm) (ppm) (ppm) (ppm) (ppm) (ppm) (ppm) (ppm) (ppm) (ppm) (ppm) (ppm) (ppm) (ppm) (ppm) (ppm) Ce(III)
LF-EC6-11 0.34 26.17 0.22 3.35 7.92 2.57 40.01 12.75 169 62 300 82 935 9307 1011 526 0.44 317
LF-EC6-20 0.34 7.13 0.12 1.20 2.07 0.71 8.91 2.95 38 15 75 22 238 8552 170 73 0.50 86
LF-EC6-22 0.09 12.43 0.06 1.01 2.57 0.68 13.06 4.99 68 27 140 39 488 10642 664 204 0.36 150
LF-EC6-26 0.04 7.10 0.03 0.65 1.44 0.45 8.97 3.05 42 17 85 25 298 10618 220 78 0.38 85
LF-EC6-28 0.07 11.52 0.08 1.82 4.21 1.33 23.76 9.61 136 52 260 72 840 9469 883 278 0.41 139
LF-EC6-12 0.18 35.12 0.06 1.35 3.85 1.39 19.39 6.81 91 33 162 45 510 9235 458 374 0.49 426
LF-BU05-1 0.01 12.22 0.08 2.09 4.94 1.78 23.86 8.05 112 42 197 52 567 11002 126 72 0.50 30
LF-BU05-2 0.03 54.83 0.32 8.10 20.18 7.57 105.45 32.98 417 144 628 148 1413 11050 429 587 0.50 140
LF-BU05-7 0.17 28.08 0.49 8.79 17.10 5.88 69.75 21.63 251 85 361 89 844 9565 266 257 0.52 71
LF-BU05-10 0.35 22.12 0.27 5.22 12.38 4.27 53.17 16.90 217 80 362 83 739 11443 236 304 0.51 56
LF-BU05-13 0.01 101.11 0.39 8.93 24.69 8.82 132.28 43.24 551 190 820 194 1864 10963 893 1289 0.47 259
LF-BU05-14 0.12 15.61 0.14 2.62 5.95 2.12 31.97 10.66 142 55 275 63 675 11841 162 114 0.47 39
LF-BU05-20 0.06 45.26 0.50 10.14 20.58 8.12 91.15 27.06 328 110 474 115 1203 10390 337 435 0.57 115
LF-BU05-21 0.02 14.15 0.11 2.55 5.51 2.06 28.69 10.17 139 50 246 66 703 9725 137 94 0.50 35
LF-BU05-25 0.02 23.78 0.12 2.39 6.77 2.65 37.86 13.44 186 69 322 84 899 10738 255 174 0.51 60
LF-BU05-32 0.03 20.51 0.15 3.03 7.23 2.96 41.80 13.95 192 72 329 82 903 10583 223 164 0.52 52
LF-BU05-38 0.03 26.40 0.24 4.88 11.94 4.12 48.40 16.32 209 75 339 83 927 10927 314 221 0.52 67
LF-BU05-40 0.02 9.79 0.12 2.44 5.27 2.04 23.80 7.53 99 35 161 42 476 10250 106 55 0.56 24
LF-BU05-45 1.21 28.40 0.71 10.26 13.06 4.24 59.28 18.59 228 77 336 83 842 11071 492 291 0.47 72
LF-BU05-19 0.02 18.79 0.12 2.61 6.83 2.58 39.01 12.62 166 60 273 67 678 11311 181 141 0.48 47
LF-112C-3 0.01 17.09 0.07 2.09 4.90 1.85 24.69 8.62 119 44 201 56 594 10844 187 100 0.51 77
LF-112C-4 0.00 19.05 0.07 1.86 4.34 1.82 22.81 8.08 114 45 224 62 715 11444 234 121 0.56 86
LF-112C-9 1.12 44.87 0.47 5.08 9.49 3.24 48.50 17.30 236 87 392 100 1166 11312 477 241 0.46 205
LF-112C-15 0.01 24.36 0.09 1.86 5.18 2.07 31.16 11.38 155 58 279 71 779 12032 268 143 0.50 111
LF-112C-16 0.08 46.12 0.67 13.64 25.48 8.90 109.03 32.29 386 131 577 134 1414 10329 611 462 0.52 211
91

Analyzed La Ce Pr Nd Sm Eu Gd Tb Dy Ho Er Tm Yb Hf U ThEu/Eu*
Ce(IV)/
Spot (ppm) (ppm) (ppm) (ppm) (ppm) (ppm) (ppm) (ppm) (ppm) (ppm) (ppm) (ppm) (ppm) (ppm) (ppm) (ppm) Ce(III)
LF-112C-21 0.05 41.96 0.13 2.99 9.05 3.21 51.06 17.77 239 86 391 97 1071 11758 463 252 0.46 192
LF-112C-22 0.01 39.61 0.18 3.58 8.91 3.87 54.88 19.18 260 95 438 112 1235 11159 326 265 0.53 181
LF-112C-31 0.47 25.11 0.24 3.41 7.01 2.60 37.92 13.43 188 68 316 81 837 11082 242 174 0.49 114
LF-112C-33 0.01 10.86 0.08 1.64 3.87 1.44 19.05 6.29 91 35 168 46 518 11106 122 55 0.51 49
LF-112C-43 0.01 25.16 0.06 1.38 4.12 1.69 23.49 9.04 129 51 250 69 772 12406 342 148 0.53 115
LF-112C-36 0.01 21.67 0.08 2.04 5.46 2.17 31.01 11.01 158 59 275 72 760 11262 232 143 0.51 98
LF-112C-38 2.38 29.54 0.86 7.66 9.44 3.18 46.07 15.83 206 74 341 86 876 12977 322 208 0.47 135
LF-BD-1 0.40 7.65 0.19 2.13 4.05 0.95 29.20 10.93 171 63 293 77 769 8485 199 54 0.27 21
LF-BD-8 0.08 9.28 0.31 5.65 8.31 2.78 33.18 7.70 106 34 130 37 400 7577 112 105 0.51 26
LF-BD-17 0.04 12.08 0.08 1.08 1.91 0.70 9.07 3.06 43 16 70 22 248 10183 321 136 0.51 34
LF-BD-24 1.09 25.09 0.69 5.53 6.02 0.49 33.57 12.25 218 76 314 91 1012 10186 974 304 0.10 72
LF-BD-26 0.81 15.67 0.49 3.61 4.87 0.88 31.86 12.86 189 69 309 89 979 10948 886 273 0.22 44
LF-BD-27 0.04 11.54 0.05 0.64 2.61 0.82 13.52 5.19 85 30 135 42 462 10519 416 142 0.42 32
LF-BD-7 0.96 9.00 0.28 0.62 2.19 0.27 6.46 1.80 23 9 43 11 137 8192 110 29 0.22 25
LF-BD-8 0.13 15.24 0.48 5.65 8.95 3.71 37.41 10.76 115 39 180 44 449 5850 210 165 0.62 43
LF-BD-9 0.18 11.89 0.53 6.27 12.77 2.99 41.21 11.78 128 44 200 48 460 6127 217 146 0.40 34
LF-BD-16 2.28 23.90 0.80 3.43 3.52 0.79 16.97 5.93 76 34 157 38 417 8483 969 270 0.31 68
LF-BD-17 0.37 6.95 0.19 2.22 6.30 1.49 32.90 9.75 100 34 157 38 369 8735 247 115 0.32 19
LF-BD-18 0.04 13.95 0.09 2.24 5.66 1.46 22.40 6.92 80 29 141 36 344 8250 286 132 0.40 39
LF-BD-21 0.51 16.73 0.67 4.90 7.37 2.66 32.31 11.85 142 55 259 64 650 9710 1296 372 0.53 48
92
