trac earnings mgt presentation intermodal quarter ended ... cash flow are not measures recognized...
TRANSCRIPT

TRAC Intermodal Quarter Ended September 30, 2015
Earnings Release – November 5, 2015

Copyright 2015 TRAC Intermodal
Forward Looking Statements and Use of Non-GAAP Information
FORWARD LOOKING STATEMENTS
• This Presentation contains certain “forward-looking statements” within the meaning of the Private Securities Litigation Reform Act of 1995, which
reflect our current views with respect to, among other things, future events (including, but not limited to, import container growth, chassis supply
trends and the shift to the motor carrier model) and financial performance. Readers can identify these forward-looking statements by the use of
forward-looking words such as “outlook,” “believes,” “expects,” “potential,” “continues,” “may,” “will,” “should,” “seeks,” “approximately,” “predicts,”
“intends,” “plans,” “estimates,” “anticipates”, “projects”, “likely”, “would” or the negative version of those words or other comparable words. Any
forward-looking statements contained in the Presentation are based upon our historical performance and on our current plans, estimates and
expectations. The inclusion of this forward-looking information should not be regarded as a representation by us or any other person that the future
plans, estimates or expectations contemplated by us will be achieved. Such forward-looking statements are subject to various risks, uncertainties
and assumptions relating to our operations, financial results, financial condition, business prospects, growth strategy and liquidity. If one or more of
these or other risks or uncertainties materialize, or if our underlying assumptions prove to be incorrect, our actual results may vary materially from
those indicated in these statements. Accordingly, you should not place undue reliance on any forward-looking statements.
• Important factors that could cause actual results to differ materially from those in the forward-looking statements include, without limitation, the
following: the volume of world trade due to economic, political, or other factors; increased operating costs; increased regulatory costs; defaults by our
customers; third-party strikes; and, the demand for chassis. More information about potential factors that could affect our business and financial
results is included in our filings with the SEC, including our Annual Report on Form 10-K, Quarterly Reports on Form 10-Q and Current Reports on
Form 8-K.
• The Company undertakes no obligation to update the forward-looking information or any of the information contained in this Presentation.
USE OF NON-GAAP INFORMATION
• There are non-GAAP measures used in this Presentation, including Adjusted EBITDA, Adjusted net income (loss) and free cash flow. The Company
believes that such non-GAAP measures are appropriate measures of the operating performance of the Company. Additionally, certain of the
Company’s debt covenant calculations use Adjusted EBITDA. The Company’s calculation of these measures may differ from the methodology used
by other companies and, accordingly, may not be comparable to other companies. Adjusted EBITDA is defined as income (loss) before income
taxes, interest expense, depreciation and amortization expense, impairment of assets and leasing equipment, early retirement of leasing equipment,
loss on modification and extinguishment of debt and capital lease obligations, other expense (income), interest income, non-cash share-based
compensation and principal collections on direct finance leases. Adjusted net income (loss) is defined as net income (loss) before non-cash interest
expense related to deferred financing fees, non-cash share-based compensation, loss on modification and extinguishment of debt and capital lease
obligations, terminations, modification, and fair value adjustments of derivative instruments and other non-routine, non-cash items as determined by
management. Free cash flow is defined as Adjusted EBITDA less Cash Interest Accrued. Adjusted EBITDA, Adjusted net income (loss) and free
cash flow are not measures recognized under GAAP and are therefore unlikely to be comparable to similar measures presented by other companies
and do not have a standardized meaning prescribed by GAAP. Management uses Adjusted EBITDA, Adjusted net income (loss) and free cash flow
to provide comparative information about performance. A reconciliation of Adjusted EBITDA, Adjusted net income (loss) and free cash flow to net
income (loss) is provided on slide 15. A reconciliation of segment Adjusted EBITDA is provided on the slide 16.
2

Copyright 2015 TRAC Intermodal
• Revenue of $177.2 million, an increase of $10.1 million or 6% in Q3 2015 vs. Q3 2014
• Adjusted EBITDA¹ of $55.8 million, higher by $6.5 million or 13% in Q3 2015 vs. Q3 2014
• Free cash flow¹ increased to $43.0 million in Q3 2015 vs. $34.0 million in Q3 2014
• Leverage ratio reduced from 5.8x in Q4 2014 to 4.8x in Q3 2015; Q3 2014 was 6.2x
Executive Summary – Q3 2015
3
Financial
Performance
• Average on-hire fleet increased by approximately 7,300 chassis or 3% in Q3 2015 vs. Q3 2014
− Increase in average fleet driven primarily by the acquisition of Domestic remanufactured
chassis
• Active fleet utilization of 95.9% at September 30, 2015 versus 94.8% at September 30, 2014
• Facilitating shipping line’s conversion to the motor carrier model for chassis provisioning
− Over 3,500 active motor carriers using TRAC Connect
− Continued expansion through new pool agreements and customers
• Executing cost controls and in-sourcing select operational activities
Chassis Fleet
Key Initiatives
1 See slide 15 for a reconciliation of Adjusted EBITDA and free cash flow to net income (loss)

Copyright 2015 TRAC Intermodal
Summary of Financial Performance – Q3 2015
• Revenues grew $10.1 million in Q3 2015 vs. Q3 2014
− Marine Market segment revenues grew 6%
− Domestic Market segment revenues grew 6%
• Adjusted EBITDA¹ increased $6.5 million in Q3 2015 vs. Q3 2014
− Marine Market segment Adjusted EBITDA² increased 13%
− Domestic Market segment Adjusted EBITDA² increased 11%
4
Summary Income Statement -Quarter ended September 30th
1 See slide 15 for a reconciliation of Adjusted EBITDA and Adjusted Net Income to net income (loss)
2 See slide 16 for a reconciliation of segment Adjusted EBITDA to net income
Summary Income Statement –Nine months ended September 30th
NM – not meaningful as either 2014 or 2015 was a negative number
$ millions B / (W) vs. 2014 B / (W) vs. 2014
2015 $ % 2015 $ %
Revenue 177.2$ 10.1$ 6% 523.6$ 64.4$ 14%
Direct operating expenses 98.7 (4.3) -5% 283.6 (39.4) -16%
All other expenses 79.0 (13.4) -20% 208.2 24.2 10%
Net income before tax (0.5) (7.6) NM 31.8 49.2 NM
Net income (loss) (1.2)$ (7.4)$ NM 18.6$ 28.7$ NM
Adjusted EBITDA¹ 55.8$ 6.5$ 13% 173.1$ 27.0$ 19%
Adjusted net income¹ 12.8$ 3.0$ 30% 41.4$ 17.4$ 73%

Copyright 2015 TRAC Intermodal
Containers
International Domestic Total
2014 Q1 1.1% 2.9% 1.9%
2014 Q2 9.6% 7.9% 8.8%
2014 Q3 4.7% 7.1% 5.7%
2014 - FY 4.4% 5.8% 5.0%
2015 Q1 0.6% 7.9% 3.8%
2015 Q2 6.8% 3.5% 5.4%
2015 Q3 4.9% 3.0% 4.1%
2015 - FY 4.7% 4.5% 4.6%
Market Review – Q3 2015
5
• U.S. port containerized loaded imports were up 5.8% YTD 2015 vs. YTD 2014
– 2015 annual growth of U.S. port container imports is expected to be 6.6%, according to the Journal of Commerce
• Total U.S. intermodal rail volumes grew 4.1% in Q3 2015 vs. Q3 2014 - comprised of a 4.9% increase in international
volumes and 3.0% increase in domestic volumes, according to FTR
– 2015 annual growth of U.S. international rail volume growth is expected to be 4.7% and domestic volume growth
is projected at 4.5%, according to FTR
U.S. Intermodal Rail Load Growth
Source: FTR (Intermodal volume in loads October 2015)
1
1 Domestic container loads, excludes intermodal trailer loads
U.S. Port Containerized Loaded Imports
Source: Ports / Bloomberg (October 2015)
YTD 2015 Growth 5.8%
TEU Volume and Year-Over-Year Percent Change
0.0%
1.0%
2.0%
3.0%
4.0%
5.0%
6.0%
7.0%
8.0%
9.0%
3.4
3.6
3.8
4.0
4.2
4.4
4.6
4.8
2014 Q1 2014 Q2 2014 Q3 2014 Q4 2015 Q1 2015 Q2 2015 Q3
Total Loaded Import TEUs - U.S. Quarterly YoY Growth
Mil
lio
ns o
f T
EU
s
Ye
ar-
Ove
r-Y
ea
r P
erc
en
t C
ha
ng
e

Copyright 2015 TRAC Intermodal
Revenue Drivers – Marine and Domestic Market Segments
6
¹ Per Diem Revenue in $ thousands - represents revenues billed under operating leases and excludes amounts billed to lessees for maintenance and repair, positioning and handling,
and other ancillary charges
² Average Total Fleet in units - based upon the total fleet at each month end
³ Excludes early termination revenue
• Revenue growth is primarily driven by our Marine and Domestic neutral chassis pools
− Q3 2015 vs. Q3 2014, Marine Pool per diem revenue grew by 8% and the Domestic Pool per diem revenue
grew by 7%
• Marine chassis customers have continued to shift from term leases to pool rentals
Key Metrics – Q3 Key Metrics – YTD
2014 2015 Variance % Change 2014 2015 Variance % Change
Marine Market segment
Pool Statistics
Per Diem Revenue ¹ $106,151 $114,915 $ 8,764 8% $275,990 $340,351 $64,361 23%
Average Total Fleet ² 145,930 151,384 5,454 4% 139,749 149,268 9,519 7%
Average Daily Revenue per Chassis $7.91 $8.25 $0.34 4% $7.23 $8.35 $1.12 15%
Term Lease Statistics
Per Diem Revenue $ 9,896 $ 9,656 $ (240) -2% $ 29,416 $ 28,121 $ (1,295) -4%
Average Total Fleet 35,523 33,209 (2,314) -7% 38,875 33,727 (5,148) -13%
Average Daily Revenue per Chassis $3.03 $3.16 $0.13 4% $2.77 $3.05 $0.28 10%
Domestic Market segment
Pool Statistics
Per Diem Revenue ¹ $ 38,722 $ 41,416 $ 2,694 7% $111,274 $119,719 $ 8,445 8%
Average Total Fleet ² 61,171 65,441 4,270 7% 60,647 65,215 4,568 8%
Average Daily Revenue per Chassis $6.88 $6.88 $0.00 0% $6.72 $6.72 $0.00 0%
Term Lease Statistics
Per Diem Revenue $ 4,075 $ 4,028 $ (47) -1% $ 13,247 $ 11,951 $ (1,296) -10%
Average Total Fleet 12,387 12,313 (74) -1% 12,573 12,299 (274) -2%
Average Daily Revenue per Chassis $3.58 $3.56 ($0.02) -1% $3.53 ³ $3.56 $0.03 1%

Copyright 2015 TRAC Intermodal
$43.0
$52.2
$61.9
$39.2
$44.6
$55.4
$36.4
$49.3
$55.8
$44.4
$54.8
$25
$30
$35
$40
$45
$50
$55
$60
$65
Q113
Q114
Q115
Q213
Q214
Q215
Q313
Q314
Q315
Q413
Q414
Quarterly Revenue and Adjusted EBITDA Trends
• Chassis pool revenue growth driven by both rate, mix and volume contributions in Q3 2015
− 6% revenue growth in Q3 2015 vs. Q3 2014
− Marine pool per diem revenues attributed to motor carriers grew to 55% in Q3 2015 vs. 54% in Q3 2014
• Adjusted EBITDA¹ growth driven by revenue growth partially offset by higher costs principally from increased pool usage
and average fleet
− 13% Adjusted EBITDA¹ growth in Q3 2015 vs. Q3 2014
7
Quarterly Revenue
($ millions)
Quarterly Adjusted EBITDA¹
($ millions)
1 See slide 15 for a reconciliation of Adjusted EBITDA to net income
$117.9
$139.7
$168.8
$127.0
$152.4
$177.6
$134.2
$167.1
$177.2
$136.1
$167.8
$100
$110
$120
$130
$140
$150
$160
$170
$180
Q113
Q114
Q115
Q213
Q214
Q215
Q313
Q314
Q315
Q413
Q414

Copyright 2015 TRAC Intermodal
YTD Sept 30,
Q3 '14 Q3 '15 2014 2015
Adjusted EBITDA¹ 49.3$ 55.8$ 146.1$ 173.1$
Cash Interest Expense² (15.3) (12.8) (46.5) (42.4)
Free Cash Flow¹ 34.0$ 43.0$ 99.6$ 130.7$
YTD Sept 30,
Q3 '14 Q3 '15 2014 2015
Domestic Chassis 6.9$ 5.3$ 8.9$ 16.6$
Marine Chassis 11.2 16.4 105.1 21.8
Purchase of Leasing
Assets 18.1$ 21.7$ 114.0$ 38.4$
Capital Expenditures
Capital Expenditures and Free Cash Flow
• Invested $21.7 million of capital for chassis in Q3 2015
− Domestic chassis capital for the remanufacture of units
− Marine chassis capital for the purchase of shipping line chassis and the refurbishment of units
• $43.0 million of free cash flow¹ generated in Q3 2015
− Ahead of 2014 cash generation pace
− Fleet maintenance spending is captured in the income statement
− Reduced cash interest expense due to overall lower debt levels, maturity of higher interest rate capital leases and the
partial redemption of higher interest rate bonds
8
($ millions)
Free Cash Flow²
($ millions)
2 Cash Interest Expense excludes non-cash interest expense items, including deferred financing fees and interest rate swap termination deferred charges. Bond interest which is paid Q1 and
Q3 is accrued in Cash Interest Expense.
1 See slide 15 for a reconciliation of Adjusted EBITDA and Free Cash Flow to net income (loss)

Copyright 2015 TRAC Intermodal
9/30/2014 12/31/2014 9/30/2015
ABL Facility Size 1,030.0$ 1,250.0$ 1,300.0$
Max. Available Assets (85% x Eligible Assets) 1,123.7 1,168.6 1,162.2
Excess Availability 276.0 409.6 307.7
Cash 5.3$ 4.3$ 2.2$
Cash Rate Maturity
ABL Facility Libor + 225 Aug '17 754.0 759.0 854.5
Capital Leases 4.8% Various 127.8 105.2 81.5
2nd Lien Notes 11.0% Aug '19 300.0 300.0 150.0
Total Debt 4.1% 1,181.8$ 1,164.2$ 1,086.0$
Member's Interest ² 521.0$ 530.4$ 556.6$
Total Debt and Equity 1,702.8$ 1,694.6$ 1,642.6$
LTM Adjusted EBITDA³ 190.5 200.9 228.0
Total Debt / LTM Adj. EBITDA 6.2x 5.8x 4.8x
Capital Structure • Leverage ratio reduced to 4.8x at Q3 2015 from 6.2x at Q3 2014
• Total debt decreased by $95.8 million at 9/30/2015 vs. 9/30/2014 and by $78.2 million vs. 2014 year end
− In compliance with all covenants across the ABL Facility, Capital Leases and Notes
• On August 17th 2015, redeemed $150 million of the $300 million in outstanding 2nd Lien Notes
• Amendment #3 to the ABL Credit Agreement executed August 11, 2015: Commitment increased $1.3 billion and Payment
Conditions definition change
9
Capital Structure
¹ Weighted cash interest rate at 9/30/2015 – includes cash impact of interest rate swap and unused fees
² Member’s interest is the equivalent of shareholder’s equity for LLC entities
³ See slide 15 for a reconciliation of Adjusted EBITDA to net income
($ millions)

Copyright 2015 TRAC Intermodal
For More Information
10
Investor Relations:
Blake Morris
+1 609.986.0270
TRAC Intermodal LLC,
750 College Rd East,
Princeton, NJ, 08540
www.tracintermodal.com
+1 609.452.8900
TRAC Intermodal is the world’s largest provider of
marine and domestic chassis, measured by total assets,
operating throughout the United States, Canada and
Mexico. TRAC Intermodal provides short term rentals
through an extensive chassis pool network, long term
chassis leasing and pool/fleet management through the
utilization of its proprietary PoolStat® information
management system. TRAC Intermodal’s active fleet
consists of approximately 278,000 chassis. TRAC
Intermodal has a broad operating footprint with 591
marine, 159 domestic and 53 depot locations across
North America and is the leader in providing chassis
solutions to the intermodal industry.

Copyright 2015 TRAC Intermodal
Appendix
11

Copyright 2015 TRAC Intermodal
2014 2015 Variance 2014 2015 Variance
Revenues:
Equipment leasing revenue 158,844$ 170,015$ 7% 429,928$ 500,142$ 16%
Finance revenue 495 404 -18% 1,651 1,199 -27%
Other revenue 7,758 6,780 -13% 27,596 22,226 -20%
Total revenues 167,097$ 177,199$ 6% 459,175$ 523,567$ 14%
Expenses:
Direct operating expense 94,385$ 98,679$ -5% 244,201$ 283,599$ -16%
Selling, general and administrative expenses 21,293 23,741 -12% 62,406 68,029 -9%
Depreciation expense 18,942 18,017 5% 54,219 53,832 1%
Other expense, net 4,345 1,375 68% 13,262 6,773 49%
Interest expense, net 21,074 19,715 7% 64,618 63,317 2%
Loss on modification and extinquishment of debt and
capital lease obligatiions- 16,173 NM 102 16,212 NM
Early retirement of leasing equipment - - NM 37,766 - NM
Total expenses 160,039 177,700 -11% 476,574 491,762 -3%
Income (loss) before provision for income taxes 7,058$ (501)$ NM (17,399)$ 31,805$ NM
Provision for income taxes 896 737 18% (7,290) 13,171 NM
Net income (loss) 6,162$ (1,238)$ NM (10,109)$ 18,634$ NM
Adjusted EBITDA¹
EBITDA 47,840$ 54,911$ 15% 141,872$ 169,900$ 20%
Plus: DFL collections 1,227 761 -38% 3,586 2,771 -23%
Plus: Non-cash stock compensation 218 117 -46% 654 466 -29%
Adjusted EBITDA¹ 49,285$ 55,789$ 13% 146,112$ 173,137$ 19%
Adjusted net income¹ 9,794$ 12,764$ 30% 23,929$ 41,369$ 73%
Three months ended September 30, Nine months ended September 30,
Income Statement
12
Consolidated Income Statement
¹ See slide 15 for a reconciliation of Adjusted EBITDA and Adjusted Net Income to net income (loss)
Unaudited – Quarter ended and nine months ended numbers for 2014 and 2015
($ thousands)

Copyright 2015 TRAC Intermodal
December 31, September 30,
2014 2015
Assets
Cash and cash equivalents 4,256$ 2,299$
Accounts receivable, net 135,076 122,017
Net investment in direct finance leases 16,215 13,689
Leasing equipment, net 1,436,909 1,410,132
Goodwill 251,907 251,907
Other assets 41,954 43,139
Total assets 1,886,317$ 1,843,183$
Liabilities and member's interest
Accounts payable and accrued expenses 89,230$ 80,081$
Deferred income taxes, net 102,467 120,556
Debt and capital lease obligations:
Current portion 30,546 36,058
Non-current portion 1,133,676 1,049,911
Total debt and capital lease obligations 1,164,222 1,085,969
Total liabilities 1,355,919 1,286,606
Member's interest
Member's interest 559,015 578,115
Accumulated other comprehensive loss (28,617) (21,538)
Total member's interest 530,398 556,577
Total liabilities and member's interest 1,886,317$ 1,843,183$
Balance Sheet
13
Consolidated Balance Sheet
($ thousands)
Unaudited – September 30, 2015
Copyright 2015 TRAC Intermodal
Three months ended September 30, Nine months ended September 30,
2014 2015 2014 2015
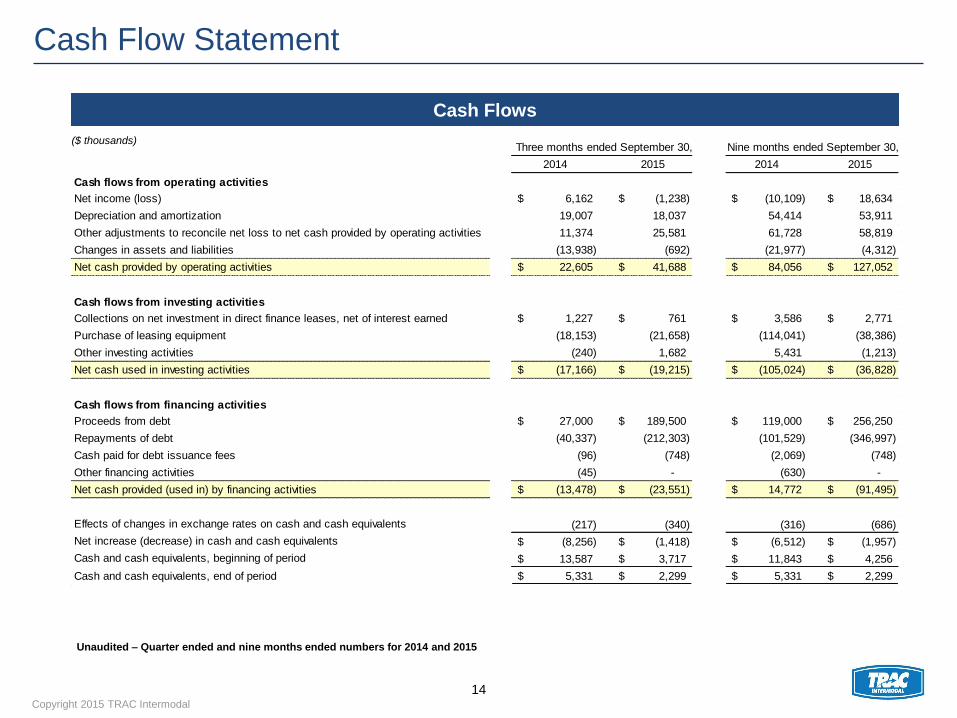
Cash flows from operating activities
Net income (loss) 6,162$ (1,238)$ (10,109)$ 18,634$
Depreciation and amortization 19,007 18,037 54,414 53,911
Other adjustments to reconcile net loss to net cash provided by operating activities 11,374 25,581 61,728 58,819
Changes in assets and liabilities (13,938) (692) (21,977) (4,312)
Net cash provided by operating activities 22,605$ 41,688$ 84,056$ 127,052$
Cash flows from investing activities
Collections on net investment in direct finance leases, net of interest earned 1,227$ 761$ 3,586$ 2,771$
Purchase of leasing equipment (18,153) (21,658) (114,041) (38,386)
Other investing activities (240) 1,682 5,431 (1,213)
Net cash used in investing activities (17,166)$ (19,215)$ (105,024)$ (36,828)$
Cash flows from financing activities
Proceeds from debt 27,000$ 189,500$ 119,000$ 256,250$
Repayments of debt (40,337) (212,303) (101,529) (346,997)
Cash paid for debt issuance fees (96) (748) (2,069) (748)
Other financing activities (45) - (630) -
Net cash provided (used in) by financing activities (13,478)$ (23,551)$ 14,772$ (91,495)$
Effects of changes in exchange rates on cash and cash equivalents (217) (340) (316) (686)
Net increase (decrease) in cash and cash equivalents (8,256)$ (1,418)$ (6,512)$ (1,957)$
Cash and cash equivalents, beginning of period 13,587$ 3,717$ 11,843$ 4,256$
Cash and cash equivalents, end of period 5,331$ 2,299$ 5,331$ 2,299$
Cash Flow Statement
14
Cash Flows
Unaudited – Quarter ended and nine months ended numbers for 2014 and 2015
($ thousands)

Copyright 2015 TRAC Intermodal
Q1 2013 Q2 2013 Q3 2013 Q4 2013 Q1 2014 Q2 2014 Q3 2014 Q4 2014 Q1 2015 Q2 2015 Q3 2015
Net income (loss) (435)$ (1,233)$ (6,324)$ (21,361)$ 5,474$ (21,745)$ 6,162$ 7,153$ 12,161$ 7,711$ (1,238)$
Income tax (benefit) expense (315) (821) (1,273) 20,563 3,856 (12,042) 896 3,845 7,380 5,054 737
Interest expense 22,722 22,688 22,926 22,749 22,216 21,375 21,079 22,167 22,097 21,506 19,715
Depreciation expense 17,274 17,689 18,161 18,667 18,504 16,773 18,942 17,895 17,901 17,914 18,017
Impairment of leasing equipment 2,133 431 1,065 2,228 1,126 1,191 932 2,606 1,433 2,569 1,693
Early retirement of leasing equipment - - - - - 37,766 - - - - -
Loss on retirement of debt 647 248 6 3 22 80 - 213 39 - 16,173
Other income, net (798) (1,192) 94 (178) (382) (135) (166) (242) (554) (221) (186)
Interest income (2) (269) (15) (1) (24) (23) (5) (9) (1) - -
Non-cash share-based compensation 281 252 340 308 218 218 218 156 247 102 117
Principal collections on direct finance leases, net of interest earned 1,460 1,401 1,401 1,444 1,187 1,172 1,227 1,036 1,225 785 761
Adjusted EBITDA 42,967$ 39,194$ 36,381$ 44,422$ 52,197$ 44,630$ 49,285$ 54,820$ 61,928$ 55,420$ 55,789$
Cash interest accrued (15,986) (16,181) (16,437) (16,158) (16,000) (15,217) (15,245) (15,155) (14,891) (14,665) (12,850)
Free cash flows 26,981$ 23,013$ 19,944$ 28,264$ 36,197$ 29,413$ 34,040$ 39,665$ 47,037$ 40,755$ 42,939$
Net income (loss) (435)$ (1,233)$ (6,324)$ (21,361)$ 5,474$ (21,745)$ 6,162$ 7,153$ 12,161$ 7,711$ (1,238)$
Non-cash interest expense, net of tax 951 943 980 982 978 1,075 1,069 1,086 1,112 1,097 1,053
Non-cash stock compensation, net of tax 169 151 204 185 131 130 131 94 148 61 71
Loss on modification and extinguishment of debt and capital leases,
net of tax 3,518 3,144 2,951 2,868 2,765 2,667 2,432 3,248 3,262 3,053 12,816
Non-cash tax expense - capital gain on related party stock distribution - - - 22,105 - - - - - - -
Early retirement of leasing equipment - - - - - 22,660 - - - - -
Other - - - - - - - - - - 62
Adjusted Net Income (loss) 4,203$ 3,005$ (2,189)$ 4,779$ 9,348$ 4,787$ 9,794$ 11,581$ 16,683$ 11,922$ 12,764$
Reconciliation of Non GAAP Measures
15
Adjusted EBITDA, Adjusted Net Income and
Free Cash Flow Reconciliation
($ thousands)
Note - Adjusted EBITDA, Free cash flows and Adjusted Net Income are not U.S. GAAP measures, see note on page 2
Unaudited – Quarter ending numbers

Copyright 2015 TRAC Intermodal
Three Months
Ended
September 30,
Three Months
Ended
September 30,
Three Months
Ended
September 30,
Three Months
Ended
September 30,
2014 2015 2014 2015
Consolidated Statement of Operations Data:
Marine Market segment $ 120,162 $ 127,744 $ 7,582 $ 32,806 $ 36,949 $ 4,143
Domestic Market segment 44,812 47,497 2,685 23,581 26,191 2,610
Total Reportable segments $ 164,974 $ 175,241 $ 10,267 $ 56,387 $ 63,140 $ 6,753
Other 2,123 1,958 (165) (7,102) (7,351) (249)
Total Company $ 167,097 $ 177,199 $ 10,102 $ 49,285 $ 55,789 $ 6,504
Principal collections on direct finance leases (1,227) (761)
Non-cash share-based compensation (218) (117)
Depreciation expense (18,942) (18,017)
Impairment of leasing equipment (932) (1,693)
Loss on modification and extinguishment of debt and
capital lease obligations - (16,173)
Interest expense (21,079) (19,715)
Other income, net 166 186
Interest income 5 -
Income before provision for income taxes 7,058 (501)
Provision / (benefit) for income taxes 896 737
Net income / (loss) $ 6,162 $ (1,238)
Revenues Adjusted EBITDA
Variance Variance
Reconciliation of Non GAAP Measures – Segments
16
Segment Adjusted EBITDA Reconciliation
($ thousands)
Note - Adjusted EBITDA is not a U.S. GAAP measure, see note on page 2
Unaudited – Quarter ending numbers

Copyright 2015 TRAC Intermodal
Fleet Composition
17
Total Fleet by Lease Type
At September 30, 2015
Units NBV of owned fleet % of on-
# of units % of total $ millions % of total hire fleet
Term lease 45,498 15% 223.6$ 16% 17%
Direct finance lease 3,948 1% 13.7 1% 1%
Marine chassis pool 150,573 48% 618.8 43% 57%
Domestic chassis pool 66,172 21% 426.2 30% 25%
On-hire fleet 266,191 85% 1,282.3 90% 100%
Available fleet 11,350 4% 48.1 3%
Active fleet 277,541 89% 1,330.4 93%
Units available for remac 35,726 11% 93.4 7%
Total fleet 313,267 100% 1,423.8$ 100%