tqm
TRANSCRIPT
UNIT- 4

WHAT IS QUALITY?????Quality is the ability of a product or serviceto consistently meet or exceed customer
Expectations.
“The degree of excellence of a thing”(Webster’s Dictionary)

DIMENSIONS OF QUALITY1. Performance - characteristics of the product or service2. Aesthetics- appearance, feel, smell, taste3. Special features - extra characteristics4. Conformance - customer’s expectations5. Safety - risk of injury or harm6. Reliability - consistency of performance7. Durability - useful life of the product or service8. Perception - reputation9. Service after the sale - handling of complaints,
customer satisfaction
THE DETERMINANTS OF QUALITY Quality of Design - intention of
designers to include or exclude features in a product or service designed to meet a customer/client need/want/requirement.- it represents the inherent value of the product or service in the marketplace
Poor design can result in manufacturing or service problems
• Customer disapproval
CONT…. Quality conformance - the degree to
which the goods or services conform to the intent of the designers
• Requires customer education/awareness as to the intended use of the product/service (e.g. Electrical requirements, medication instructions, attorney advice)
Ease of use Service after delivery

FITNESS FOR CONSUMER USE

BENEFITS OF QUALITY Higher customer satisfaction Reliable products/services Better efficiency of operations More productivity & profit Better morale of work force Less wastage costs Less Inspection costs Improved process More market share Spread of happiness & prosperity Better quality of life for all.
COSTS OF QUALITY When considering the “costs of quality” we must consider:
Failure costs - costs caused by defective parts, products, or faulty services
. Internal - failures discovered during production (e.g. rework, problems, material/product losses, downtime)
. External - failures discovered after delivery (e.g. warranty, returned goods, liability claims, penalties)
Appraisal costs - costs of activities designed to ensure quality or uncover defects (e.g. in-line inspection, final inspection, field testing, crash test dummies, crumpled cars)
Prevention costs - costs of preventing defects from occurring (e.g. training, working with vendors, quality control procedures, quality improvement programs, extra attention in design and production)

DEMING’S 14 POINTS Create constancy of purpose Adopt philosophy of prevention Cease dependence on inspection Do not award business based on price tag alone Constantly improve system and workers Institute worker training Adopt and institute leadership

CONT….. Eliminate fear among employees Eliminate barriers between departments Eliminate slogans, exhortations, and targets Remove numerical quotas Enhance worker pride Institute vigorous training & education programs Take action to accomplish the
transformation

THE PDCA CYCLE
DoCheck
Act Plan
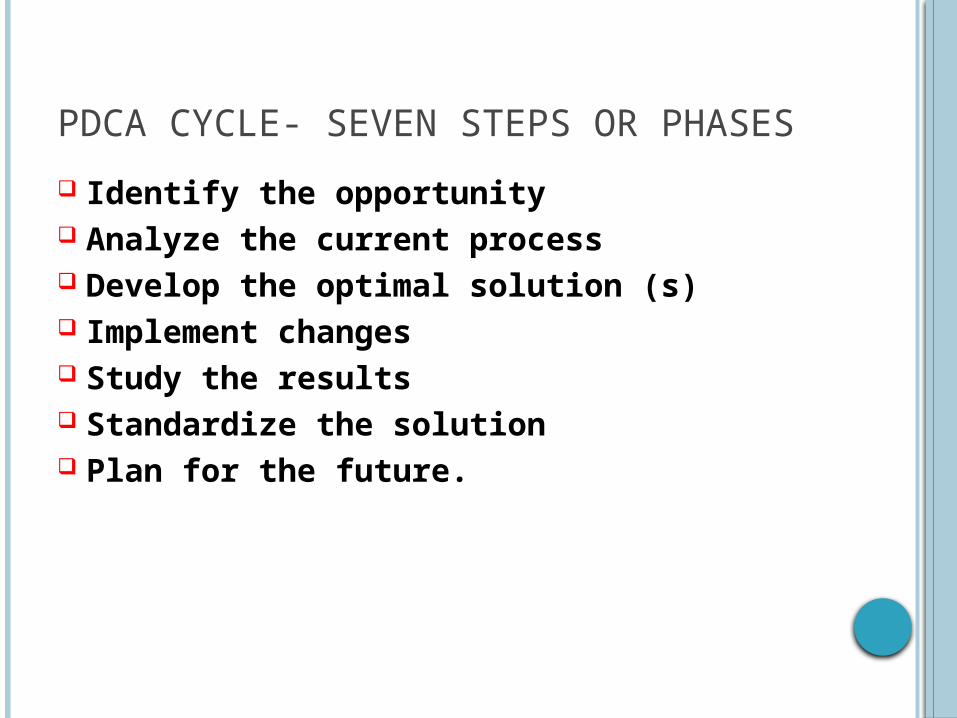
PDCA CYCLE- SEVEN STEPS OR PHASES Identify the opportunity Analyze the current process Develop the optimal solution (s) Implement changes Study the results Standardize the solution Plan for the future.
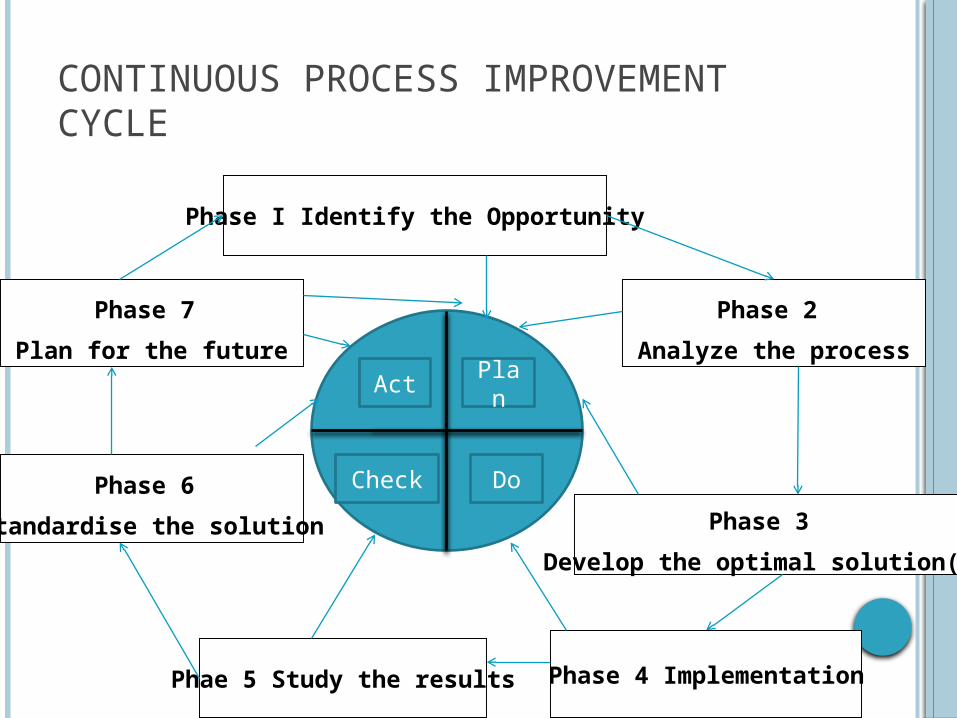
CONTINUOUS PROCESS IMPROVEMENT CYCLE
Phase I Identify the Opportunity
Phase 2 Analyze the process
Phase 3 Develop the optimal solution(s)
Phase 4 ImplementationPhae 5 Study the results
Phase 7 Plan for the future
Phase 6 Standardise the solution
Act Plan
Check Do

QUALITY CIRCLE Voluntary groups of employees who work on similar
tasks or share an area of responsibility
They agree to meet on a regular basis to discuss & solve
problems related to work.
They operate on the principle that employee
participation in decision-making and problem-solving
improves the quality of work
OBJECTIVES OF QC Change in Attitude Self development Development of self spirit Improved organizational culture
STRUCTURE OF QUALITY CIRCLEA steering committee
Co-ordinator
Facilitator
Circle leader
Circle members
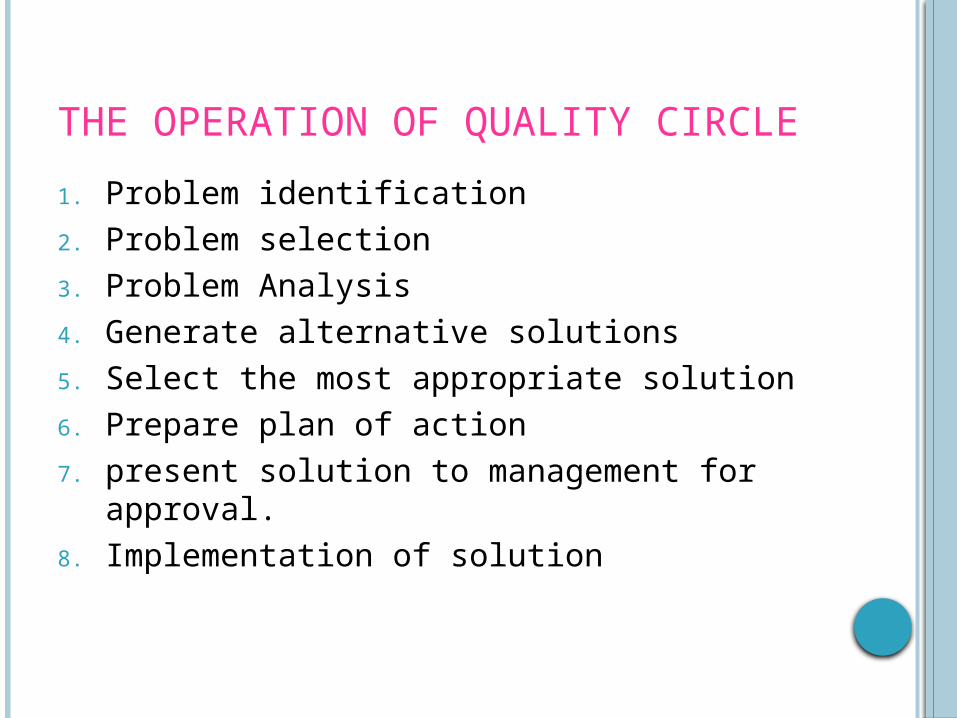
THE OPERATION OF QUALITY CIRCLE1. Problem identification2. Problem selection3. Problem Analysis 4. Generate alternative solutions5. Select the most appropriate solution6. Prepare plan of action 7. present solution to management for
approval.8. Implementation of solution

BASIC PROBLEM SOLVING TECHNIQUES/ 7QC TOOLS
The following techniques are most commonly used to analyse and solve work related problems.
o Pareto chartHistogram Flow diagramCheck sheetScatter diagramControl chart
Run chartCause and effect diagram
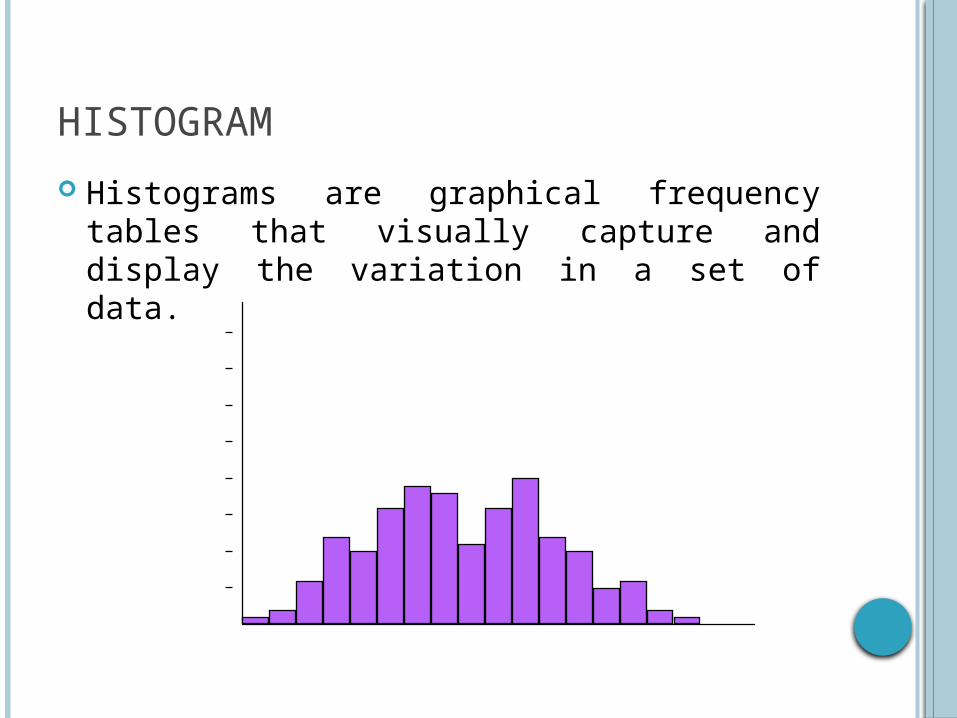
HISTOGRAM Histograms are graphical frequency tables
that visually capture and display the variation in a set of data.
05
10152025303540
1 2 6 13 10 16 19 17 12 16 20 17 13 5 6 2 1

PARETO CHART
28
1612 12
64 3
0
5
10
15
20
25
30
LooseThreads
Stitchingflaws
Buttonproblems
Materialflaws

FLOWCHART A flowchart diagrams the steps in a process. Flowcharts help problem solvers better
understand the process so they can highlight quality problems.

FLOWCHART
CHECK SHEET A check sheet is a fact-finding tool used to
collect data about quality problems. A typical check sheet tallies the number of defects by previously identified categories. The next step is to graph the defects per category in a histogram.

CHECK SHEET
Shifts
Defe
ct Ty
pe
CHECK SHEET
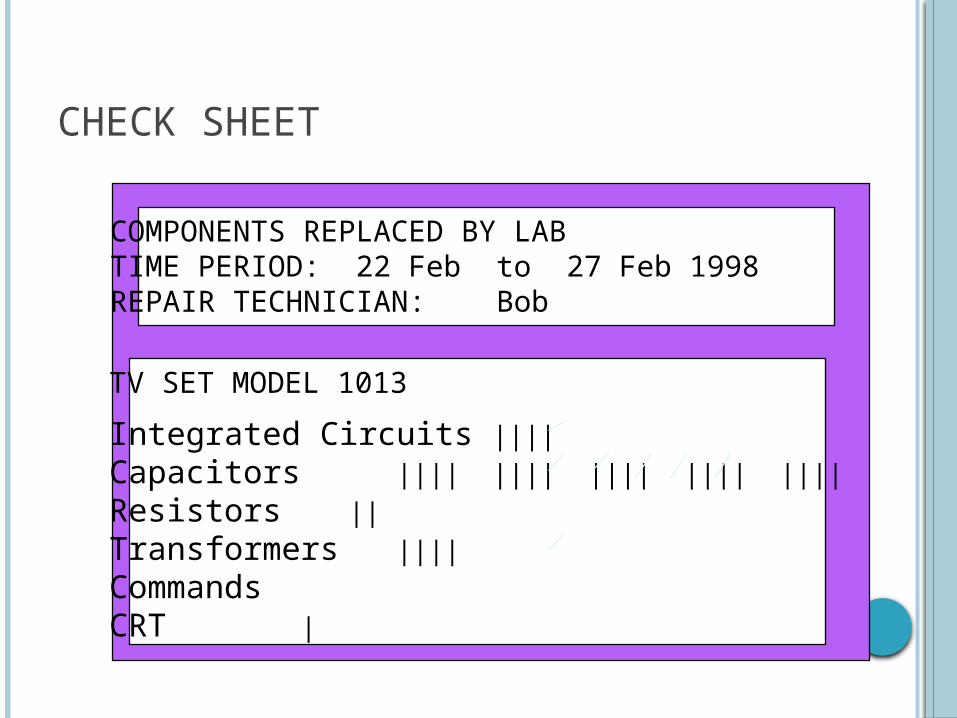
COMPONENTS REPLACED BY LABTIME PERIOD: 22 Feb to 27 Feb 1998REPAIR TECHNICIAN: Bob
TV SET MODEL 1013Integrated Circuits ||||Capacitors |||| |||| |||| |||| ||||Resistors ||Transformers ||||CommandsCRT |
CAUSE-AND-EFFECT DIAGRAMS Show the relationships between a problem
and its possible causes.

CAUSE AND EFFECT “SKELETON”
QualityProblem
Materials
EquipmentPeople
Procedures
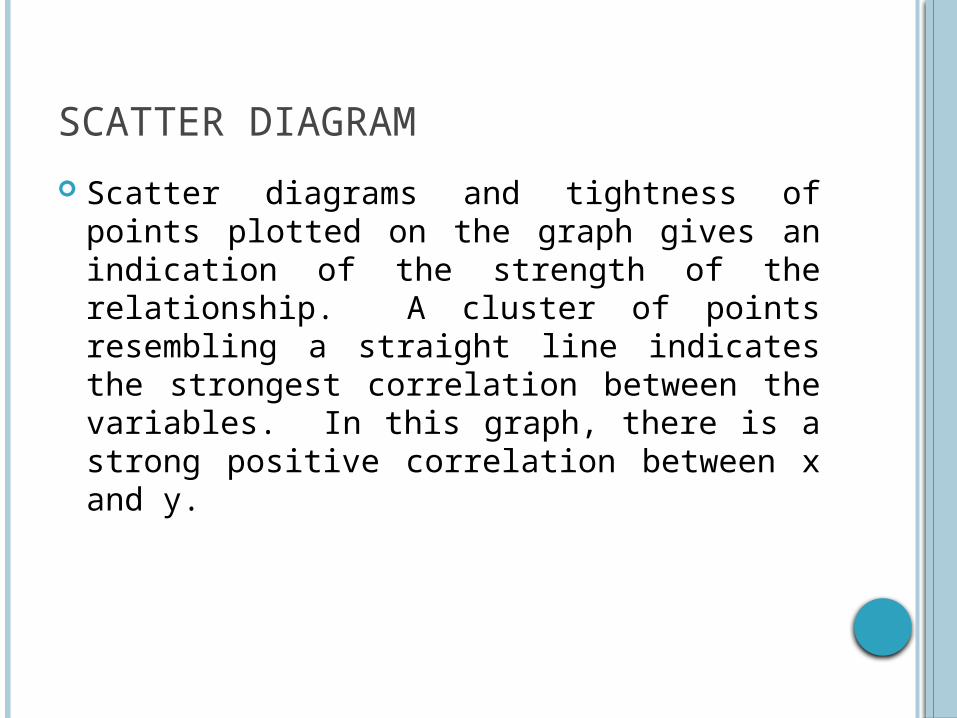
SCATTER DIAGRAM Scatter diagrams and tightness of points
plotted on the graph gives an indication of the strength of the relationship. A cluster of points resembling a straight line indicates the strongest correlation between the variables. In this graph, there is a strong positive correlation between x and y.

SCATTER DIAGRAM
.
NEW SEVEN Q.C. TOOLS
Affinity Diagrams Relations Diagrams Tree Diagrams Matrix Diagrams Arrow Diagrams Process Decision Program Charts Matrix Data Analysis

AFFINITY DIAGRAMS Affinity diagram is a tool that gather
large amount of language data( ideas, opinions, issues) and organises them into grouping based on their natural relationships.

CONSTRUCTING AN AFFINITY DIAGRAM GROUP METHOD APPROACH Select a topic Collect verbal data by brainstorming Discuss info collected until everyone
understands it thoroughly Write each item on separate data card Spread out all cards on table Move data cards into groups of similar
themes

CONT… Combine statements on data cards to
new Affinity statement Make new card with Affinity statement Continue to combine until less than 5
groups

RELATIONS DIAGRAMS For Finding Solutions Strategies by
Clarifying Relationships with Complex Interrelated Causes
Resolves tangled issues by unraveling the logical connection
Allows for “Multi-directional” thinking rather than linear
Also known as Interrelationship diagrams
CONSTRUCTING A RELATIONS DIAGRAM
Express the problem in form of “Why isn’t something happening?”
Each member lists 5 causes affecting problem
Write each item on a card Discuss info collected until everyone
understands it thoroughly Move cards into similar groups
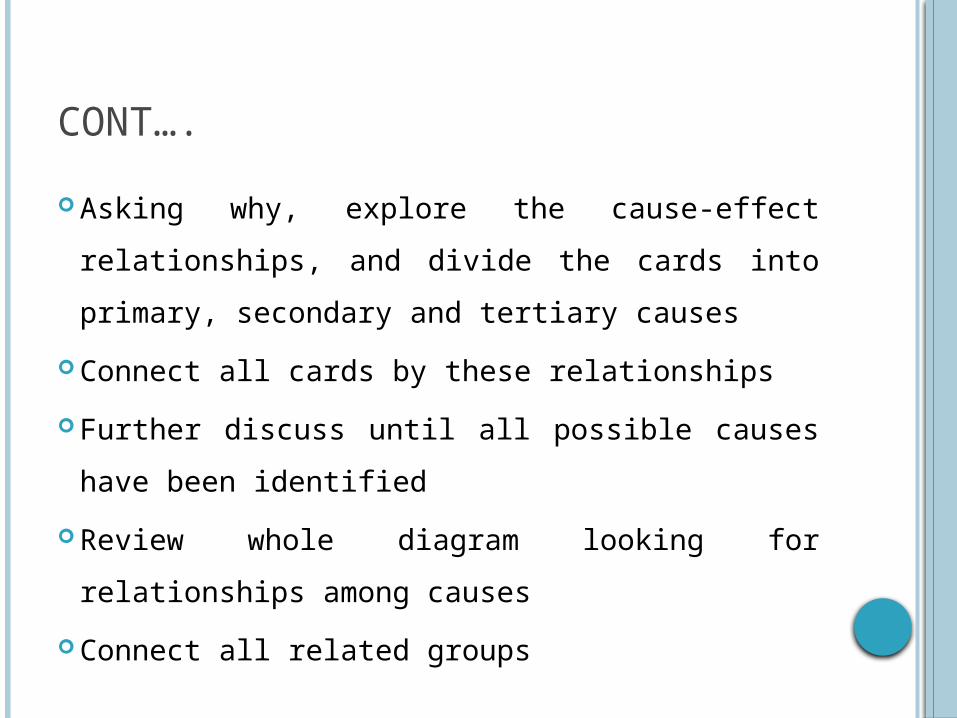
CONT…. Asking why, explore the cause-effect
relationships, and divide the cards into primary, secondary and tertiary causes
Connect all cards by these relationships Further discuss until all possible causes have
been identified Review whole diagram looking for relationships
among causes Connect all related groups
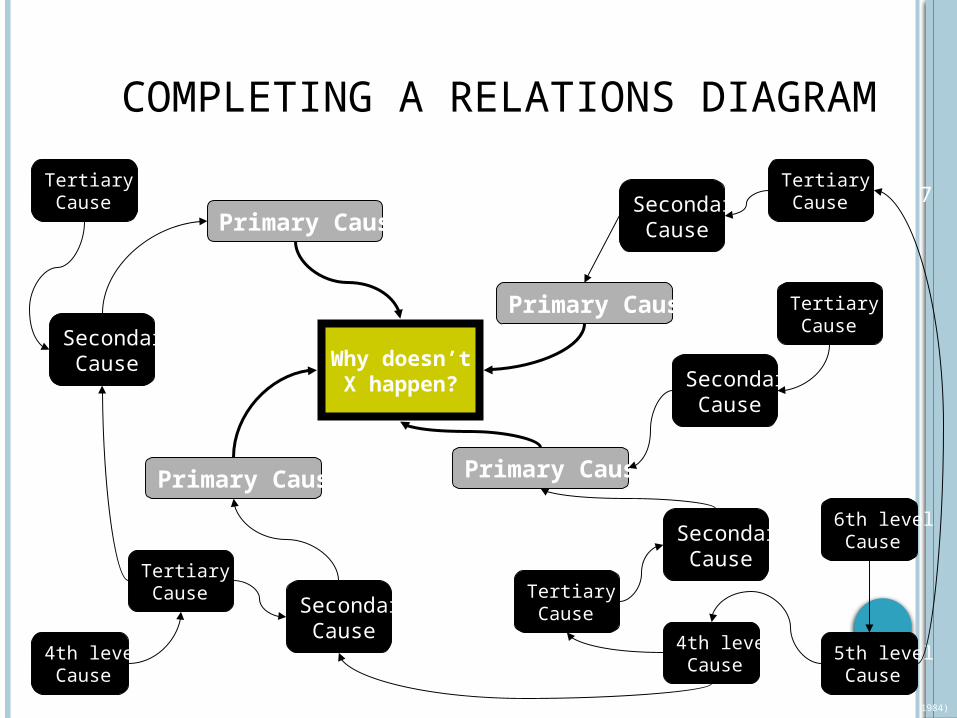
COMPLETING A RELATIONS DIAGRAM
Slide 7 0f 7
Why doesn’t X happen?
Primary Cause
Primary Cause
Primary Cause
Primary Cause
Tertiary Cause
Secondary Cause
Secondary Cause
Secondary Cause
Secondary Cause
Tertiary Cause
4th level Cause
Tertiary Cause
Tertiary Cause
4th level Cause 5th level
Cause
6th level Cause
Tertiary Cause
Secondary Cause
Source: Nayatani, Y., The Seven New QC Tools (Tokyo, Japan, 3A Corporation, 1984)
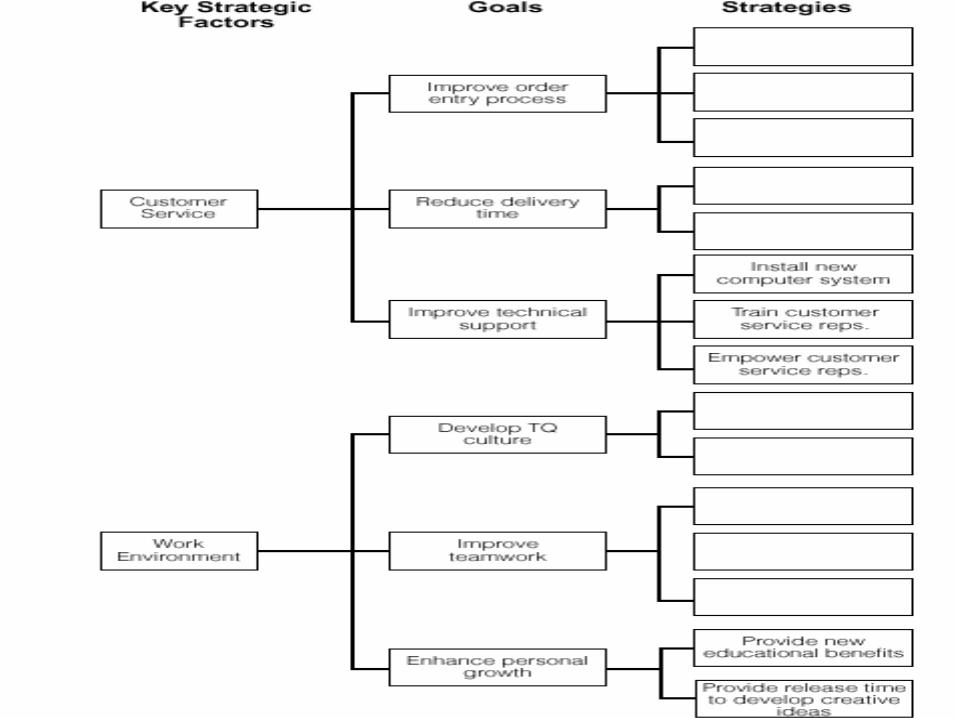
TREE DIAGRAMS For Systematically Pursuing the Best Strategies for Attaining an Objective
The tree diagram is an analysis tool for breaking down a broad or top level goal of a team into many levels of increasingly detailed and specific actions that need to be done in order to achieve the stated goal.
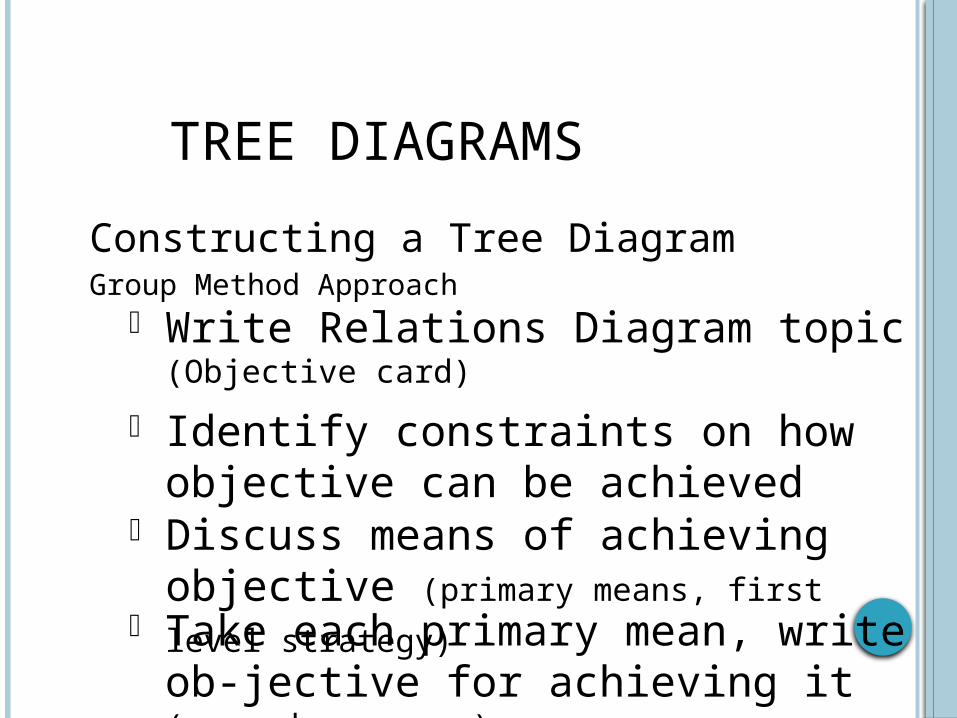
Discuss means of achieving objective (primary means, first level strategy)
TREE DIAGRAMS Constructing a Tree Diagram Group Method Approach
Write Relations Diagram topic (Objective card)
Identify constraints on how objective can be achieved
Take each primary mean, write ob-jective for achieving it (secondary means)

CONT… Continue to expand to the fourth
level Review each system of means in both directions (from objective to means and means to objective)
Connect all levels

Completing a Tree Diagram
To Accomplish
3rd means
3rd means
Primary means
3rd means
3rd means
ConstraintsPrimary means
Secondary means
Secondary means
Secondary means
Secondary means
3rd means
3rd means
3rd means
3rd means
4th means
4th means
4th means
4th means
4th means
4th means
4th means
4th means
4th means
4th means
4th means
4th means
MATRIX DIAGRAM
The purpose of a matrix diagram is to explore the existence and the extent of relations between individual items in two sets of factors or features or characteristics and express them in a symbolic form that is easy to understand.

PROCEDURE Decide the two sets of factors for which
relations are required to be clarified. Call the set of the main factors ‘features’ The set of factors dependent on it
counterpart ‘characteristics’. Divide the features into primary, secondary
and tertiary features. Divide the characteristics into primary,
secondary and tertiary characteristics
CONT… Place the features vertically on the left hand
side of the matrix and characteristics horizontally on top of the matrix.
Enter the importance of the features on the column after that for the tertiary features.
In the main body of the matrix, place symbols at the squares denoting the relationship between the feature and the characteristic meeting at the intersection.
The symbols to be used are :

CONT… Strong relationship Medium relationship Weak relationship
In case there is no relation between the concerned feature and characteristic, leave the square blank to indicate ‘no relation’.


MATRIX DATA ANALYSIS DIAGRAM
The purpose of matrix data analysis diagram is to present numerical data about two sets of factors in a matrix form and analyse it to get numerical output.

PROCEDURE Decide the two factors whose relations are to
be analysed. Check the number of individual items in the
two factors. Prepare a matrix to accommodate all the
items of the two factors. Enter numerical data in the matrix. Give the diagram a suitable title.

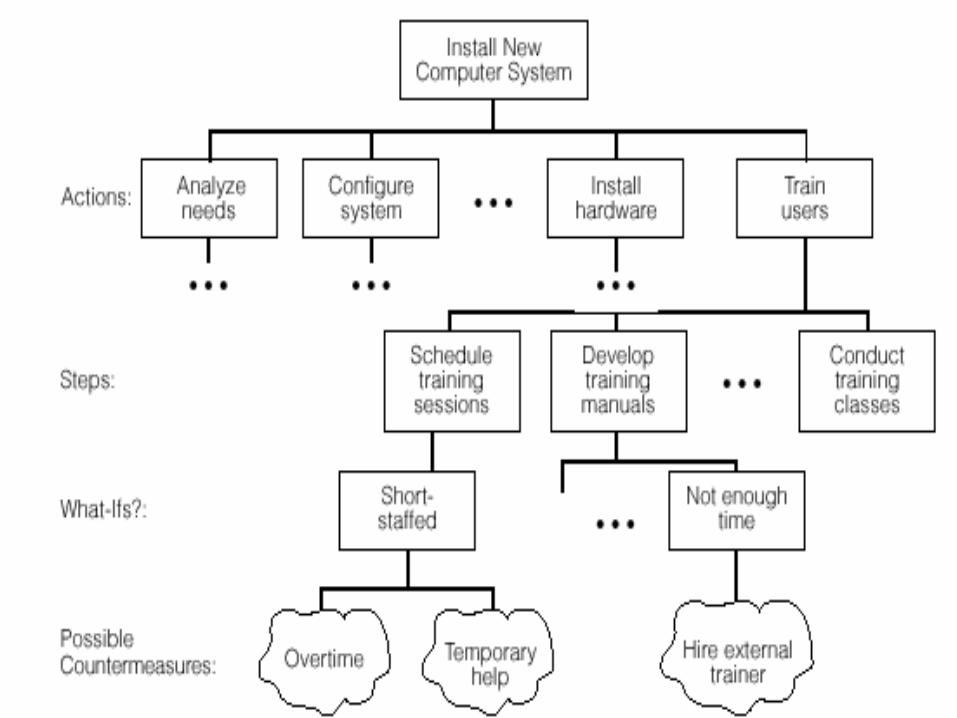
PROCESS DECISION PROGRAMME CHART
The Process Decision Program Chart (PDPC) is a very useful and powerful method to overcome a problem or a goal to be achieved which are not familiar. With the help of PDPC we can map out all the conceivable events or contingencies that can occur in the implementation stage and also find out feasible counter measures to overcome these problems.

PROCEDURE
Prepare a ‘normal’ flowchart of the process with all expected events as steps in the chart.
Consider the possibility of the process not going as per the plan due to any abnormal, though less probable, occurrences.
Show these occurrences on the flowchart through branching at appropriate locations.
CONT… Consider how the abnormal occurrence will
affect the process and search for ways and means to counter the effect.
Show these countermeasures in rectangles connecting the corresponding abnormal occurrence on one side and the process objective or the goal on the other.
Give a suitable title to the diagram.

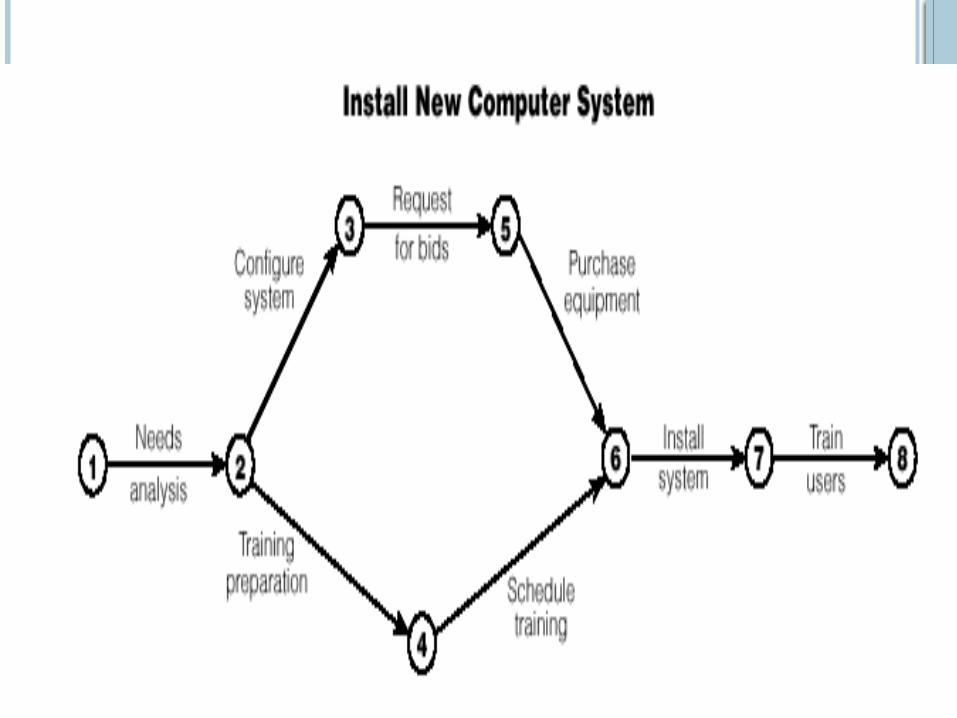
ARROW DIAGRAM The diagram provides a clear understanding
of the schedule of various steps in the process which helps one to monitor the process for ensuring its completion on time.

PROCEDURE
From strategies on Tree diagram, select one (Objective of Arrow Diagram)
Identify constraints to Objective
Write all essential activities on separate cards
List all activities necessary to achieving Objective

CONT…
Organize cards in sequential order of activities
Remove any duplicate activities Review order of activities, find
sequence with greatest amount of activities
Arrange parallel activities
Record names and other necessary information
Next, complete the diagram
Examine path, number nodes in sequence from left to right
CONT…

TPM DEFINITION A company-wide team-based effort to build
quality into equipment and to improve overall equipment effectiveness
Total all employees are involved it aims to eliminate all accidents, defects and
breakdowns Productive
actions are performed while production goes on troubles for production are minimized
Maintenance keep in good condition repair, clean, lubricate
1. TPM DEFINITION (2) TPM combines the traditionally American
practice of preventive maintenance with Total Quality Control and Total Employee Involvement, to create a culture where operators develop ownership of their equipment, and become full partners with Maintenance, Engineering and Management to assure equipment operates properly everyday.
3. TPM PRINCIPLES Increase Overall Equipment Effectiveness
(OEE) Improve existing planned maintenance
systems The operator is the best condition monitor Provide training to upgrade operations and
maintenance skills Involve everyone and utilize cross-functional
teamwork

64
WHAT IS SIX SIGMA?
• Degree of variation;• Level of performance in terms of
defects;• Statistical measurement of process
capability;• Benchmark for comparison;• Process improvement
methodology;• It is a Goal;• Strategy for change;• A commitment to customers to
achieve an acceptable level of performance
Sigma is a letter
in the Greek Alphabet

65
SIX SIGMA DEFINITIONS• Business Definition
A break through strategy to significantly improve customer satisfaction and shareholder value by reducing variability in every aspect of business.

66
SIX SIGMA PROJECT METHODOLOGY
ControlDefine Measure Analyze Improve
Establish standards to maintain process;
Design the controls, implement and monitor.
Evaluate financial impact of the project
Identify, evaluate and select projects for improvement
Set goalsForm teams.
Collect data on size of the selected problem,
identify key customer requirements,
Determine key product and process characteristic.
Analyze data, establish and confirm the “ vital few “ determinants of the performance.
Validate hypothesis
Improvement strategy
Develop ideas to remove root causes
Design and carry out experiments,
Optimize the process.
Final solutions
Project Phases

WHAT IS ISO? ISO is the acronym for International Organization
for Standardization located in Geneva, Switzerland.
It is the specialized international agency for standardization of system and its certification.
It is an attempt to bring in uniformity in the quality standard of different countries.
At present , It comprises the national standard bodies of 91 countries.

OBJECTIVES OF ISO 9000 To facilitate international trade of goods and
services.
To obtain competitiveness by obtaining required quality in a cost effective way.
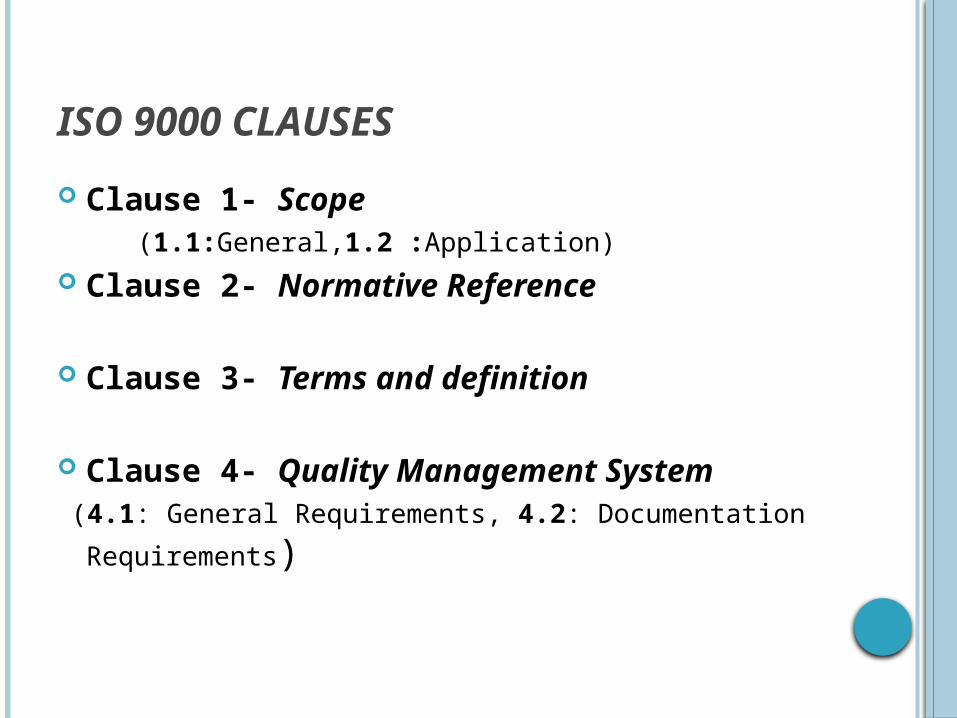
ISO 9000 CLAUSES Clause 1- Scope (1.1:General,1.2 :Application) Clause 2- Normative Reference
Clause 3- Terms and definition
Clause 4- Quality Management System (4.1: General Requirements, 4.2: Documentation
Requirements)
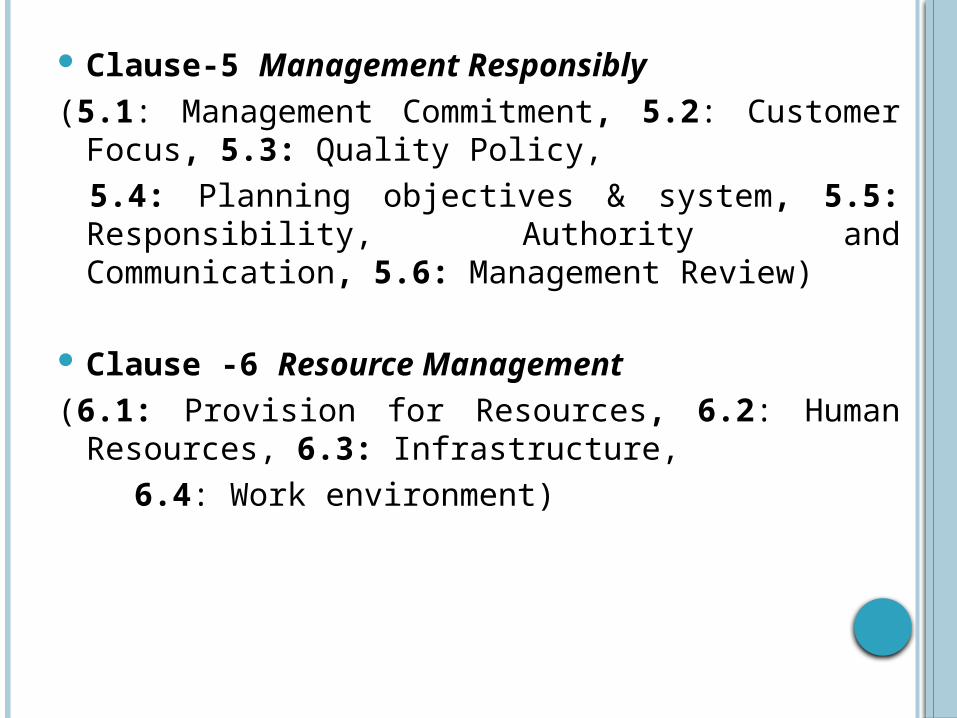
Clause-5 Management Responsibly(5.1: Management Commitment, 5.2: Customer
Focus, 5.3: Quality Policy, 5.4: Planning objectives & system, 5.5:
Responsibility, Authority and Communication, 5.6: Management Review)
Clause -6 Resource Management(6.1: Provision for Resources, 6.2: Human
Resources, 6.3: Infrastructure, 6.4: Work environment)
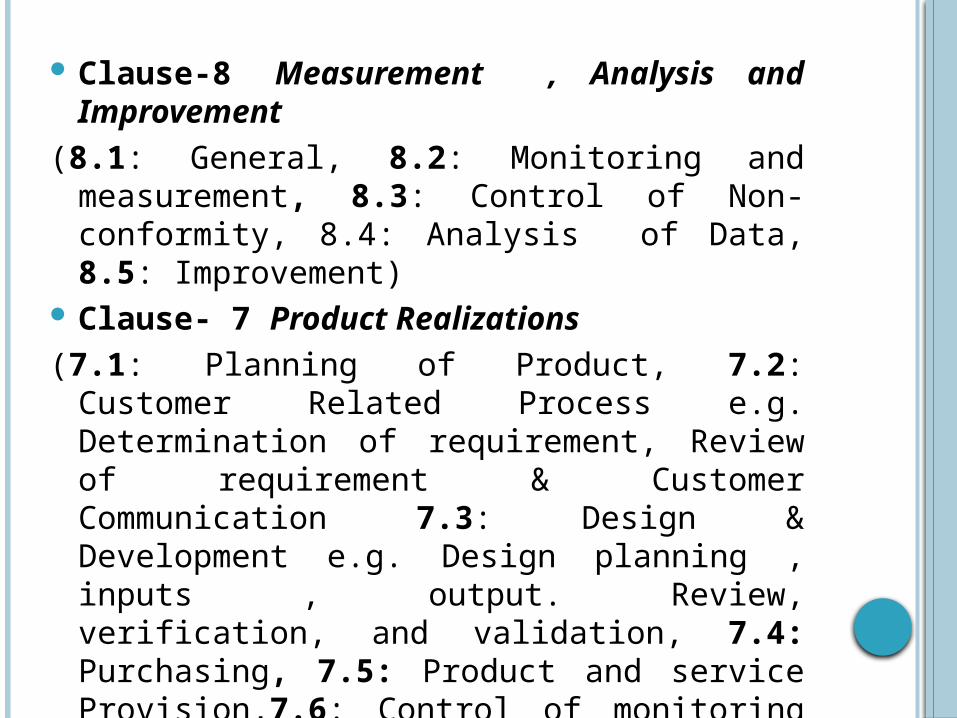
Clause-8 Measurement , Analysis and Improvement
(8.1: General, 8.2: Monitoring and measurement, 8.3: Control of Non-conformity, 8.4: Analysis of Data, 8.5: Improvement)
Clause- 7 Product Realizations(7.1: Planning of Product, 7.2: Customer
Related Process e.g. Determination of requirement, Review of requirement & Customer Communication 7.3: Design & Development e.g. Design planning , inputs , output. Review, verification, and validation, 7.4: Purchasing, 7.5: Product and service Provision,7.6: Control of monitoring and measuring devices ),
ISO 9001:2000

OBJECTIVEIntroduce the concept of new ISO 9001 Standard
Highlight important areas and changes of the new standard
Briefly introduce the system requirements of the new standard
WHAT IS ISO 9001: 20002nd revision of Quality Management System Requirement Standard from International Organization for Standards
Replacement for previous ISO 9001 / 9002 and 9003 standards of 1994
Introduced considerable conceptual changes

NEW ISO 9001
QMSResource management
Measurement, analysis & improvements
Product Realization
ManagementResponsibility
Continual Improvement cycle
General requirements
General requirements
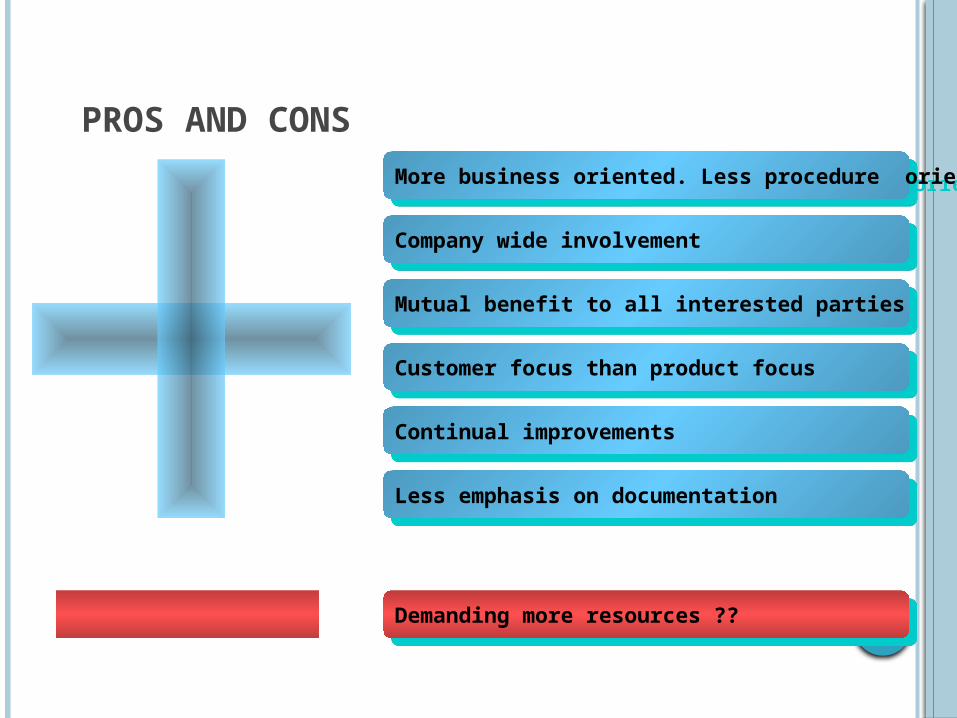
PROS AND CONSMore business oriented. Less procedure oriented
Company wide involvement
Mutual benefit to all interested parties
Customer focus than product focus
Demanding more resources ??
Continual improvements
Less emphasis on documentation
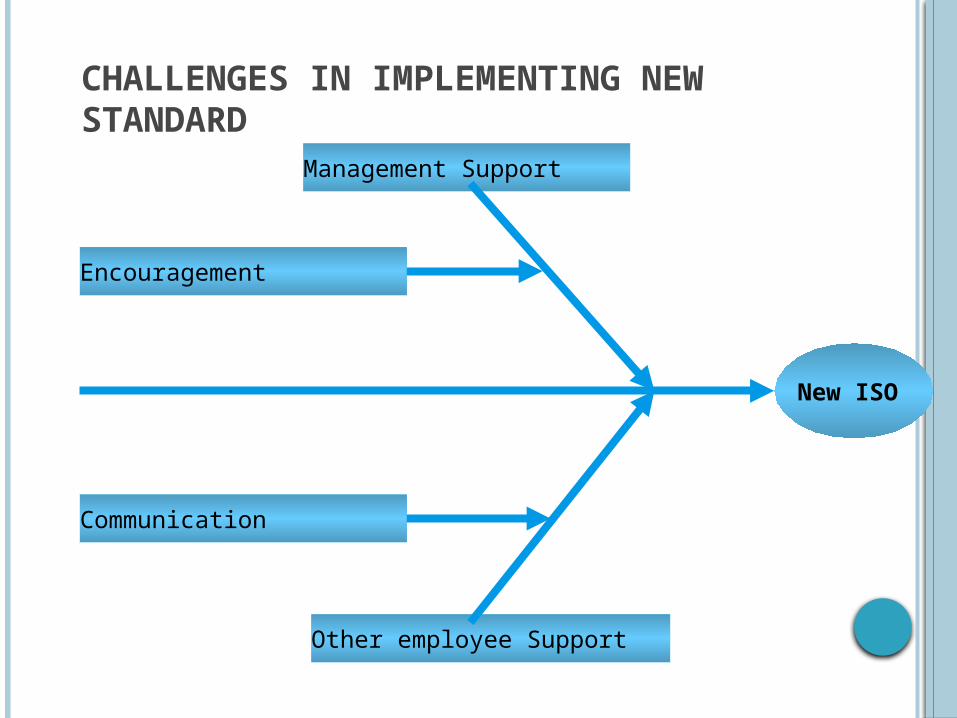
CHALLENGES IN IMPLEMENTING NEW STANDARD
Communication
Management Support
Other employee Support
New ISO
Encouragement
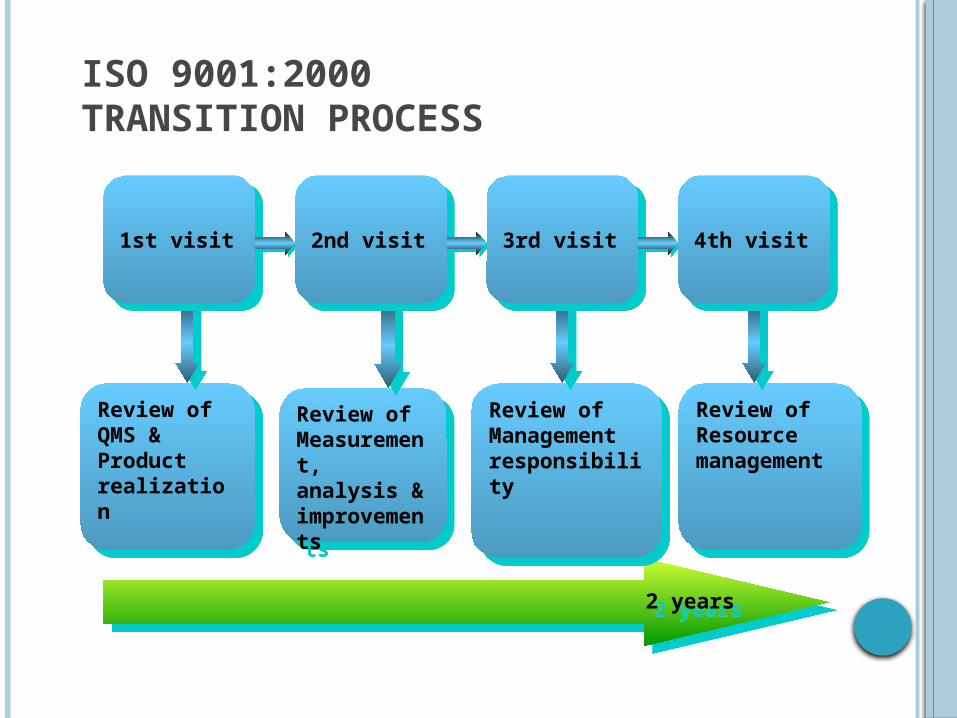
ISO 9001:2000 TRANSITION PROCESS
2 years
Review of QMS & Product realization
Review of Measurement, analysis & improvements
Review of Management responsibility
Review of Resource management
1st visit 2nd visit 3rd visit 4th visit
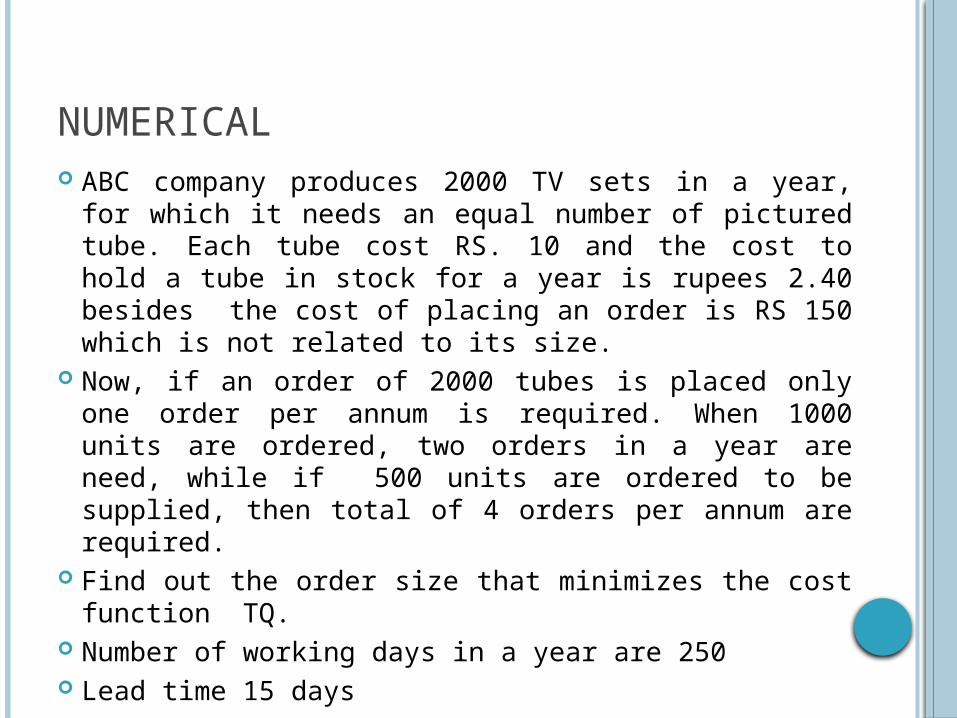
NUMERICAL ABC company produces 2000 TV sets in a year, for
which it needs an equal number of pictured tube. Each tube cost RS. 10 and the cost to hold a tube in stock for a year is rupees 2.40 besides the cost of placing an order is RS 150 which is not related to its size.
Now, if an order of 2000 tubes is placed only one order per annum is required. When 1000 units are ordered, two orders in a year are need, while if 500 units are ordered to be supplied, then total of 4 orders per annum are required.
Find out the order size that minimizes the cost function TQ.
Number of working days in a year are 250 Lead time 15 days