toxicokinetic toluene
TRANSCRIPT
J Occup Health 1998; 40: 293–301 Journal ofOccupational
Health
Physiologically Based Pharmacokinetic Modeling of MetabolicInteractions between n-Hexane and Toluene in Humans
Xiaozhong YU1, Gunnar JOHANSON2, Gaku ICHIHARA1, Eiji SHIBATA3,Michihiro KAMIJIMA1, Yuichiro ONO4 and Yasuhiro TAKEUCHI1
1Department of Occupational and Environmental Health, Nagoya University Graduate School of Medicine,2Department of Occupational Medicine-Toxicology, National Institute for Working Life, S-171 84 Solna, Sweden,3Department of Medical Technology, Nagoya University School of Medical Sciences and4Department of Public Health, Fijita Health University School of Medicine
Abstract: Physiologically based PharmacokineticModeling of Metabolic Interactions Between n-Hexane and Toluene in Humans: Xiaozhong YU, etal. Department of Occupational and EnvironmentalHealth, Nagoya University Graduate School ofMedicine—Some animal experiments have shown thatmutual metabolic inhibition takes place between n-hexane and toluene, but we have found only one reportdealing with their metabolic interaction at occupationallyrelevant exposure levels (Bælum et al. 1998). In orderto evaluate the effect of dose-dependent metabolicinteraction between toluene and n-hexane, especiallyin occupationally relevant exposure conditions such asrelevant exposure levels, physical activities andexposure pat terns, a physio logical ly basedpharmacokinetic (PBPK) model for co-exposure to n-hexane and toluene was developed. The PBPK modelfor the binary co-exposure was established by initiallyvalidating or refining the existing PBPK models for n-hexane and toluene and then linking the individualsolvent models via the hepatic metabolism terms. Inreporting previous findings, noncompetitive inhibitionwas assumed and the inhibition constant of toluene onn-hexane biotransformation and that of n-hexane ontoluene biotransformation used in simulation were 7.5,30 µm, respectively, in previous data. According tothe model, 8 h of constant exposure to 50 ppm n-hexane and 25, 50, 100 and 500 ppm toluene will causeabout 7%, 18%, 62% and 96% decreases in the urinaryexcretion of 2,5-hexanedione (2,5-HD) and 4%, 10%,25% and 30% increases in the n-hexane concentrationin blood at the end of the fifth day of exposure simulatedin a standard man at a 25 W work load. Simulations ofco-exposure to 50 ppm n-hexane and 50 ppm toluene
Received June 26, 1998; Accepted Aug 30, 1998Correspondence to: X. Yu, Department of Occupational andEnvironmental Health, Nagoya University Graduate School ofMedicine, 65 Tsurumai-cho, Showa-ku, Nagoya 466-8550, Japan
in a standard man who inhaled 50 ppm n-hexane with0 or 50 ppm toluene for 8 h at different work loadssuggest that toluene causes a slight decrease in urinary2,5-HD in the resting condition, a 17% decrease at 25W, and a 41% decrease at 50 W work load. Thesimulations of co-exposure in different exposurepatterns with the same time-weighted concentration(TWA) of 50 ppm, i.e. 50 ppm for 8 h, 100 ppm of 4times for 1 h and 200 ppm of twice for 1 h, showedreductions in urinary 2,5-HD of 17%, 40% and 67%,respectively. These simulations suggest that co-exposure to n-hexane and toluene around 50 ppm(TWA) could affect urinary n-hexane metabolites tovarious degrees depending on the fluctuations inexposure concentrations and variety of work activitiesin the workplace.(J Occup Health 1998; 40: 293–301)
Key words: n-Hexane, Toluene, Co-exposure,Metabolic interaction, PBPK model
Multiple exposure to solvents is often observed inworkplaces1, 2). Toxicokinetic interactions followingmultiple exposure to solvents have been studied inanimals as well as in humans, volunteers andoccupationally exposed subjects3–6). Due to toxicokineticinteractions, the behaviour of the biological exposureindicators used to assess the degrees of exposure mayvary significantly in relation to working conditions7, 8).n-Hexane and toluene are common solvents inworkplaces9, 10). Both are metabolized by the cytochromeP450 system, mainly in the liver11–13). In animalexperiments, Iwata et al.3, 4) showed that simultaneousinhalation of 500 ppm n-hexane and 500 ppm toluenedecreased the urinary excretion of n-hexane metabolites.The exposure levels play a major role in influencing themagnitude of the metabolic interference. In a study on

294 J Occup Health, Vol. 40, 1998
the interactions between toluene and benzene in which amulti-compartmental toxicokinetic simulation model wasapplied to a “standard male worker”, Sato14) concludedthat at low exposure concentrations of benzene andtoluene each solvent slightly inhibits the metabolism ofthe other. It is frequently argued that whenever multipleexposure in the workplace is within the occupationalexposure limit values, interactions rarely occur, and thatin these situations the levels of the biological indicatorstherefore do not undergo any particular changes comparedto exposure to single substances, but several reports are inconflict with these arguments15–17). Little is known with
hydroxylation of n-hexane to hexanols, whereas thesecond step is assigned to the further metabolism ofhexanols to 2,5-hexanedione (2,5-HD) and othermetabolites. All metabolism and metabolic interactionswere assumed to take place exclusively in the liver. Themetabolisms of n-hexane to hexanols and of toluene tovarious metabolites were described by Michaelis-Mentenkinetics. Mass balance was performed on eachcompartment, and the transfer of solvent throughout thesystem was expressed in the form of the simultaneousdifferential equations given in Table 1. This model isbased on the assumptions that the solvent immediately
Fig. 1. Structure of PBPK model for combined inhalation exposure to n-hexaneand toluene. LC: the lung compartment; VRC: the vessel-rich tissuecompartment; VPC: the vessel-poor tissue compartment; FC: the fatcompartment; Liver: the liver compartment; C: concentration in mg/l; L:Tissue/blood partition coefficient; Q: blood flow rate in L/min; subscriptsalv and inh stand for alveolar air and inhaled air, respectively; c forcardiac output, l for lung, r for VRC, p for VPC, f for FC, h for liver, v forvenous, art for arterial, hx for n-hexane, tol for toluene and 2,5-HD for2,5-hexanedione. υhl is the conversion rate of n-hexane to hexanols. K1
and K2 represent the conversion of hexanols to 2,5-HD and othermetabolites, respectively. K3 describes the transfer of 2,5-HD to thewater compartment and K4 is the urinary excretion constant.
respect to the degree to which mutualinteraction affects the toxicokineticbehavior of the n-hexane and toluene,especially in occupationally relevantexposure conditions.
P h y s i o l o g i c a l l y b a s e dpharmacokinetic (PBPK) modeling hasbeen used to study the extrapolation ofbiological data from animals to humans,variability of biological exposureindicators as well as the metabolicinteractions between ethanol andtrichloroethylene18), toluene and m-xylene19), 1,3-butadiene and styrene20),and ethanol and 2-butoxyethanol21). Asan effort to evaluate the effect of dose-dependent metabolic interactionbetween toluene and n-hexane,especially in occupationally relevantexposure conditions such as relevantexposure levels, and physical activitiesand exposure patterns, a physiologicallybased pharmacokinetic (PBPK) modelfor the co-exposure to n-hexane andtoluene was developed.
Methods
Simulation ModelThe pharmacokinetic simulation
models for n-hexane and toluene weremodified from Perbellini et al.22, 23), andRamsey and Anderson24). Each modelis composed of five physiologicalcompartments, as depicted in Fig. 1,including a lung compartment (LC), avessel rich compartment (VRC), avessel poor compartment (VPC), a fattissue compartment (FC), and a livertissue compartment (Liver). Accordingto the studies on the metabolism of n-hexane11, 13), the metabolic pathway ofn-hexane can be expressed briefly intwo steps (Fig. 1). The first step is the
295Xiaozhong YU, et al.: PBPK Modeling of Metabolic Interactions between n-Hexane and Toluene
reaches a balance between alveolar air and arterial blood,and that the solvent in venous blood is in dynamicequilibrium with the corresponding tissue.
Model ParametersModel parameters are listed in Table 2. Values for the
volume and blood flow in individual compartments wereassigned according to literature data21, 25). The blood: airand tissue: blood coefficients of n-hexane were taken fromPerbellini et al.26), and the blood: air coefficient of toluenefor humans was from Fiserova-Bergerova27). The humantissue: blood coefficients were assumed to be the sameas those of rats and shown by Gargas et al.28) Values formaximum metabolic rate (V
max) and Michaelis’s constant
(Km) for n-hexane were taken from Perbellini et al.23)
The Vmax
value for toluene was scaled from animalexperiments according to the formula 4.8 · (weight)0.75
for humans, whereas Km was assumed to be the same
across species19). The conversion of hexanols to 2,5-HDand to other metabolites is defined by the rate constantsK
1 and K
2, respectively. The rate constant K
3 describes
the transfer of 2,5-HD to the water compartment and K4
is the urinary excretion rate constant. Urinary metabolitesaccount for about 15% of the n-hexane absorbed via
Table 1. Mass balance differential equations for n-hexane inthe PBPK model. Corresponding equations fortoluene can be obtained from equations 1–5.
n-Hexane in lung compartmentVL
· dCart, hx/dt = Qalv · Cinh, hx + ∑ (Qi
· Ci, hx/Li, hx) + Qh
· Ch, hx/Lh, hx – Qc · Cart, hx – Qalv
· Cart, hx/Lb, hx (1)Calv, hx = Cart, hx/Lb, hx (2)
n-Hexane in storage compartmentsVi
· dCi, hx/dt = Qi · (Cart, hx – Ci, hx/Li, hx) (3)
Vh · dCh, hx/dt = Qh
· (Cart, hx – Ch, hx/Lh, hx) – υh, hx (4)
Conversion of n-hexane to hexanols in liver compartmentυh, hx = Vmax, hx
· Ch, hx/((Km, hx + Ch, hx) (1 + Ch, tol/Ki, tol)) (5)
2,5-Hexanedione in liver compartmentdAh, hd/dt = K1/(K1 + K2) · υh, hx – K3
· Ah, hd (6)
2,5-Hexanedione in water compartmentdAw, hd/dt = K3
· Ah, hd – K4 · Aw, hd (7)
2,5-Hexanedione in urinedAu, hd/dt = K4
· Aw, hd (8)
Variables A: amount; V: volume of compartment in l.Subscripts b: blood/air; i: compartments r, f and p; u: urine; w:water compartment, Other symbols are explained in Fig. 1.
Table 2. Parameters used in the PBPK model for n-hexane and toluene
Tissue Volume a Blood Flow c Tissue/Blood PartitionCompartment (l) (l/min) Coefficient
Rest 25W 50 n-Hexane Toluene
Lung (L) VLb Qc Qc Qc
VRC 0.0371Wt 0.51Qc 0.32Qc 0.27Qc 5d 4.64g
VPC 0.6100Wt 0.19Qc 0.41Qc 0.51Qc 6.2d 1.54g
FC 0.2310Wt 0.05Qc 0.06Qc 0.06Qc 130d 56.7g
LIVER 0.0314Wt 0.25Qc 0.21Qc 0.16Qc 6.5d 4.64g
ParameterCardiac output (Qc) (l/min) 5.8 7.55 10.05Alveolar ventilation (l/min) 5.8 9 18Blood/air partition coefficient 0.80d 16.3h
Vmax (mg/min) 0.50e 1.94i
Km (mg/l) 0.587e 0.55i
K1/ (K1 + K2) 0.055K3 (min–1) 0.003e
K4 (min–1) 0.0009e
Inhibitory constant of toluene in relation to n-hexane (Ki, tol) (µM) 7.5f
Inhibitory constant of n-hexane in relation to toluene (Ki, hx) (µM) 30f
Urine output (Qu) (l/min) 3.08 · 10–5 · wt0.82 j
Body weight (Wt) 70 kg
a From Davis and Mapleson25). b VL= Volume of lung (0.6 l) + volume of arterial blood (1.4l) + FRC (2.7 l)/blood: air partition coefficient22). c From Johanson et al.21) d, e, f FromPerbellini et al.6, 23, 26) g From Gargas et al.28) h From Fiserova-Bergerova27). i From Tardif etal.19) j From Adolph38).
296 J Occup Health, Vol. 40, 1998
inhalation29). The average excretion of 2,5-HD in workersexposed to 100 ppm n-hexane for 8 h was found to be2.8 mg in 24 h30). The estimated uptake of n-hexane bythe workers exposed to 100 ppm for 8 h is about 338 mg,assuming an alveolar ventilation of 10 l/min, and analveolar retention of 20%31), so that about 0.83% ofabsorbed n-hexane can be expected to be excreted as 2,5-HD, corresponding to about 5.5% of urinary n-hexanemetabolites. Therefore, the value for K
1/(K
1 + K
2) was
set at 0.055.
Modeling of metabolic interactionNoncompetitive metabolic interaction between n-
hexane and toluene was assumed in view of the findingsof Perbellini et al.6) It was further assumed that n-hexaneand toluene mutually interfered with each other inmetabolism and that toluene affects the first step in n-hexane metabolism. The above assumptions enabled usto express the rate of n-hexane metabolism under theinfluence of simultaneous exposure to toluene by meansof the equation
υh, hx
= (Vmax
· Ch, hx
)/((Km + C
h, hx) · (1 + C
h, tol/K
i, tol))
where Vmax
and Km stand for the metabolic constants of
n-hexane, Ch, hx
, Ch, tol
the hepatic concentrations of n-hexane and toluene, respectively, and K
i, tol the n-hexane
inhibitory constant of toluene. A similar equation maybe used for the metabolism of toluene under the influenceof n-hexane. The complete differential equations for theliver compartment are given in Table 1. Solutions to thesets of simultaneous differential rate equations were
obtained by numeral integration with a spread sheet macrowritten in Microsoft Excel (version 5.0)32).
Results
Validation of PBPK modelThe behavior of venous blood concentrations of n-
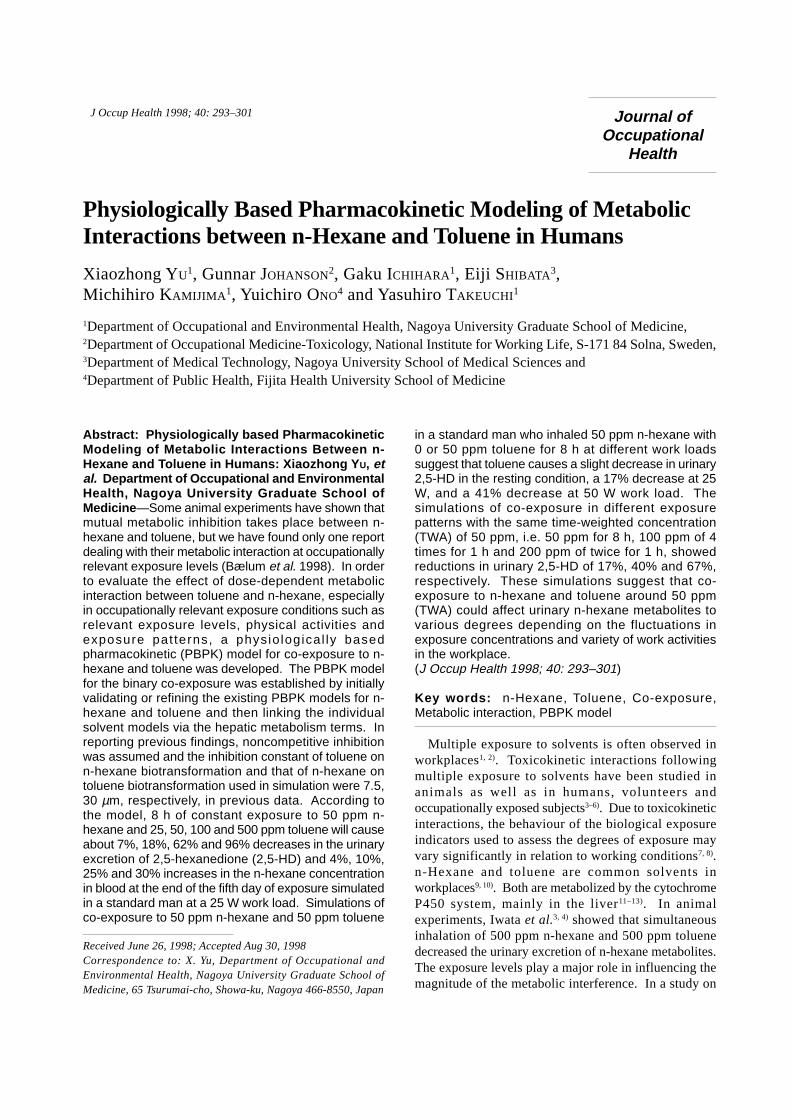
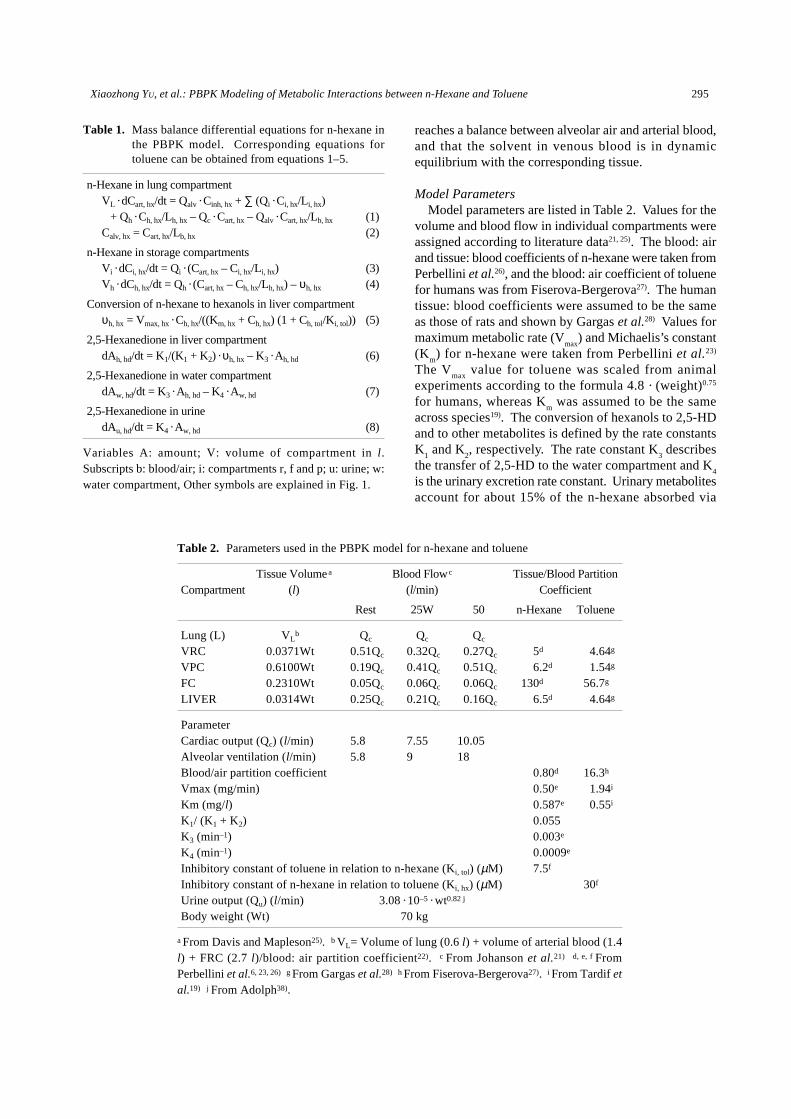
hexane during and after human exposure to 100 ppm (360mg/m3) or 200 ppm (720 mg/m3) for 4 h in the restingcondition with average lung ventilation of 10.4 l/minreported by Veulemans et al.33) were well simulated inour PBPK model for n-hexane (Fig. 2). Furthermore,the calculated venous blood concentration and alveolarair concentration of toluene during and after 120 minexposure to 300 mg/m3 (≅ 80 ppm) at rest or with a 50 Wwork load were in general agreement with theexperimental data reported by Carlsson34) (Fig. 3), so itappears that our model is suitable for simulating thebehavior of n-hexane and toluene in human singleexposure.
Influence of toluene on n-hexane toxicokineticsThe effects of toluene + n-hexane co-exposure on n-
hexane levels in venous blood were simulated in astandard man who inhaled either 50 ppm (A) or 500 ppm(B) n-hexane together with 0, 25, 50, 100, or 500 ppmtoluene during very light physical exercise (25 W) for 8h a day. The results are shown in Fig. 4. At 50 ppm n-hexane alone, the concentration in blood reached nearly0.09 mg/l at the end of the workshift without any notablechanges during one week of exposure (Fig. 4A). Co-exposure to 25 ppm toluene gave only a 4% increase in
Fig. 2. Venous blood concentration of n-hexane duringand after exposure to 100 or 200 ppm n-hexanefor 4 h as suggested by the PBPK model. Spotteddata are from Veulemans et al.33)
Fig. 3. Simulated pharmacokinetic behavior of toluene inblood and alveolar air during and after exposureto 300 mg/m3 (80 ppm) toluene for 120 min at restor in 50 W work load condition. Spotted data arefrom Carlsson’s human volunteer studies34).

297Xiaozhong YU, et al.: PBPK Modeling of Metabolic Interactions between n-Hexane and Toluene
blood n-hexane levels, whereas 50, 100 and 500 ppmtoluene caused marked increases in blood n-hexane by10%, 25% and 30%, respectively. At the 500 ppm n-hexane level, co-exposure to 25, 50, 100 and 500 ppmtoluene caused blood n-hexane increases by 6%, 7%, 8%and 8%, respectively, as compared with single exposure(Fig. 4B).
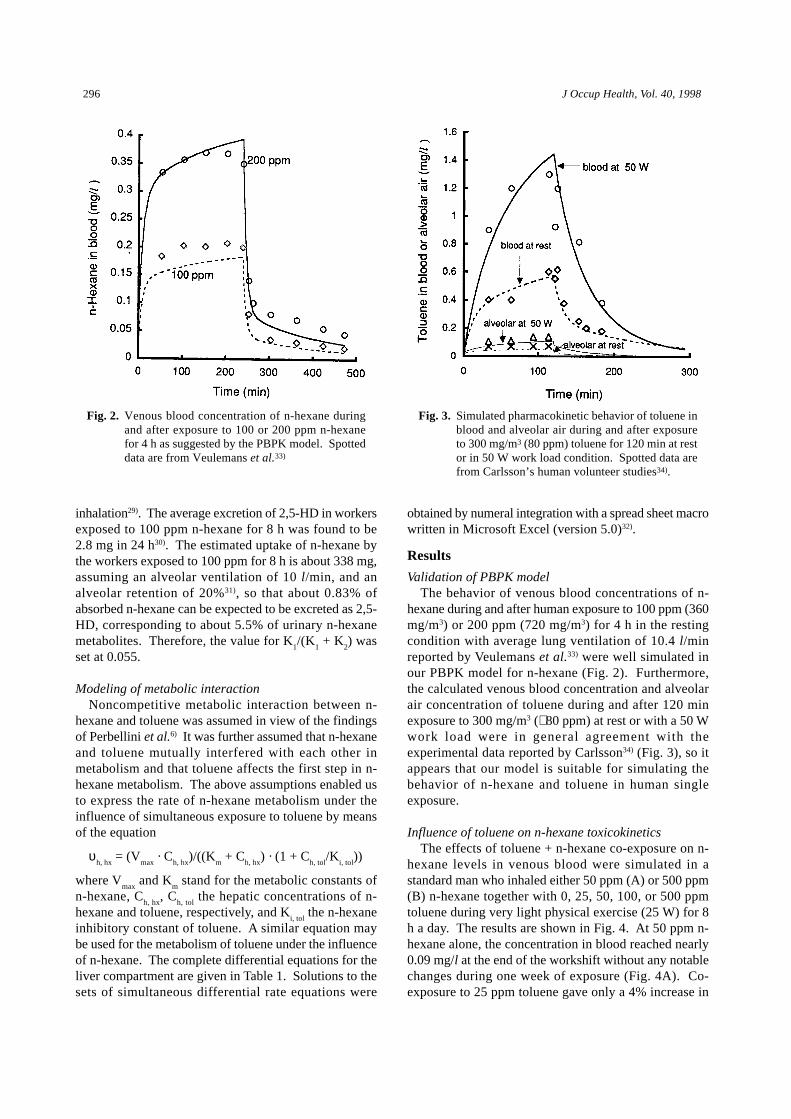
Simulated patterns of the urinary concentrations of 2,5-HD are shown in Fig. 5. According to our model, urinary2,5-HD reached a maximum of about 1.8 mg/l after 8 hexposure on the first day. At repeated daily 8-h exposure,2,5-HD in urine increased gradually to a maximum ofabout 2.8 mg/l on the fifth day. Upon co-exposure to 50ppm n-hexane and 25 ppm toluene, there was a 7%decrease in urinary 2,5-HD, but co-exposure to 50 or 100ppm toluene reduced urinary 2,5-HD by 18% and 62%and 500 ppm toluene almost completely depressed it(96%) (Fig. 5A). The corresponding reductions in urinary2,5-HD at 500 ppm n-hexane were 18%, 37%, 70% and95% (Fig. 5B).
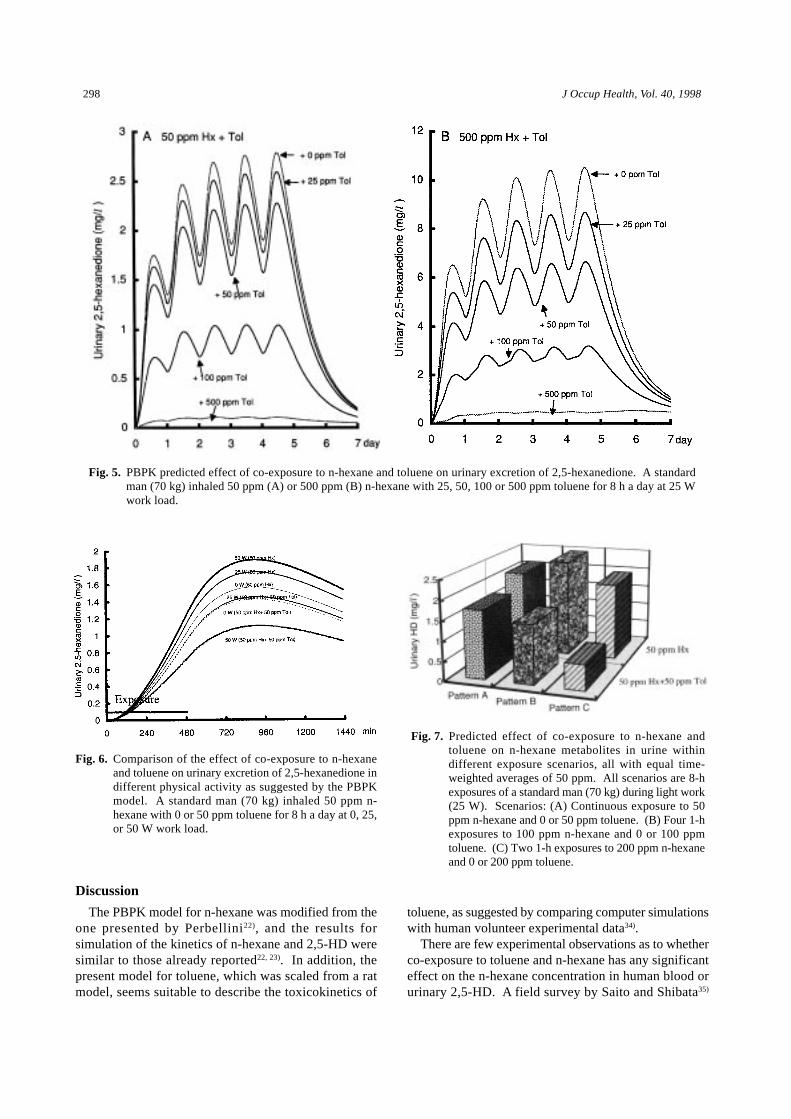
The simulated results of the effects of toluene onurinary 2,5-HD at different work loads are shown in Fig.6. A standard man (70 kg) inhaled 50 ppm n-hexanewith 0 or 50 ppm toluene for 8 h at 0, 25 or 50 W workload. The percentages of reduction in urinary 2,5-HDwere considerably different, so that there were 8%, 17%and 41% reductions under 0, 25 and 50 W work loadconditions, respectively, as compared with exposure ton-hexane only.
The effect of different patterns of co-exposure totoluene and n-hexane on n-hexane metabolites in the urinewas studied by simulating a standard man (70 kg) inhaling50 ppm n-hexane together with 0 or 50 ppm toluene,expressed as time-weighted averages for 8 h at a 25 Wwork load. The exposure patterns were: (A) continuousco-exposure to 50 ppm n-hexane and 50 ppm toluene for8 h, (B) four 1-h co-exposures to 100 ppm n-hexane and100 ppm toluene during the day, and (C) two 1-h co-exposures to 200 ppm n-hexane and 200 ppm toluene.The results showed that urinary excretions of 2,5-HDwere remarkably different for the different exposurepatterns. There were 17%, 40% and 67% decreases inurinary 2,5-HD in patterns A, B and C respectively, ascompared to n-hexane alone (Fig. 7).
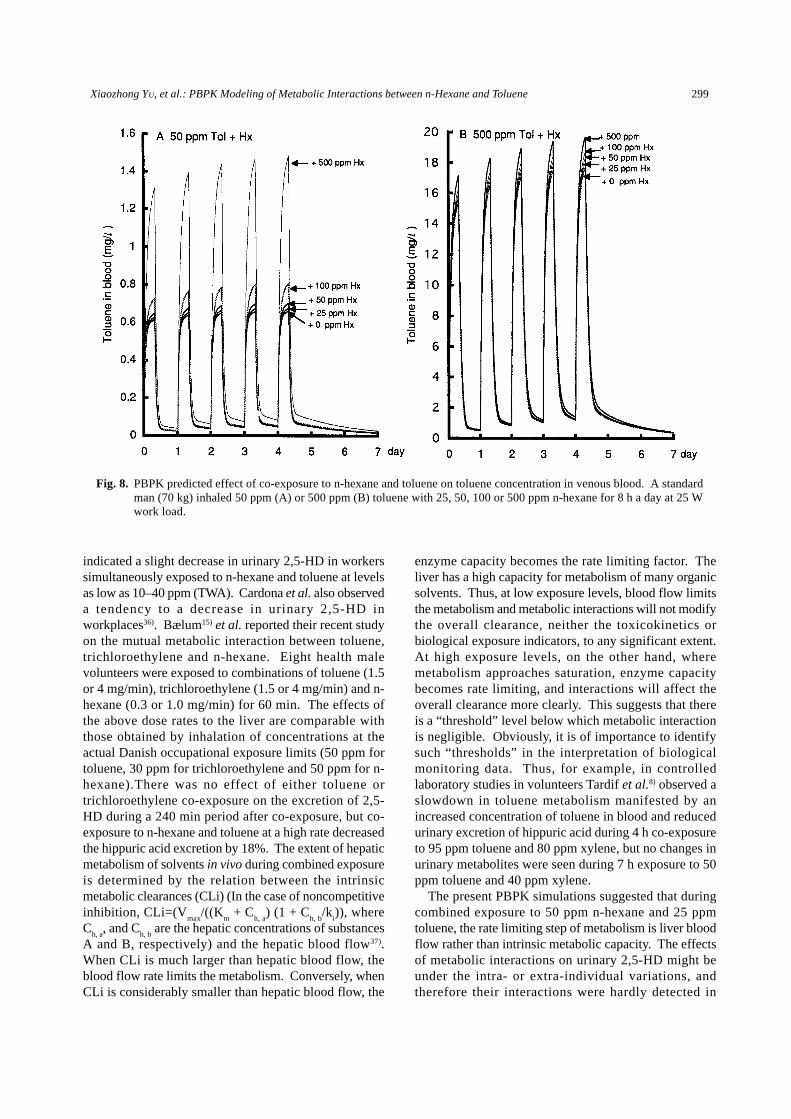
Influence of n-hexane on toluene toxicokineticsChanges in the toluene concentration in mixed venous
blood after co-exposure to toluene and n-hexane areshown in Fig. 8. Toluene in blood increased in a non-linear fashion upon co-exposure to toluene and n-hexane,so that 50 ppm toluene plus 25 and 50 ppm n-hexanecaused 2% and 6% increases in blood toluene. Co-exposure to100 and 500 ppm n-hexane, on the other hand,caused relative high increases in toluene in blood of 22%and 124%, respectively (Fig. 8A). Co-exposure to 500ppm toluene and n-hexane (25, 50, 100, 500 ppm) inducedless dramatic increases in toluene in blood (2%, 4%, 6%and 11%) (Fig. 8B).
Fig. 4. PBPK predicted effect of co-exposure to n-hexane and toluene on the n-hexane concentration in venous blood. Astandard man (70 kg) inhaled 50 ppm (A) or 500 ppm (B) n-hexane with 25, 50, 100 or 500 ppm toluene for 8 h perday during light work (25 W).
298 J Occup Health, Vol. 40, 1998
Discussion
The PBPK model for n-hexane was modified from theone presented by Perbellini22), and the results forsimulation of the kinetics of n-hexane and 2,5-HD weresimilar to those already reported22, 23). In addition, thepresent model for toluene, which was scaled from a ratmodel, seems suitable to describe the toxicokinetics of
toluene, as suggested by comparing computer simulationswith human volunteer experimental data34).
There are few experimental observations as to whetherco-exposure to toluene and n-hexane has any significanteffect on the n-hexane concentration in human blood orurinary 2,5-HD. A field survey by Saito and Shibata35)
Fig. 5. PBPK predicted effect of co-exposure to n-hexane and toluene on urinary excretion of 2,5-hexanedione. A standardman (70 kg) inhaled 50 ppm (A) or 500 ppm (B) n-hexane with 25, 50, 100 or 500 ppm toluene for 8 h a day at 25 Wwork load.
Fig. 6. Comparison of the effect of co-exposure to n-hexaneand toluene on urinary excretion of 2,5-hexanedione indifferent physical activity as suggested by the PBPKmodel. A standard man (70 kg) inhaled 50 ppm n-hexane with 0 or 50 ppm toluene for 8 h a day at 0, 25,or 50 W work load.
Fig. 7. Predicted effect of co-exposure to n-hexane andtoluene on n-hexane metabolites in urine withindifferent exposure scenarios, all with equal time-weighted averages of 50 ppm. All scenarios are 8-hexposures of a standard man (70 kg) during light work(25 W). Scenarios: (A) Continuous exposure to 50ppm n-hexane and 0 or 50 ppm toluene. (B) Four 1-hexposures to 100 ppm n-hexane and 0 or 100 ppmtoluene. (C) Two 1-h exposures to 200 ppm n-hexaneand 0 or 200 ppm toluene.
299Xiaozhong YU, et al.: PBPK Modeling of Metabolic Interactions between n-Hexane and Toluene
Fig. 8. PBPK predicted effect of co-exposure to n-hexane and toluene on toluene concentration in venous blood. A standardman (70 kg) inhaled 50 ppm (A) or 500 ppm (B) toluene with 25, 50, 100 or 500 ppm n-hexane for 8 h a day at 25 Wwork load.
indicated a slight decrease in urinary 2,5-HD in workerssimultaneously exposed to n-hexane and toluene at levelsas low as 10–40 ppm (TWA). Cardona et al. also observeda tendency to a decrease in urinary 2,5-HD inworkplaces36). Bælum15) et al. reported their recent studyon the mutual metabolic interaction between toluene,trichloroethylene and n-hexane. Eight health malevolunteers were exposed to combinations of toluene (1.5or 4 mg/min), trichloroethylene (1.5 or 4 mg/min) and n-hexane (0.3 or 1.0 mg/min) for 60 min. The effects ofthe above dose rates to the liver are comparable withthose obtained by inhalation of concentrations at theactual Danish occupational exposure limits (50 ppm fortoluene, 30 ppm for trichloroethylene and 50 ppm for n-hexane).There was no effect of either toluene ortrichloroethylene co-exposure on the excretion of 2,5-HD during a 240 min period after co-exposure, but co-exposure to n-hexane and toluene at a high rate decreasedthe hippuric acid excretion by 18%. The extent of hepaticmetabolism of solvents in vivo during combined exposureis determined by the relation between the intrinsicmetabolic clearances (CLi) (In the case of noncompetitiveinhibition, CLi=(V
max/((K
m + C
h, a) (1 + C
h, b/k
i)), where
Ch, a
, and Ch, b
are the hepatic concentrations of substancesA and B, respectively) and the hepatic blood flow37).When CLi is much larger than hepatic blood flow, theblood flow rate limits the metabolism. Conversely, whenCLi is considerably smaller than hepatic blood flow, the
enzyme capacity becomes the rate limiting factor. Theliver has a high capacity for metabolism of many organicsolvents. Thus, at low exposure levels, blood flow limitsthe metabolism and metabolic interactions will not modifythe overall clearance, neither the toxicokinetics orbiological exposure indicators, to any significant extent.At high exposure levels, on the other hand, wheremetabolism approaches saturation, enzyme capacitybecomes rate limiting, and interactions will affect theoverall clearance more clearly. This suggests that thereis a “threshold” level below which metabolic interactionis negligible. Obviously, it is of importance to identifysuch “thresholds” in the interpretation of biologicalmonitoring data. Thus, for example, in controlledlaboratory studies in volunteers Tardif et al.8) observed aslowdown in toluene metabolism manifested by anincreased concentration of toluene in blood and reducedurinary excretion of hippuric acid during 4 h co-exposureto 95 ppm toluene and 80 ppm xylene, but no changes inurinary metabolites were seen during 7 h exposure to 50ppm toluene and 40 ppm xylene.
The present PBPK simulations suggested that duringcombined exposure to 50 ppm n-hexane and 25 ppmtoluene, the rate limiting step of metabolism is liver bloodflow rather than intrinsic metabolic capacity. The effectsof metabolic interactions on urinary 2,5-HD might beunder the intra- or extra-individual variations, andtherefore their interactions were hardly detected in

300 J Occup Health, Vol. 40, 1998
experiments or field studies. Nevertheless, during co-exposure to 50 ppm n-hexane and 50 ppm toluene theintrinsic metabolic capacity became critical, and theeffects of metabolic interactions on urinary 2,5-HD couldnot be neglected, but there are still other factors affectingthe degree of metabolic interaction during n-hexane andtoluene co-exposure. Physical activity results in dramaticchanges in alveolar ventilation, cardiac output anddistribution of arterial blood, thus causing profoundchanges in the absorption and distribution of solvents.Our PBPK model therefore suggested that the metabolicinteractions between 50 ppm n-hexane and 50 ppmtoluene were not so dramatic in the resting condition, butbecame noticeable as work intensity increased. Inaddition, there are great fluctuations in exposure levelsin workplaces. Our simulations with different exposurepatterns suggest that the urinary excretion of 2,5-HDdecreases noticeably by about 67% after two 1-h co-exposure to 200 ppm n-hexane and 200 ppm toluene butonly marginally (17%) at continuous 50 ppm co-exposurefor 8 h. Considering great fluctuations in exposureconcentrations and a variety of work activities in actualworkplaces, co-exposure to n-hexane and toluene couldreduce urinary 2,5-HD even at concentrations lower thanoccupational exposure limits. These factors should beconsidered when the binary metabolites are used forbiological exposure indices for n-hexane and tolueneunder co-exposure conditions.
It should be mentioned that in our simulationsinhibition constants (K
i) were derived from rat
experiments in vitro. Obviously, species differencesbetween rats and man exist. In addition, several problemsstill remain when trying to extrapolate results for animalsto man, short term in vivo and in vitro experiments tolong term exposure conditions. The simulations presentedhere, however, suggest that dose-dependent interactionsof n-hexane and toluene could occur in occupationallyrelevant exposure conditions. Such knowledge is valuablefor biological monitoring as well as for risk assessmentin combined exposure to n-hexane and toluene.
Acknowledgment: This work was supported in part by aGrant-in-aid for Research (No. 08770269) from the JapaneseMinistry of Education, Science, Sports and Culture and bya Grant from the Hori Information Promotion Foundation.
References 1) Ikeda M, Kasahara M. n-Hexane and benzene contents
in gasoline for industrial purpose. Ind Health 1986;24: 63–66.
2) Inoue T, Takeuchi Y, Hisanaga N, Ono Y, Iwata M,Ogata M, Saito K, Sakurai H, Hara I, Matsushita Tand Ikeda M. A nationwide survey on organic solventcomponents in various solvent products. Part 1Homogeneous products such as thinners, degreasersand reagents. Ind Health 1983; 21: 175–183.
3) Iwata M, Takeuchi Y, Hisanaga N, Ono Y. Changes ofn-hexane neurotoxicity and its urinary metabolites bylong term co-exposure with MEK or toluene. Int ArchOccup Environ Health 1984; 54: 273–281.
4) Iwata M, Takeuchi Y, Hisanaga N, Ono Y. Changes ofn-hexane metabolites in urine of rats exposed to variousconcentrations of n-hexane and to its mixture withtoluene or MEK. Int Arch Occup Environ Health 1983;53: 1–8.
5) Tardif R, Goyal R, Brodeur J. Effect of simultaneousexposure to toluene and xylene on their respectivebiological exposure indices in human. Int Arch OccupEnviron Health 1991; 63: 279–284.
6) Perbellini L, Leone R, Fracasso ME, Brugnone F,Venturini MS. Metabolic interaction between n-hexaneand toluene in vivo and in vitro. Int Arch OccupEnviron Health 1982; 50: 351–358.
7) Shibata E, Huang J, Ono Y, Hisanaga N, Iwata M, SaitoI, and Takeuchi Y. Changes in urinary n-hexanemetabolites by co-exposure to various concentrationsof methyl ethyl ketone and fixed n-hexane levels. ArchToxicol 1990; 64: 165–168.
8) Tardif R, Goyal R, and Brodeur J. Assessment ofoccupational health risk from multiple exposure: reviewof industrial solvent interaction and implication forbiological monitoring of exposure. Toxicol Ind Health1992; 8: 37–52.
9) Iwata M, Takeuchi Y, Hisanaga N, Ono Y. A study onbiological monitoring of n-hexane exposure. Int ArchOccup Environ Health 1983; 51: 253–260.
10) Kumai M, Koizumi A, Saito K, Sakurai H, Inoue T,Takeuchi Y, Ogata M, Matsushita T and Ikeda M. Anationwide survey on organic solvent components invarious solvent products. Part 2 Heterogeneousproducts such as paints, inks and adhesives. Ind Health1983; 21: 185–197.
11) Morohashi K, Sadano H, Okada Y, Omura T. Positionspecificity in n-hexane hydroxylation by two forms ofcytochrome P 450 in rat liver microsomes. J BiochemTokyo 1983; 93: 413–419.
12) Nakajima T, Wang RS. Induction of cytochrome P450by toluene. Int J Biochem 1994; 26: 1330–1340.
13) Toftgard R, Haaparanta T, Eng L, Halpert J. Rat lungand liver microsomal cytochrome P 450 isozymesinvolved in the hydroxylation of n-hexane. BiochemPharmacol 1986; 35: 3733–3738.
14) Sato A. The effect of environmental factors on thepharmacokinetic behaviour of organic solvent vapours.Ann Occup Hyg 1991; 35: 525–541.
15) Bælum J, Mølhave L, Hansén SH, Væth M(1998)Metabolic interaction between toluene,trichloroethylene and n-hexane in humans. Scand JWork Environ Health 24: 30–37.
16) Wallen M, Holm S, Byfalt Nordqvist B. Coexposureto toluene and p-xylene in man: uptake and elimination.Brit J Ind Med 1985; 42: 111–116.
17) Jacubowski M, kostrezewski P. Excretion ofMethylbenezoic acid in urine a result of single andcombined exposure to m-xylene. Pol J Occup Med1986; 2: 238–247.

301Xiaozhong YU, et al.: PBPK Modeling of Metabolic Interactions between n-Hexane and Toluene
18) Sato A, Endoh K, Kaneko T, Johanson G. Effects ofconsumption of ethanol on the biological monitoringof exposure to organic solvent vapours: simulationstudy with trichloroethylene. Brit J Ind Med 1991; 48:548–556.
19) Tardif R, Lapare S, Krishnan K, and Brodeur J.Physiologically based modelling of the toxicokineticinteraction between toluene and m-xylene in the rat.Toxicol Appl Pharmacol 1993; 120: 266–273.
20) Filser JG, Johanson G, Kessler W, Kreuzer PE, Stei P,Baur C, Csanady GA. A pharmacokinetic model todescribe toxicokinetic interactions between 1,3-butadiene and styrene in rats: predictions for humanexposure. IARC Sci Publ 1993; 127: 65–78.
21) Johanson G. Physiologically based pharmacokineticmodeling of inhaled 2-butoxyethanol in man. ToxicolLett 1986; 34: 23–31.
22) Perbell ini L, Mozzo P, Brugnone F, Zedde.Physiologicomathematical model for studying humanexposure to organic solvents: kinetics of blood/tissuen-hexane concentrations and of 2,5-hexanedione inurine. Brit J Ind Med 1986; 43: 760–768.
23) Perbellini L, Mozzo P, Olivato D, Brugnone F.“Dynamic” biological exposure indexes for n-hexaneand 2,5-hexanedione, suggested by a physiologicallybased pharmacokinetic model. Am Ind Hyg Assoc J1990; 51: 356–362.
24) Ramsey JC, Andersen ME. A physiologically baseddescription of the inhalation pharmacokinetics ofstyrene in rats and humans. Toxicol Appl Pharmacol1984; 73: 159–175.
25) Davis MR, Mapleson WW. Structure and quantificationof physiological model of the distribution of injectedagents and inhaled anaesthetics. Brit J Anaesth 1981;53: 399–405.
26) Perbellini L, Brugnone F, Caretta D, Maranelli G.Partition coefficient of some industrial aliphatichydrocarbons (C5-C7) in blood and human tissues. BritJ Ind Med 1985; 42: 162–167.
27) Fiserova-Bergerova. Gases and their solubility: areview of fundamentals. In: Fiserova-Bergerova, eds.Modeling of inhalation exposure to vapor; uptake,distribution and elimination Vol I. Florida: CRC Press,Inc. Boca Raton. 1992: 3–28.
28) Gargas ML, Burgess RJ, Voisard DE, Cason GH, and
Andersen ME. Partition coefficients of low molecularweight volatile chemicals in various liquids and tissues.Toxicol Appl Pharmacol 1989; 98: 87–99.
29) Mutti A, Falzoi M, Lucertini S, Arfini G, Zignani M,Lombardi S, Francini I. n-Hexane metabolism inoccupational exposure. Brit J Ind Med 1984; 41: 533–538.
30) Perbellini L, Bartolucci GB, Brugnone F, De Rosa E,Valentini F. 2,5-esandione nel contollo biologico dell’esposizone professionale a n-esano. Med Lav 1985;76: 35–43.
31) Perbellini L, Brugnone F, Mozzo P, De Rosa E,Bartolucci GB, Facinni G. Toxicokinetic aspects of n-hexane and 2,5-hexanedione in the biomonitoring ofoccupational exposure to n-hexane. Ann Am Conf IndHyg 1985; 12: 357–364.
32) Johanson G, Näslund PH. Spreadsheet programming:a new approach in physiologically based modelling ofsolvent toxicokinetics. Toxicol Lett 1988; 41: 115–127.
33) Veulemans H, Van Vlem E, Janssens H, MasscheleinR, Leplat A. Experimental human exposure to n-hexane. Study of the respiratory uptake and elimination,and of n-hexane concentrations in peripheral venousblood. Int Arch Occup Environ Health 1982; 49: 251–263.
34) Carlsson A. Exposure to toluene, uptake, distributionand elimination in man. Scand J Work Environ Health1982; 8: 43–55.
35) Saito I, Shibata E. Hisanaga N, Takeuchi Y, Huang J.Relationship between n-hexane and urinary 2,5-hexanedione of workers in shoe and bag factories. JpnJ Ind Health 1992; 34: 831.
36) Cardona A, Marhuenda D, Marti J, Brugnone F, RoelJ, Perbellini L. Biological monitoring of occupationalexposure to n-hexane by measurement of urinary 2,5-hexanedione. Int Arch Occup Environ Health 1993;65: 71–74.
37) Sato A, Johanson G. Physiological factors affectingthe behaviour of organic solvent vapors in humans. In:Cheremisinoff PN, eds. Encyclopedia of environmentalcontrol technology. Vol 7. High hazard pollutants. GulfPublishing Company, Houston, Texas, 1995: 53–80.
38) Adolph EF. Quantitative relations in the physiologicalconstitutions of mammals. Sci 1949; 109: 579–585.