toxicity reduction program for the city of columbus jackson pike
TRANSCRIPT

Toxicity Reduction Program for the
City of Columbus Jackson Pike Wastewater Treatment
Plant: A Success StoryBy
Gary Hickman

Sewer/Watershed Tributary to Jackson Pike WWTP
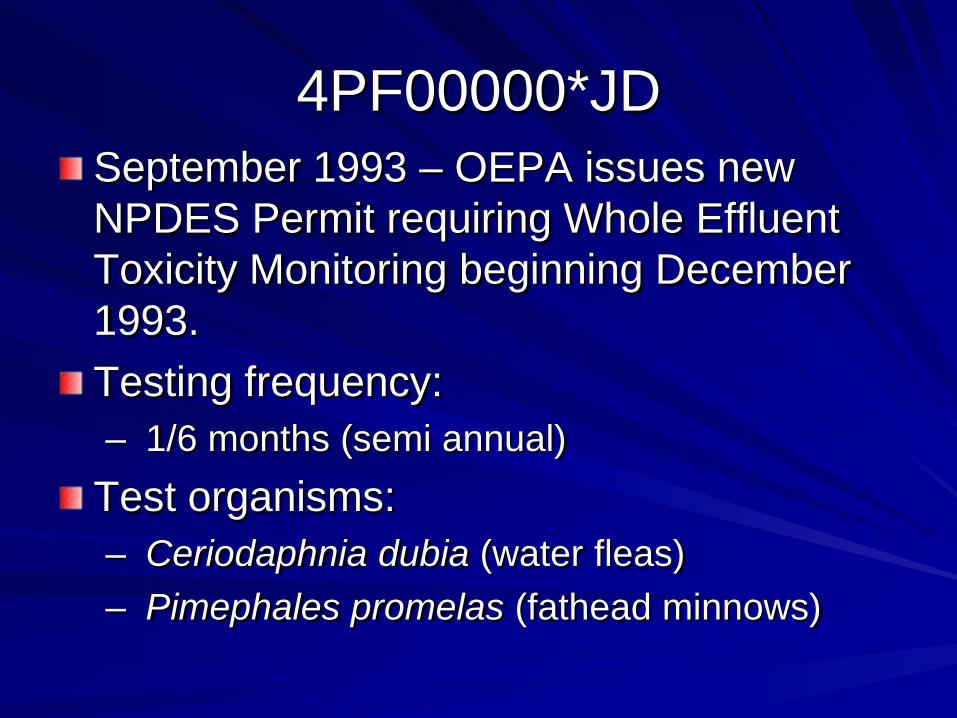
4PF00000*JDSeptember 1993 – OEPA issues new NPDES Permit requiring Whole Effluent Toxicity Monitoring beginning December 1993.Testing frequency:– 1/6 months (semi annual)
Test organisms:– Ceriodaphnia dubia (water fleas) – Pimephales promelas (fathead minnows)

Toxicity Testing Requirements
Reference: Reporting and Testing Guidance for Biomonitoring Required by Ohio Environmental Protection Agency (1991) and July 1998 –Revision 1Requires chronic toxicity testing as specified in section 2.Acute toxicity endpoints as described in section 2.H shall be derived from chronic tests.
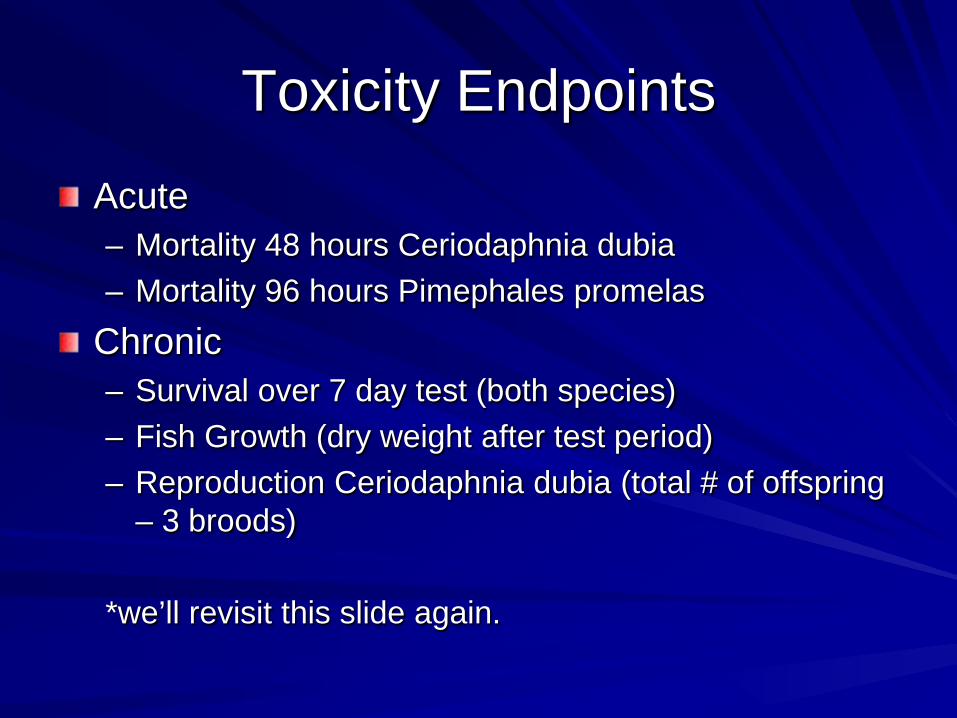
Toxicity Endpoints
Acute– Mortality 48 hours Ceriodaphnia dubia– Mortality 96 hours Pimephales promelas
Chronic– Survival over 7 day test (both species)– Fish Growth (dry weight after test period)– Reproduction Ceriodaphnia dubia (total # of offspring
– 3 broods)
*we’ll revisit this slide again.
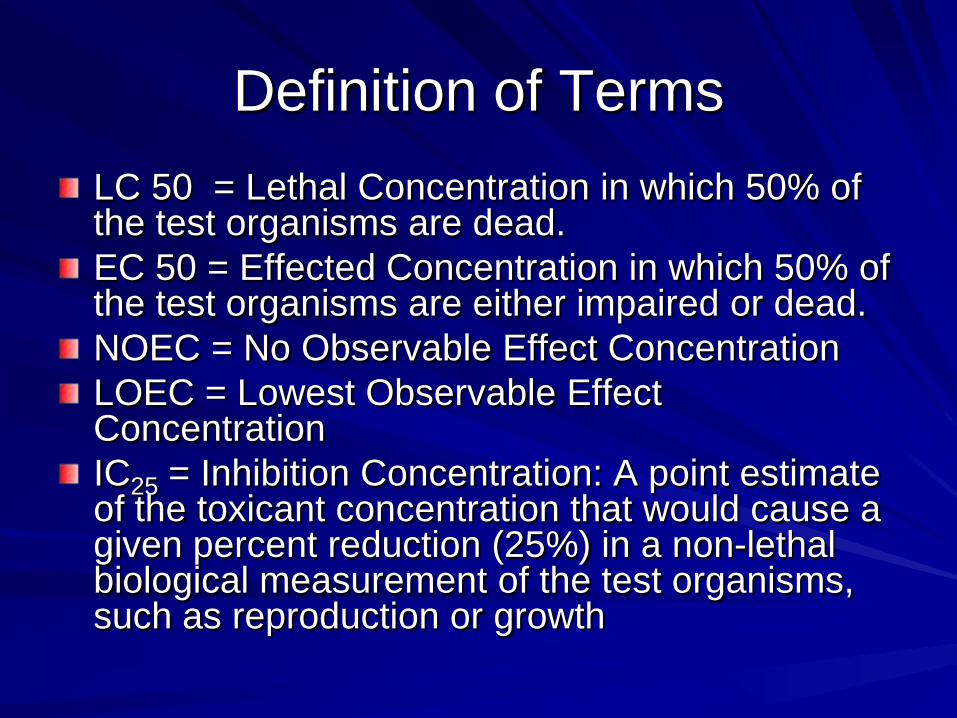
Definition of TermsLC 50 = Lethal Concentration in which 50% of the test organisms are dead.EC 50 = Effected Concentration in which 50% of the test organisms are either impaired or dead.NOEC = No Observable Effect ConcentrationLOEC = Lowest Observable Effect ConcentrationIC25 = Inhibition Concentration: A point estimate of the toxicant concentration that would cause a given percent reduction (25%) in a non-lethal biological measurement of the test organisms, such as reproduction or growth

Toxicity Calculations
Toxicity Units (TU) = (100% / %Effluent concentration of toxic endpoint)
Acute: TUa = 100/LC50 or 100/EC50
Chronic: TUc = 100/sq. rt. of (NOEC x LOEC)or 100/IC25
All TU cannot be mathematically less than 1

Testing ProceduresCeriodaphnia dubia (water fleas)– 10 replicate samples each containing 1 neonate
daphnia.– Typical dilution series 6.25%, 12.5%, 25%, 50%, and
100% effluent– Upstream sample is used as the diluent and control
water (unless toxic)– Moderately Hard Reconstituted Water is used as the
(alternative) test control– Observing survival and reproduction each of the 7
days– Test Duration 7 days (only count first 3 broods).

Ceriodaphnia dubia

Ceriodaphnia Dubia Cultures

Testing Procedures
Pimephales promelas (fathead minnows)– 3 replicates of 10 test organisms per dilution series– Typical dilution series 6.25%, 12.5%, 25%, 50%, and
100% effluent– Upstream sample is used as the diluent and test
control water (unless toxic)– Moderately Hard Reconstituted Water is used as the
(alternative) test controlLooking for survival and growth– Test Duration 7 days

Pimephales promelas

Breeding Tank

Common Test Protocols
Age of test organisms <24 hours old– Neonates age within 6 hrs of one another.*
Multiple lineages of test organisms required* Light, photoperiod and temperature standardizedMinimum Dissolved Oxygen Concentration 4.0 mg/lFeeding schedule standardized

Testing Observations and Records
Routine Chemical and Physical Determinations– DO, Temperature pH measurements at the beginning and end of
each 24 hour period in at least one vessel for each test concentration and control
– Temperature and pH are measured at the end of each 24 hour period
– Temperature is measured continuously or in at least two locations and across a sufficient number of test vessels at the end of the 24 hour period to determine variation in temperature in the environmental chamber
– pH is measured in the effluent sample daily– Conductivity, alkalinity and hardness are measured in each new
sample; 100% effluent, receiving water, and control water– All measurements are recorded on the data sheet.

Testing Observations and Records
Routine Biological Observations– Number of live fish larvae each day – Number of live adult Daphnia (first 3-4 days)
The number of off-spring per adult daphnia (last 3-4 days -3 broods)
– Test duration 7 days – All observations are recorded on the data
sheets.

Example of data Summary Sheet Daphnia

Example Data Summary Sheet Minnows

Data Summary Sheet - Daphnia

Data Summary Sheet - Minnows
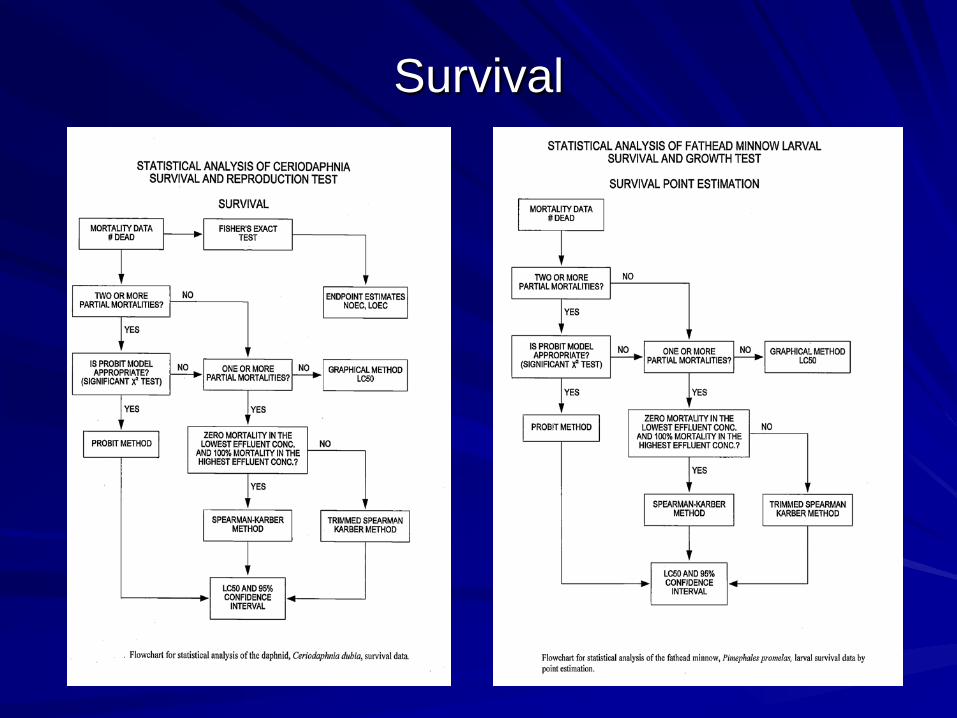
Survival

Reproduction/Growth

List of possible interferencesContaminants in dilution water, glassware, sample hardware and testing equipmentImproper effluent sampling and handlingPathogenic and/or predatory organisms in the dilution water and effluent may affect test organism survival and confound test resultsThe amount and type of natural food and nutrients in the effluent or dilution water may confound test results

WET TestsBased on all of the above, you could be wondering is this even a viable test to do?Yes it is.Scientific method. Enormous efforts to eliminate variability and provide readily defensible dataImprovements made as scientists gain experience and endeavor to reduce test variability:– age and lineage of test species– Adjusting Dilution series used for testing certain
effluents: 20%, 40%, 80%, 100% e.g.

What HappenedOEPA raised concerns about the previous 10 years WET results in 2003 discussions on NPDES permit renewal.
The City accelerated screening tests using 100% effluent, upstream, and downstream to see if a chronic toxicity issue could be identified.– Definitive testing as needed, if persistent toxicity was identified.
Try to persuade the OEPA that at worst there was an intermittent toxicity issue.
NPDES Permit 4PF00000*KD issued in 2004 with WET Limits and a compliance schedule.– Maximum TUc value of 1.8 for both species,– Quarterly testing,– Annual average limit of 1.0 TUc

Test Results Reported

Data Summary Sheet - Daphnia

Data Summary Sheet - Minnows

Toxicity Endpoints (I’m Back)
Acute– Mortality at 48 hours for Ceriodaphnia dubia– Mortality at 96 hours for Pimephales promelas
Chronic– Survival over 7 day test (both species)– Fish Growth (dry weight after test period)– Reproduction Ceriodaphnia dubia (total # of
offspring – 3 broods)

Points to PonderDo we even have Chronic Toxicity? Or is it more likely Intermittent Acute Toxicity– Does the observed toxic effect occur with test initiation– Or is it observed after a subsequent static renewal interval?
Do we have Intermittent Chronic Toxicity?– Is it related to the time of year the test was done (winter vs.
summer)– Was it related to plant construction activities or start up of new
processes, chemical addition, etc.Intermittent Dilution Water Toxicity – upstream controlWhat if all three conditions occur

Data Summary Sheets

Compliance ProcedureWhat was required by the Permit– Initiate a Toxicity Reduction Evaluation (TRE) by
December of 2005.– Submit a General Plan for “Toxicity” Reduction in
March 2006.– Execute the General Plan.– Submit Annual Reports (September 2006, 2007,
2008, 2009)– Submit a Specific Plan for “Toxicity” reduction due
January 2008.– Full Compliance by November 2009

TRE - What We didSecured the services of a consultant to help us through the process.The TRE is a two stage processToxicity Identification Evaluation (TIE) is a series of tests (on an effluent exhibiting toxic characteristics) to determine what is the physical, chemical, or biological property of the effluent causing toxicity.TRE is an engineering evaluation of plant processes to provide the treatment solution(s) necessary to remove the cause identified in the TIE.

General Plan Activities
Review of Sampling and QA/QC protocolsWET Laboratory review and selectionEngineering review of Plant process to identify possible plant toxicity sources– Chemicals used in treatment processes– Recycle streams– Stormwater controls
Review of Significant Industrial Users to Identify possible external sources of toxicity

TIE/TRE Process
What is Required for to Conduct a TIE?
Persistent Effluent toxicity as a result of physical, chemical or biological constituents in the effluent.

TIE – Two Tier ApproachTier 1 – Approach involves manipulation of effluent samples:– Filtration– Aeration– Use of additives to chelate or reduce toxicants
(EDTA)– Minor pH adjustments– Phase Separation techniques with C18 solid phase
extraction (SPE) resin to remove possible organicsSamples manipulated at the initial pH of the effluent (pHi )

TIE – Two Tier Approach (Cont.)
Tier 2 – Consists of performing the same manipulation steps on the effluent after adjusting samples to pH 3 and pH 10.– After manipulation completion readjust pH to
effluent pHi
Compare the results with an unaltered effluent sample.

Results of Sampling

Specific Plan
Plant improvements required to attain compliance – Report due 01/01/2008– Demonstration that “Toxicity” meets limits– Plant modifications or process changes identified.– Pre-treatment Program changes required.– Demonstration that toxicity is not persistent,
reproducible or identifiable.– Complete a PTI if required.– Schedule for construction.

2008 – 2010Continued monitoring Effluent using definitive testing on a quarterly basis as outlined in the permit.Formally requested removal of the limit from the permit - Part II, Paragraph Z.Met with Ohio EPA to discuss permit renewal.Successfully had WET limits removed from NPDES permit 4PF00000*OD (August 2010) and sampling frequency reduced to semi-annual.

Lessons LearnedProcess changes to accommodate various construction related activities can significantly impact stable operations, which in turn may influence the WET. (Ammonia – bleed through, start up shutdown of Sodium Hypochlorite/Bisulfite chemical system, change in polymer, salt on floors, etc.)Dilution Series may need to be adjusted to bracket the higher end of the scale: 20%, 40%, 60%, 80%, 100% to get more definitive results.Upstream Toxicity or the additive effects thereof, when combined with effluent, may need to be identified. – Combined Sewer discharges and other point and non-point
source discharges may influence results Use of Moderately Hard Re-constituted Water for dilution water may be required if persistent upstream toxicity exists.

Lessons Learned
Data Interpretation– The TU number should not be a stand alone
value devoid of the context in which it was generated.

Acknowledgements
Dan Markowitz, PhD. MPI/ArcadisChris Tarr, GLECTanna Rhoads, Chemist II JPWWTP