town centre study 2011 report - transport for...
TRANSCRIPT

Town centre study 2011 10062 September 2011

Confidentiality Please note that the copyright in the attached report is owned by TfL and the provision of information under Freedom of Information Act does not give the recipient a right to re-use the information in a way that would infringe copyright (for example, by publishing and issuing copies to the public). Brief extracts of the material may be reproduced under the fair dealing provisions of the Copyright, Designs and Patents Act 1988 for the purposes of research for non-commercial purposes, private study, criticism, review and news reporting. Details of the arrangements for reusing the material owned by TfL for any other purpose can be obtained by contacting us at [email protected]. Research conducted by Accent

CONTENTS Executive Summary .................................................................................................................... i
1. INTRODUCTION ............................................................................................................. 1 1.1 Background ....................................................................................................................... 1 1.2 Objectives .......................................................................................................................... 1
2. METHODOLOGY ............................................................................................................ 2 2.1 Introduction ....................................................................................................................... 2 2.2 Method ............................................................................................................................... 3
3. FINDINGS ........................................................................................................................ 6 3.1 Introduction ....................................................................................................................... 6 3.2 Purpose of Visit ................................................................................................................. 7 3.3 Time Spent in Town Centre ............................................................................................ 11 3.4 Frequency of Visiting ...................................................................................................... 13 3.5 Mode of Transport ........................................................................................................... 16 3.6 Attitudes to and Use of Bus ............................................................................................. 26 3.7 Encouraging Cycling ....................................................................................................... 35 3.8 Attitudes towards Town Centres ..................................................................................... 36 3.9 Use of Other Shopping Centres ....................................................................................... 41 3.10 Oxford Street/Regent Street ............................................................................................ 43 3.11 Shopping and Expenditure in the Area ............................................................................ 46 3.12 Average Spend ................................................................................................................ 48 3.13 Online Shopping .............................................................................................................. 54 3.14 Respondent Characteristics ............................................................................................. 57
4. CYCLE RESULTS .......................................................................................................... 70 4.1 Introduction ..................................................................................................................... 70 4.2 Purpose of Visit ............................................................................................................... 70 4.3 Time Spent in Town Centre ............................................................................................ 71 4.4 Frequency of Visiting ...................................................................................................... 71 4.5 Mode of Transport ........................................................................................................... 72 4.6 Attitudes and Use of Bus ................................................................................................. 73 4.7 Encouraging Cycling ....................................................................................................... 75 4.8 Attitudes towards Town Centres ..................................................................................... 77 4.9 Use of Other Shopping Centres ....................................................................................... 78 4.10 Oxford Street/Regent Street ............................................................................................ 79 4.11 Shopping and Expenditure in the Area ............................................................................ 80 4.12 Average Spend ................................................................................................................ 81 4.13 Online Shopping .............................................................................................................. 82 4.14 Respondent Characteristics ............................................................................................. 82 Appendix A: Paper Version of Questionnaire
Appendix B: Key Results by Town Centre
Appendix C: Response and Weighting Factors
Appendix D: Cycle Booster Key Results

Page i of iii
EXECUTIVE SUMMARY Introduction TfL commissioned research to establish the contribution made by bus users and other modes to the economic health and viability of town centres across London. This research follows previous town centres studies in 2009, 2003-4 and 1999. The locations varied between studies although a few were covered in one or more. The locations were always a mix of regional, local and international town centres. Method Face-to-face research was conducted on-street with a sample of about 300 visitors to each of 15 town centres. • Central London: Oxford Street/Regent Street • Inner London: Camberwell, Clapham Junction, Greenwich, Hackney, Enfield,
Stratford • Outer London: Bromley, Bexleyheath, Croydon, Ealing, Harlesden, Harrow,
Kingston, Wood Green. Fieldwork was conducted between 3 and 27 March 2011. 4,746 interviews were conducted, about 300 at each town centre. In addition, at seven town centres boosters of about 50 cyclists were interviewed. Main Findings • Purpose of Visit
− The majority of visitors to most town centres lived and/or worked more than ten minutes walk from the town centre.
− Shopping was the main reason for visiting the town centres: for 78% it was one of the purposes and for 53% the main purpose. Eating and drinking out was also important being mentioned by 22% but was only the main purpose for 5%.
• Time Spent in Town Centre
− 75% of visitors were planning to spend at least one hour in the town centre with 49% spending between one and three hours.
− Those who walked and cycled to the area tended to spend less time in the town centre. Those who travelled by train/Tube (85%), car (81%) and bus (77%) were planning to spend more than an hour in the town centre.
• Frequency of Visiting
− 75% of visitors were visiting the area once a week or more often. The average number of visits per month was 11.
− Those who walk to the area are the most frequent visitors (51% visit five days a week or more) followed by cyclists (38%) and bus users (26%). Car users visit less often (16%).

Page ii of iii
• Shopping and Expenditure in the Area − 46% were shopping for groceries and food, 33% were shopping for clothes or
footwear, 18% were using a service and 17% were eating out. − The average spend was £36 on the day of interview which is similar to the usual
spend per visit (£32). The average spend per week was £72. The mean monthly spend is £290
− Average spend per visit by mode was car £41, train/Tube £38, bus £32, walk £26 and cycle £21.
− Average spend per week by mode was walk £93, bus £70, train/Tube £59, car £56 and cycle £47
− Average spend per month by mode was walk £373, bus £282, train/Tube £239, car £226 and cycle £188.
• Mode of Transport
− 36% use bus to access the town centre, 28% walk, 17% use train/Tube, 14% use car and 2% cycle.
− 52% use Tube or train to go to Central London (4-5% elsewhere). 19% use car in Outer London town centres compared to 8% in Inner London and 2% in Central London.
− The main reason for using each mode is: car: quicker (32%), bus: cheaper (22%), train/Tube: quicker (48%), cycle: need/enjoy the exercise (33%) and walk: live very close by (30%).
− Walking was the most frequently used mode. The weekly mean frequency for the different modes was: car 1.7, bus 2.7, train/Tube 2.1, bicycle 3.1 and walk 3.8.
− Car drivers were satisfied with the ease of access to town centre by car and the number of parking spaces provided (mean scores of 7.1 and 6.5 respectively on a scale from 0, very dissatisfied to 10, very satisfied).
• Attitudes to and Use of Bus
− Over three quarters sometimes use the bus to travel in the area of the town centre.
− Bus use increased by 3% compared to twelve months ago − Bus customers were most positive about the ease of getting on and off the bus
(mean score 7.9) and the convenience of bus stops (7.7). Bus users were least satisfied with the level of crowding on the bus (6.8) and value for money (6.9).
− There was strong agreement that there should be stricter bus lane enforcement (mean score 7.8), that bus stops are conveniently located (7.6) and for goods vehicles not to be allowed in bus lanes (6.9).
− The top three single factors that would encourage greater use of the bus were lower fares (12%), more regular buses (9%) and direct bus routes (7%).
• Attitudes towards Town Centres
− The main ways that the town centres could be improved were better range of shops (30%), to make the streets cleaner (26%) and less traffic (21%).
− 66% of town centre visitors felt very safe and 28% felt fairly safe during the day. Of those who went out in the town centre after dark, only 26% said they felt very safe and 39% fairly safe.

Page iii of iii
• Oxford Street/Regent Street − Oxford Street is visited because of its shopping facilities: 27% considered it to
be the best shopping area, 21% were visiting a particular shop and 15% cited ‘more/better/bigger range of shops’.
− 36% were aware of the changes to travel around Tottenham Court Road. This is twice the proportion as in 2009.
− Of those who were aware 51% knew it was because of building rail/Crossrail station.
− Only 8% of visitors to Oxford Street/Regent Street said they were affected by the travel changes around Tottenham Court Road.
− 53% had used the diagonal crossing at Oxford Circus and there were very high levels of satisfaction with both the safety and ease of crossing the road on the diagonal crossing.

Page 1 of 85
1. INTRODUCTION
1.1 Background
TfL has made significant improvements to and investment in the transport infrastructure in London resulting in high levels of bus use as well as increasing levels of cycle and walking trips. TfL commissioned research to establish the contribution made by bus users and other modes to the economic health and viability of town centres across London. This research follows previous town centres studies in 2009, 2003-4 and 1999.
1.2 Objectives
The main objective of the research is to determine the shopping behaviour, frequency and spend of visitors by different modes in selected town centres. Other specific objectives are: • to look at modal split, catchment area by mode and perceptions of accessibility • to compare the shopping behaviour and contribution of bus passengers to car users
and users of other modes including walk and cycle.

Page 2 of 85
2. METHODOLOGY
2.1 Introduction
The research was conducted on-street with a sample of visitors to each of the selected town centres The research was undertaken in 15 locations around London. These were selected by TfL in order to provide a range of different types of centre in terms of economic mix, scale of retail activity/presence of major stores, transport networks, road layout, traffic flow, parking provision etc as well as allowing for some comparisons with previous Town Centres surveys. The locations were: • Bexleyheath • Bromley • Camberwell • Clapham Junction • Croydon • Ealing • Greenwich • Hackney • Harlesden • Harrow • Kingston • Oxford Street/Regent Street • Stratford • Wood Green • Woolwich. Bromley, Kingston and Oxford Street/Regent Street were also surveyed in 2009 and 2004. Camberwell, Clapham Junction, Croydon, Hackney and Wood Green were also surveyed in 2009. Harlesden and Harrow were also surveyed in 2004. For analysis purpose these were grouped as follows: • Central London: Oxford Street/Regent Street • Inner London: Camberwell, Clapham Junction, Greenwich, Hackney, Enfield,
Stratford • Outer London: Bromley, Bexleyheath, Croydon, Ealing, Harlesden, Harrow,
Kingston, Wood Green. In addition, analysis was undertaken by the town centre categories as used in the London Plan. • International: Oxford Street/Regent Street • Metropolitan: Bromley, Croydon, Ealing, Wood Green, Harrow, Kingston • Major: Bexleyheath, Clapham Junction, Woolwich, Stratford • District: Harlesden, Camberwell, Hackney, Greenwich.

Page 3 of 85
2.2 Method
Face-to-face interviews using a Computer Aided Personal Interview (CAPI) questionnaire programmed for Personal Digital Assistants (PDAs) were undertaken for the majority of the fieldwork. This was supplemented with face-to-face interviews using paper questionnaires1. At each town centre interviewing was conducted at two or three Enumeration Points (EPs) in order to ensure that all parts of the centre were included and all types of visitor were covered. For each town centre a map was used as show material during the interviews. The maps show the specific area of interest that respondents should consider when completing the interview. Also shown on the maps are the locations where the interviewers stood to conduct the fieldwork (the Enumeration Points (EP), shown as a number in a black circle). Respondents were selected using a random 1 in 3 approach. All interviews were conducted with adult visitors to the area. Visitors were described as anyone visiting the town centre (as shown on a map) to use the shops or facilities (ie retail based facilities/services, entertainment etc) of the town centre at the time of interview. Those just passing through (eg on their way to work, just happen to live/work in the area and not using the shops/facilities at that time) were excluded (except at Oxford Street/Regent Street). The core fieldwork was conducted between 3 and 27 March 2011. The target was 300 interviews in each of the town centres: 4,500 interviews in total. In practice 4,746 interviews were conducted as follows: • Camberwell 316 • Clapham Junction 330 • Croydon 298 • Bexleyheath 313 • Bromley 364 • Ealing 299 • Greenwich 325 • Hackney 318 • Harlesden 303 • Harrow 295 • Kingston 319 • Oxford Street/Regent Street 321 • Stratford 313 • Wood Green 331 • Woolwich 301. 1 for technical reasons eg when batteries ran low

Page 4 of 85
The cycle boosters were conducted between 3 March and 8 April 2011. Interviews were spread over different days and times in order to provide a spread of different types of visitor to the town centre locations. Interview shift times were: • Weekdays: 08:00-14:00 and 12:00 to 18:00 • Saturdays: 10:00-16:00 and 12:00 to 18:00 • Sundays: 11:00-17:00. The target distribution of interviews was 70% weekday, 20% Saturday and 10% Sunday. The initial shift distribution was: 69% weekday, 25% Saturday and 6% Sunday and the achieved interview distribution was 69% weekday, 24% Saturday and 7% Sunday. Weights were applied so that the data matched the target distribution by weekdays, Saturdays and Sundays. Details of the weighting factors applied to the data are included in Appendix C. Where the town centre had been covered before we used the same EPs as before. For ‘new’ town centres2 the selection of the locations was on the basis that they provided good customer traffic flow, eg central points within the town. Cycle Boosters At the following seven town centres cycle boosters were undertaken with the aim of achieving 50 interviews with those who accessed the town centre by cycle. • Bexleyheath • Bromley • Croydon • Ealing • Harrow • Kingston • Oxford Street/Regent Street. Questionnaire The questionnaire was based on the one used in the previous Town Centre surveys. The previous questionnaires were mainly based on the impact of bus service improvements. This research focused less on bus and included the following ‘new’ areas: • Road safety for cyclists and pedestrians • Diagonal crossings at Oxford Circus • On line shopping • Encouraging cycling. A copy of the paper version of the final questionnaire is included in Appendix A.
2 Bexleyheath, Ealing, Greenwich, Stratford and Woolwich

Page 5 of 85
Pilot A small scale pilot was conducted on Friday 18 February to test the questionnaire, the recruitment procedure and response rate.

Page 6 of 85
3. FINDINGS
3.1 Introduction
This chapter sets out the findings of the 2011 Town Centre study. Changes over time A similar research approach and questionnaire has been used in the last three phases of town centres studies (2011, 2009 and 2003-4) and this provides an opportunity for temporal comparisons. A 1999 study into town centres covered some of the same questions as the three more recent studies and covered 12 town centres of which Harrow was the only town centre also covered in 20113. The table below sets out which town centres have been covered over the last three studies. As only three town centres have been covered in all three surveys (dark grey shading) and another eight have been covered in two of the surveys (light grey shading) the comparisons for key data in this report have been made across the overall samples for all three surveys. 2004 2009 2011 Bexleyheath Bromley Camberwell Chingford Clapham Junction Croydon Dalston Ealing Eltham Enfield Feltham Greenwich Hackney Harlesden Harrow High Street Kensington Ilford Kingston Neasden Oxford Street/Regent Street Peckham Richmond Romford Stratford Wembley Wood Green Woolwich
3 Of the other 11 town centres only Richmond and Eltham were also covered in 2004 or 2009.

Page 7 of 85
Structure The research findings are structured as follows: • Nature of visit
− 3.2 Purpose of Visit − 3.3 Time Spent in Town Centre − 3.4 Frequency of Visiting
• Travel to town centre − 3.5 Mode of Transport − 3.6 Attitudes to and Use of Bus − 3.7 Encouraging Cycling
• Attitudes
− 3.8 Attitudes towards Town Centres − 3.9 Use of Other Shopping Centres
• Oxford Street/Regent Street • Goods purchased and spend
− 3.11 Shopping and Expenditure in the Area − 3.12 Average Spend − 3.13 Online Shopping
• Respondent Characteristics. Appendix B contains data on demographics, mode of access, frequency of visit, main purpose, spend and town centre improvements by town centre. Further data is available on request.
3.2 Purpose of Visit
Summary The majority of visitors to most town centres lived and/or worked more than ten minutes walk from the town centre. Visitors to Inner London town centres were much more likely to live within 10 minutes of the centre (34%) than those visiting Outer London town centres (25%) or Central London (3%). Shopping was the main reason for visiting the town centres: for 78% it was one of the purposes and for 53% the main purpose. Eating and drinking out was also important being mentioned by 22% but was only the main purpose for 5%. The town centres are used by both those who live and work in the area and by visitors from outside the area. The majority (63%) do not live or work within 10 minutes walk of the town centre but 24% live in the area, 9% work in the area and 4% both live and work within 10 minutes walk of the town centre.

Page 8 of 85
Figure 1: Whether live or work within 10 minutes walk
Both4%
Work within 10 minutes walk
9%
Live within 10 minutes walk
24%
No, neither63%
Weighted base: all respondents: 4,745 Figure 2 shows that those visiting Inner London town centres were much more likely to live within 10 minutes of the centre (34%4) than those visiting Outer London town centres (25%) or Central London (3%). Figure 2: Whether live or work within 10 minute walk by type of centre
2
30
21
15
10
8
1
4
4
82
56
67
0 10 20 30 40 50 60 70 80 90 100
Central London
Inner London
Outer London
% Respondents
Live within 10 minutes walk Work within 10 minutes walk Both No, neither
Weighted base: Central London 320; Inner London 1,904; Outer London 2,521 Oxford Street/Regent Street and Bromley were the locations most likely to attract visitors from a wider catchment area (82% and 77% respectively from more than 10 minutes walk away). By contrast, over half of those visiting Harlesden and Clapham
4 30% live and 4% live and work

Page 9 of 85
Junction (56% and 54% respectively) and half visiting Camberwell lived or worked within 10 minutes of the town centre. Comparison over time There has been a slight increase over time in the proportion visiting town centres from further than 10 minutes walk away.
2011 2009 2004 Live/work within 10 minutes walk 37% 38% 41% Neither 63% 62% 59%
Reasons for visiting town centre All visitors were recruited on the basis that they were shopping, using a service or doing both in the centres5. Shopping was the predominant purpose and the main reason for visiting for just under eight in ten of the visitors. Eating and drinking out was also important, being mentioned by 22%, but was only the main purpose for 5%. All reasons and the main reasons for visiting the area are as shown in Table 1. Table 1: Reasons for visiting town centre
All purposes %
Main purpose %
Shopping 78 53 Eating/drinking out 22 5 Using service 20 8 Live here 14 6 Work here 12 10 Window shopping 9 2 Other social/leisure 6 2 Personal business 6 4 Visiting friends and relatives 6 3 Using public amenity 5 3 General recreation 3 1 Travelling through the area 3 1 Dropping off/picking up friend or relative 1 1 Buying petrol * * Delivering goods * * Other 2 1 Weighted base 4,746 4,742
* = less than 0.5% Table 2 shows the reasons for visiting according to the type of centre. Comparisons between centres suggest that those visiting Central London were more likely to be doing so because they work there.
5 Although at Oxford Street those only working or living there were also in scope

Page 10 of 85
Table 2: Reasons for visit by type of centre
Central London Inner London Outer London
All
purposes %
Main purpose
%
All purposes
%
Main purpose
%
All purposes
%
Main purpose
% Shopping 74 57 74 47 82 57 Eating/drinking out 22 4 22 6 21 5 Using service 7 3 22 9 20 8 Live here 1 0 17 8 13 6 Work here 18 15 12 10 11 9 Window shopping 10 4 8 1 9 1 Other social/leisure 4 1 8 3 4 2 Personal business 7 5 7 4 6 4 Visiting friends and relatives 3 2 6 2 6 3 Using public amenity 4 2 6 3 5 2 General recreation 2 1 3 1 3 1 Travelling through the area 4 2 4 1 3 1 Dropping off/picking up friend
or relative 1 1 1 1 1 *
Buying petrol * * * 0 1 * Delivering goods 0 0 1 * * * Other 2 2 2 2 1 1 Weighted base) 321 321 1,904 1,903 2,521 2,518
* = less than 0.5% All reasons The reasons for visiting were similar for all areas as shown in Appendix B. However, those visiting Camberwell and Greenwich were less likely to be there for shopping compared with other centres (60% and 66% of visitors respectively compared to between 71% and 86% for the other town centres). Only 7% were using a service at Oxford Street/Regent Street compared to between 13% and 28% elsewhere. A third were eating or drinking out in Greenwich as were 30% in Bromley and 29% in Croydon compared to between 14% and 23% elsewhere. Main Reason As regards the main reason for being in the centre the most notable variations from the average were in Woolwich where a higher proportion were shopping (65%) and in Greenwich and Camberwell where the lowest proportion were shopping (26% and 40% respectively). At Greenwich 11% were eating/drinking out compared to between 2% and 8% elsewhere and 10% were undertaking another social/leisure activity compared to between 1% and 5% elsewhere The main reason for visiting each centre is shown in Table 68 in Appendix B.

Page 11 of 85
Comparison over time Main changes over time are that shopping has decreased and ‘work here’ and ‘live here’ have increased.
Main reason 2011 2009 2004 Shopping 53% 58% 64% Eating/drinking out 5% 7% 3% Using services 8% 10% 8% Live here 6% 2% 4% Work here 10% 3% 7% Personal business 4% 4% 3% Window shopping 2% 2% 1% Visiting friends and relatives 3% 2% 1% Using public amenity 3% 4% 1% Other social/leisure 2% 5% 1%
3.3 Time Spent in Town Centre
Summary Three quarters of visitors were planning to spend at least one hour in the town centre with 49% spending between one and three hours. Those who walked and cycled to the area tended to spend less time in the town centre. Those who travelled by train/Tube (85%), car (81%) and bus (77%) were planning to spend more than an hour in the town centre.
The majority (75%) said they were planning to spend at least one hour in the town centre with 49% spending between one and three hours. Figure 3: Time spent in town centre
1
5
17
49
26
1
*
0 10 20 30 40 50 60 70 80 90 100
Under 5 minutes
5-14 minutes
15-29 minutes
30-59 minutes
1-3 hours
More than 3 hours
Don't know
% Respondents Weighted base: all respondents: 4,731 * = less than 0.5%

Page 12 of 85
Eighty-six per cent in Oxford Street/Regent Street spent over one hour in the town centre compared to 78% in Outer London town centres and 69% in Inner London town centres. Figure 4: Time spent in town centre by type of centre
2
1
1
7
4
8
21
16
40
43
54
46
26
24
4
1
1*
*
*
0 10 20 30 40 50 60 70 80 90 100
Central London
Inner London
Outer London
% Respondents
Under 5 minutes 5-14 minutes 15-29 minutes 30-59 minutes1-3 hours More than 3 hours Don't know
Weighted base: Central London 320; Inner London 1,899; Outer London 2,512 * = less than 0.5% Those in the West End, Kingston, Croydon, Greenwich and Bromley were planning on spending the most time in the town centre (an average of 2.6 hours for Oxford Street/Regent Street and 2.3 hours for the other town centres). Those in Harlesden (1.6 hours), Camberwell (1.7 hours) and Hackney (1.8 hours) were making the briefest visits. Those who walked and cycled to the area tended to spend less time in the town centre but high proportions of those who travelled by train/Tube (85%), car (81%) and bus (77%) were planning to spend more than an hour in the town centre.

Page 13 of 85
Figure 5: Time spent in town centre by mode
1
4
2
3
4
3
16
8
2
14
17
10
23
24
8
54
53
41
33
45
60
27
24
44
21
19
28
1
1
2
3
1
3
*
*
*
1
*
0% 10% 20% 30% 40% 50% 60% 70% 80% 90% 100%
Car
Bus
Train/tube
Bicycle
Walk
Taxi/minicab/other
Under 5 minutes 5-14 minutes 15-29 minutes 30-59 minutes1-3 hours More than 3 hours Don't know
Weighted base: car 749, bus 1,723, train/Tube 768, bicycle 110, walk 1,317, taxi/minicab/other 65 * = less than 0.5%
3.4 Frequency of Visiting
Summary Three quarters of visitors were visiting the area once a week or more often. The average number of visits per month was 11. Bus users visit the centres frequently (26% visit five days a week or more often). Those who walk to the area are the most frequent visitors (51% visit five days a week or more). Cyclists are the next most frequent visitors (38% visit five days a week or more). Car users visit less often (16% visiting five days a week or more). The majority visit the town centre on a regular basis with 75% visiting the area once a week or more often as shown in Figure 6. The exception to this is in the West End where only 45% said they visited the area once a week or more often.

Page 14 of 85
Figure 6: Frequency of visiting town centre
2
7
8
7
15
13
16
31
0 10 20 30 40 50 60 70 80 90 100
First time
Less than once a month
About once a month
Once a fortnight
Once a week
2 days a week
3 or 4 days a week
5 or more days a week
% Respondents Weighted base: all respondents: 4,745 The average number of visits per month was 116. This is the same as the average in 2009 and slightly higher than the average of 10 in 2004. Figure 7: Frequency of visiting area by type of centre
20
38
28
7
16
16
7
13
14
11
15
17
9
5
8
15
5
8
22
6
7
8
2
2
0% 10% 20% 30% 40% 50% 60% 70% 80% 90% 100%
Central London
Inner London
Outer London
5 or more days a week 3 or 4 days a week 2 days a weekOnce a week Once a fortnight About once a monthLess than once a month First time
10.5
12.4
6.8
monthly mean
Weighted base: Central London 321; Inner London 1,904; Outer London 2,521 Harlesden is the centre visited most frequently (92% visit once a week or more often) and Camberwell, Hackney, Clapham Junction and Ealing also have a high proportion of frequent visitors (87%, 84%, 82% and 82% respectively visit once a week or more).
6 Details of mean score calculation are included in Appendix C

Page 15 of 85
Croydon, Kingston and Bromley have a relatively low proportion of frequent visitors (67%, 66%, and 65% respectively visit once a week or more). See Table 70 in Appendix B. Bus users visit the centres frequently (26% visit 5 days a week or more often), however, as might be expected, those who walk to the area are the most frequent visitors (51% visit five days a week or more). Cyclists are the next most frequent visitors (38% visit five days a week or more). Car users, however, tend to visit slightly less often with 16% visiting 5 days a week or more often as shown in Table 3. Tube/train users also visit less frequently with 23% visiting 5 days a week or more often. Table 3: Frequency of visit by mode of access
Car %
Bus %
Train/Tube%
Bicycle %
Walk %
Taxi/mini-cab/ other
% 5 or more days a week 16 26 23 38 51 27 3 or 4 days a week 11 16 13 17 19 18 2 days a week 15 16 8 13 11 5 Once a week 18 19 11 14 11 21 Once a fortnight 13 8 8 4 3 5 About once a month 14 7 12 4 2 10 Less than once a month 11 6 16 8 1 13 First time 2 1 8 2 1 1 Weighted base 751 1728 769 111 1321 65
Frequency of visit by town centre categories used in the London Plan is shown in Table 4. This shows that the highest frequency of visit is from visitors to District town centres and the lowest frequency of visit is from visitors to International town centres. Table 4: Frequency of visit by London Plan town centre category
International
% Metropolitan
% Major
% District
% 5 or more days a week 20 26 33 41 3 or 4 days a week 7 15 17 18 2 days a week 7 13 14 14 Once a week 11 17 17 12 Once a fortnight 9 9 7 5 About once a month 15 9 6 4 Less than once a month 22 8 5 5 First time 8 2 1 2 Monthly mean 6.8 9.9 11.6 13.2 Weighted base 321 1905 1258 1262
Comparison over time Little change in frequency of visit over time.
2011 2009 2004 Once a week or more 75% 73% 73% Once a fortnight 7% 8% 7% Once a month 8% 8% 9% Less often 9% 9% 11%
Page 16 of 85
3.5 Mode of Transport
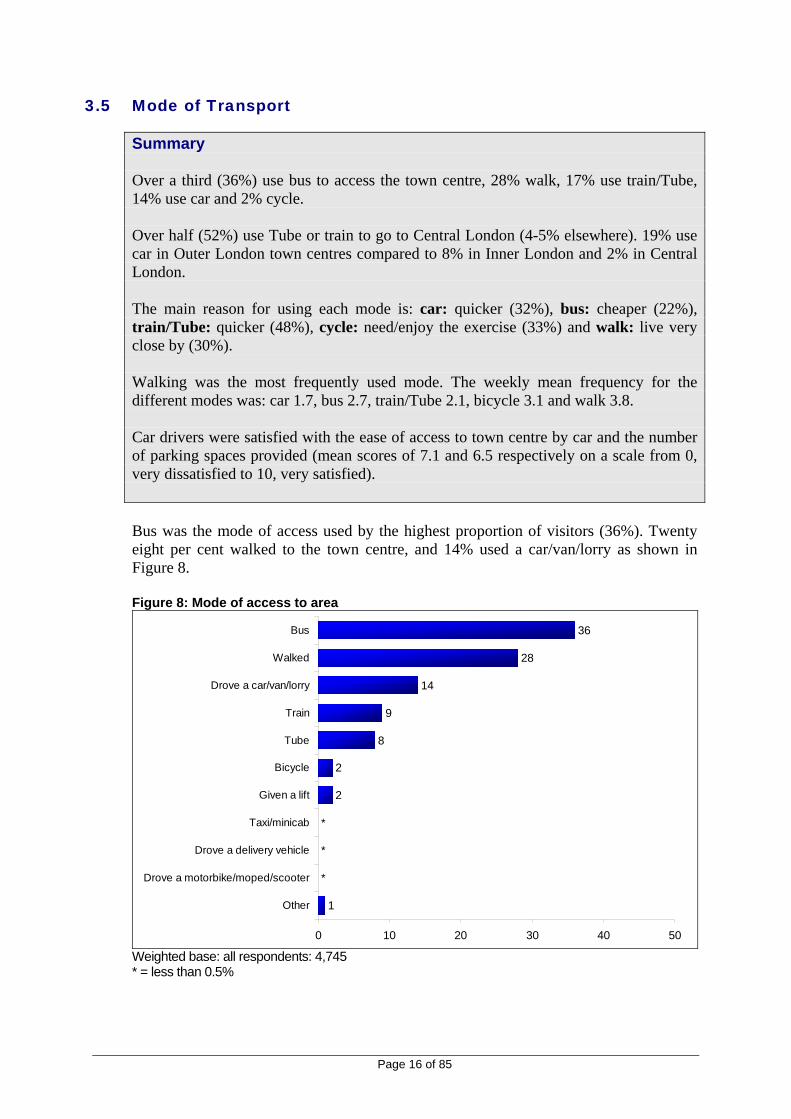
Summary Over a third (36%) use bus to access the town centre, 28% walk, 17% use train/Tube, 14% use car and 2% cycle. Over half (52%) use Tube or train to go to Central London (4-5% elsewhere). 19% use car in Outer London town centres compared to 8% in Inner London and 2% in Central London. The main reason for using each mode is: car: quicker (32%), bus: cheaper (22%), train/Tube: quicker (48%), cycle: need/enjoy the exercise (33%) and walk: live very close by (30%). Walking was the most frequently used mode. The weekly mean frequency for the different modes was: car 1.7, bus 2.7, train/Tube 2.1, bicycle 3.1 and walk 3.8. Car drivers were satisfied with the ease of access to town centre by car and the number of parking spaces provided (mean scores of 7.1 and 6.5 respectively on a scale from 0, very dissatisfied to 10, very satisfied). Bus was the mode of access used by the highest proportion of visitors (36%). Twenty eight per cent walked to the town centre, and 14% used a car/van/lorry as shown in Figure 8. Figure 8: Mode of access to area
1
2
2
8
9
14
28
36
*
*
*
0 10 20 30 40 50
Other
Drove a motorbike/moped/scooter
Drove a delivery vehicle
Taxi/minicab
Given a lift
Bicycle
Tube
Train
Drove a car/van/lorry
Walked
Bus
Weighted base: all respondents: 4,745 * = less than 0.5%

Page 17 of 85
Almost three quarters (74%7) of those who lived within a ten minute walk of the town centre walked there. Table 5: Mode of access to area by whether live or work within 10 minutes walk of centre
Live %
Work %
Both %
Neither %
Drove a car/van/lorry 4 15 7 18 Drove a motorbike/moped/scooter * 0 1 * Drove a delivery vehicle 0 * 0 * Given a lift * 2 0 2 Bus 14 39 22 45 Tube 1 14 1 10 Train 2 16 4 10 Bicycle 2 2 2 3 Walked 75 12 63 10 Taxi/minicab * * 0 1 Other 1 * 1 1 Weighted base 1121 443 176 3003
Figure 9 shows that the most popular means of transport used to reach Central London was the Tube (52%). Almost a fifth (19%) drove to the Outer London town centres compared to 8% for Inner London and just 1% for Central London. Over a third (35%) walked to the town centre in Inner London compared to a quarter in Outer London and 8% in Central London. Figure 9: Mode of access to area by type of centre
24
37
37
8
35
25
2
8
19
11
10
7
52
4
5
1
3
2
1
1
3
1
11
1*
*
0% 10% 20% 30% 40% 50% 60% 70% 80% 90% 100%
Central London
Inner London
Outer London
Bus Walked Drove a car/van/lorryTrain Tube BicycleGiven a lift Taxi/minicab Other
Weighted base: Central London 321; Inner London 1,904; Outer London 2,521 * = less than 0.5% Walking was the predominant means of accessing the town centre in Harlesden (45%), Camberwell (42%), Clapham Junction (37%) and Greenwich (34%). Tube was the predominant means of accessing Oxford Street/Regent Street (52%). At all other centres bus was the predominant means of access. 7 Weighted average of 75% who live within 10 minutes walk and 63% who live and work within 10 minutes walk

Page 18 of 85
Bus use was particularly high in Bexleyheath (52%) and lowest in Oxford Street/Regent Street (24%). Bus use in Oxford Street/Regent Street was also 24% in 2009 and 2004. Tube use was particularly high in Oxford Street/Regent Street (52%) and there is no Tube service in Bexleyheath, Bromley and Croydon. Car use was highest in Bromley (29%) and Harrow (27%) and very low in Oxford Street/Regent Street (2%), Clapham Junction (4%) and Camberwell (5%). Train use was highest in Croydon (19%), non existent in Bexleyheath, and very low in Camberwell (3%), Wood Green (3%), Harlesden (4%) and Harrow (4%). Walking as an access mode was highest at Harlesden (45%) and Camberwell (42%) and lowest at Oxford Street/Regent Street (8%) and Bromley (15%). In Croydon, 6% mentioned tram. See Table 69 in Appendix B for a full breakdown. Comparison over time There has been a steady decrease in car use over time. The largest change since 2009 is an increase in walking.
2011 2009 2004 Bus 36% 38% 34% Walk 28% 25% 29% Car 14% 16% 20% Train/Tube 17% 17% 14% Bicycle 2% 2% 1%
Characteristics of users of different modes Bus users were more likely to be female, not working, retired, non White and have lower household incomes than other mode users. Car users were more likely to be older, working and have higher household incomes than other mode users. Train and Tube users were more likely to be younger and non White than other mode users. Cyclists were more likely to be male and White than other mode users. See Table 6.

Page 19 of 85
Table 6: Profile of mode users
Car %
Bus %
Train/ Tube
% Bicycle
% Walk
% Age 16-34 21 33 43 31 37 35-44 38 29 30 37 29 45-59 28 18 18 24 20 60+ 13 20 9 9 14 Gender Male 39 35 44 63 41 Female 61 65 56 37 59 Employment status Working 73 54 69 71 57 Student 5 9 17 9 10 Not working 9 17 6 15 19 Retired 13 20 8 5 15 Ethnic group White 77 68 68 82 74 Asian 7 6 9 1 5 Black 11 21 17 11 14 Mixed/Other 5 6 6 6 7 Household income* Under £20,000 14 46 21 34 35 £20,000-£34,999 26 27 24 18 26 £35,000-£74,999 44 22 41 37 29 £75,000 or over 16 5 15 11 10 Weighted base 750 1722 768 110 1318
* after excluding don’t knows and refuseds Why Modes used The reasons for choosing to travel by the particular mode used to access the area are shown in Table 7. Train/Tube in particular were considered to be quicker (64%), as were car (56%) and bicycle (51%). Each of these modes was also considered to be easier/more convenient than other modes. Train/Tube were also considered to be more direct (39%). A high proportion travelled by bus because it was cheaper (35%), with 15% saying it was the only mode available8. Over a third of those who walked (37%) said they lived close by and 26% said they need/enjoy the exercise. Over half of those who cycled (55%) cited low cost and (52%) said they need/enjoy the exercise.
8 Particularly those in Bexleyheath (30%), Croydon (26%) and Bromley (25%).

Page 20 of 85
Table 7: Reasons for using chosen method of transport rather than any other method of transport to access area by mode
Car %
Bus %
Train/ Tube
% Bicycle
% Walk
% Quicker 56 31 64 51 36 Cheaper/less expensive 13 35 11 55 24 More direct 30 24 39 25 16 Easier/more convenient 34 24 25 27 13 Live very close by 1 5 2 15 37 More relaxing/comfortable 15 8 8 21 8 Only method possible 5 15 9 1 3 Need/enjoy exercise/healthy * 2 * 52 26 No car/can't drive * 16 6 7 3 Avoids parking difficulties 1 11 8 16 4 Going to more than one place 15 4 2 11 4 Safer 8 6 6 3 2 Had heavy bags/shopping to carry 14 3 1 3 1 Weather issues 4 2 1 4 9 Travelling with children 6 2 1 1 2 Avoid the congestion charge * 2 2 2 1 Weighted base 751 1727 769 111 1320 Note: More than one answer may be given, so percentages may add up to more than 100% * = less than 0.5% The main reasons for choosing to travel by the particular mode used to access the area are shown in Table 8. The main reasons for each mode are: • car: quicker (32%) • bus: cheaper (22%) • train/Tube: quicker (48%) • cycle: need/enjoy the exercise (33%) • walk: live very close by (30%). Table 8: Main reason for using chosen method of transport rather than any other method of transport to access area
Car %
Bus %
Train/ Tube
% Bicycle
% Walk
% Quicker 32 17 48 23 18 Cheaper/less expensive 6 22 4 20 11 More direct 10 13 19 2 5 Easier/more convenient 20 12 11 10 5 Live very close by 1 2 1 2 30 Only method possible 4 12 6 1 2 Need/enjoy exercise/healthy * 1 * 33 17 No car/can't drive * 9 2 0 1 More relaxing/comfortable 5 3 2 6 3 Avoids parking difficulties * 5 3 2 1 Going to more than one place 9 2 1 1 2 Had heavy bags/shopping to carry 7 1 * 0 * Travelling with children 4 1 1 0 1 Safer 1 1 1 0 * Weather issues 1 1 * 0 4 Avoid the congestion charge 0 * * 0 * Weighted base 751 1727 769 111 1320 * = less than 0.5%

Page 21 of 85
Other modes of transport sometimes used Buses were the most used ‘other’ mode. Nearly three quarters of walkers (74%) sometimes used the bus and more than half train/Tube (61%), bicycle (59%) and car (58%) users also sometimes used buses to travel to the town centres. This represents a large increase in bus use by users of other modes compared to the 2004 study where 48% of walkers 40% of train/Tube, 51% of bicycle and 34% of car users also sometimes used buses to travel to the town centres. Nearly a third (31%) of bus users sometimes used a car to the town centre and 26% sometimes used the train. Nearly a third (31%) of bus and bicycle users also sometimes walk to the town centres. Table 9: Other modes used to town centre, by mode used:
Total %
Car %
Bus %
Train/ Tube
% Bicycle
% Walk
%
Taxi/ minicab/
other %
Car/van/lorry 20 6 31 20 20 15 11 Motorbike/moped/scooter 1 1 * 1 2 1 0 Bus 44 58 61 59 74 71 Tube 11 8 15 9 5 9 10 Train 15 15 26 8 8 7 14 Bicycle 5 2 4 2 0 9 5 Barclays Cycle Hire * 0 * * 0 0 0 Walked 17 19 31 11 31 10 Taxi/minicab 5 5 6 7 2 2 0 Other 1 * 1 1 0 2 0 Weighted base 2967 431 1013 524 82 881 36 * = less than 0.5% Frequency of mode use Half of those who walked to the town centre walked there five or more days a week. Cyclists were also very frequent users of the mode to the town centre with 37% who cycled to the town centre cycling there five or more days a week. Of the other modes, bus was the most frequently used (27% five or more days a week) and car the least frequently used (14% five or more days a week). The weekly mean frequency for the different modes was: • car 1.7 • bus 2.7 • train/Tube 2.1 • bicycle 3.1 • walk 3.8.

Page 22 of 85
Figure 10: Frequency of using mode to travel to this area
14
27
23
37
50
18
11
17
12
19
19
24
13
18
10
13
12
5
19
17
11
13
11
16
12
7
8
3
3
4
14
7
11
4
2
11
14
6
17
10
1
21
3
1
8
2
1
1
0% 10% 20% 30% 40% 50% 60% 70% 80% 90% 100%
Drove
Bus
Train/tube
Bicycle
Walk
Taxi/minicab/other
5 or more days a week 3 or 4 days a week 2 days a weekOnce a week Once a fortnight About once a monthLess than once a month First time
Weighted base: car 751, bus 1,726, train/Tube 767, bicycle 111, walk 1,309, taxi/minicab/other 64 Parking Those who had driven to the centre (721 people) were asked about parking in the area and ease of access to the area by car. Almost half (46%) had parked in an off-street municipal/NCP car park. Twelve per cent parked in a store/pub/take-away car park. Visitors to Outer London town centres were significantly more likely to park in an off street municipal or NCP car park than visitors to Inner London town centres. Visitors to other Inner London centres were more likely to park on a main road, side road or off street.

Page 23 of 85
Figure 11: Parking location by centre type9
7
3
5
7
6
9
12
51
8
5
11
13
13
8
12
29
7
3
6
8
8
9
12
46
*
*
0 10 20 30 40 50 60 70 80 90 100
Don't know
In filling station forecourt
On main road
Other place
Off street private parking (eg driveway)
On side road
Off street residential parking
In store/pub/take-away car park
Off street municipal/NCP car park
% Respondents
Total
Inner London
Outer London
Weighted base: 721 who had driven to area; 167 Inner London, 545 Outer London Car users to Croydon, Harrow, Ealing and Bromley were most likely to have used a municipal/NCP car park (73%, 62%, 60% and 60% respectively). Car users to Harlesden and Camberwell were most likely to park on the main road and side road (62% and 45% respectively). Car users to Camberwell were most likely to park in a store/pub/take-away car park (20%). Car users to Wood Green and Ealing were most likely to park in off street residential parking (62% and 45% respectively). Car users’ satisfaction with parking A majority of car drivers were satisfied with the ease of access to town centre by car and the number of parking spaces provided (mean scores of 7.1 and 6.5 respectively on a scale from 0, very dissatisfied to 10, very satisfied) as shown in Figure 12.
9 Only 9 parked in Central London (4 in off street municipal/NCP car park, 3 on side road and 2 didn't know) so this data not shown

Page 24 of 85
Figure 12: Satisfaction with ease of access to the area by car and number of parking spaces provided in this area
58
65
25
25
17
9
0% 20% 40% 60% 80% 100%
The number of parkingspaces provided in this
area
The ease of access tothis area by car
Very/satisfied (7-10) Neutral (4-6) Very/dissatisfied (0-3)
7.1
6.5
mean
Weighted base: 720 who drove to the town centre Car drivers to Outer London town centres were more satisfied with both the ease of access to their area by car and the number of parking spaces than were visitors to Inner London town centres. Figure 13: Satisfaction with ease of access to the area by car and number of parking spaces provided in this area by type of area
43
64
60
67
32
24
30
23
26
13
10
10
0 10 20 30 40 50 60 70 80 90 100
Inner London
Outer London
Inner London
Outer London
The
num
ber o
f par
king
spac
es p
rovi
ded
in th
isar
eaTh
e ea
se o
f acc
ess
toth
is a
rea
by c
ar
% Respondents
Very/satisfied (7-10) Neutral (4-6) Very/dissatisfied (0-3)
5.6
6.9
6.9
7.2
mean
Weighted base: those who had driven to area: Inner London 167, Outer London 545 The least satisfied with the number of parking spaces were drivers at Oxford Street/Regent Street (mean score 3.2) and Hackney (3.8) and the most satisfied with the number of parking spaces were drivers at Croydon (mean score 7.7) and Bexleyheath (7.4).

Page 25 of 85
Figure 14: Satisfaction with number of parking spaces provided by town centre
67
68
39
64
66
30
8
48
60
73
63
16
72
66
17
21
42
43
27
27
25
53
20
21
22
14
57
17
26
19
10
19
57
9
7
45
39
30
20
4
20
27
11
10
0% 10% 20% 30% 40% 50% 60% 70% 80% 90% 100%
Woolwich
Wood Green
Stratford
Oxford Street
Kingston
Harrow
Harlesden
Hackney
Greenwich
Ealing
Croydon
Clapham Junction
Camberwell
Bromley
Bexleyheath
Very/satisfied (7-10) Neutral (4-6) Very/dissatisfied (0-3)
7.4
7.3
4.6
6.1
7.7
6.1
5.2
3.8
4.6
7.0
7.0
3.2
5.7
6.8
7.2
mean
Weighted base: Bexleyheath 89, Bromley 127, Camberwell 19, Clapham Junction 14, Croydon 44, Ealing 39, Greenwich 42, Hackney 26, Harlesden 49, Harrow 79, Kingston 89, Oxford Street/Regent Street 9, Stratford 26, Wood Green 30, Woolwich 40 The least satisfied with the ease of access to the town centre were drivers at Oxford Street/Regent Street (mean score 4.4) and Harlesden (4.8) and the most satisfied with ease of access to the town centre were drivers at Woolwich and Bexleyheath (mean score 8.0). Figure 15: Satisfaction with ease of access to town centre by car by town centre
73
49
57
33
65
80
29
55
56
70
70
70
47
71
79
29
49
30
43
28
10
29
35
32
20
26
21
24
21
18
3
12
24
7
7
41
11
12
10
4
7
28
7
2
0% 10% 20% 30% 40% 50% 60% 70% 80% 90% 100%
Woolwich
Wood Green
Stratford
Oxford Street
Kingston
Harrow
Harlesden
Hackney
Greenwich
Ealing
Croydon
Clapham Junction
Camberwell
Bromley
Bexleyheath
Very/satisfied (7-10) Neutral (4-6) Very/dissatisfied (0-3)
8.0
7.5
5.9
7.0
7.6
6.9
6.5
6.7
4.8
7.3
7.4
4.4
6.7
6.6
8.0
mean
Weighted base: Bexleyheath 89, Bromley 127, Camberwell 19, Clapham Junction 14, Croydon 44, Ealing 39, Greenwich 42, Hackney 26, Harlesden 49, Harrow 79, Kingston 89, Oxford Street/Regent Street 9, Stratford 26, Wood Green 30, Woolwich 40

Page 26 of 85
3.6 Attitudes to and Use of Bus
Summary Over three quarters sometimes use the bus to travel in the area of the town centre. Bus use increased slightly compared to twelve months ago. There was a 3% increase in those that travel by bus at least once a week (from 49% to 52%), and a 3% increase in those using buses at all (from 73% to 76%). Bus customers were most positive about the ease of getting on and off the bus (mean score 7.910) and the convenience of bus stops (7.7). Bus users were least satisfied with the level of crowding on the bus (6.8) and value for money (6.9). There was strong agreement that there should be stricter bus lane enforcement (mean score 7.8), that bus stops are conveniently located (7.6) and for goods vehicles not to be allowed in bus lanes (6.9). The top three single factors that would encourage greater use of the bus were lower fares (12%), more regular buses (9%) and direct bus routes (7%). Frequency buses used to travel in town centre Over three quarters (76%) sometimes used the bus to travel in the area of the town centre, even if they did not do so on the day of interview. Over half (52%) had used bus in the area at least once a week. Just under a quarter (24%) said they never used the bus in the area. Figure 16: Frequency of travel in the area by bus
24
1
11
7
6
12
12
12
16
0 10 20 30 40 50 60 70 80 90 100
Never
First time
Less than once a month
About once a month
Once a fortnight
Once a week
2 days a week
3 or 4 days a week
5 or more days a week
% Respondents Weighted base: all respondents: 4,745 10 where 0 = very dissatisfied and 10 = very satisfied

Page 27 of 85
Frequency of using the bus was significantly different by type of town centre. Bus use was highest and most frequent in Inner London town centres: four out of five sometimes used the bus and 59% used the bus at least once a week. Bus use was lowest and least frequent to Oxford Street/Regent Street (69% sometimes used the bus, 24% used the bus at least once a week). Figure 17: Frequency of travel in the area by bus by type of centre
7
20
14
3
14
11
6
13
12
8
12
13
6
6
6
11
6
8
23
9
11
5
1
1
31
20
25
0 10 20 30 40 50 60 70 80 90 100
Central London
Inner London
Outer London
% Respondents
5 or more days a week 3 or 4 days a week 2 days a weekOnce a week Once a fortnight About once a monthLess than once a month First time Never
Weighted base: Central London 321; Inner London 1,904; Outer London 2,521 Bus use was highest in Camberwell with 92% sometimes using the bus to travel in the area. Bus use was also very high in Hackney, Harlesden, Wood Green, Woolwich and Stratford (from 84% to 80%). Bus use was lowest in Harrow, Greenwich and Oxford Street/Regent Street (from 64% to 69%).
Page 28 of 85
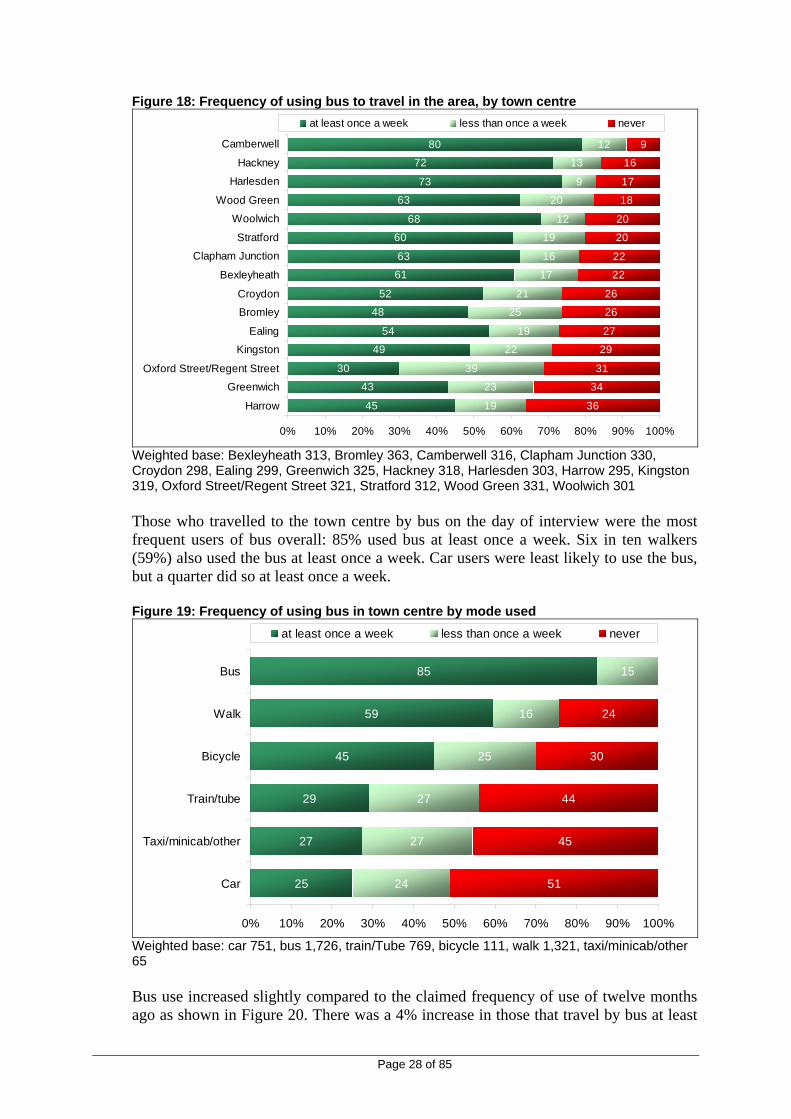
Figure 18: Frequency of using bus to travel in the area, by town centre
45
43
30
49
54
48
52
61
63
60
68
63
73
72
80
19
23
39
22
19
25
21
17
16
19
12
20
9
13
12
36
34
31
29
27
26
26
22
22
20
20
18
17
16
9
0% 10% 20% 30% 40% 50% 60% 70% 80% 90% 100%
Harrow
Greenwich
Oxford Street/Regent Street
Kingston
Ealing
Bromley
Croydon
Bexleyheath
Clapham Junction
Stratford
Woolwich
Wood Green
Harlesden
Hackney
Camberwell
at least once a week less than once a week never
Weighted base: Bexleyheath 313, Bromley 363, Camberwell 316, Clapham Junction 330, Croydon 298, Ealing 299, Greenwich 325, Hackney 318, Harlesden 303, Harrow 295, Kingston 319, Oxford Street/Regent Street 321, Stratford 312, Wood Green 331, Woolwich 301 Those who travelled to the town centre by bus on the day of interview were the most frequent users of bus overall: 85% used bus at least once a week. Six in ten walkers (59%) also used the bus at least once a week. Car users were least likely to use the bus, but a quarter did so at least once a week. Figure 19: Frequency of using bus in town centre by mode used
25
27
29
45
59
85
24
27
27
25
16
15
51
45
44
30
24
0% 10% 20% 30% 40% 50% 60% 70% 80% 90% 100%
Car
Taxi/minicab/other
Train/tube
Bicycle
Walk
Bus
at least once a week less than once a week never
Weighted base: car 751, bus 1,726, train/Tube 769, bicycle 111, walk 1,321, taxi/minicab/other 65 Bus use increased slightly compared to the claimed frequency of use of twelve months ago as shown in Figure 20. There was a 4% increase in those that travel by bus at least
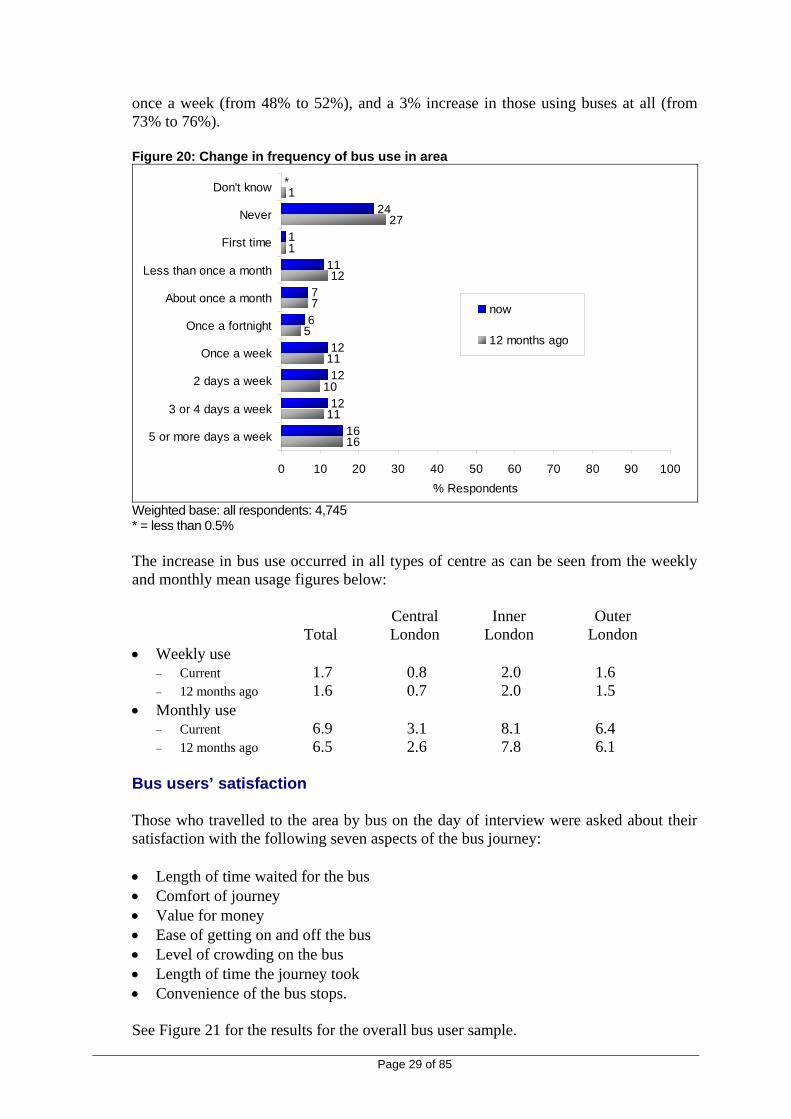
Page 29 of 85
once a week (from 48% to 52%), and a 3% increase in those using buses at all (from 73% to 76%). Figure 20: Change in frequency of bus use in area
16
11
10
11
5
7
12
1
27
1
16
12
12
12
6
7
11
1
24
*
0 10 20 30 40 50 60 70 80 90 100
5 or more days a week
3 or 4 days a week
2 days a week
Once a week
Once a fortnight
About once a month
Less than once a month
First time
Never
Don't know
% Respondents
now
12 months ago
Weighted base: all respondents: 4,745 * = less than 0.5% The increase in bus use occurred in all types of centre as can be seen from the weekly and monthly mean usage figures below: Central Inner Outer Total London London London • Weekly use
− Current 1.7 0.8 2.0 1.6 − 12 months ago 1.6 0.7 2.0 1.5
• Monthly use − Current 6.9 3.1 8.1 6.4 − 12 months ago 6.5 2.6 7.8 6.1
Bus users’ satisfaction Those who travelled to the area by bus on the day of interview were asked about their satisfaction with the following seven aspects of the bus journey: • Length of time waited for the bus • Comfort of journey • Value for money • Ease of getting on and off the bus • Level of crowding on the bus • Length of time the journey took • Convenience of the bus stops. See Figure 21 for the results for the overall bus user sample.

Page 30 of 85
Although generally positive about all the different aspects of travel by bus in the area, bus users were least satisfied with the level of crowding on the bus (mean score 6.8 on a scale of 0 to 10 were 0 = very dissatisfied and 10 = very satisfied) and the value for money (mean score of 6.9). Bus customers were most positive about the ease of getting on and off the bus (mean score 7.9) and the convenience of bus stops also scored highly (mean score 7.7). Figure 21: Satisfaction with aspects of bus travel in the area
61
61
72
72
75
79
80
24
28
21
22
20
16
15
14
12
7
6
4
3
4
0% 20% 40% 60% 80% 100%
Value for money
Level of crowding on the bus
Length of time waited for the bus
Comfort of journey
Length of time the journey took
Convenience of the bus stops
Ease of getting on and off the bus
Very/satisfied (7-10) Neutral (4-6) Very/dissatisfied (0-3)
7.3
7.9
7.7
7.5
7.3
6.8
6.9
mean
Base: 1,724 who travelled by bus Bus users in Kingston and Greenwich were generally most satisfied with bus services. Bus users in Kingston gave the highest scores for four aspects: • Length of time waited for the bus (8.13) • Ease of getting on and off the bus (8.63) • Level of crowding on the bus (7.26) • Convenience of the bus stops (8.65) Bus users in Greenwich gave the highest score for ‘value for money’ (8.07) and second highest score for four other aspects. Bus users in Croydon, Clapham Junction and Bexleyheath also gave high ratings for bus services. Those in Harlesden were least satisfied, in particular with the ‘length of time waited for the bus’ (mean score 6.49), ‘length of time the journey took’ (6.87) and ‘convenience of the bus stops’ (7.3). Those in Camberwell, Hackney and Stratford also gave low scores.

Page 31 of 85
Analysis by type of town centre shows that those in Outer London town centres have higher satisfaction scores for all aspects except ‘value for money’ and that those in Central London have lower satisfaction scores for all aspects except ‘length of time waited for the bus’ and ‘value for money’. Table 10: Summary of means scores for aspects of travel by bus in area by town centre
Total Central London
Inner London
Outer London
Length of time waited for the bus 7.34 7.24 7.17 7.43 Comfort of journey 7.33 7.20 7.26 7.36 Value for money 6.90 7.07 6.87 7.06 Ease of getting on and off the bus 7.85 7.94 7.94 7.96 Level of crowding on the bus 6.78 6.35 6.65 6.82 Length of time the journey took 7.45 7.20 7.48 7.52 Convenience of the bus stops 7.72 7.55 7.82 7.92
Mean scores calculated on a scale from 0 very dissatisfied to 10 very satisfied 1. except refused and don’t know Comparison over time Key change is ‘value for money’ for bus travel has gone down over time.
2011 2009 2004 Ease of getting on and off the bus 7.9 7.9 7.9 Convenience of the bus stops 7.7 7.8 7.8 Length of time the journey took 7.5 7.4 7.2 Length of time waited for the bus 7.3 7.4 6.7 Comfort of journey 7.3 7.3 7.0 Value for money 6.9 7.3 7.4 Level of crowding on the bus 6.8 6.8 6.6
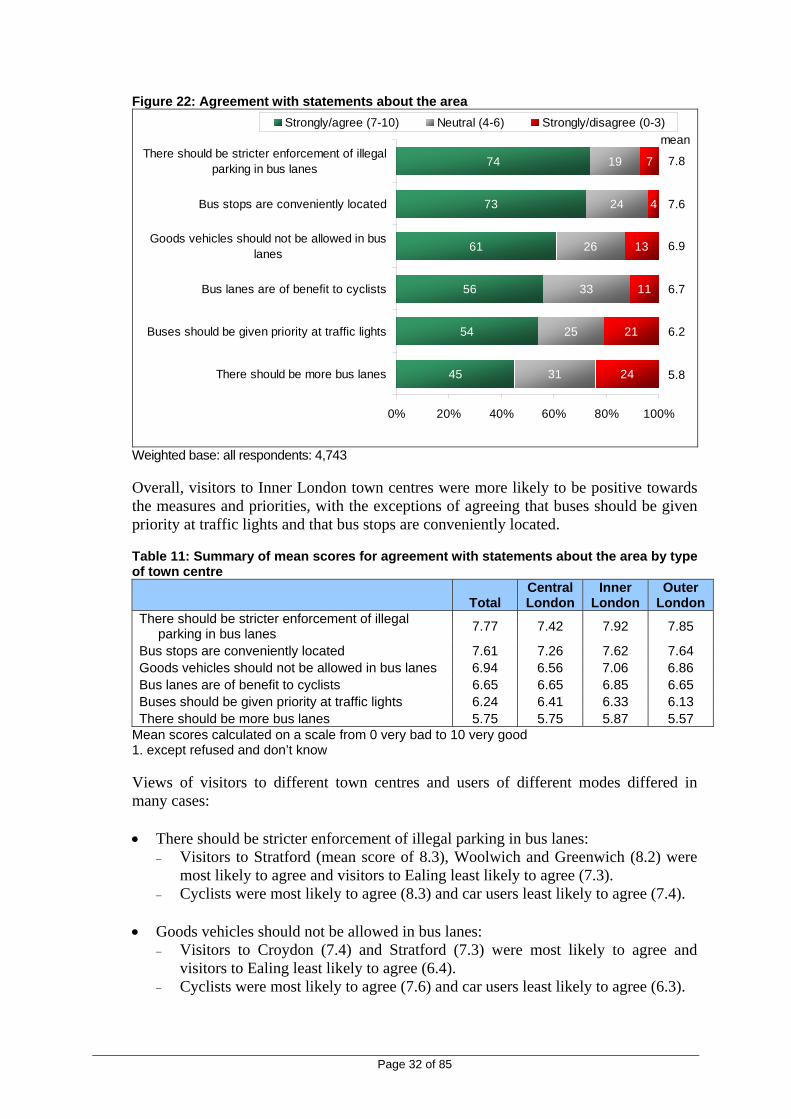
Attitudes towards Bus Lanes and Bus Priority Measures Visitors were asked their opinion on a number of aspects relating to bus lanes and bus priority measures. Generally, they were in support of all the measures. There was strong agreement that there should be stricter bus lane enforcement (mean score 7.8), that bus stops are conveniently located (7.6) and for goods vehicles not to be allowed in bus lanes (mean score 6.9). There was also strong agreement that bus lanes are of benefit to cyclists (mean score 6.7). There was least support for there being more bus lanes (mean score 5.8).
Page 32 of 85
Figure 22: Agreement with statements about the area
45
54
56
61
73
74
31
25
33
26
24
19
24
21
11
13
4
7
0% 20% 40% 60% 80% 100%
There should be more bus lanes
Buses should be given priority at traffic lights
Bus lanes are of benefit to cyclists
Goods vehicles should not be allowed in buslanes
Bus stops are conveniently located
There should be stricter enforcement of illegalparking in bus lanes
Strongly/agree (7-10) Neutral (4-6) Strongly/disagree (0-3)
6.2
7.8
7.6
6.9
6.7
5.8
mean
Weighted base: all respondents: 4,743 Overall, visitors to Inner London town centres were more likely to be positive towards the measures and priorities, with the exceptions of agreeing that buses should be given priority at traffic lights and that bus stops are conveniently located. Table 11: Summary of mean scores for agreement with statements about the area by type of town centre
Total Central London
Inner London
Outer London
There should be stricter enforcement of illegal parking in bus lanes 7.77 7.42 7.92 7.85
Bus stops are conveniently located 7.61 7.26 7.62 7.64 Goods vehicles should not be allowed in bus lanes 6.94 6.56 7.06 6.86 Bus lanes are of benefit to cyclists 6.65 6.65 6.85 6.65 Buses should be given priority at traffic lights 6.24 6.41 6.33 6.13 There should be more bus lanes 5.75 5.75 5.87 5.57
Mean scores calculated on a scale from 0 very bad to 10 very good 1. except refused and don’t know Views of visitors to different town centres and users of different modes differed in many cases: • There should be stricter enforcement of illegal parking in bus lanes:
− Visitors to Stratford (mean score of 8.3), Woolwich and Greenwich (8.2) were most likely to agree and visitors to Ealing least likely to agree (7.3).
− Cyclists were most likely to agree (8.3) and car users least likely to agree (7.4). • Goods vehicles should not be allowed in bus lanes:
− Visitors to Croydon (7.4) and Stratford (7.3) were most likely to agree and visitors to Ealing least likely to agree (6.4).
− Cyclists were most likely to agree (7.6) and car users least likely to agree (6.3).
Page 33 of 85
• Bus lanes are of benefit to cyclists: − Visitors to Camberwell (7.2) and Clapham Junction (6.9) were most likely to
agree and visitors to Croydon least likely to agree (6.4). − Cyclists were most likely to agree (8.1) and train/Tube users least likely to agree
(6.5). • Buses should be given priority at traffic lights:
− Visitors to Camberwell (6.8) and Harlesden (6.8) were most likely to agree and visitors to Greenwich least likely to agree (5.6).
− Pedestrians were most likely to agree (6.5) and car users least likely to agree (5.4).
• There should be more bus lanes:
− Visitors to Camberwell (6.7) and Harlesden (6.4) were most likely to agree and visitors to Bromley least likely to agree (4.7).
− Bus users and cyclists were most likely to agree (6.3 and 6.2 respectively) and car users least likely to agree (4.5).
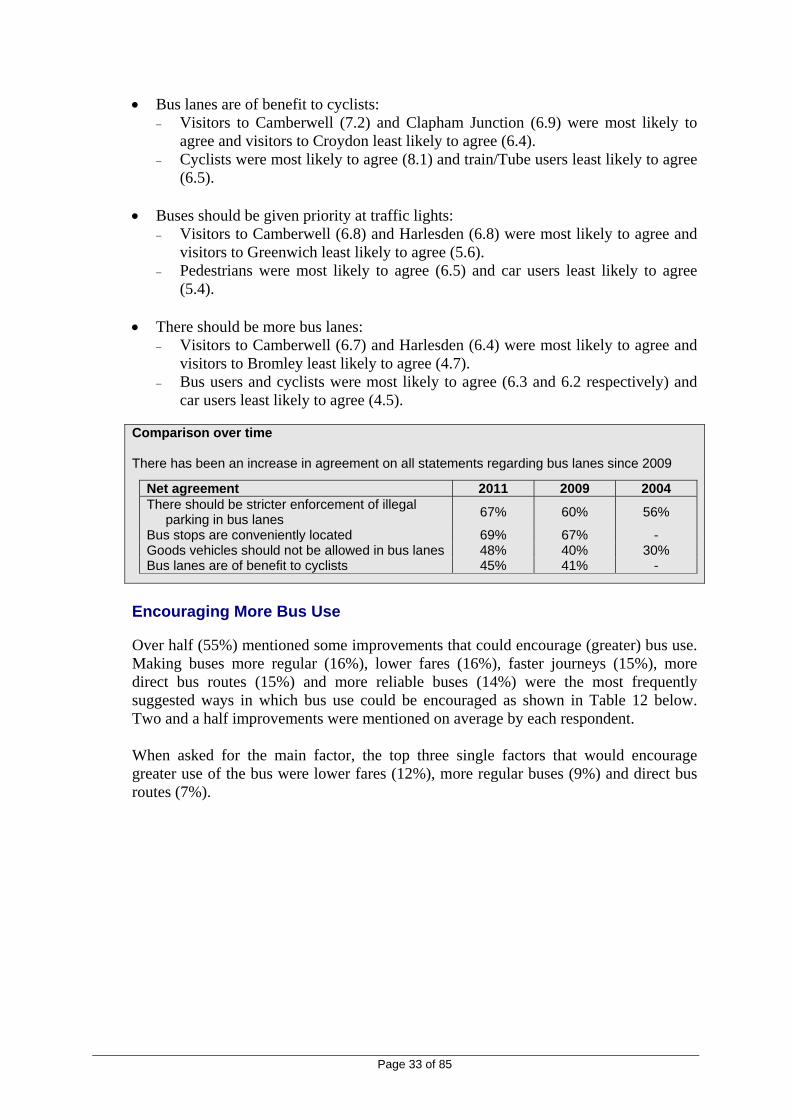
Comparison over time There has been an increase in agreement on all statements regarding bus lanes since 2009
Net agreement 2011 2009 2004 There should be stricter enforcement of illegal
parking in bus lanes 67% 60% 56%
Bus stops are conveniently located 69% 67% - Goods vehicles should not be allowed in bus lanes 48% 40% 30% Bus lanes are of benefit to cyclists 45% 41% -
Encouraging More Bus Use Over half (55%) mentioned some improvements that could encourage (greater) bus use. Making buses more regular (16%), lower fares (16%), faster journeys (15%), more direct bus routes (15%) and more reliable buses (14%) were the most frequently suggested ways in which bus use could be encouraged as shown in Table 12 below. Two and a half improvements were mentioned on average by each respondent. When asked for the main factor, the top three single factors that would encourage greater use of the bus were lower fares (12%), more regular buses (9%) and direct bus routes (7%).

Page 34 of 85
Table 12: Factors that would encourage use of buses more often All respondents All mentions
% Main factor
% Nothing 45 45 More regular/frequent buses 16 9 Lower fares 16 12 Faster journey 15 6 Direct bus route 15 7 More reliable buses 14 4 More seats on buses/less crowded buses 8 3 More comfortable journey 6 1 Cleaner buses 6 1 More information about buses 5 1 Make children behave/school buses 5 2 Reduce number of cars on the road/less congestion 4 1 Bus stop nearer home/destination 4 1 Safer buses 4 1 Greater priority given to buses 3 1 More shelters at bus stops 3 * More seating at bus stops 3 * Stricter enforcement of illegal parking in bus lanes 2 * Improved ease of getting on and off buses 2 * Greener buses 2 1 Other 3 2 Weighted base 4,746 4,746 * = less than 0.5% Analysis by type of town centre shows that ‘lower fares’ and ‘more regular/frequent buses’ are the main factors that would encourage more bus use for Inner and Outer London and ‘faster journey’ is the main factor for Central London. Table 13: Main factors that would encourage use of buses more often by type of centre
Total Central London
Inner London
Outer London
% % % % Nothing 45 47 42 47 Lower fares 12 6 12 12 More regular/frequent buses 9 4 10 8 Direct bus route 7 6 8 7 Faster journey 6 14 6 5 More reliable buses 4 2 5 4 More seats on buses/less crowded buses 3 2 3 3 Make children behave/school buses 2 0 1 2 Weighted base 4746 321 1904 2521
Only those factors for which more than 2% of respondents mentioned are shown Over half in Bexleyheath (55%), Clapham Junction (55%), Ealing (54%) and Greenwich (53%) said nothing would encourage them to use buses more. By contrast 82% in Camberwell mentioned aspects that would encourage more bus use. In Oxford Street/Regent Street ‘faster journey’ was the most important aspect with 14% mentioning this. In Camberwell, Harlesden and Stratford ‘more regular/frequent buses’ were more important than ‘lower fares’.

Page 35 of 85
In all other town centres ‘lower fares’ was the most often mentioned aspect that would encourage more bus use.
3.7 Encouraging Cycling
Summary In total 5% cycled to the town centre or sometimes cycle to the area of the town centre. Most (62%) said nothing would encourage them to cycle. The three main improvements which would encourage more cycling were ‘less road traffic’ (15%), ‘more dedicated cycle paths’ (15%) and ‘more cycle lanes on the roads’ (14%). Respondents were shown a card with the following list of potential improvements and asked which would encourage them to cycle more often in the area: • (More) cycle lanes on the roads • (More) dedicated cycle paths • Less road traffic • Free on-road cycle training • Bicycle hire scheme • (Better) bicycle parking facilities in this area • (Better) bicycle parking facilities at / near your home • None of these / nothing. Over a third (35%) of town centre visitors mentioned at least one thing that might encourage them to cycle more often in the area. The three main improvements were ‘less road traffic’ (15%), ‘more dedicated cycle paths’ (15%) and ‘more cycle lanes on the roads’ (14%). Bicycle hire scheme was mentioned most in Greenwich (12%), Clapham Junction (9%) and Kingston (8%).

Page 36 of 85
Figure 23: Things which would encourage cycling more often in this area
3
4
4
7
7
14
15
15
62
0 10 20 30 40 50 60 70 80 90 100
Don't know
Free on-road cycle training
(Better) bicycle parkingfacilities at/near your home
Bicycle hire scheme
(Better) bicycle parkingfacilities in this area
(More) cycle lanes on theroads
(More) dedicated cyclepaths
Less road traffic
None of these/nothing
Weighted base: all respondents: 4,646 Cyclists were much more likely to mention something. They particularly mentioned ‘(more) dedicated cycle paths’ (50%) and ‘(more) cycle lanes on the roads’ (49%), ‘less road traffic’ (36%) and better parking facilities in the area (32%). Table 14: Things which would encourage cycling more often in this area by mode used
Car %
Bus %
Train/ Tube
% Bicycle
% Walk
% None of these/nothing 68 67 60 19 57 Less road traffic 12 12 18 36 18 (More) dedicated cycle paths 11 11 16 50 18 (More) cycle lanes on the roads 11 11 15 49 17 (Better) bicycle parking facilities in this
area 5 6 8 32 8
Bicycle hire scheme 5 5 6 11 10 (Better) bicycle parking facilities at/near
your home 2 3 6 10 5
Free on-road cycle training 2 5 4 5 5 Don't know 4 4 3 1 2 None of these/nothing 68 67 60 19 57 Weighted base 721 1694 762 111 1294 * = less than 0.5%
3.8 Attitudes towards Town Centres
Summary The main ways that the town centres could be improved were better range of shops (30%), to make the streets cleaner (26%) and less traffic (21%). 14% said nothing could be done.
Page 37 of 85
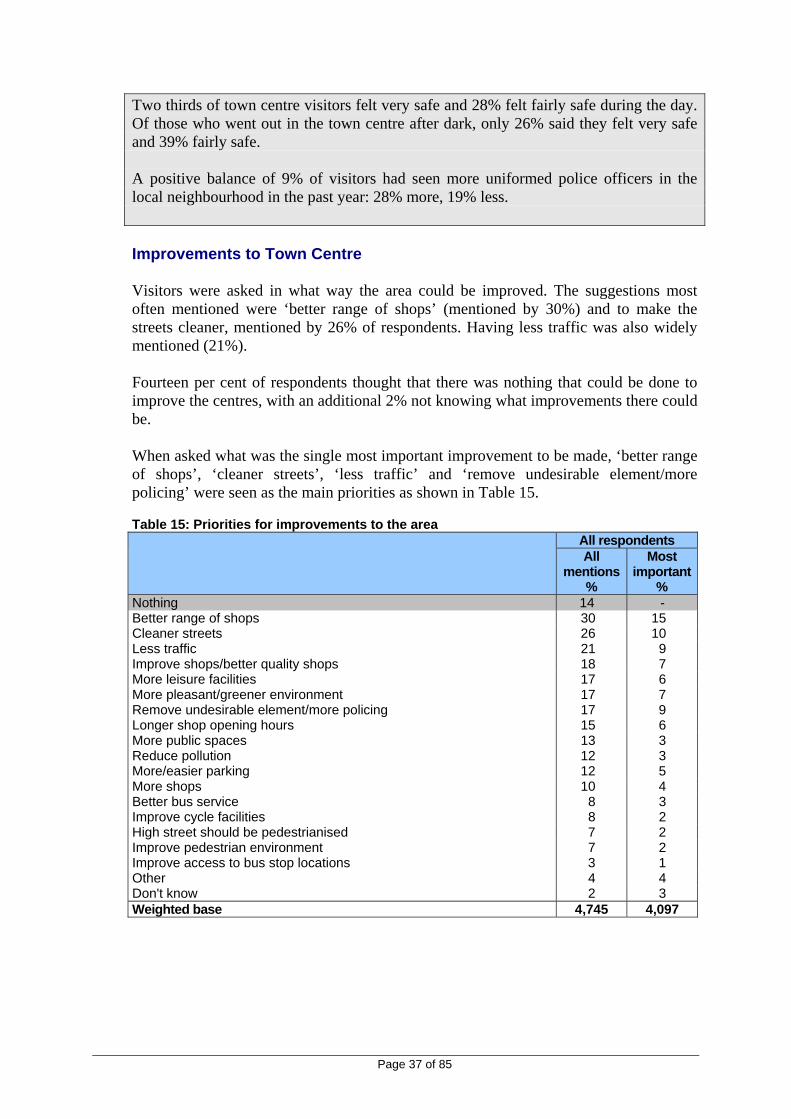
Two thirds of town centre visitors felt very safe and 28% felt fairly safe during the day. Of those who went out in the town centre after dark, only 26% said they felt very safe and 39% fairly safe. A positive balance of 9% of visitors had seen more uniformed police officers in the local neighbourhood in the past year: 28% more, 19% less. Improvements to Town Centre Visitors were asked in what way the area could be improved. The suggestions most often mentioned were ‘better range of shops’ (mentioned by 30%) and to make the streets cleaner, mentioned by 26% of respondents. Having less traffic was also widely mentioned (21%). Fourteen per cent of respondents thought that there was nothing that could be done to improve the centres, with an additional 2% not knowing what improvements there could be. When asked what was the single most important improvement to be made, ‘better range of shops’, ‘cleaner streets’, ‘less traffic’ and ‘remove undesirable element/more policing’ were seen as the main priorities as shown in Table 15. Table 15: Priorities for improvements to the area All respondents
All mentions
%
Most important
% Nothing 14 - Better range of shops 30 15 Cleaner streets 26 10 Less traffic 21 9 Improve shops/better quality shops 18 7 More leisure facilities 17 6 More pleasant/greener environment 17 7 Remove undesirable element/more policing 17 9 Longer shop opening hours 15 6 More public spaces 13 3 Reduce pollution 12 3 More/easier parking 12 5 More shops 10 4 Better bus service 8 3 Improve cycle facilities 8 2 High street should be pedestrianised 7 2 Improve pedestrian environment 7 2 Improve access to bus stop locations 3 1 Other 4 4 Don't know 2 3 Weighted base 4,745 4,097

Page 38 of 85
The improvements can be grouped into the following categories: Mentions Most important % % Shopping facilities11 73 32 Travel and transport12 71 25 Environment13 63 22 Other14 34 15 For Central London the highest priority was in reducing traffic (19%). Also important in Central London was ‘more pleasant/greener environment’, ‘longer shop opening hours’ and ‘reduce pollution’. In Inner and Outer London town centres the priorities were ‘better range of shops’, ‘cleaner streets’ and the removal of undesirable elements/more policing. At Inner London town centres ‘less traffic’ was also important. Table 16: Main priority for improvements in each area by type of centre
Total Central London
Inner London
Outer London
% % % %Better range of shops 15 2 17 16 Cleaner streets 10 6 10 11 Less traffic 9 19 10 6 Remove undesirable element/more policing 9 2 8 10 Improve shops / better quality shops 7 2 7 7 More pleasant/greener environment 7 9 6 7 More leisure facilities 6 7 6 7 Longer shop opening hours 6 8 4 8 More/easier parking 5 2 4 6 More shops 4 2 5 3 More public spaces 3 6 3 3 Better bus service 3 1 4 3 Reduce pollution 3 8 3 2 High street should be pedestrianised 2 7 3 2 Improve pedestrian environment 2 6 2 2 Improve cycle facilities 2 3 2 1 Weighted base 4097 254 1736 2107
All aspects mentioned by 2% or more Shaded boxes indicate top mentions in each type of centre The main improvement at two thirds of the town centres (Bexleyheath, Bromley, Camberwell, Clapham Junction, Ealing, Hackney, Harlesden, Harrow, Stratford and Woolwich) was a ‘better range of shops’. At Oxford Street/Regent Street and Greenwich the main improvement was ‘less traffic’; at Kingston it was ‘longer shop opening hours’; at Croydon it was ‘remove undesirable element/more policing’ and at Wood Green it was ‘cleaner streets’. 11 Better range of shops, Improve shops/better quality shops, Longer shop opening hours, More shops 12 Less traffic, Reduce pollution, More/easier parking, Better bus service, Improve cycle facilities, Improve access to bus stop locations, High street should be pedestrianised 13 Cleaner streets, More pleasant/greener environment, Improve pedestrian environment, More public spaces 14 More leisure facilities, Remove undesirable element/more policing

Page 39 of 85
The main priorities in each of the town centres are shown in Table 75 in Appendix B. Safety The perceived safety of the town centre neighbourhood in day time and at night was explored. Overall, two thirds of town centre visitors felt very safe and 28% felt fairly safe during the day. Just over a fifth (21%) didn’t go out during the evening/after dark in the town centre neighbourhood. Of those who did, the feeling of safety fell markedly with only 26% saying they felt very safe and 39% fairly safe. Figure 24: Feeling of safety in neighbourhood during the day
Fairly safe28%
Very safe66%
Never go out in
the day*
Very unsafe
2%A bit
unsafe4%
Weighted base: all respondents 4,745 Figure 25: Feeling of safety in neighbourhood during the evening/after dark
A bit unsafe21%
Very unsafe14% Very safe
26%
Fairly safe39%
Weighted base: those who went out in the evening/after dark: 3,760

Page 40 of 85
Visitors to Central London felt safer there both in the day time and in evening/after dark. There was little difference between Inner and Outer London town centres. Table 17: Feeling of safety in neighbourhood in day time and in evening/after dark by type of centre day time evening/after dark* Central
London Inner
London Outer
London Central London
Inner London
Outer London
% % % % % %Very safe 78 65 66 47 24 25 Fairly safe 19 30 28 40 38 38 A bit unsafe 1 4 4 9 21 23 Very unsafe 1 2 1 4 17 14 Weighted base 321 1904 2519 267 1548 1946
* those who went out in the evening/after dark The town centres with the highest proportions feeling unsafe are Woolwich (12% a bit unsafe/very unsafe), Croydon (11%), Harlesden (10%) and Wood Green (10%). The town centres with the highest proportions feeling very unsafe are Woolwich (33% very unsafe), Stratford (27%), Croydon (22%) and Wood Green (20%). A positive balance of 9% of visitors had seen more uniformed police officers in the local neighbourhood in the past year: 28% more, 19% less. Figure 26: Whether seen more or less uniformed police officers in local neighbourhood in past year
Less19%
Don't know14% More
28%
About the same39%
Weighted base: all respondents 4,745 In Central London a balance of 4% had seen fewer uniformed police officers in the local neighbourhood. The town centres with the highest balance of those who had seen more uniformed police officers in the local neighbourhood in the past year were Bexleyheath (+30%), Woolwich (+28%), Stratford (+19%) and Bromley (+18%).

Page 41 of 85
The town centres with the highest balance of those who had seen fewer uniformed police officers in the local neighbourhood in the past year were Harlesden (-10%), Camberwell (-6%) and Wood Green (-5%). Over three quarters (76%) of cyclists felt very or fairly safe when cycling in the town centre neighbourhood. Seven per cent felt very unsafe. Figure 27: Feeling of safety when cycling in neighbourhood
A bit unsafe17%
Very unsafe
7%
Very safe29%
Fairly safe47%
Weighted base: 251 cyclists
3.9 Use of Other Shopping Centres
Summary Over two thirds of town centre visitors go to other shopping centres in and around London. The most visited shopping centres were Bluewater (28%) and Westfield (25%). Respondents who accessed the town centre by bus, cycle and on foot were least likely to visit other shopping centres. Over two thirds of town centre visitors (68%) go to other shopping centres in and around London. The most visited other shopping centres15 were Bluewater (28%) and Westfield (25%).
15 From a list shown to respondents

Page 42 of 85
Figure 28: Whether go to shopping centres in and around London
3
3
5
9
11
14
16
16
25
28
32
0 10 20 30 40 50 60 70 80 90 100
Aylesham Shopping Centre
Whiteleys
Victoria Place
Elephant & Castle
Canary Wharf
Brent Cross
Croydon
Lakeside
Westfield
Bluewater
No
% Respondents Weighted base: all respondents: 4,746 Visitors to Central London were much more likely to visit Westfield than those from Inner or Outer London town centres. Table 18: Whether go to shopping centres in and around London by type of centre
Central London
% Inner London
% Outer London
% No 35 33 31 Bluewater 29 29 27 Westfield 34 20 26 Lakeside 21 19 13 Croydon 10 14 18 Brent Cross 18 7 19 Canary Wharf 16 16 7 Elephant & Castle 8 14 5 Victoria Place 7 5 4 Whiteleys 7 2 3 Aylesham Shopping Centre 2 5 2 Weighted base 321 1904 2521
Respondents who accessed the town centre by bus, cycle and on foot were least likely to visit other shopping centres.
Visit other shopping centres • Car 78% • Train/Tube 75% • Bus 68% • Walk 60% • Bicycle 51%. The specific other shopping centres visited were very much a function of the location of the town centre. For example 75% at Bexleyheath visited Bluewater and 37% visited Lakeside, 44% at Camberwell visited Elephant & Castle, 40% at Harlesden visited Brent Cross, 64% at Ealing visited Westfield, 28% at Greenwich visited Canary Wharf.

Page 43 of 85
3.10 Oxford Street/Regent Street
Summary Oxford Street is visited because of its shopping facilities: 27% considered it to be the best shopping area, 21% were visiting a particular shop and 15% cited ‘more/better/ bigger range of shops’. Just over a third (36%) of visitors to Oxford Street were aware of the changes to travel around Tottenham Court Road. This is twice the proportion as in 2009. Of those who were aware 51% knew it was because of building rail/Crossrail station. Only 8% of visitors to Oxford Street/Regent Street said they were affected by the travel changes around Tottenham Court Road. Over half (53%) had used the diagonal crossing at Oxford Circus and there were very high levels of satisfaction with both the safety and ease of crossing the road on the diagonal crossing. There were specific questions asked for respondents at Oxford Street/Regent Street covering possible disruption because of Crossrail works, the diagonal crossing at Oxford Circus and why they visit the area. Why visit Oxford Street The main reason why respondents at Oxford Street were visiting Oxford Street rather than going somewhere else was because of its shopping facilities: it was considered to be the best shopping area by 27%, 21% were visiting a particular shop and 15% cited ‘more / better / bigger range of shops’. The main non shopping reasons mentioned were working near Oxford Street (16%) and a day out/trip into town (12%).

Page 44 of 85
Figure 29: Why visiting Oxford Street area today rather than going somewhere else
10
1
2
3
3
4
4
4
4
5
5
8
11
12
15
16
21
27
0 10 20 30 40 50
Other
Easy for other people to travel to and from
Good public transport
Visiting a particular leisure facility
Live near here
Longer shop opening hours
More leisure facilities, eg restaurants, bars, cinemas etc
To do something different/special
No particular reason
Visiting other places in London as well
Easy for me to travel to and from
Meeting people here
Had to be in central London for other reason
As a 'day out'/'trip into town'
More/better/bigger range of shops
Work near here
Visiting a particular shop
Oxford Street is best shopping area
Base: 320 visitors to Oxford Street/Regent Street Awareness of changes to travel around Tottenham Court Road Just over a third (36%) of visitors to Oxford Street were aware of the changes to travel around Tottenham Court Road. This is twice the proportion as in 2009. Respondents who lived or worked within ten minutes of Oxford Street were much more likely to be aware than those who didn’t: 69% compared to 29%. There were similar levels of awareness by those who accessed by car, bus and train/Tube (about a third each) whereas those who accessed the area on foot (and therefore likely to live nearby) were more likely to be aware (49%). Awareness for reasons for diversions and travel changes Of those who were aware of the changes to travel around Tottenham Court Road just over half (51%) knew it was because of building rail/Crossrail station (18% of all visitors to Oxford Street). Other reasons mentioned included: • Improving Underground station 18% • Building works (unspecified) 9% • Transport works (unspecified) 8% • Utility works (eg electricity, gas, water) 7% • Improving road layout/better roads 5% • Improving bus facilities/bus routes 2% • Improving pavements/pedestrian facilities 2% A fifth said they didn’t know.

Page 45 of 85
Impact of travel changes on travel Only 8% of visitors to Oxford Street/Regent Street said they were affected by the travel changes around Tottenham Court Road. Of the minority (26 people16) that were affected, 11 changed their usual bus, four changed their usual Tube journey, two changed their driving route, two changed their walking route, two avoided getting a bus and two avoided driving. Diagonal Crossing Over half the visitors (53%) to Oxford Street/Regent Street had used the diagonal crossing at Oxford Circus. There were very high levels of satisfaction with both the safety and ease of crossing the road on the diagonal crossing. Figure 30: Satisfaction with ease and safety of crossing
75
71
22
26
3
3
0 10 20 30 40 50 60 70 80 90 100
ease of crossing theroad
safety of crossing theroad
% Respondents
Very/satisfied (7-10) Neutral (4-6) Very/dissatisfied (0-3)
7.8
7.9
mean
Base: 170 visitors to Oxford Street/Regent Street who used diagonal crossing Mean scores based on 0 = very dissatisfied and 10 = very satisfied Older respondents and women gave slightly higher satisfaction scores than younger respondents and men: 16-24 25-44 45-60 60+ Male Female • ease of crossing the road 7.9 7.9 8.0 8.0 7.8 8.0 • safety of crossing the road 7.2 7.8 8.0 8.0 7.7 7.8 Base 39 79 34 17 69 101
16 Access modes were: bus 10, train/Tube 8, walk 3, car 2, bicycle 1, other 1

Page 46 of 85
3.11 Shopping and Expenditure in the Area
Summary Almost half (46%) were shopping for groceries and food, 33% were shopping for clothes or footwear, 18% were using a service and 17% were eating out. Those in Inner and Outer London town centres were most likely to be shopping for food and groceries (52% and 45% respectively) whereas those in Central London were most likely to be shopping for clothing or footwear (61%). A wide range of services and shops were visited by respondents. Almost half of the visitors to the town centres were shopping for groceries and food (46%) and a third were shopping for clothes or footwear as shown in Figure 31. It is worth noting that larger items such as household white and brown goods are less frequent purchases and that the survey is more likely to pick up regular purchases and more portable items. Other items or services that were mentioned by 10% or more were: • Services (eg hairdressers) 18% • Café or restaurant 17% • Take away food 15% • Pharmaceuticals/toiletries 12% • Stationery, books, CDs, DVDs, leisure goods 11%. Figure 31: Range of things shopped for and services used
3344444
791112
151718
3346
0 20 40 60 80 100
p
n
l
j
h
f
d
b
% Respondents Weighted base: 4,738
Food/groceries Clothing or footwear
Services Eating in a café or restaurant
Take-away food Pharmaceuticals/toiletries
Stationery/books/CDs/DVDs/leisure goods Confectionery, tobacco, newspapers
Other household goods Wine, beer, spirits
Luxury goods Major household goods
Travel Pass/mobile top up/phonecard Having a drink in a pub or wine bar
Going to cinema, theatre, concert, leisure facility etc Other

Page 47 of 85
Those in Inner and Outer London town centres were most likely to be shopping for food and groceries (52% and 45% respectively) whereas than those in Central London were most likely to be shopping for clothing or footwear (61%). In Central London 14% were shopping for luxury goods compared to 3-4% elsewhere. Use of services was much higher in Inner and Outer London town centres than in Central London: 18-19% compared to 9%. Table 19: Range of shopping and services by type of centre Total Central
London Inner
London Outer
London % % % % Food/groceries 46 10 52 45 Clothing or footwear 33 61 22 38 Services 18 9 19 18 Eating in a café or restaurant 17 19 17 17 Take-away food 15 22 17 12 Pharmaceuticals/toiletries 12 10 14 12 Stationery/books/CDs/DVDs/leisure
goods 11 14 10 11
Confectionery, tobacco, newspapers 9 6 10 9 Other household goods 7 5 6 7 Wine, beer, spirits 4 4 5 4 Luxury goods 4 14 3 4 Major household goods 4 5 4 5 Travel Pass/mobile top up/phonecard 4 4 6 3 Having a drink in a pub or wine bar 4 5 4 4 Going to cinema, theatre, concert,
leisure facility etc 3 2 4 3
Other 3 5 3 3 Weighted base 4,738 313 1,904 2,521
More than one answer may be given so totals may not add to 100% Food/grocery shopping was most mentioned at two thirds of the town centres (Bexleyheath, Camberwell, Clapham Junction, Ealing, Greenwich, Hackney, Harlesden, Stratford, Wood Green and Woolwich) and least mentioned at Oxford Street. Clothing or footwear shopping was most mentioned at the other five town centres (Bromley, Croydon, Harrow, Kingston and Oxford Street/Regent Street). Analysis by town centre categories used in the London Plan is shown in Table 20. This shows that food/grocery shopping was most mentioned at District and Major town centres (55% and 53% respectively) and least mentioned at International town centres (10%). Clothing or footwear shopping was most mentioned at International town centres (61%) and least mentioned at District town centres (15%).

Page 48 of 85
Table 20: Range of shopping and services by London Plan town centre category
International
% Metropolitan
% Major
% District
% Food/groceries 10 41 53 55 Clothing or footwear 61 43 30 15 Services 9 17 17 22 Eating in a café or restaurant 19 19 14 17 Take-away food 22 13 12 19 Pharmaceuticals/toiletries 10 11 14 13 Stationery/books/CDs/DVDs/leisure
goods 14 12 11 9
Confectionery, tobacco, newspapers 6 9 8 11 Other household goods 5 7 9 5 Wine, beer, spirits 4 3 4 6 Luxury goods 14 5 4 3 Major household goods 5 4 4 4 Travel Pass/mobile top up/phonecard 4 3 4 6 Having a drink in a pub or wine bar 5 5 4 4 Going to cinema, theatre, concert,
leisure facility etc 2 3 3 4
Other 5 3 2 3 Weighted base 313 1905 1258 1262
3.12 Average Spend
Summary The average spend was £36 on the day of interview which is similar to the usual spend per visit (£32). The average spend per week was £72. The average spend per month was £290. Average spend per visit by mode was car £41, train/Tube £38, bus £32, walk £26 and cycle £21. Average spend per week by mode was walk £93, bus £70, train/Tube £59, car £56 and cycle £47. Average spend per month by mode was walk £373, bus £282, train/Tube £239, car £226 and cycle £188. Visitors were asked how much they anticipated spending in the centre during their visit and also how much they spend on average per visit. An average total spend per week was then calculated based on the frequency of visiting the centre. It should be noted that respondents were asked how much they had spent according to broad bands of expenditure. In order to calculate the average spend figures mid point values were applied to the bands and full details of these values are provided in Appendix C. Overall the average spend was £36 on the day of interview which is similar to the usual spend per visit (£32). The average spend per week was £72 and the average spend per month was £289.

Page 49 of 85
Table 21: Average spend
Spend today %
Average spend per visit
%
Average total spend per
week* %
Average total spend per
month* %
Nothing 5 2 2 2 Under £5 11 9 8 2 £5-£19.99 33 38 22 6 £20-£49.99 29 31 26 10 £50-£99.99 14 14 22 16 £100+ 7 5 19 65 Mean £36 £32 £72 £290 Base 4,541 4,258 4,252 4,252
* excludes those who did not give an expenditure or frequency of visiting area. Those who visit Central London spend the most on average per week (£78) and month (£315) although they visit much less often than visitors to Inner and Outer London town centres (reflecting the fact that this group spend most per visit). Table 22: Average spend today, per visit and per week by type of centre Central London Inner London Outer London
Spen
d to
day
Ave
rage
spe
nd
per v
isit
Ave
rage
tota
l sp
end
per w
eek*
Ave
rage
tota
l sp
end
per m
onth
*
Spen
d to
day
Ave
rage
spe
nd
per v
isit
Ave
rage
tota
l sp
end
per w
eek*
Ave
rage
tota
l sp
end
per m
onth
*
Spen
d to
day
Ave
rage
spe
nd
per v
isit
Ave
rage
tota
l sp
end
per w
eek*
Ave
rage
tota
l sp
end
per m
onth
*
% % % % % % % % % % % %Nothing 3 3 3 3 5 3 3 3 5 2 2 2 Under £5 8 7 14 5 13 11 9 2 10 8 7 1 £5 - £19.99 17 21 23 6 39 43 21 7 31 36 23 5 £20 - £49.99 22 24 27 14 30 31 26 8 29 32 26 11 £50 - £99.99 23 25 16 17 9 11 21 15 17 16 23 16 £100+ 27 21 18 55 4 2 20 66 8 5 18 65 Mean £74 £63 £78 £315 £27 £26 £74 £298 £37 £34 £70 £281Base1 286 251 250 250 1830 1699 1696 1696 2422 2311 2307 23071. except refused and don’t know Oxford Street/Regent Street (£78), Croydon (£50) and Kingston (£48) were the town centres with the highest levels of spend on the day of interview. Oxford Street/Regent Street and Croydon were also the locations with the highest levels of spend on average. Visitors to Greenwich (£19) and Hackney (£21) spent the least. Those visiting Clapham Junction spend the most on average per week and month (£95 and £380 respectively), with those visiting Harlesden (£87 and £348) and Croydon (£86 and £346) also having high weekly spends. Those visiting Harrow (£55 and £221) and Greenwich (£57 and £229) spent least on average per week. Those in Oxford Street/Regent Street tend not to be such regular visitors to the area and this is reflected in the average spend per week and month which is similar to Stratford (at £78 and £311) and only a little above the average of £72 per week and £290 per month. This would indicate that places such as Harlesden attract more locally based and regular shoppers for goods such as groceries and household goods whereas those in the West End visit more for luxury goods such as clothes and footwear. The average spend

Page 50 of 85
by visitors at each centre is shown in Table 71, Table 72, Table 73 and Table 74 in Appendix B. Spend by Mode Those who travelled by car were also high spenders on the day of the interview (36% spent £50 or more). In comparison, only 20% of those who travelled by bus and 13% of those who walked to the centre spent £50 or more. Those who travelled by bus spent an average of £34 on the day of interview. Those who travelled by car spent the most on average on the day of interview (£50) but those who travelled by train/Tube were also high spenders (£44 on average). Those who cycled and walked to the centre spent the least (£21 and £26 respectively). These figures are shown in Table 23. Table 23: Average spend by mode on day
Car %
Bus %
Train/Tube%
Bicycle %
Walked %
Taxi/ minicab/
other %
Nothing 4 5 5 6 6 3 Under £5 8 10 12 19 14 10 £5 - £19.99 25 32 29 44 41 33 £20 - £49.99 27 33 25 21 27 26 £50 - £99.99 24 13 15 5 10 16 £100+ 12 7 12 4 3 11 Mean £50 £34 £44 £21 £26 £42 Base1 711 1651 723 108 1286 61 1. except refused and don’t know A similar pattern was found in the average spend per visit, with 29% of car drivers/passengers spending an average of £50 or more per visit. With respect to the overall average spend per visit, car drivers/passengers spent £41, train/Tube passengers £38, bus customers £32, those who walk £26 and those who cycle £21. Table 24: Average spend by mode per visit
Car %
Bus %
Train/Tube%
Bicycle %
Walked %
Taxi/ minicab/
other %
Nothing 2 2 4 1 3 * Under £5 6 8 14 19 9 8 £5 - £19.99 29 38 31 49 45 42 £20 - £49.99 34 33 25 25 31 34 £50 - £99.99 21 15 16 5 10 8 £100+ 8 4 9 0 2 9 Mean £41 £32 £38 £18 £26 £40 Base1 680 1573 656 99 1198 53 * = less than 0.5% 1. except refused and don’t know

Page 51 of 85
If the frequency of visiting the area is taken into account, however, there is a more even distribution of spend by mode. The total average spend per week by mode (see Table 25) shows that those who walk to the area tend to spend most on average per week (£93 on average). Those travelling by bus spend the next most per week on average (£70) whereas those travelling to the area by cycle and car spend the least (£47 and £56 respectively). The total average spend per month by mode (see Table 26) shows that average spend for those who walk to the area was £373, for bus it was £282, for train/Tube it was £239, for car it was £226 and for cycle it was £188. The high weekly and monthly spend for those who access town centres on foot and by bus is because of the relatively high frequency of visits on foot and by bus. Table 25: Average total spend per week by mode
Car %
Bus %
Train/Tube%
Bicycle %
Walked %
Taxi/ minicab/
other %
Nothing 2 2 4 1 3 Under £5 12 8 16 10 3 9 £5 - £19.99 26 23 26 32 16 17 £20 - £49.99 26 28 25 26 25 32 £50 - £99.99 19 22 15 21 28 20 £100+ 15 18 14 10 26 22 Mean £56 £70 £59 £47 £93 £64 Base1 680 1569 654 99 1197 53 1. except refused and don’t know Table 26: Average total spend per month by mode
Car %
Bus %
Train/Tube%
Bicycle %
Walked %
Taxi/ minicab/
other %
Nothing 2 2 4 1 3 0 Under £5 2 1 5 4 * 2 £5 - £19.99 8 6 9 6 2 7 £20 - £49.99 13 11 13 9 5 6 £50 - £99.99 18 16 17 25 12 11 £100+ 57 64 51 56 78 74 Mean £226 £282 £239 £188 £373 £257 Base1 680 1569 654 99 1197 53 1. except refused and don’t know It should be noted that visitors may use a number of different modes to access the area, for example car users may also travel to the town by bus on other occasions (35% of those who travelled by car also use the bus), but this calculation is based on the mode used on the day of interview. Spend by London Plan Town Centre Category Analysis by town centre categories used in the London Plan is shown in Table 27.

Page 52 of 85
Those who visit International town centres spend the most on the day of visit: more than three times the amount spent at District town centres and more than twice the amount spent at Major town centres. However, the average spend per week and month is similar across town centre categories (between £67 and £79 per week and between £269 and £315 per month) as those in District and Major town centres visit more often than those at Metropolitan and International town centres. Table 27: Average spend today, per visit and per week by London Plan town centre category
Spend today International
% Metropolitan
% Major
% District
% Nothing 3 5 5 6 Under £5 8 10 11 15 £5 - £19.99 17 29 32 45 £20 - £49.99 22 29 34 25 £50 - £99.99 23 18 13 7 £100+ 27 9 6 2 Mean £74 £40 £33 £22 Spend per visit Nothing 3 2 2 3 Under £5 7 9 7 13 £5 - £19.99 21 34 37 49 £20 - £49.99 24 33 36 26 £50 - £99.99 25 17 14 8 £100+ 21 6 4 2 Mean £63 £35 £31 £22 Spend per week Nothing 3 2 2 3 Under £5 14 8 8 9 £5 - £19.99 23 24 20 22 £20 - £49.99 27 27 25 25 £50 - £99.99 16 21 23 23 £100+ 18 18 23 18 Mean £78 £67 £79 £72 Spend per month Nothing 3 2 2 3 Under £5 3 1 1 2 £5 - £19.99 10 6 7 7 £20 - £49.99 11 10 8 8 £50 - £99.99 21 17 14 15 £100+ 51 63 68 66 Mean £313 £269 £315 £289 Base1 250 1744 1112 1146
1. except refused and don’t know

Page 53 of 85
Comparison over time There has been an increase in weekly spend by PT users since 2004, a fall for car users since 2004, a rise for pedestrians since 2009 after a fall from 2004 and a large fall in spend for cyclists since 200917.
2011 2009 2004 Total £72 £69 £69 Bus £70 £66 £63 Walk £93 £89 £91 Car £56 £61 £64 Train/Tube £59 £50 £46 Bicycle £47 £64 -
Similarly, there has been an increase in monthly spend by PT users since 2004, a fall for car users since 2004, a rise for pedestrians since 2009 after a fall from 2004 and a large fall in spend for cyclists since 200918.
2011 2009 2004 Total £290 £276 £276 Bus £282 £265 £252 Walk £373 £360 £364 Car £226 £243 £256 Train/Tube £239 £201 £184 Bicycle £188 £258 -
As might be expected, the more time the visitor intended to spend in the area the more money they are likely to spend. For example, 30% of those spending between £5 and £19.99 were planning to be in the area for less than an hour whereas only 8% of those who were planning to spend £100 or more were going to be in the area for less than an hour. Table 28: Average time spent in the town centre by amount spent on the day
Total %
Amount spent on the day
Nothing %
Under £5 %
£5 - £19.99
%
£20 - £49.99
%
£50 - £99.99
% £100+
% Under 5 minutes * 1 0 * 0 0 * 5-14 minutes 1 4 3 1 1 * 1 15-29 minutes 5 12 8 7 3 1 3 30-59 minutes 17 27 17 22 17 12 4 1-3 hours 48 34 29 42 56 62 55 More than 3 hours 26 20 42 27 21 23 37 Don't know 1 2 1 1 1 1 * Base 4746 232 518 1512 1307 633 339 * = less than 0.5%
17 the higher spend in 2009 was mostly driven by a small number of cyclists who give very high average spend per week responses: 4% over £250 compared to none for 2011. If we were to remove responses over £250, the average weekly spend for 2009 drops to £51 which is much closer to the figure for 2011 18 the higher spend in 2009 was mostly driven by a small number of cyclists who give very high average spend per month responses: 4% over £1,000 compared to none for 2011. If we were to remove responses over £1,000, the average monthly spend for 2009 drops to £206 which is much closer to the figure for 2011

Page 54 of 85
Spend by Town Centre The highest spend per visit was at Oxford Street/Regent Street, Croydon and Bromley and the lowest spend per visit was at Greenwich, Hackney and Camberwell. There was an inverse relationship between spend per visit and frequency of visiting, for example Oxford Street/Regent Street has highest spend per visit but is least visited town centre. Figure 32: Average spend per visit and weekly frequency of visit by town centre average spend per visit weekly frequency of visit
£20
£21
£23
£24
£25
£29
£30
£31
£31
£33
£34
£36
£39
£48
£63
Greenwich
Hackney
Camberwell
Ealing
Harlesden
Harrow
Stratford
Woolwich
Clapham Junction
Bexleyheath
Wood Green
Kingston
Bromley
Croydon
Oxford Street/Regent Street
With the exception of Oxford Street/Regent Street, there was a tendency for town centres with malls to have higher spend than those without. Croydon, Bromley, Kingston, Bexleyheath, Wood Green, Stratford and Ealing have malls.
3.13 Online Shopping
Summary Just under half of town centre visitors (47%) shop by internet. Bus users and pedestrians least likely to shop by internet The main goods purchased online are books/CDs/DVDs/leisure goods (64%), clothing/footwear (57%), tickets (46%) and household goods (43%). Just under half of town centre visitors (47%) shop by internet. Visitors to Central London were most likely to shop by internet. See Figure 33.
1.7
2.1
2.3
2.4
2.4
2.6
2.6
2.8
2.8
3
3
3.2
3.4
3.4
3.7
Oxford Street/Regent Street
Bromley
Kingston
Croydon
Harrow
Bexleyheath
Wood Green
Stratford
Woolwich
Ealing
Greenwich
Hackney
Camberwell
Clapham Junction
Harlesden
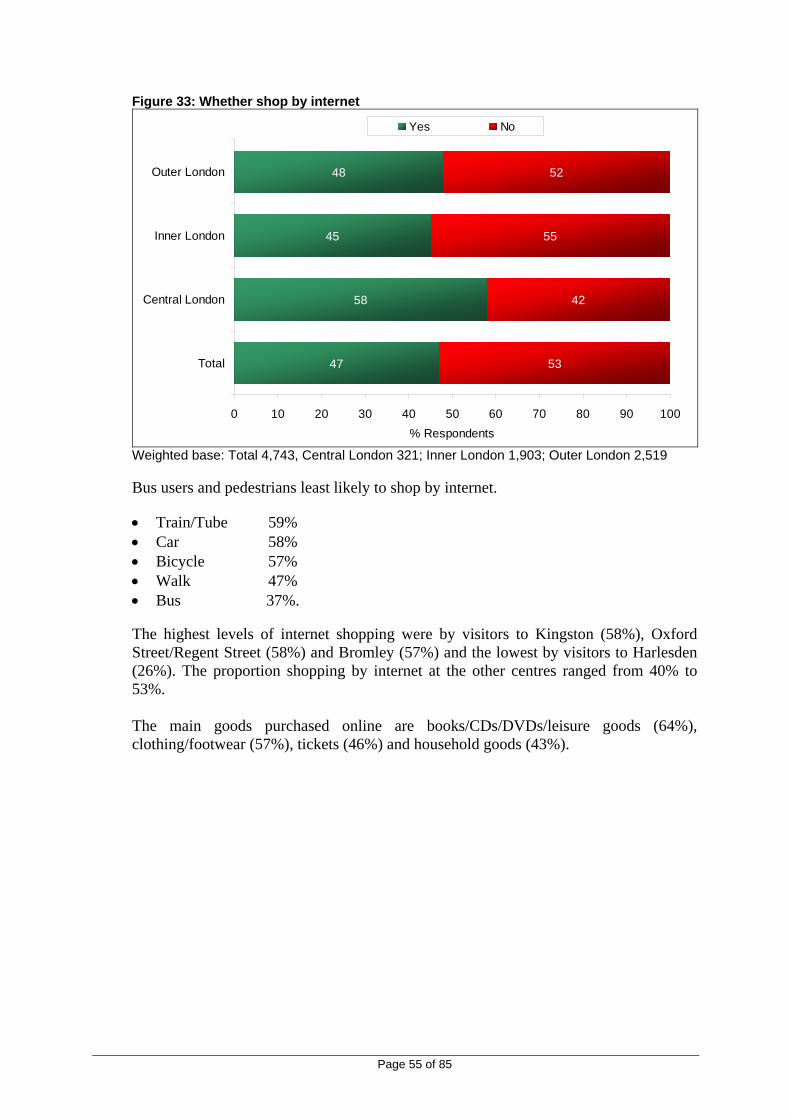
Page 55 of 85
Figure 33: Whether shop by internet
47
58
45
48
53
42
55
52
0 10 20 30 40 50 60 70 80 90 100
Total
Central London
Inner London
Outer London
% Respondents
Yes No
Weighted base: Total 4,743, Central London 321; Inner London 1,903; Outer London 2,519 Bus users and pedestrians least likely to shop by internet. • Train/Tube 59% • Car 58% • Bicycle 57% • Walk 47% • Bus 37%. The highest levels of internet shopping were by visitors to Kingston (58%), Oxford Street/Regent Street (58%) and Bromley (57%) and the lowest by visitors to Harlesden (26%). The proportion shopping by internet at the other centres ranged from 40% to 53%. The main goods purchased online are books/CDs/DVDs/leisure goods (64%), clothing/footwear (57%), tickets (46%) and household goods (43%).

Page 56 of 85
Table 29: Goods shopped for online
9
11
19
20
23
23
46
57
64
0 10 20 30 40 50 60 70 80 90 100
Take-away food
Wine, beer, spirits
Luxury goods
Major household goods
Food/groceries
Other household goods
Tickets
Clothing or footwear
Books/CDs/DVDs/leisure goods
% Respondents
Weighted base: 2,240 who shop online Figure 34 shows a comparison of the type of goods shopped for online and in town centres. Online predominates for books/CDs/DVDs/leisure goods, clothing/footwear, tickets, household goods and luxury goods. ‘In town centres’ predominates for food/groceries and take away food. Figure 34: Comparison of goods shopped for online and in town centres
9
12
4
4
4
15
7
4
46
11
33
11
19
20
9
23
46
23
64
57
0 10 20 30 40 50 60 70 80 90 100
Confectionery, tobacco, newspapers
Pharmaceuticals/toiletries
Wine, beer, spirits
Luxury goods
Major household goods
Take-away food
Other household goods
Tickets
Food/groceries
Books/CDs/DVDs/leisure goods*
Clothing or footwear
% Respondents
On line
in town centre
Weighted base: 2,240 who shop online and 4,738 who shop in town centres * includes ‘stationary’ for shoppers in town centre For online, ‘confectionery, tobacco, newspapers’ and ‘pharmaceuticals/toiletries’ not included

Page 57 of 85
3.14 Respondent Characteristics
Summary 60% of town centre visitors were female. There was an even spread of ages, with similar proportions in the four age groups under 55 years. 71% were from a White background, 16% from a Black and 6% from an Asian background. 60% were employed either full time (44%), or part time (16%). 15% were retired and 10% were students. The town centre sample tends to have lower household incomes than the background London population. 45% of town centre visitors had access to a car that they could have used to travel to the town centre. 92% of town centre visitors live in London: 38% in Inner London Boroughs and 54% in Outer London Boroughs. 31% of visitors to Central London are from outside London including 11% from outside the UK. 11% had a long-term physical or mental disability which limits daily activities or work they could do. 1% used a wheelchair. Gender Overall, the majority of respondents were female (60%). There were marginally fewer men in the Inner London town centres than in either Central London or Outer London centres – see Figure 35.

Page 58 of 85
Figure 35: Gender by type of centre
40
40
38
41
60
60
62
59
0 10 20 30 40 50 60 70 80 90 100
Total
Central London
Inner London
Outer London
% Respondents
Male Female
Weighted base: total 4,741, Central London 321, Inner London 1,903, Outer London 2,518 In Woolwich, Kingston, Bexleyheath and Strafford about two thirds were female (between 70% and 66%). In Harlesden 51% and in Camberwell 52% were female. Details of gender by individual town centre are provided in Table 57 in Appendix B. Comparison over time There has been a slight increase in female visitors.
2011 2009 2004 Male 40% 42% 41% Female 60% 58% 59%
Age There was an even spread of ages for the overall sample, with similar proportions in the four age groups under 55 years.

Page 59 of 85
Figure 36: Age
17
22
19
17
7
6
8
4
0 10 20 30 40 50
16-24
25-34
35-44
45-54
55-59
60-64
65-74
75 or over
% Respondents
Weighted base: Total sample 4,744 The Central London locations had a younger age profile than the Inner or Outer London town centres, with over half (51%) aged under 34 years old compared to 37% in Inner London town centres and 41% in Outer London town centres. See Figure 37. Figure 37: Age by type of centre
17
20
18
18
7
6
10
5
17
24
20
17
7
5
7
3
26
25
18
16
6
6
3
1
0 10 20 30 40 50
16-24
25-34
35-44
45-54
55-59
60-64
65-74
75 or over
% Respondents
Central LondonInner London
Outer London
Weighted base: Central London 321, Inner London 1,904, Outer London 2,520 In Bexleyheath, Bromley and Harrow the profile was older than in the other locations with over a quarter (26%-29%) aged over 60. The profile in Camberwell, Woolwich and Oxford Street/Regent Street is younger than the average with 8%-10% aged over 60. Details of age by individual town centre are provided in Table 58 in Appendix B.

Page 60 of 85
Comparison over time There is a slightly older age profile in 2011.
2011 2009 2004 16-24 17% 23% 18% 25-34 22% 22% 22% 35-44 19% 20% 22% 45-54 17% 12% 38% aged 45 or
older. Different age ranges used
55-64 13% 11% 65-74 8% 7% 75+ 4% 3%
Ethnicity Over two thirds of the sample (71%) is from a White background, 16% from a Black and 6% from an Asian background as shown in Figure 38. Figure 38: Ethnicity
1
1
5
16
6
71
0 10 20 30 40 50 60 70 80 90 100
Refused
Chinese or other ethnicbackground
Mixed
Black or Black British
Asian or Asian British
White
% Respondents
Weighted base: Total sample 4,744 Analysis by type of town centres shows that the Outer London town centres have a higher proportion of White visitors – 73% compared to 68-69% elsewhere. There are more black visitors in Inner London town centres.

Page 61 of 85
Figure 39: Ethnicity by type of centre
1
4
14
8
73
2
5
19
5
68
3
2
4
15
6
69
**
0 10 20 30 40 50 60 70 80 90 100
Refused
Chinese or other ethnicbackground
Mixed
Black or Black British
Asian or Asian British
White
% Respondents
Central LondonInner LondonOuter London
Weighted base: Central London 321, Inner London 1,904, Outer London 2,520 * = less than 0.5% In Bexleyheath 94% were from a White background. At Bromley, Kingston, Clapham Junction, Croydon and Greenwich the proportion from a White background was also much higher than average (between 79% and 88%). Less than half in Harlesden (44%) were from a White background. In Harlesden 39% of respondents were from a Black ethnic group as were 30% from Camberwell and 25% from Hackney. In Harrow 19% were from an Asian background. Details of ethnicity by individual town centre are provided in Table 59 in Appendix B. Comparison over time There are slightly more White visitors in 2011.
2011 2009 2004 White 71% 69% 70% Black or Black British 16% 16% 12% Asian or Asian British 6% 9% 12% Mixed 5% 4% 1% Other 1% 1% 2%
Employment status The majority of those who took part in the survey were employed either full time (44%), or part time (16%). A sixth were retired and a tenth were students.

Page 62 of 85
Figure 40: Employment Status
1
4
15
4
6
1
9
16
44
0 10 20 30 40 50 60 70 80 90 100
Other
Looking after family and home
Retired
Not working and not looking for work
Not working, but looking for work
A part time student
A full time student
Working part time (less than 30 hours a week)
Working full time (30+ hours a week)
% Respondents
Weighted base: Total sample 4,742 Those in Central London town centres were much more likely to be employed full time than those in suburban town centres – 55% compared to 42% or 43%. Those in Central London were also less likely to be retired than those in suburban town centres. See Figure 41. Figure 41: Employment Status by type of centre
1
4
18
3
7
1
7
16
42
1
5
13
5
6
1
10
16
43
1
6
2
2
1
15
15
55
0 10 20 30 40 50 60 70 80 90 100
Other
Looking after family and home
Retired
Not working and not looking for work
Not working, but looking for work
A part time student
A full time student
Working part time (less than 30 hours a week)
Working full time (30+ hours a week)
% Respondents
Central London
Inner London
Outer London
Weighted base: Central London 321, Inner London 1,904, Outer London 2,520 The highest proportion of employed respondents was in Oxford Street/Regent Street (70%), Harlesden (67%), Ealing (66%) and Clapham Junction (64%). The lowest proportions were in Bexleyheath (45%) and Greenwich (52%).

Page 63 of 85
There were high proportions of retired people in Bexleyheath (27%) and Bromley (26%). The highest proportions of students were in Greenwich (21%), Kingston (16%) and Oxford Street/Regent Street (16%). Details of employment status by individual town centre are provided in Table 60 in Appendix B. Comparison over time There were 5% more employed respondents in 2011 than in 2009 and 2004.
2011 2009 2004 Working full time 44% 40% 41% Working part time 16% 15% 14% Other 40% 45% 45%
Household Income Over half the sample (52%) said they were the chief income earner of the household. The proportion was higher in Inner London. Table 30: Whether chief income earner of household by type of centre Total Central
London Inner
London Outer
London % % % % Yes, respondent is Chief Income
Earner 52 48 55 50
No, someone else 45 48 43 47 Refused 3 4 2 4 Weighted base 4,732 320 1,900 2,513
Annual household income was probed. Forty two per cent either refused to answer or said they did not know. There was a fairly even income distribution across the income breaks shown to respondents. Table 31: Gross annual household income before deductions by type of centre Total Central
London Inner
London Outer
London % % % % Under £5,000 3 1 4 3 £5,000-£9,999 5 3 6 5 £10,000-£14,999 5 3 6 5 £15,000-£19,999 5 2 5 5 £20,000-£24,999 6 4 6 6 £25,000-£34,999 9 7 9 8 £35,000-£49,999 10 11 9 11 £50,000-£74,999 8 12 7 8 £75,000-£99,999 3 6 2 3 £100,000 or over 3 7 3 2 Don't know 21 27 20 22 Refused 21 15 22 22 Weighted base 4,714 313 1,902 2,500

Page 64 of 85
Details of income by individual town centre are provided in Table 61 in Appendix B. When the survey income data (reweighted after excluding refusals and don’t knows) is compared to overall London data (from Paycheck 201019) it shows that the town centre sample tends to have lower household incomes than the background London population. Figure 42: Town centres annual household income compared to overall London
1
7
8
9
9
17
19
17
12
6
9
9
9
11
15
18
14
10
0 10 20 30 40 50
Under £5,000
£5,000 to £9,999
£10,000 to £14,999
£15,000 to £19,999
£20,000 to £24,999
£25,000 to £34,999
£35,000 to £49,999
£50,000 to £74,999
£75,000 or over
% Respondents
Town Centres
London total
Household Size The median household size was two, representing 28% of households. A fifth of respondents lived alone.
19http://www.london.gov.uk/sites/default/files/dmag/Update%2030-2010%20PayCheck%202010.pdf
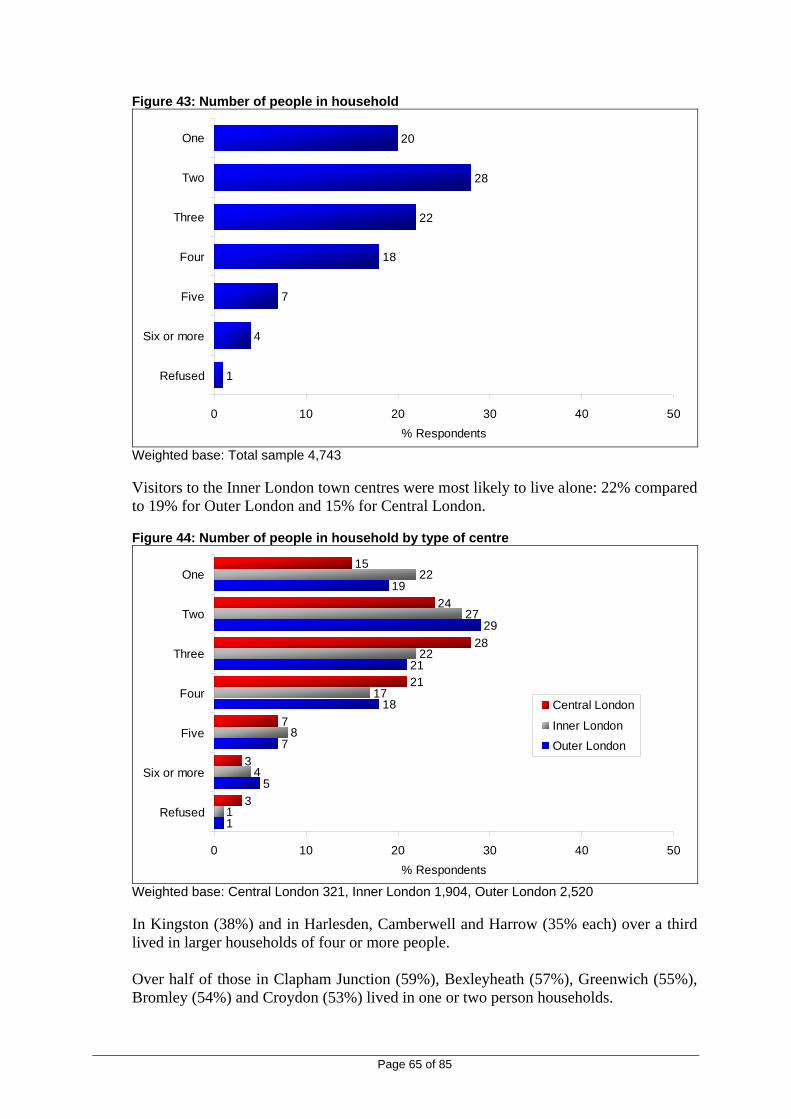
Page 65 of 85
Figure 43: Number of people in household
1
4
7
18
22
28
20
0 10 20 30 40 50
Refused
Six or more
Five
Four
Three
Two
One
% Respondents
Weighted base: Total sample 4,743 Visitors to the Inner London town centres were most likely to live alone: 22% compared to 19% for Outer London and 15% for Central London. Figure 44: Number of people in household by type of centre
1
5
7
18
21
29
19
1
4
8
17
22
27
22
3
3
7
21
28
24
15
0 10 20 30 40 50
Refused
Six or more
Five
Four
Three
Two
One
% Respondents
Central London
Inner London
Outer London
Weighted base: Central London 321, Inner London 1,904, Outer London 2,520 In Kingston (38%) and in Harlesden, Camberwell and Harrow (35% each) over a third lived in larger households of four or more people. Over half of those in Clapham Junction (59%), Bexleyheath (57%), Greenwich (55%), Bromley (54%) and Croydon (53%) lived in one or two person households.

Page 66 of 85
Details of household size by individual town centre are provided in Table 62 in Appendix B. Access to a Car Less than half the sample (45%) said they had access to a car that they could have used to travel to the town centre. Car access was much higher in the Outer London town centres (51%) than the Inner London town centres (36%) or Central London (46%). Just over one fifth (21%) of those from Outer London town centres drove on the day of interview compared with 9% for Inner London town centres and 4% for Central London. Figure 45: Access to a car by type of centre
15
4
9
21
30
42
27
30
55
53
63
49
2
1
0 10 20 30 40 50 60 70 80 90 100
Total
Central London
Inner London
Outer London
% Respondents
Yes, drove today Yes, but used another mode No, no access to a car or van Refused
Weighted base: total 4,741, Central London 321, Inner London 1,902, Outer London 2,519 There was a particularly high level of access to a car in Kingston (61%), Harrow (60%) and Bromley (58%) and a high proportion had driven to the area in each case (28%-32%). Car access in Stratford, Camberwell, Hackney and Woolwich was particularly low with 31% to 36% saying they had access to a car. Details of access to a car by individual town centre are provided in Table 63 in Appendix B.

Page 67 of 85
Comparison over time There has been a decrease in car access over time.
2011 2009 2004 Yes, drove today 15% 16% 22% Yes, used other mode 30% 31% 28% No access to a car 55% 52% 50%
Where town centre visitor lives Overall, 92% of town centre visitors lived in London: 38% in Inner London Boroughs20 and 54% in Outer London Boroughs. As would be expected the majority of visitors to Outer London town centres live in Outer London Boroughs (74%) and the majority of visitors to Inner London town centres live in Inner London Boroughs (63%). Almost a third of visitors to Central London (31%) are from outside London including 11% from outside the UK. Figure 46: Where live by type of centre
38
40
63
18
54
29
33
74
5
10
3
6
1
9
1
1
1
1
11
1
*
*
*
*
0 10 20 30 40 50 60 70 80 90 100
Total
Central London
Inner London
Outer London
% Respondents
Inner London Outer LondonThe South East of England Elsewhere in EnglandScotland, Wales or Northern Ireland Outside of the UK
Weighted base: total 4,704, Central London 310, Inner London 1,897, Outer London 2,497 * = less than 0.5% Details of where the respondent lives by individual town centre are provided in Table 67 in Appendix B.
20 Camden, City of Westminster, Hackney, Hammersmith & Fulham, Haringey, Islington, Kensington & Chelsea, Lambeth, Lewisham, Newham, Southwark, Tower Hamlets and Wandsworth

Page 68 of 85
Physical and Mental Impairments Eleven per cent of the sample had a long-term physical or mental disability which limits daily activities or work they could do. The percentage with a physical or mental impairment is much lower in Central London (3%) than in the inner and Outer London town centres (11%). Table 32: Long term physical or other impairment which limits daily activities or the work that can be done, including problems due to age by type of centre Total Central
London Inner
London Outer
London % % % % No, none 89 97 89 89 Mobility impairment 5 2 6 6 Visual impairment 1 0 * 1 Hearing impairment 1 1 1 1 Learning disability 1 * 1 1 Mental health condition 1 1 1 1 Serious long term illness 2 0 3 2 Other 1 * 1 1 Weighted base 4,743 321 1,904 2,519
* = less than 0.5% Wheelchair Usage Just one per cent of the sample uses a wheelchair. Table 33: Use of wheelchair for travelling by type of centre Total Central
London Inner
London Outer
London % % % % Yes 1 * 1 1 No 99 99 99 99 Weighted base 4,743 321 1,904 2,519
* = less than 0.5% Wheelchair use by individual town centre is shown in Table 65 in Appendix B. Whether carrying anything About half the town centre visitors were carrying shopping bags or using a shopping trolley (49%) and a tenth had a suitcase or rucksack.

Page 69 of 85
Figure 47: Whether respondent carrying anything
49
52
46
50
3
1
4
3
1
1
1
10
14
9
9
1
1
1
1
40
35
42
39*
0 10 20 30 40 50 60 70 80 90 100
Total
Central London
Inner London
Outer London
% Respondents
Shopping bag(s)/shopping trolley Buggy/pramCarrying a child/baby Suitcase/rucksackOther large/awkward object Nothing
Weighted base: total 4,741, Central London 321, Inner London 1,902, Outer London 2,519 * = less than 0.5% Details of what was carried by individual town centre are provided in Table 66 in Appendix B.

Page 70 of 85
4. CYCLE RESULTS
4.1 Introduction
This chapter sets out the findings for the cycle booster sample. The cycle boosters were undertaken at the following seven town centres: • Bexleyheath • Bromley • Croydon • Ealing • Harrow • Kingston • Oxford Street/Regent Street. In total 362 interviews were undertaken. Detailed tables on demographics, mode of access, frequency of visit, main purpose, spend and town centre improvements by the seven centres are shown in Appendix D.
4.2 Purpose of Visit
The majority of cyclists (70%) do not live or work within 10 minutes walk of the town centre but 19% live in the area, 7% work in the area and 4% both live and work within 10 minutes walk of the town centre. Bromley, Harrow and Kingston were the locations most likely to attract visitors from a wider catchment area (84%, 78% and 76% respectively from more than 10 minutes walk away). By contrast, 48% of those visiting Bexleyheath lived or worked within 10 minutes of the town centre. Reasons for visiting town centre All visitors were recruited on the basis that they were shopping, using a service or doing both in the centres21. Shopping was the predominant purpose and the main reason for visiting for 69% of cyclists. Eating and drinking out was also important being mentioned by 20% but was only the main purpose for 6%. All reasons and the main reasons for visiting the area are as shown in Table 34.
21 Although at Oxford Street those only working or living there were also in scope

Page 71 of 85
Table 34: Reasons for visiting town centre
All purposes %
Main purpose %
Shopping 69 52 Using service 23 15 Eating/drinking out 20 6 Work here 10 8 Other social/leisure 9 5 Using public amenity 8 4 Window shopping 6 * Live here 5 2 Personal business 4 3 General recreation 4 1 Visiting friends and relatives 4 3 Travelling through the area 3 1 Delivering goods 1 1 Dropping off/picking up friend or relative 1 0 Base 362 362
The main reason for visiting were similar for all areas as shown in Table 85 in Appendix D. However, those visiting Ealing and Croydon were more likely to be there for shopping compared with other centres (86% and 75% of visitors respectively compared to between 61% and 67% for the other town centres). A third were eating or drinking out in Bexleyheath and only 6% were doing so in Harrow compared to between 15% and 26% elsewhere. In terms of the main reason for being in the centre the most notable variations from the average were in Ealing where a higher proportion were shopping (73%) and in Bromley were the lowest proportion was shopping (37%).
4.3 Time Spent in Town Centre
The majority (65%) said they were planning to spend at least one hour in the town centre with 48% spending between one and three hours. Table 35: Time spent in town centre
Total %
Under 5 minutes 1 5-14 minutes 3 15-29 minutes 7 30-59 minutes 25 1-3 hours 48 More than 3 hours 17 Base 362 Those in Bexleyheath were planning on spending the most time in the town centre (an average of 1.9 hours compared to between 1.6 and 1.8 for the other town centres).
4.4 Frequency of Visiting
The majority of cyclists visit the town centre on a regular basis with 81% visiting the area once a week or more often as shown in Table 36.

Page 72 of 85
Table 36: Frequency of visiting town centre
Total %
5 or more days a week 25 3 or 4 days a week 20 2 days a week 17 Once a week 19 Once a fortnight 11 About once a month 5 Less than once a month 2 First time 2 Base 362 Cyclists in Oxford Street/Regent Street visit least frequently: 60% once a week or more often compared to between 75 and 90% elsewhere. Bexleyheath is the centre visited most frequently (94% visit once a week or more often) and Kingston also has a high proportion of frequent visitors (90% visit once a week or more).
4.5 Mode of Transport
Why Cycle used All reasons and the main reason for choosing to travel by cycle to access the area are shown in Table 37. Of all reasons given, over half of those who cycled cited speed (59%) and low cost (51%). Half said they need/enjoy the exercise. The main reasons given for cycling were speed (27%) and need/enjoy the exercise (26%). Table 37: All reasons and main reason for using cycle rather than any other method of transport to access area
All reasons
% Main reason
% Quicker 59 27 Cheaper/less expensive 51 18 Need/enjoy exercise/healthy 50 26 Easier/more convenient 31 7 More direct 28 3 Avoids parking difficulties 27 3 More relaxing/comfortable 18 6 Live very close by 14 2 Going to more than one place 13 1 No car/can’t drive 9 1 Weather issues 9 3 Had heavy bags/shopping to carry 4 1 Safer 4 * Avoid the congestion charge 4 * Only method possible 3 1 Travelling with children 1 0 Base 362 362 Note: for all reasons more than one answer may be given, so percentages add up to more than 100% * = less than 0.5%

Page 73 of 85
Other modes of transport sometimes used Bus was the most used ‘other’ mode with 56% of cyclists mentioning it. Over a third (35%) of bicycle users also sometimes walk to the town centres and 27% use a private vehicle. Table 38: Other modes used to town centre
Total %
Bus 56 Walked 35 Car/van/lorry 27 Train 16 Tube 11 Taxi/minicab 9 Motorbike/moped/scooter 4 Barclays Cycle Hire * Other * Base 362 * = less than 0.5% Frequency of mode use Under a quarter (23%) who cycled to the town centre cycle there five or more days a week. Table 39: Frequency of using mode to travel to this area
Total %
5 or more days a week 23 3 or 4 days a week 18 2 days a week 16 Once a week 19 Once a fortnight 10 About once a month 6 Less than once a month 4 First time 4 Base 362 The mean weekly frequency of cycling to the area of the town centre is 2.2 times. Those cycling to Harrow are the most frequent visitors by cycle (2.3 times a week on average) and those cycling to Croydon and Oxford Street/Regent Street are the least frequent visitors by cycle (1.9 times a week on average).
4.6 Attitudes and Use of Bus
Frequency buses used to travel in town centre Over two thirds (68%) sometimes used the bus to travel in the area of the town centre, even if they did not do so on the day of interview. Over a third (36%) had used bus in the area at least once a week. Just under a third (32%) said they never used the bus in the area.

Page 74 of 85
Bus use decreased slightly compared to the claimed frequency of use of twelve months ago as shown in Table 40. There was a 2% decrease in those that travel by bus at least once a week (from 38% to 36%), and a 5% increase in those never using buses (from 27% to 32%). Table 40: Change in frequency of bus use in area
Now %
12 months ago %
5 or more days a week 2 3 3 or 4 days a week 9 9 2 days a week 11 12 Once a week 14 14 Once a fortnight 10 7 About once a month 9 9 Less than once a month 12 17 Never 32 27 Base 362 362 Attitudes towards Bus Lanes and Bus Priority Measures Visitors by cycle were asked their opinion on a number of aspects relating to bus lanes and bus priority measures. Generally, they were in support of all the measures. There was strong agreement that bus lanes are of benefit to cyclists (mean score 7.8), that there should be stricter bus lane enforcement (7.4), that bus stops are conveniently located (7.2) and for goods vehicles not to be allowed in bus lanes (6.7). There was least support for buses being given priority at traffic lights (6.2) and there being more bus lanes (6.0). Figure 48: Agreement with statements about the area
45
49
57
64
66
76
38
35
27
31
24
18
17
16
16
5
9
5
0 10 20 30 40 50 60 70 80 90 100
There should be more bus lanes
Buses should be given priority at traffic lights
Goods vehicles should not be allowed in buslanes
Bus stops are conveniently located
There should be stricter enforcement of illegalparking in bus lanes
Bus lanes are of benefit to cyclists
% Respondents
Very/satisfied (7-10) Neutral (4-6) Very/dissatisfied (0-3)
Base: all cyclists: 362

Page 75 of 85
Encouraging More Bus Use Over half (62%) mentioned some improvements that could encourage (greater) bus use. Lower fares (28%), faster journeys (22%), more direct bus routes (17%) and more reliable buses (16%) were the most frequently suggested ways in which bus use could be encouraged as shown in Table 41 below. When asked for the main factor, the top three single factors that would encourage greater use of the bus were lower fares (19%), faster journey (10%) and more regular buses (7%). Table 41: Factors that would encourage use of buses more often All respondents All mentions
% Main factor
% Nothing 38 38 Lower fares 28 19 Faster journey 22 10 Direct bus route 17 6 More reliable buses 16 5 More regular/frequent buses 15 7 Reduce number of cars on the road/less congestion 9 2 More comfortable journey 8 2 Cleaner buses 7 * Greener buses 7 1 Make children behave/school buses 6 * Greater priority given to buses 5 1 More seats on buses/less crowded buses 5 1 More information about buses 5 2 Bus stop nearer home/destination 4 1 Safer buses 4 1 Stricter enforcement of illegal parking in bus lanes 3 1 More shelters at bus stops 3 0 More seating at bus stops 2 1 Improved ease of getting on and off buses 1 0 Other 1 1 Base 362 362 * = less than 0.5%
4.7 Encouraging Cycling
Cyclists were shown a card with the following list of potential improvements and asked which would encourage them to cycle more often in the area: • (More) cycle lanes on the roads • (More) dedicated cycle paths • Less road traffic • Free on-road cycle training • Bicycle hire scheme • (Better) bicycle parking facilities in this area • (Better) bicycle parking facilities at / near your home • None of these / nothing. Over nine tenths (91%) of cyclists mentioned at least one thing that might encourage them to cycle more often in the area.

Page 76 of 85
The main improvements were ‘more dedicated cycle paths’ (59%), ‘more cycle lanes on the roads’ (56%) ‘(Better) bicycle parking facilities in this area’ (37%) and ‘less road traffic’ (34%). Table 42: Things which would encourage cycling more often in this area
Total %
(More) dedicated cycle paths 59 (More) cycle lanes on the roads 56 (Better) bicycle parking facilities in this area 37 Less road traffic 34 (Better) bicycle parking facilities at/near your home 24 Bicycle hire scheme 16 Free on-road cycle training 9 None of these/nothing 8 Don’t know 1
Base 362 Table 43 shows the data by location. ‘(More) dedicated cycle paths’ was mentioned most often in Harrow (71%). ‘(More) cycle lanes on the roads’ was mentioned most often in Bexleyheath (67%) and Oxford Street/Regent Street (66%). ‘Less road traffic’ was mentioned most often in Oxford Street/Regent Street (51%). ‘Bicycle hire scheme’ was mentioned by 38% in Bexleyheath and 25% in Croydon. Thirteen per cent mentioned ‘Bicycle hire scheme’ in Oxford Street/Regent Street even though it already exists in central London. Table 43: Things which would encourage cycling more often in this area by town centre
Cro
ydon
Bex
leyh
eath
Bro
mle
y
Ealin
g
Har
row
Kin
gsto
n
Oxf
ord
St/
Reg
ent S
t
% % % % % % % (More) dedicated cycle paths 52 54 65 55 71 42 66 (More) cycle lanes on the roads 58 67 39 51 62 46 66 (Better) bicycle parking facilities in this
area 35 52 16 16 49 40 47
Less road traffic 29 42 33 18 29 36 51 (Better) bicycle parking facilities at/near
your home 25 44 10 6 30 14 40
Bicycle hire scheme 25 38 6 6 14 10 13 Free on-road cycle training 8 10 2 8 14 8 8 None of these/nothing 8 0 16 18 3 8 2 Don’t know 0 2 0 2 0 0 0 Base 48 48 51 49 63 50 53
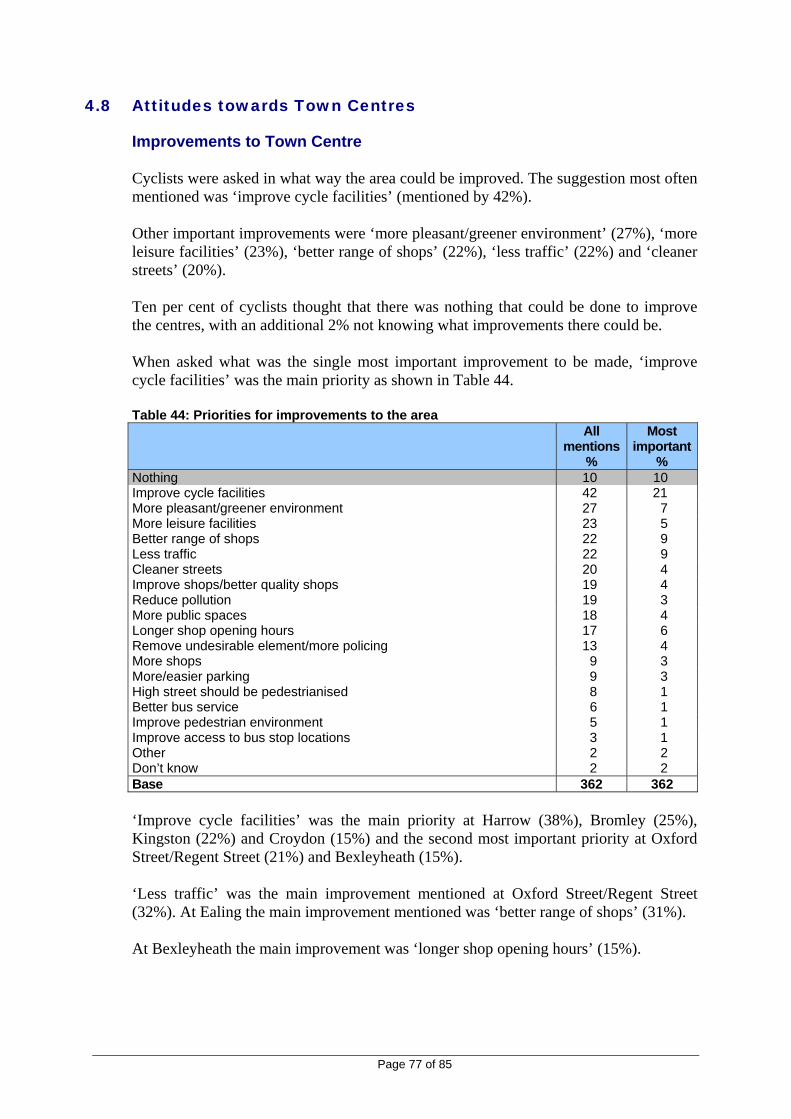
Page 77 of 85
4.8 Attitudes towards Town Centres
Improvements to Town Centre Cyclists were asked in what way the area could be improved. The suggestion most often mentioned was ‘improve cycle facilities’ (mentioned by 42%). Other important improvements were ‘more pleasant/greener environment’ (27%), ‘more leisure facilities’ (23%), ‘better range of shops’ (22%), ‘less traffic’ (22%) and ‘cleaner streets’ (20%). Ten per cent of cyclists thought that there was nothing that could be done to improve the centres, with an additional 2% not knowing what improvements there could be. When asked what was the single most important improvement to be made, ‘improve cycle facilities’ was the main priority as shown in Table 44. Table 44: Priorities for improvements to the area All
mentions %
Most important
% Nothing 10 10 Improve cycle facilities 42 21 More pleasant/greener environment 27 7 More leisure facilities 23 5 Better range of shops 22 9 Less traffic 22 9 Cleaner streets 20 4 Improve shops/better quality shops 19 4 Reduce pollution 19 3 More public spaces 18 4 Longer shop opening hours 17 6 Remove undesirable element/more policing 13 4 More shops 9 3 More/easier parking 9 3 High street should be pedestrianised 8 1 Better bus service 6 1 Improve pedestrian environment 5 1 Improve access to bus stop locations 3 1 Other 2 2 Don’t know 2 2 Base 362 362 ‘Improve cycle facilities’ was the main priority at Harrow (38%), Bromley (25%), Kingston (22%) and Croydon (15%) and the second most important priority at Oxford Street/Regent Street (21%) and Bexleyheath (15%). ‘Less traffic’ was the main improvement mentioned at Oxford Street/Regent Street (32%). At Ealing the main improvement mentioned was ‘better range of shops’ (31%). At Bexleyheath the main improvement was ‘longer shop opening hours’ (15%).

Page 78 of 85
Safety The perceived safety of the town centre neighbourhood in day time and at night was explored. Overall, 68% of cyclists felt very safe and 28% felt fairly safe during the day. A tenth of cyclists didn’t go out during the evening/after dark in the town centre neighbourhood. Of those who did, the feeling of safety fell markedly with 37% saying they felt very safe and 42% fairly safe. A positive balance of 19% of cyclists had seen more uniformed police officers in the local neighbourhood in the past year: 31% more, 12% less. Over three quarters (83%) of cyclists felt very or fairly safe when cycling in the town centre neighbourhood. Four per cent felt very unsafe. Table 45: Feeling of safety of when cycling in the neighbourhood
Total %
Very safe 40 Fairly safe 43 A bit unsafe 13 Very unsafe 4 Base 362 Cyclists in Oxford Street/Regent Street were most likely to feel unsafe (31% a bit or very unsafe). Cyclists in Kingston and Bromley were most likely to feel very safe (60% and 59% respectively compared to between 21% and 48% elsewhere). Table 46: Feeling of safety of when cycling in the neighbourhood by town centre
Cro
ydon
Bex
leyh
eath
Bro
mle
y
Ealin
g
Har
row
Kin
gsto
n
Oxf
ord
St/
Reg
ent S
t
% % % % % % % Very safe 29 21 59 39 48 60 23 Fairly safe 52 68 24 49 40 28 46 A bit unsafe 13 11 8 12 8 10 27 Very unsafe 6 0 10 0 5 2 4 Base 48 47 51 49 63 50 52
4.9 Use of Other Shopping Centres
Over two thirds of town centre visitors (64%) go to other shopping centres in and around London. The most visited other shopping centres22 were Westfield (26%) and Bluewater (24%).
22 From a list shown to respondents

Page 79 of 85
Table 47: Whether go to shopping centres in and around London
Total %
No 36 Westfield 26 Bluewater 24 Croydon 22 Brent Cross 14 Lakeside 14 Canary Wharf 10 Elephant & Castle 9 Whiteleys 7 Victoria Place 5 Aylesham Shopping Centre 1 Base 362
4.10 Oxford Street/Regent Street
There were specific questions asked for respondents at Oxford Street/Regent Street covering possible disruption because of Crossrail works, the diagonal crossing at Oxford Circus and why they visit the area. Why visit Oxford Street The main reasons why cyclists at Oxford Street were visiting Oxford Street rather than going somewhere else were because they worked near there (36%) and because of its shopping facilities: 32% were visiting a particular shop and 17% considered to be the best shopping area. Table 48: Why visiting Oxford Street area today rather than going somewhere else
Total %
Work near here 36 Visiting a particular shop 32 Oxford Street is best shopping area 17 Meeting people here 15 Live near here 13 As a ‘day out’/’trip into town’ 11 More/better/bigger range of shops 8 Visiting other places in London as well 8 Had to be in Central London for other reason 8 Longer shop opening hours 6 Visiting a particular leisure facility 6 To do something different/special 4 Easy for me to travel to and from 4 More leisure facilities, eg restaurants, bars, cinemas etc 2 Other 2 Base 53 Awareness of changes to travel around Tottenham Court Road Just over half (51%) of cyclists at Oxford Street were aware of the changes to travel around Tottenham Court Road.

Page 80 of 85
Awareness for reasons for diversions and travel changes Of those who were aware of the changes to travel around Tottenham Court Road 63% knew it was because of building rail/Crossrail station (32% of all cyclists at Oxford Street). Other reasons mentioned included: • Improving Underground station 44% • Transport works (unspecified) 22% • New shops/shopping centre development 19% • Building works (unspecified) 15% • Utility works (eg electricity, gas, water) 7% • Improving pavements/pedestrian facilities 7% • Improving bus facilities/bus routes 4% • Improving road layout/better roads 4% Eleven per cent said they didn’t know. Impact of travel changes on travel Only 11% of cyclists at Oxford Street/Regent Street said they were affected by the travel changes around Tottenham Court Road. Of the minority (6 cyclists) that were affected, four changed their cycling route. The other two didn’t drive or catch a bus. Diagonal Crossing Over half the cyclists (51%) at Oxford Street/Regent Street had used the diagonal crossing at Oxford Circus. There were very high levels of satisfaction with both the safety and ease of crossing the road on the diagonal crossing. The means scores (where 0 = very dissatisfied and 10 = very satisfied) were: • The ease of crossing the road 8.7 • The safety of crossing the road 8.4
4.11 Shopping and Expenditure in the Area
A wide range of services and shops were visited by respondents. Thirty per cent of the cyclists visiting the town centres were shopping for groceries and food or for clothes or footwear as shown in Table 49. Other items or services that were mentioned by 10% or more were: • Services (eg hairdressers) 25% • Café or restaurant 15%

Page 81 of 85
• Take away food 14% • Stationery, books, CDs, DVDs, leisure goods 14% • Other household goods 10%. Table 49: Range of things shopped for and services used
Total %
Food/groceries 30 Clothing or footwear 30 Services 25 Eating in a café or restaurant 15 Take-away food 14 Stationery/books/CDs/DVDs/leisure goods 14 Other household goods 10 Pharmaceuticals/toiletries 8 Confectionery, tobacco, newspapers 7 Luxury goods 5 Major household goods 5 Having a drink in a pub or wine bar 5 Going to cinema, theatre, concert, leisure facility etc 5 Wine, beer, spirits 3 Travel Pass/mobile top up/phonecard 3 Other 2 Base 357 Food/grocery shopping was most mentioned at three of the town centres: Bromley (27%), Ealing (47%), and Kingston (36%) and least mentioned at Oxford Street/Regent Street (8%). Clothing or footwear shopping was most mentioned at two town centres: Croydon (35%) and Oxford Street/Regent Street (50%). Services was mentioned at two town centres: Bexleyheath (40%) and Harrow (33%).
4.12 Average Spend
Visitors were asked how much they anticipated spending in the centre during their visit and also how much they spend on average per visit. An average total spend per week was then calculated based on the frequency of visiting the centre. It should be noted that respondents were asked how much they had spent according to broad bands of expenditure. In order to calculate the average spend figures mid point values were applied to the bands and full details of these values are provided in Appendix C. Overall the average spend was £28 on the day of interview which is the same as the usual spend per visit (£28). The average spend per week was £70 and the average spend per month was £278. This is considerably higher than the £188 for the non booster cycle sample. The reasons for the differences in average spend between the cycle booster sample and cyclists in the core sample were investigated. It appears that the majority of the difference is explained by a number of cyclists in the booster sample who give very high average spend per month responses: 4% over £1,000
Page 82 of 85
compared to none for the core sample. If we remove responses over a £1,000, the average monthly spend for the cycle booster drops to £208 from £278 which is much closer to the £188 for the core sample. The other potential reason for the discrepancy is a different sampling approach. The core cyclist sample was drawn randomly as part of an overall town centre visitor sample whereas the booster sample was more targeted. This may have led to higher spending cyclists being sampled in the booster sample. Oxford Street/Regent Street (£50), Croydon (£33) and Ealing (£32) were the town centres with the highest levels of spend on the day of interview. Visitors to Bromley (£20) and Harrow (£21) spent the least. Those visiting Kingston spend the most on average per week (£92), with those visiting Croydon (£81), Bexleyheath (£75) and Oxford Street/Regent Street (£74) also having high weekly spends. Those visiting Bromley (£34) spent least on average per week.
4.13 Online Shopping
Two thirds of cyclists visiting the town centres shop by internet. The highest levels of internet shopping were by visitors to Oxford Street/Regent Street (77%) and the lowest by visitors to Harrow (51%). The main goods purchased online are: • Books/CDs/DVDs/leisure goods 71% • Tickets 49% • Clothing or footwear 43% • Other household goods 26% • Major household goods 23% • Luxury goods 21% • Food/groceries 18%
4.14 Respondent Characteristics
Gender Seventy per cent of cyclists visiting the town centres were male. In Ealing only 43% were male.
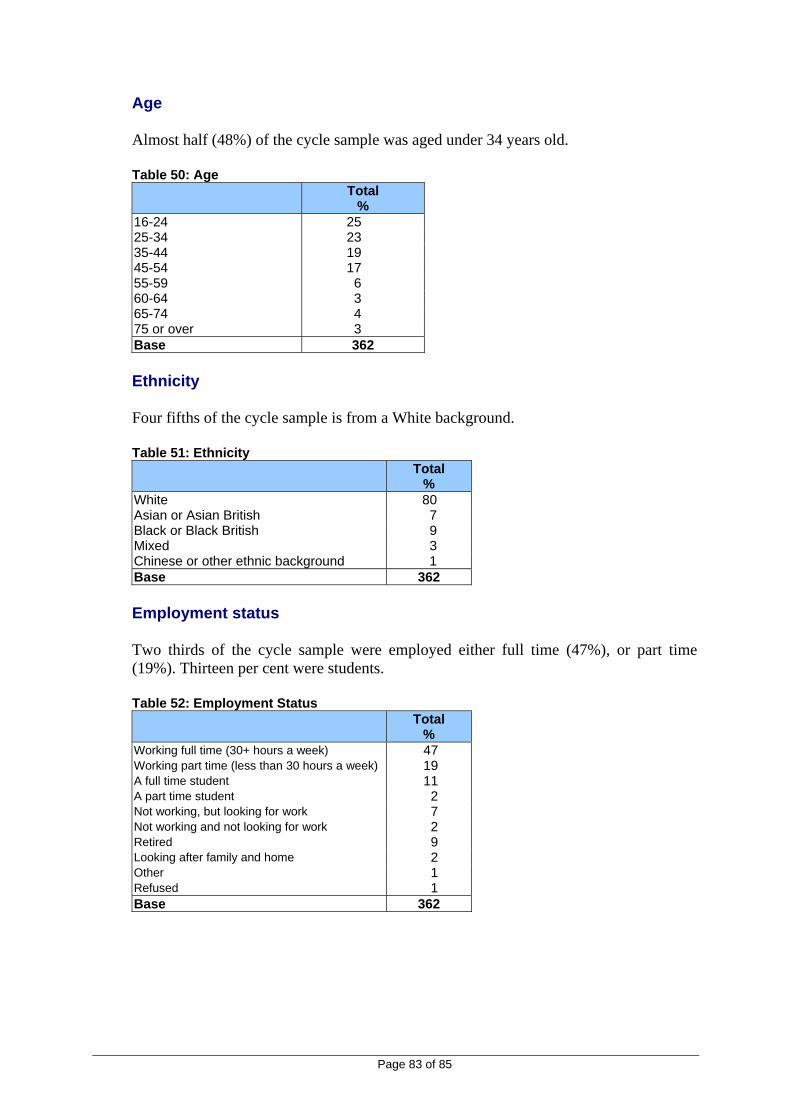
Page 83 of 85
Age Almost half (48%) of the cycle sample was aged under 34 years old. Table 50: Age
Total %
16-24 25 25-34 23 35-44 19 45-54 17 55-59 6 60-64 3 65-74 4 75 or over 3 Base 362 Ethnicity Four fifths of the cycle sample is from a White background. Table 51: Ethnicity
Total %
White 80 Asian or Asian British 7 Black or Black British 9 Mixed 3 Chinese or other ethnic background 1 Base 362 Employment status Two thirds of the cycle sample were employed either full time (47%), or part time (19%). Thirteen per cent were students. Table 52: Employment Status
Total %
Working full time (30+ hours a week) 47 Working part time (less than 30 hours a week) 19 A full time student 11 A part time student 2 Not working, but looking for work 7 Not working and not looking for work 2 Retired 9 Looking after family and home 2 Other 1 Refused 1 Base 362

Page 84 of 85
Household Income Over half the sample (57%) said they were the chief income earner of the household. Annual household income was probed. Thirty eight per cent either refused to answer or said they did not know. There was a fairly high income distribution with 29% having annual household incomes of £35,000 or over. Table 53: Gross annual household income before deductions Total % Under £5,000 4 £5,000-£9,999 4 £10,000-£14,999 6 £15,000-£19,999 4 £20,000-£24,999 4 £25,000-£34,999 11 £35,000-£49,999 12 £50,000-£74,999 10 £75,000-£99,999 3 £100,000 or over 4 Don't know 17 Refused 21 base 362
Household Size The median household size was two, representing 25% of households. Nineteen per cent of respondents lived alone. Table 54: Number of people in household Total % One 19 Two 25 Three 20 Four 21 Five 11 Six or more 3 Refused 2 base 362
Access to a Car Half the cycle sample (50%) said they had access to a car that they could have used to travel to the town centre.

Page 85 of 85
Physical and Mental Impairments Four per cent of the cycle sample had a long-term physical or mental disability which limits daily activities or work they could do. Table 55: Long term physical or other impairment which limits daily activities or the work that can be done, including problems due to age Total % No, none 96 Mobility impairment 1 Visual impairment 1 Hearing impairment 1 Mental health condition 1 Serious long term illness 1 Other * Base 362
* = less than 0.5% Whether carrying anything Almost two thirds (65%) of cyclist town centre visitors were carrying something: Table 56: Whether respondent carrying anything Total % Nothing 35 Suitcase/rucksack 40 Shopping bag(s)/shopping trolley 25 Other large/awkward object 1 Base 362

APPENDIX A
Paper Version of Questionnaire

Interviewer name: Interviewer no: Date: Time: Introduction I am conducting a survey on behalf of Transport for London on travel to this area and use of the town centre. Could you spare a few minutes to answer some questions please? Any answer you give will be treated in confidence in accordance with the Code of Conduct of the Market Research Society. Q1. Can I just check – do you or does anyone in your household work in any of the following
occupations? SHOWCARD 1 1 Advertising ............................................................... 1 THANK AND CLOSE 2 Journalism ................................................................ 1 THANK AND CLOSE 3 London Underground / London Transport / TfL ...... 1 THANK AND CLOSE 4 Market research ........................................................ 1 THANK AND CLOSE 5 None of the above ..................................................... 1 GO TO Q2
Q2. Have you, or will you, be using any of the shops or facilities in this area, or are you just passing through, for example on your way to work? 1. Yes, have/will be using shops/facilities 2. No, just passing through IF LOCATION = 12 CONTINUE; OTHERWISE THANK AND CLOSE
Q3. All the questions I am going to ask you refer to the area shown on this map. SHOW MAP Please look at this card and tell me which of these best describes your reasons for visiting this area on this occasion today? SHOWCARD 2. CODE ALL MENTIONED IN Q3 BELOW Q3 Q4
1 Shopping ........................................................................................ 1 ........... 1 2 Using service e.g. bank, post office, hairdresser, travel agent ........ 1 ........... 2 3 Using public amenity e.g. court, police station, library, hospital ... 1 ........... 3 4 Eating/drinking out ......................................................................... 1 ........... 4 5 Other social/leisure ........................................................................ 1 ........... 5 6 Buying petrol .................................................................................. 1 ........... 6 7 Delivering goods ............................................................................ 1 ........... 7 8 Window shopping .......................................................................... 1 ........... 8 9 Personal business e.g. job interview, church .................................. 1 ........... 9 10 General recreation .......................................................................... 1 ......... 10
11 Live here ......................................................................................... 1 ......... 11 12 Work here ....................................................................................... 1 ......... 12 13 Travelling through the area ............................................................ 1 ......... 13 14 Visiting friends and relatives .......................................................... 1 ......... 14 15 Dropping off/picking up friend or relative (incl. school) .............. 1 ......... 15 16 Other CODE AND WRITE IN ..................................................... 1 ......... 16
Q4. IF MORE THAN ONE MENTIONED IN Q3 ASK: And what is your ONE main reason for visiting this area on this occasion today? CODE ONE ACTIVITY IN COLUMN Q4 ABOVE
Details of visiting area Q5. SHOW MAP How often do you visit the area shown on this map?
1 5 or more days a week 6 About once a month 2 3 or 4 days a week 7 Less than once a month 3 2 days a week 8 First time 4 Once a week 9 Don’t know 5 Once a fortnight
Q6. Do you live or work within ten minutes walk of this area? 1 Live within 10 minutes walk 4 No, neither 2 Work within 10 minutes walk 5 Don’t know 3 Both
Town Centres Survey 2011
LOCATION: 1 Camberwell 9 Harlesden 2 Clapham Junction 10 Harrow 3 Croydon 11 Kingston 4 Bexleyheath 12 Oxford Street/Regent Street 5 Bromley 13 Stratford 6 Ealing 14 Wood Green 7 Greenwich 15 Woolwich 8 Hackney
EP: 1 2 3
AT LEAST ONE OF 1 – 10 MUST BE CODED UNLESS LOCATION IS OXFORD STREET/REGENT STREET WHERE 11 AND 12 CAN ALSO BE ONLY CODE

Mode of transport Q7. How did you travel to this area today? PROBE FOR MAIN METHOD. CODE ONE ONLY
1 Drove a car / van / lorry 7 Train 2 Drove a motorbike / moped / scooter 8 Bicycle 3 Drove a delivery vehicle 9 Barclays Cycle Hire (IF LOCATION = 12) 4 Given a lift 10 Walked 5 Bus 11 Taxi / minicab 6 Tube / Underground 12 Other WRITE IN ………………………….
Q8. How frequently do you use [MODE OF TRANSPORT AT Q7] to travel to this area? 1 5 or more days a week 6 About once a month 2 3 or 4 days a week 7 Less than once a month 3 2 days a week 8 First time 4 Once a week 9 Don’t know 5 Once a fortnight
Q9. What other modes do you use to travel to this area? MULTICODE 1 Car / van / lorry 6 Bicycle 2 Motorbike / moped / scooter 7 Barclays Cycle Hire (IF LOCATION = 12) 3 Bus 8 Walk all the way 4 Tube / Underground 9 Taxi / minicab 5 Train 10 Other WRITE IN ………………………….
Q10. IF BUS AT Q7 ASK: How would you rate the following aspects of your journey by bus today? showcard 3. TICK START AND ROTATE. READ OUT
extremely extremely dissatisfied satisfied
1 Length of time waited for the bus .......... 0 1 2 3 4 5 6 7 8 9 10 2 Comfort of journey ................................ 0 1 2 3 4 5 6 7 8 9 10 3 Value for money .................................... 0 1 2 3 4 5 6 7 8 9 10 4 Ease of getting on and off the bus .......... 0 1 2 3 4 5 6 7 8 9 10 5 Level of crowding on the bus ................. 0 1 2 3 4 5 6 7 8 9 10 6 Length of time the journey took ............. 0 1 2 3 4 5 6 7 8 9 10 7 Convenience of the bus stops ................. 0 1 2 3 4 5 6 7 8 9 10
Q11. ASK ALL Which of the reasons on this card describe why you decided to use …. (MODE OF TRANSPORT USED AT Q7) rather than any other method of transport? SHOWCARD 4. CODE ALL MENTIONED UNDER Q11 Q11 Q12
1 Cheaper/less expensive ...................................... 1 ........... 1 2 Quicker ............................................................... 1 ........... 2 3 More direct ......................................................... 1 ........... 3 4 Had heavy bags/shopping to carry ..................... 1 ........... 4 5 Travelling with children ..................................... 1 ........... 5 6 More relaxing/comfortable ................................. 1 ........... 6 7 Easier/more convenient ...................................... 1 ........... 7 8 Safer ................................................................... 1 ........... 8 9 Avoids parking difficulties ................................. 1 ........... 9 10 Going to more than one place ............................ 1 ......... 10 11 Only method possible ........................................ 1 ......... 11 12 Live very close by .............................................. 1 ......... 12 13 Need/enjoy exercise/healthy............................... 1 ......... 13 14 No car/can’t drive ............................................... 1 ......... 14 15 Weather issues .................................................... 1 ......... 15 16 Avoid the congestion charge .............................. 1 ......... 16 17 Don’t know ........................................................ 1 ......... 17 18 Other (PLEASE WRITE IN) ............................ 1 ......... 18 …………………………………………………………………
Q12. IF MORE THAN ONE ANSWER AT Q11 ASK And which ONE reason best describes why you decided to use that method? CIRCLE CODE IN COLUMN Q14 ABOVE FOR ONE REASON ONLY

Q13. ASK ALL How frequently do you travel by bus in this area? 1 5 or more days a week 6 About once a month 2 3 or 4 days a week 7 Less than once a month 3 2 days a week 8 First time 4 Once a week 9 Never 5 Once a fortnight 10 Don’t know
Q14. How frequently did you travel by bus in this area 12 months ago? 1 5 or more days a week 6 About once a month 2 3 or 4 days a week 7 Less than once a month 3 2 days a week 8 First time 4 Once a week 9 Not at all/never 5 Once a fortnight 10 Don’t know
Q15. Which of the things shown on this card would encourage you to use buses more often in this area? SHOWCARD 5. PROBE. CODE ALL MENTIONED UNDER Q15
Q15 Q16 1 Nothing GO TO Q17 ............................................................ 1 2 More regular / frequent buses ................................................ 1 ........... 2 3 More reliable buses ................................................................ 1 ........... 3 4 Faster journey ........................................................................ 1 ........... 4 5 Direct bus route ...................................................................... 1 ........... 5 6 Greater priority given to buses ............................................... 1 ........... 6 7 Reduce number of cars on the road / less congestion ............ 1 ........... 7 8 Stricter enforcement of illegal parking in bus lanes ............... 1 ........... 8 9 More seats on buses / less crowded buses .............................. 1 ........... 9 10 More comfortable journey ..................................................... 1 ......... 10 11 More shelters at bus stops ...................................................... 1 ......... 11 12 More seating at bus stops ....................................................... 1 ......... 12 13 Bus stop nearer home/destination .......................................... 1 ......... 13 14 Improved ease of getting on and off buses ............................. 1 ......... 14 15 More information about buses ............................................... 1 ......... 15 16 Safer buses ............................................................................. 1 ......... 16 17 Make children behave/school buses ....................................... 1 ......... 17 18 Cleaner buses ......................................................................... 1 ......... 18 19 Greener buses ......................................................................... 1 ......... 19 20 Lower fares ............................................................................ 1 ......... 20 21 Other (PLEASE WRITE IN) ................................................ 1 ......... 21
Q16. IF MORE THAN ONE ANSWER AT Q15 ASK And which ONE change would be most likely to encourage you to use buses more? SHOWCARD 5 CIRCLE ONE CODE IN COLUMN Q18 ABOVE FOR ONE REASON ONLY
Q17. How strongly do you agree or disagree with each of the following statements about this area? SHOWCARD 6. TICK START AND ROTATE. READ OUT
strongly strongly disagree agree
1 There should be more bus lanes ............ 0 1 2 3 4 5 6 7 8 9 10 2 There should be stricter enforcement
of illegal parking in bus lanes ................ 0 1 2 3 4 5 6 7 8 9 10 3 Taxis should not be allowed in
bus lanes
3 Goods vehicles should not be allowed in bus lanes ............................... 0 1 2 3 4 5 6 7 8 9 10
4 Buses should be given priority at traffic lights ........................................ 0 1 2 3 4 5 6 7 8 9 10
5 Bus stops are conveniently located ........ 0 1 2 3 4 5 6 7 8 9 10 6 Bus lanes are of benefit to cyclists ......... 0 1 2 3 4 5 6 7 8 9 10
Q18.
Q18B How safe do you feel in this neighbourhood during the day? 1 Very safe 4 Very unsafe 2 Fairly safe 5 Never go out in the day 3 A bit unsafe

Q18C How safe do you feel in this neighbourhood during the evening/after dark? 1 Very safe 4 Very unsafe 2 Fairly safe 5 Never go out in the evening 3 A bit unsafe
Q18E In the past year, would you say you have seen more, less or about the same amount of uniformed police officers (that is, police men and women and Police Community Support Officers) in this local neighbourhood? 1 More 3 Less 2 About the same 4 Don’t know
Q18F IF CYCLIST (Q7 = 8 OR 9 OR Q9 = 6 OR 7) ASK: How safe do you feel when cycling in this neighbourhood? 1 Very safe 3 A bit unsafe 2 Fairly safe 4 Very unsafe
Q19. Which of the things shown on this card would encourage you to cycle more often in this area? SHOWCARD 7. CODE ALL MENTIONED
1 (More) cycle lanes on the roads .......................................... 1 2 (More) dedicated cycle paths .............................................. 1 3 Less road traffic .................................................................. 1 4 Free on-road cycle training ................................................. 1 5 Bicycle hire scheme ............................................................ 1 6 (Better) bicycle parking facilities in this area ..................... 1 7 (Better) bicycle parking facilities at / near your home ........ 1 8 None of these / nothing ....................................................... 1 9 Don’t know ......................................................................... 1
Q20.
1 on map 3 don’t know 2 off map
Q21. ASK IF DROVE OR WAS GIVEN LIFT (Q7 CODES 1-4), OTHERWISE GO TO Q23 Where did you park your vehicle? Was it… READ OUT 1 Off street residential parking 5 On main road 9 Don’t know 2 Off street private parking (eg driveway) 6 On side road 3 Off street municipal/NCP car park 7 In filling station forecourt 4 In store/pub/take-away car park 8 Other place
Q22. How satisfied are you with each of the following: SHOWCARD 8. READ OUT extremely extremely dissatisfied satisfied
1 The number of parking spaces provided in this area? ............................ 0 1 2 3 4 5 6 7 8 9 10
2 The ease of access to this area by car? .. 0 1 2 3 4 5 6 7 8 9 10
Shopping and expenditure in the area Q23. Could you look at this card and tell me the range of things you are shopping for or services you are
using in this area today? SHOWCARD 9. CODE ALL MENTIONED 1 Food/groceries ......................................................................................... 1 2 Take-away food ....................................................................................... 1 3 Wine, beer, spirits ................................................................................... 1 4 Clothing or footwear ............................................................................... 1 5 Confectionery, tobacco, newspapers ....................................................... 1 6 Stationery/books/CDs/DVDs/leisure goods ............................................ 1 7 Pharmaceuticals/toiletries ....................................................................... 1 8 Luxury goods .......................................................................................... 1 9 Major household goods ........................................................................... 1 10 Other household goods (eg electrical goods) .......................................... 1 11 Travel Pass/mobile top up/phonecard ..................................................... 1 12 Services (e.g. hairdresser, dry cleaners, Post Office, travel agent) ........ 1 13 Eating in a café or restaurant ................................................................... 1 14 Having a drink in a pub or wine bar ........................................................ 1 15 Going to cinema, theatre, concert, leisure facility etc ............................. 1 16 Other (PLEASE WRITE IN) ................................................................ 1

Q24. How much will you have spent in this area today? SHOWCARD 10 1 Nothing 6 £15-£19.99 11 £100-£149.99 2 Under £1 7 £20-£29.99 12 £150-£199.99 3 £1-£4.99 8 £30-£49.99 13 £200+ 4 £5-£9.99 9 £50-£74.99 14 Don’t know 5 £10-£14.99 10 £75-£99.99 15 Refused
Q25. How much do you typically spend on average per visit to this area? SHOWCARD 10 1 Nothing 6 £15-£19.99 11 £100-£149.99 2 Under £1 7 £20-£29.99 12 £150-£199.99 3 £1-£4.99 8 £30-£49.99 13 £200+ 4 £5-£9.99 9 £50-£74.99 14 Don’t know 5 £10-£14.99 10 £75-£99.99 15 Refused
Q26. How long will you spend in this area today altogether? 1 Under 5 minutes 4 30-59 minutes 7 Don’t know 2 5-14 minutes 5 1-3 hours 3 15-29 minutes 6 More than 3 hours
Q27. In what ways do you think this area could be improved? SHOW MAP. CODE ALL MENTIONED IN COLUMN A BELOW. SHOWCARD 11
Q28. Which of these would be the most important reason? PROBE FOR MOST IMPORTANT AND CODE IN 1ST COLUMN A 1ST
1 More shops......................................................................................... 1 1 2 Better range of shops ......................................................................... 2 2 3 Improve shops / better quality shops ................................................. 3 3 4 Longer shop opening hours ................................................................ 4 4 5 More leisure facilities e.g. restaurants, bars, cinemas etc .................. 5 5 6 More pleasant/greener environment .................................................. 6 6 7 Cleaner streets .................................................................................... 7 7 8 Reduce pollution ................................................................................ 8 8 9 More public spaces ............................................................................ 9 9 10 Remove undesirable element/more policing .................................... 10 10 11 Less traffic ....................................................................................... 11 11 12 High street should be pedestrianised ................................................ 12 12 13 Improve pedestrian environment ..................................................... 13 13 14 More/easier parking ......................................................................... 14 14 15 Better bus service ............................................................................. 15 15 16 Improve access to bus stop locations ............................................... 16 16 17 Improved cycle facilities .................................................................. 17 17 18 Other ............................................................................................... 18 18 19 Nothing ............................................................................................ 19 20 Don’t know ...................................................................................... 20 20
Oxford Street/Regent Street only – others go to Q29A QX1 Why are you visiting this area – the Oxford Street area – today, rather than going somewhere else?
1 Oxford Street is best shopping area ................................................ 1 2 Visiting a particular shop ............................................................... 1 3 More / better / bigger range of shops .............................................. 1 4 Longer shop opening hours ............................................................ 1 5 Visiting a particular leisure facility ................................................ 1 6 More leisure facilities, e.g. restaurants, bars, cinemas etc .............. 1 7 Visiting other places in London as well ......................................... 1 8 As a ‘day out’ / ‘trip into town’ ...................................................... 1 9 To do something different / special ................................................ 1 10 Had to be in Central London for other reason ................................ 1 11 Meeting people here ....................................................................... 1 12 Good public transport ..................................................................... 1 13 Easy for me to travel to and from ................................................... 1 14 Easy for other people to travel to and from .................................... 1 15 Live near here ................................................................................. 1 16 Work near here .............................................................................. 1 17 Other WRITE IN …………………………. .................................. 1 18 No particular reason ....................................................................... 1
DO NOT PROMPT. CODE ALL MENTIONED

QX2 Were you aware that there are a number of changes to travel around Tottenham Court Road, with diversions to some bus services and changes to walking and cycling routes? 1 Yes 2 No GO TO QX6 3 Don’t know GO TO QX6
QX3 Do you know the reason for these diversions and travel changes around Tottenham Court Road? DO NOT PROMPT. CODE ALL MENTIONED
1 Building works (unspecified) ............................. 1 2 Utility works (e.g. electricity, gas, water) .......... 1 3 Transport works (unspecified)............................ 1 4 Improving Underground station ......................... 1 5 Building rail / Crossrail station .......................... 1 6 Improving bus facilities / bus routes .................. 1 7 Improving road layout / better roads .................. 1 8 Improving cycle facilities ................................... 1 9 Improving pavements / pedestrian facilities ....... 1 10 New shops / shopping centre development ........ 1 11 Other answer(s) .................................................. 1 12 No / Don’t know ................................................. 1
QX4 Was your journey to the Oxford Street area affected by these diversions and travel changes? 1 Yes 2 No GO TO QX6 3 Don’t know GO TO QX6
QX5 How was your journey affected? PROMPT. CODE ALL MENTIONED 1 Changed usual bus journey ............................................ 1 2 Changed usual tube journey .......................................... 1 3 Changed walking route / walked a different way .......... 1 4 Changed cycling route / cycled a different way ............ 1 5 Changed driving route / drove a different way .............. 1 6 Avoided getting a bus / didn’t use bus........................... 1 7 Avoided getting the tube / didn’t use tube ..................... 1 8 Avoided walking / didn’t walk ...................................... 1 9 Avoided cycling / didn’t cycle ....................................... 1 10 Avoided driving / didn’t drive ....................................... 1 11 Don’t know .................................................................... 1
QX6 Have you used the diagonal crossing at Oxford Circus? 1 Yes 2 No GO TO Q29A 3 Don’t know GO TO Q29A
QX7 How satisfied are you with each of the following aspects of the diagonal crossing at Oxford Circus: SHOWCARD 12. READ OUT
extremely extremely dissatisfied satisfied
The ease of crossing the road? ...................... 0 1 2 3 4 5 6 7 8 9 10 The safety of crossing the road? .................... 0 1 2 3 4 5 6 7 8 9 10
All Q29A Do you go to any of these shopping centres in and around London? SHOWCARD 13. CODE ALL
MENTIONED 1 No ....................................................................... 1 2 Aylesham Shopping Centre ............................... 1 3 Bluewater ........................................................... 1 4 Brent Cross ......................................................... 1 5 Canary Wharf ..................................................... 1 6 Croydon .............................................................. 1 7 Elephant & Castle .............................................. 1 8 Lakeside ............................................................. 1 9 Victoria Place ..................................................... 1 10 Westfield ............................................................ 1 11 Whiteleys ........................................................... 1
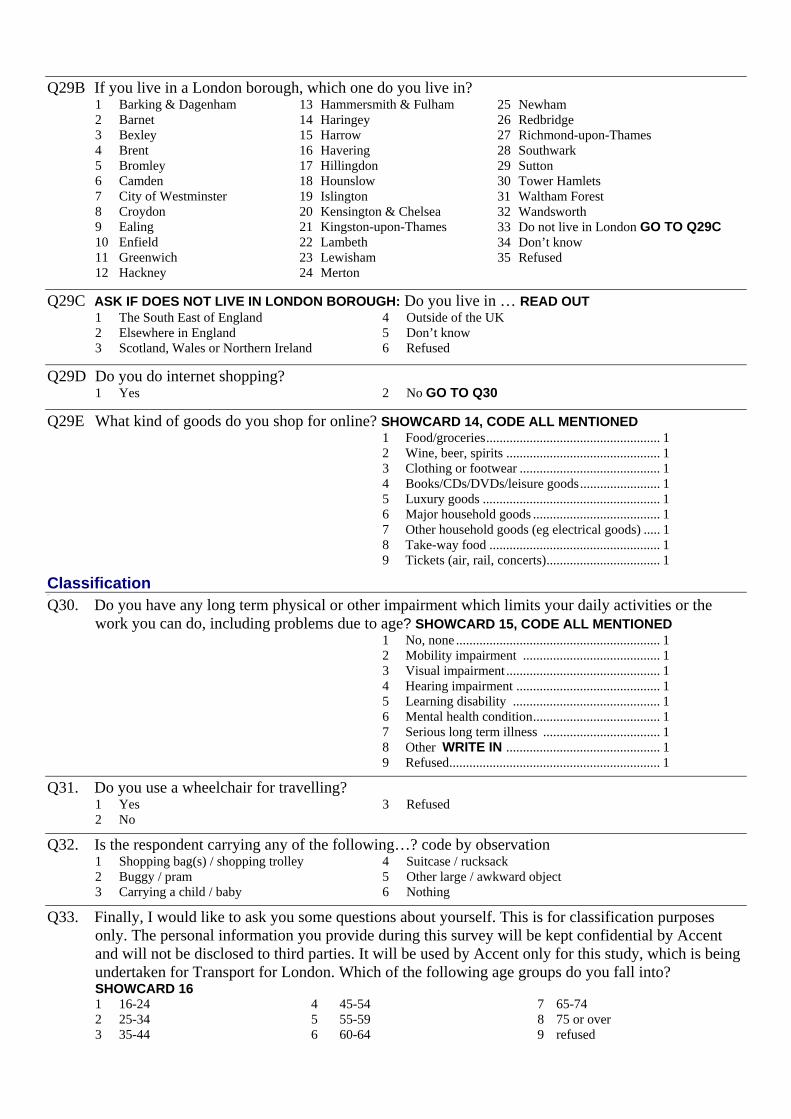
Q29B If you live in a London borough, which one do you live in? 1 Barking & Dagenham 2 Barnet 3 Bexley 4 Brent 5 Bromley 6 Camden 7 City of Westminster 8 Croydon 9 Ealing 10 Enfield 11 Greenwich 12 Hackney
13 Hammersmith & Fulham 14 Haringey 15 Harrow 16 Havering 17 Hillingdon 18 Hounslow 19 Islington 20 Kensington & Chelsea 21 Kingston-upon-Thames 22 Lambeth 23 Lewisham 24 Merton
25 Newham 26 Redbridge 27 Richmond-upon-Thames 28 Southwark 29 Sutton 30 Tower Hamlets 31 Waltham Forest 32 Wandsworth 33 Do not live in London GO TO Q29C 34 Don’t know 35 Refused
Q29C ASK IF DOES NOT LIVE IN LONDON BOROUGH: Do you live in … READ OUT 1 The South East of England 4 Outside of the UK 2 Elsewhere in England 5 Don’t know 3 Scotland, Wales or Northern Ireland 6 Refused
Q29D Do you do internet shopping? 1 Yes 2 No GO TO Q30
Q29E What kind of goods do you shop for online? SHOWCARD 14, CODE ALL MENTIONED 1 Food/groceries .................................................... 1 2 Wine, beer, spirits .............................................. 1 3 Clothing or footwear .......................................... 1 4 Books/CDs/DVDs/leisure goods ........................ 1 5 Luxury goods ..................................................... 1 6 Major household goods ...................................... 1 7 Other household goods (eg electrical goods) ..... 1 8 Take-way food ................................................... 1 9 Tickets (air, rail, concerts) .................................. 1
Classification Q29.
Q30. Do you have any long term physical or other impairment which limits your daily activities or the work you can do, including problems due to age? SHOWCARD 15, CODE ALL MENTIONED
1 No, none ............................................................. 1 2 Mobility impairment ......................................... 1 3 Visual impairment .............................................. 1 4 Hearing impairment ........................................... 1 5 Learning disability ............................................ 1 6 Mental health condition ...................................... 1 7 Serious long term illness ................................... 1 8 Other WRITE IN .............................................. 1 9 Refused ............................................................... 1
Q31. Do you use a wheelchair for travelling? 1 Yes 3 Refused 2 No
Q32. Is the respondent carrying any of the following…? code by observation 1 Shopping bag(s) / shopping trolley 4 Suitcase / rucksack 2 Buggy / pram 5 Other large / awkward object 3 Carrying a child / baby 6 Nothing
Q33. Finally, I would like to ask you some questions about yourself. This is for classification purposes only. The personal information you provide during this survey will be kept confidential by Accent and will not be disclosed to third parties. It will be used by Accent only for this study, which is being undertaken for Transport for London. Which of the following age groups do you fall into? SHOWCARD 16 1 16-24 4 45-54 7 65-74 2 25-34 5 55-59 8 75 or over 3 35-44 6 60-64 9 refused

Q34. RECORD GENDER
1 Male 2 Female
Q35. Which of the following best describes your working status? SHOWCARD 17 1 Working full time (30+ hours a week) 6 Not working and not looking for work 2 Working part time (less than 30 hours a week) 7 Retired 3 A full time student 8 Looking after family and home 4 A part time student 9 Other 5 Not working, but looking for work 10 Refused
Q36. To which of these ethnic groups do you consider you belong? SHOWCARD 18 1 White 4. Mixed 7. Refused 2 Asian or Asian British 5. Chinese or Other Ethnic Group 3 Black or Black British 6. Don’t know
Q37. How many people are there in your household, including yourself? 1 One 4 Four 7 Refused 2 Two 5 Five 3 Three 6 Six or more
Q38. Do you have access to a car or van that you could have used for your journey to this area today? 1 Yes, drove today 3 No – no access to a car or van 2 Yes, but used another mode 4 Refused
Q39. Are you the chief income earner your household? That is the person with the largest income whether from employment pensions, state benefits, investments or any other sources (if equal income is claimed for 2 or more people, refer to the eldest) 1 Yes, respondent is Chief Income Earner 3 Refused 2 No, someone else
Q40. What is your total gross annual household income? This is income from work and any other sources such as benefits and pensions, before deductions e.g. income tax, National Insurance. SHOWCARD 19 1 Under £5,000 5 £20,000 to £24,999 9 £75,000 to £99,999 2 £5,000 to £9,999 6 £25,000 to £34,999 10 £100,000 or over 3 £10,000 to £14,999 7 £35,000 to £49,999 11 Don’t know 4 £15,000 to £19,999 8 £50,000 to £74,999 12 Refused
Q41. Thank you very much for taking part in this survey. If necessary may we recontact you about this study? 1 Yes 2 No
Q42. Transport for London may be carrying out further research about transport in London. Would it be OK for a research company working on their behalf to contact you again in the future for research purposes? 1 Yes 2 No
This research was conducted under the terms of the MRS code of conduct and is completely confidential. If you would like to confirm my credentials or those of Accent Marketing & Research please call the MRS free on 0500 396999. HAND OVER THE THANK YOU SLIP. Please can I take a note of your name and where we can contact you for quality control purposes? Respondent name: ................................................................................................................. Telephone: home: .............................................. work: ............................................... Thank you I confirm that this interview was conducted under the terms of the MRS code of conduct and is completely confidential Interviewer’s signature: .................................................................................................................

APPENDIX B
Key Results by Town Centre

Demographic profile Table 57: Gender by town centre
Bex
leyh
eath
Bro
mle
y
Cam
berw
ell
Cla
pham
Ju
nctio
n
Cro
ydon
Ealin
g
Gre
enw
ich
Hac
kney
Har
lesd
en
Har
row
Kin
gsto
n
Oxf
ord
Stre
et/
Reg
ent S
tree
t
Stra
tford
Woo
d G
reen
Woo
lwic
h
% % % % % % % % % % % % % % %Male 34 38 48 37 38 45 38 44 49 44 33 40 34 45 30 Female 66 62 52 63 62 55 62 56 51 56 67 60 66 55 70 Weighted base 313 364 316 330 297 298 324 318 302 295 319 321 313 331 301
Table 58: Age by town centre
Bex
leyh
eath
Bro
mle
y
Cam
berw
ell
Cla
pham
Ju
nctio
n
Cro
ydon
Ealin
g
Gre
enw
ich
Hac
kney
Har
lesd
en
Har
row
Kin
gsto
n
Oxf
ord
Stre
et/
Reg
ent S
tree
t
Stra
tford
Woo
d G
reen
Woo
lwic
h
% % % % % % % % % % % % % % %16-24 19 16 16 13 18 18 23 12 15 12 23 26 17 13 18 25-34 12 15 32 25 21 21 22 25 21 20 20 25 24 29 19 35-44 15 16 20 22 11 21 13 24 19 18 20 18 20 19 21 45-54 19 19 16 14 19 15 14 18 22 16 17 16 16 16 23 55-59 6 6 7 5 7 9 8 8 9 8 6 6 5 6 9 60-64 8 7 5 6 6 6 6 3 6 10 4 6 7 5 3 65-74 13 14 3 12 12 7 9 5 6 11 8 3 8 8 5 75 or over 8 8 * 4 5 2 5 4 1 5 2 1 3 3 1 Refused 0 0 0 0 * 1 1 1 1 * 0 1 * 1 0 Weighted base 313 364 316 330 297 299 325 318 303 295 319 321 313 331 301
* = less than 0.5% Table 59: Ethnicity by town centre
Bex
leyh
eath
Bro
mle
y
Cam
berw
ell
Cla
pham
Ju
nctio
n
Cro
ydon
Ealin
g
Gre
enw
ich
Hac
kney
Har
lesd
en
Har
row
Kin
gsto
n
Oxf
ord
Stre
et/
Reg
ent S
tree
t
Stra
tford
Woo
d G
reen
Woo
lwic
h
% % % % % % % % % % % % % % %White 94 88 57 82 80 68 79 60 44 66 83 69 61 57 69 Mixed Background 1 2 4 1 5 12 5 4 11 19 5 6 9 7 4 Asian or Asian British 3 7 30 11 11 11 9 25 39 11 8 15 19 23 22 Black or Black British 2 1 5 4 2 6 3 9 5 2 3 4 8 11 4 Chinese or Any Other 1 2 2 1 1 3 1 * 2 1 2 2 1 * Refused * 1 0 1 1 1 1 * * 0 3 1 1 0 Weighted base 313 364 316 330 297 299 325 318 303 295 319 321 313 331 301
* = less than 0.5%

Table 60: Employment Status by town centre
Bex
leyh
eath
Bro
mle
y
Cam
berw
ell
Cla
pham
Ju
nctio
n
Cro
ydon
Ealin
g
Gre
enw
ich
Hac
kney
Har
lesd
en
Har
row
Kin
gsto
n
Oxf
ord
Stre
et/
Reg
ent S
tree
t
Stra
tford
Woo
d G
reen
Woo
lwic
h
% % % % % % % % % % % % % % %Working full time (30+
hours a week) 28 42 46 50 43 48 39 46 46 43 43 55 36 46 42
Working part time (less than 30 hours a week) 17 14 18 15 14 18 13 17 21 16 19 15 19 14 16
A full time student 4 4 8 6 5 10 19 8 9 7 16 15 10 5 6 A part time student 1 1 1 1 1 1 2 * 1 0 0 1 * 2 2 Not working, but looking for
work 9 8 7 4 5 4 2 7 8 7 3 2 5 9 11
Not working and not looking for work 5 1 8 2 4 2 3 4 3 2 2 2 7 6 5
Retired 27 26 8 18 21 12 17 11 10 22 12 6 15 13 7 Looking after family and
home 8 4 4 5 4 3 4 4 1 4 5 1 6 4 9
Other 1 1 0 * 1 1 * 2 * 0 0 0 1 1 * Refused 0 * 0 0 * * * * 1 0 * 3 * * 0 Weighted base 313 364 316 330 297 299 325 318 303 295 318 321 313 330 301
* = less than 0.5% Table 61: Income by town centre
Bex
leyh
eath
Bro
mle
y
Cam
berw
ell
Cla
pham
Ju
nctio
n
Cro
ydon
Ealin
g
Gre
enw
ich
Hac
kney
Har
lesd
en
Har
row
Kin
gsto
n
Oxf
ord
Stre
et/
Reg
ent S
tree
t
Stra
tford
Woo
d G
reen
Woo
lwic
h
% % % % % % % % % % % % % % %Under £5,000 6 3 5 1 2 3 4 5 3 4 2 1 6 2 3 £5,000-£9,999 7 7 6 4 5 3 5 7 3 4 2 3 6 7 8 £10,000-£14,999 8 5 6 4 6 5 7 5 3 5 5 3 7 4 7 £15,000-£19,999 5 3 5 4 5 6 4 4 6 4 5 2 7 6 7 £20,000-£24,999 7 7 9 3 6 7 3 6 8 4 6 4 8 6 8 £25,000-£34,999 7 8 11 6 6 10 8 13 10 10 8 7 8 8 10 £35,000-£49,999 8 10 10 9 13 12 10 10 6 13 11 11 6 12 11 £50,000-£74,999 6 7 5 8 8 10 9 6 6 10 10 12 7 5 6 £75,000-£99,999 2 7 1 4 2 3 3 1 * 2 8 6 2 2 1 £100,000 or over 1 4 1 7 1 4 3 2 1 2 4 7 2 * 1 Don't know 26 19 18 22 28 17 24 16 21 19 24 27 22 18 20 Refused 16 21 22 28 17 19 19 26 33 24 15 15 19 28 17 Weighted base 313 363 316 330 296 290 324 318 303 294 315 313 313 327 301
* = less than 0.5% Table 62: Number of people in household by town centre
Bex
leyh
eath
Bro
mle
y
Cam
berw
ell
Cla
pham
Ju
nctio
n
Cro
ydon
Ealin
g
Gre
enw
ich
Hac
kney
Har
lesd
en
Har
row
Kin
gsto
n
Oxf
ord
Stre
et/
Reg
ent S
tree
t
Stra
tford
Woo
d G
reen
Woo
lwic
h
% % % % % % % % % % % % % % %One 23 19 24 24 23 20 22 25 15 18 13 15 21 20 17 Two 34 35 21 35 30 29 33 22 20 27 28 24 27 28 23 Three 20 19 20 20 19 21 20 27 27 19 22 28 18 20 26 Four 15 16 24 13 19 17 11 15 21 20 22 21 20 18 19 Five 5 8 8 5 4 7 10 6 7 9 9 7 7 9 10 Six or more 3 2 3 3 5 4 4 3 7 6 7 3 5 4 4 Refused * 1 1 * * 1 0 1 3 2 0 3 1 1 1 Weighted base 313 364 316 330 297 299 324 318 303 295 319 321 313 331 301
* = less than 0.5%

Table 63: Access to a car by town centre
Bex
leyh
eath
Bro
mle
y
Cam
berw
ell
Cla
pham
Ju
nctio
n
Cro
ydon
Ealin
g
Gre
enw
ich
Hac
kney
Har
lesd
en
Har
row
Kin
gsto
n
Oxf
ord
Stre
et/
Reg
ent S
tree
t
Stra
tford
Woo
d G
reen
Woo
lwic
h
% % % % % % % % % % % % % % %Yes, drove today 25 32 6 5 12 12 13 7 16 29 28 4 8 8 13 Yes, but used another
mode 26 26 25 34 32 33 32 26 28 31 32 42 22 32 22
No - no access to a car or van 49 42 68 60 56 54 54 65 54 40 39 53 69 59 64
Refused 0 1 1 1 0 1 1 2 2 * 0 2 1 1 * Weighted base 313 364 316 330 298 299 325 318 303 295 319 321 313 331 301
* = less than 0.5% Table 64: Mobility by town centre
Bex
leyh
eath
Bro
mle
y
Cam
berw
ell
Cla
pham
Ju
nctio
n
Cro
ydon
Ealin
g
Gre
enw
ich
Hac
kney
Har
lesd
en
Har
row
Kin
gsto
n
Oxf
ord
Stre
et/
Reg
ent S
tree
t
Stra
tford
Woo
d G
reen
Woo
lwic
h
% % % % % % % % % % % % % % %No, none 83 87 91 89 90 94 91 91 90 87 93 97 83 87 87 Mobility impairment 10 7 4 6 7 3 4 5 4 4 4 2 9 7 6 Visual impairment 0 1 * 1 1 * 0 * 1 2 * 0 * 1 1 Hearing impairment 2 2 0 1 1 * 2 1 * 2 1 1 1 1 2 Learning disability 1 1 1 0 * 0 0 1 1 * 0 * 1 1 1 Mental health condition 2 * 2 1 * 2 1 1 2 2 2 1 2 2 1 Serious long term illness 3 2 4 3 1 0 2 2 4 3 1 0 5 3 1 Other 1 0 * * 1 1 1 * * 1 * * 1 * 1 Refused 0 1 0 0 1 0 0 0 * 0 0 0 0 0 1 Weighted base 313 363 316 330 297 299 325 318 303 295 319 321 313 331 301
* = less than 0.5% Table 65: Whether use wheelchair for travelling by town centre
Bex
leyh
eath
Bro
mle
y
Cam
berw
ell
Cla
pham
Ju
nctio
n
Cro
ydon
Ealin
g
Gre
enw
ich
Hac
kney
Har
lesd
en
Har
row
Kin
gsto
n
Oxf
ord
Stre
et/
Reg
ent S
tree
t
Stra
tford
Woo
d G
reen
Woo
lwic
h
% % % % % % % % % % % % % % %Yes 1 1 * 1 * * 1 1 * * * * 1 1 1 No 99 99 100 99 99 100 99 99 99 100 100 99 99 98 99 Refused * 0 0 0 1 0 0 * 1 0 0 1 0 * * Weighted base 312 364 316 330 297 299 325 317 303 295 319 321 313 330 301
* = less than 0.5%

Table 66: Whether carrying anything by town centre
Bex
leyh
eath
Bro
mle
y
Cam
berw
ell
Cla
pham
Ju
nctio
n
Cro
ydon
Ealin
g
Gre
enw
ich
Hac
kney
Har
lesd
en
Har
row
Kin
gsto
n
Oxf
ord
Stre
et/
Reg
ent S
tree
t
Stra
tford
Woo
d G
reen
Woo
lwic
h
% % % % % % % % % % % % % % %Shopping bag(s)/shopping
trolley 50 50 49 47 45 44 32 43 67 39 46 52 56 56 51
Buggy/pram 6 4 2 4 4 2 7 3 1 1 5 1 3 2 4 Carrying a child/baby * 0 2 0 * 1 0 1 1 * 1 1 * 0 1 Suitcase/rucksack 4 10 16 11 5 13 5 7 6 12 11 14 8 14 7 Other large/awkward object 0 1 1 1 1 1 1 1 1 * 1 1 1 2 1 Nothing 43 37 32 40 46 43 58 46 27 48 41 35 35 33 39 Weighted base 312 361 316 330 297 297 325 318 303 291 319 321 313 331 301
* = less than 0.5% Table 67: Where live
Bex
leyh
eath
Bro
mle
y
Cam
berw
ell
Cla
pham
Ju
nctio
n
Cro
ydon
Ealin
g
Gre
enw
ich
Hac
kney
Har
lesd
en
Har
row
Kin
gsto
n
Oxf
ord
Stre
et/
Reg
ent S
tree
t
Stra
tford
Woo
d G
reen
Woo
lwic
h
% % % % % % % % % % % % % % %Inner London23 3 15 91 88 15 8 26 87 12 2 7 40 75 79 7 Outer London24 87 77 8 8 73 87 64 10 86 93 73 29 20 18 89 The South East of
England 10 6 1 2 10 3 6 2 * 3 15 10 2 2 3
Elsewhere in England 1 * * * 1 * 1 1 1 1 4 9 2 * * Scotland, Wales or
Northern Ireland * 1 * * * * 2 * * * * 1 * * 1
Outside of the UK * 1 * 1 1 1 2 * 1 1 * 11 * 1 * Weighted base 313 364 316 330 298 299 325 318 303 295 319 321 313 331 301
* = less than 0.5%
23 Inner London = Camberwell, Clapham Junction, Greenwich, Hackney, Enfield, Stratford 24 Outer London = Bromley, Bexleyheath, Croydon, Ealing, Harlesden, Harrow, Kingston, Wood Green

Purpose of visit Table 68: Main purpose mentioned for visiting the town centre by town centre
Bex
leyh
eath
Bro
mle
y
Cam
berw
ell
Cla
pham
Ju
nctio
n
Cro
ydon
Ealin
g
Gre
enw
ich
Hac
kney
Har
lesd
en
Har
row
Kin
gsto
n
Oxf
ord
Stre
et/
Reg
ent S
tree
t
Stra
tford
Woo
d G
reen
Woo
lwic
h
% % % % % % % % % % % % % % %Shopping 58 60 40 52 61 52 26 46 61 49 58 57 55 59 65 Using service 11 8 10 6 6 11 9 12 7 11 6 3 10 5 4 Using public amenity 2 3 6 2 1 2 3 3 1 3 1 2 3 2 1 Eating/drinking out 4 6 8 5 3 7 11 6 3 6 4 4 4 5 2 Other social/leisure 2 1 5 1 1 2 10 2 1 4 2 1 1 2 2 Buying petrol 0 0 0 0 0 0 0 0 * 0 0 * 0 * 0 Delivering goods 0 0 0 0 0 0 0 1 1 0 * 0 * 0 * Window shopping 2 1 1 1 1 2 1 3 0 2 1 4 2 1 2 Personal business 6 3 9 4 5 3 2 2 3 5 2 5 4 3 6 General recreation 1 1 2 1 1 1 3 1 1 3 2 1 1 1 1 Live here 2 3 5 11 5 5 13 8 13 4 3 * 8 9 3 Work here 8 8 8 12 8 9 12 12 7 10 12 15 8 7 9 Travelling through the area 0 2 2 3 1 1 1 1 0 * 1 2 1 2 1 Visiting friends and
relatives 2 3 2 1 4 3 4 2 4 2 3 2 3 3 2
Dropping off/picking up friend or relative 1 1 1 1 1 * 0 1 0 0 1 1 * 1 1
Other 0 * * * 2 1 7 1 0 1 3 2 1 * 1 Weighted base 313 364 316 330 298 299 325 318 303 295 319 321 313 331 301
* = less than 0.5% Mode of Access to area today Table 69: Modes used to access each area by town centre
Bex
leyh
eath
Bro
mle
y
Cam
berw
ell
Cla
pham
Ju
nctio
n
Cro
ydon
Ealin
g
Gre
enw
ich
Hac
kney
Har
lesd
en
Har
row
Kin
gsto
n
Oxf
ord
Stre
et/
Reg
ent S
tree
t
Stra
tford
Woo
d G
reen
Woo
lwic
h
% % % % % % % % % % % % % % %Drove a car/van/lorry 23 29 5 4 12 11 12 7 14 27 27 2 7 9 13 Drove a motorbike/
moped/scooter * 1 * 0 0 1 * 1 0 * * 0 0 * 0
Drove a delivery vehicle 0 0 0 0 0 0 0 0 1 0 0 0 0 0 * Given a lift 5 6 1 0 3 2 1 1 1 1 3 1 2 * 2 Bus 52 39 44 35 39 33 26 38 27 33 37 24 39 37 44 Tube 0 0 1 1 * 14 9 1 5 9 1 52 8 12 2 Train 0 10 3 15 19 7 14 10 4 4 9 11 13 3 7 Bicycle 1 * 3 7 3 3 1 5 1 2 2 1 1 2 * Walked 17 15 42 37 16 29 34 37 45 23 20 8 28 35 31 Taxi/minicab 0 0 0 0 1 0 * * 1 0 0 1 2 1 1 Other 1 1 1 * 71 0 2 * * 0 1 * 1 * * Weighted base 313 364 316 330 298 299 325 318 303 295 319 321 313 331 301
* = less than 0.5% 1. 6% = tram
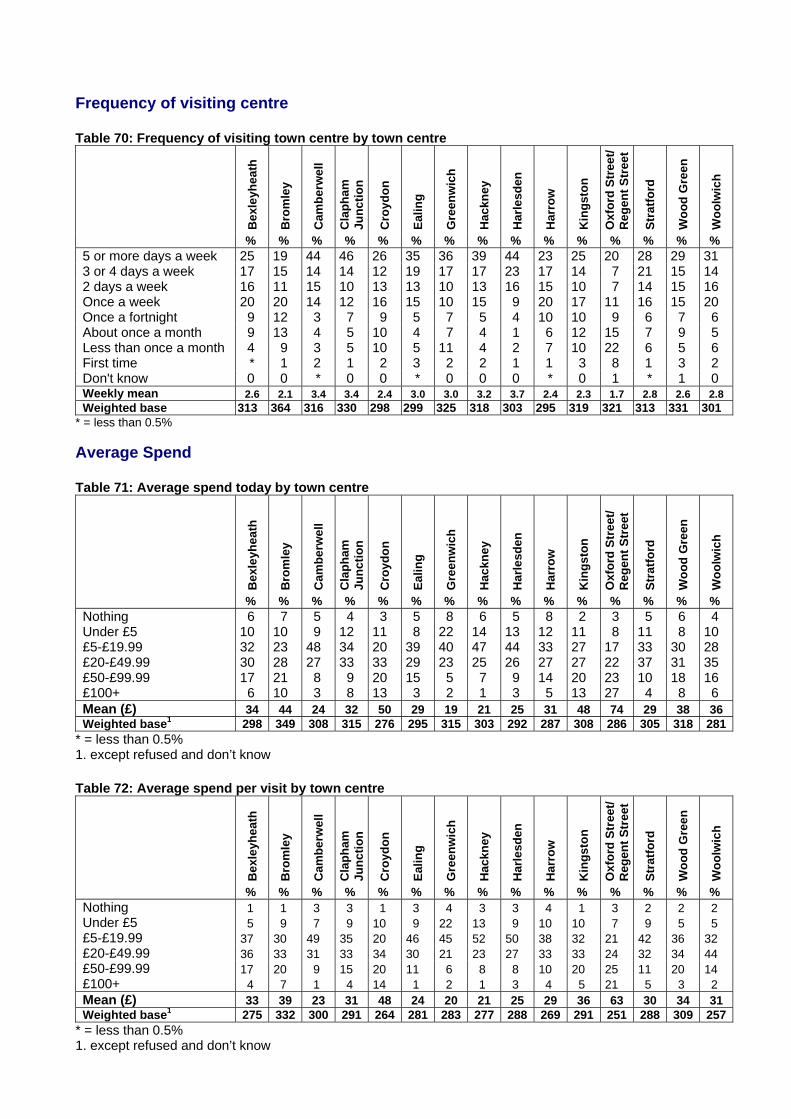
Frequency of visiting centre Table 70: Frequency of visiting town centre by town centre
Bex
leyh
eath
Bro
mle
y
Cam
berw
ell
Cla
pham
Ju
nctio
n
Cro
ydon
Ealin
g
Gre
enw
ich
Hac
kney
Har
lesd
en
Har
row
Kin
gsto
n
Oxf
ord
Stre
et/
Reg
ent S
tree
t
Stra
tford
Woo
d G
reen
Woo
lwic
h
% % % % % % % % % % % % % % %5 or more days a week 25 19 44 46 26 35 36 39 44 23 25 20 28 29 31 3 or 4 days a week 17 15 14 14 12 19 17 17 23 17 14 7 21 15 14 2 days a week 16 11 15 10 13 13 10 13 16 15 10 7 14 15 16 Once a week 20 20 14 12 16 15 10 15 9 20 17 11 16 15 20 Once a fortnight 9 12 3 7 9 5 7 5 4 10 10 9 6 7 6 About once a month 9 13 4 5 10 4 7 4 1 6 12 15 7 9 5 Less than once a month 4 9 3 5 10 5 11 4 2 7 10 22 6 5 6 First time * 1 2 1 2 3 2 2 1 1 3 8 1 3 2 Don't know 0 0 * 0 0 * 0 0 0 * 0 1 * 1 0 Weekly mean 2.6 2.1 3.4 3.4 2.4 3.0 3.0 3.2 3.7 2.4 2.3 1.7 2.8 2.6 2.8 Weighted base 313 364 316 330 298 299 325 318 303 295 319 321 313 331 301
* = less than 0.5% Average Spend Table 71: Average spend today by town centre
Bex
leyh
eath
Bro
mle
y
Cam
berw
ell
Cla
pham
Ju
nctio
n
Cro
ydon
Ealin
g
Gre
enw
ich
Hac
kney
Har
lesd
en
Har
row
Kin
gsto
n
Oxf
ord
Stre
et/
Reg
ent S
tree
t
Stra
tford
Woo
d G
reen
Woo
lwic
h
% % % % % % % % % % % % % % %Nothing 6 7 5 4 3 5 8 6 5 8 2 3 5 6 4 Under £5 10 10 9 12 11 8 22 14 13 12 11 8 11 8 10 £5-£19.99 32 23 48 34 20 39 40 47 44 33 27 17 33 30 28 £20-£49.99 30 28 27 33 33 29 23 25 26 27 27 22 37 31 35 £50-£99.99 17 21 8 9 20 15 5 7 9 14 20 23 10 18 16 £100+ 6 10 3 8 13 3 2 1 3 5 13 27 4 8 6 Mean (£) 34 44 24 32 50 29 19 21 25 31 48 74 29 38 36 Weighted base1 298 349 308 315 276 295 315 303 292 287 308 286 305 318 281
* = less than 0.5% 1. except refused and don’t know Table 72: Average spend per visit by town centre
Bex
leyh
eath
Bro
mle
y
Cam
berw
ell
Cla
pham
Ju
nctio
n
Cro
ydon
Ealin
g
Gre
enw
ich
Hac
kney
Har
lesd
en
Har
row
Kin
gsto
n
Oxf
ord
Stre
et/
Reg
ent S
tree
t
Stra
tford
Woo
d G
reen
Woo
lwic
h
% % % % % % % % % % % % % % %Nothing 1 1 3 3 1 3 4 3 3 4 1 3 2 2 2 Under £5 5 9 7 9 10 9 22 13 9 10 10 7 9 5 5 £5-£19.99 37 30 49 35 20 46 45 52 50 38 32 21 42 36 32 £20-£49.99 36 33 31 33 34 30 21 23 27 33 33 24 32 34 44 £50-£99.99 17 20 9 15 20 11 6 8 8 10 20 25 11 20 14 £100+ 4 7 1 4 14 1 2 1 3 4 5 21 5 3 2 Mean (£) 33 39 23 31 48 24 20 21 25 29 36 63 30 34 31 Weighted base1 275 332 300 291 264 281 283 277 288 269 291 251 288 309 257
* = less than 0.5% 1. except refused and don’t know

Table 73: Average total spend per week by town centre
Bex
leyh
eath
Bro
mle
y
Cam
berw
ell
Cla
pham
Ju
nctio
n
Cro
ydon
Ealin
g
Gre
enw
ich
Hac
kney
Har
lesd
en
Har
row
Kin
gsto
n
Oxf
ord
Stre
et/
Reg
ent S
tree
t
Stra
tford
Woo
d G
reen
Woo
lwic
h
% % % % % % % % % % % % % % %Nothing 1 1 3 3 1 3 4 3 3 4 1 3 2 2 2 Under £5 8 9 7 4 5 7 19 7 3 10 11 14 11 5 7 £5-£19.99 20 27 15 19 26 19 27 27 20 26 28 23 22 18 17 £20-£49.99 25 29 30 24 22 29 25 26 21 28 26 27 22 29 29 £50-£99.99 25 20 25 21 20 26 12 23 33 22 16 16 21 24 26 £100+ 20 14 20 28 26 16 14 15 20 10 19 18 22 22 20 Mean (£) 70 59 79 95 86 65 57 65 87 55 65 78 78 74 71 Weighted base1 275 331 299 293 265 280 283 276 287 268 291 250 287 309 258
* = less than 0.5% 1. except refused and don’t know Table 74: Average total spend per month by town centre
Bex
leyh
eath
Bro
mle
y
Cam
berw
ell
Cla
pham
Ju
nctio
n
Cro
ydon
Ealin
g
Gre
enw
ich
Hac
kney
Har
lesd
en
Har
row
Kin
gsto
n
Oxf
ord
Stre
et/
Reg
ent S
tree
t
Stra
tford
Woo
d G
reen
Woo
lwic
h
% % % % % % % % % % % % % % %Nothing 1 1 3 3 1 3 4 3 3 4 1 3 2 2 2 Under £5 1 2 1 1 1 2 5 2 1 1 2 5 1 1 1 £5-£19.99 7 5 6 3 4 5 13 5 2 7 7 6 10 4 4 £20-£49.99 10 15 5 5 13 6 12 9 7 10 16 14 11 7 8 £50-£99.99 13 19 11 16 17 13 17 18 13 19 18 17 13 14 13 £100+ 68 58 75 71 65 71 49 63 74 59 57 55 63 72 73 Mean (£) 282 238 316 380 346 263 229 260 348 221 260 315 311 297 284Weighted base1 275 331 299 293 265 280 283 276 287 268 291 250 287 309 258
* = less than 0.5% 1. except refused and don’t know

Improvements to town centres Table 75: Main priority for improvements in each area by town centre
Bex
leyh
eath
Bro
mle
y
Cam
berw
ell
Cla
pham
Ju
nctio
n
Cro
ydon
Ealin
g
Gre
enw
ich
Hac
kney
Har
lesd
en
Har
row
Kin
gsto
n
Stre
et/
Reg
ent
Stra
tford
Woo
d G
reen
Woo
lwic
h
% % % % % % % % % % % % % % %More shops 6 3 1 4 2 3 6 7 4 3 4 2 4 3 8 Better range of shops 20 22 15 13 11 21 14 18 15 19 10 2 17 9 22 Improve shops / better
quality shops 4 10 9 5 4 10 6 7 10 8 3 2 6 5 10
Longer shop opening hours 6 12 2 2 8 8 5 3 2 7 13 8 7 7 6 More leisure facilities 6 6 8 4 9 9 3 7 6 7 7 7 7 3 4 More pleasant/greener
environment 5 6 5 10 10 7 4 5 5 8 8 9 11 6 2
Cleaner streets 11 5 8 9 12 8 11 4 11 11 12 6 16 17 14 Reduce pollution 1 2 4 5 2 3 2 5 1 1 3 8 2 4 1 More public spaces 1 2 2 4 3 4 2 3 3 3 4 6 4 3 3 Remove undesirable
element/more policing 13 9 12 4 13 5 6 5 9 12 8 2 9 12 13
Less traffic 5 2 13 12 5 6 15 15 12 * 7 19 5 12 3 High street should be
pedestrianised * 2 1 7 * 2 6 2 2 1 2 7 1 2 1
Improve pedestrian environment 2 * 2 2 1 2 4 3 1 1 1 6 1 4 1
More/easier parking 3 4 5 4 5 5 3 2 8 9 8 2 2 4 4 Better bus service 3 4 7 2 3 2 2 4 4 2 3 1 3 1 5 Improve access to bus stop
locations * * 1 * 1 * * * 2 2 1 1 1 1 *
Improve cycle facilities 1 2 2 6 1 2 2 2 1 1 2 3 1 1 * Other 6 8 3 3 5 3 6 4 4 3 2 5 2 1 2 Don't know 5 1 1 5 3 1 3 4 * * 4 6 2 2 * Weighted base 262 285 306 276 244 263 288 296 282 243 248 254 285 281 284
* = less than 0.5% Shaded boxes indicate top mentions in each town centre

APPENDIX C
Response and Weighting Factors

Response and Weighting Factors Response The total number of interviews was 4,746 (an average of 316 in each area). Weighting factors In order to reflect the distribution of the results by day as achieved in earlier phases of the Town Centres research the data were weighted so that 70% of the results were from weekdays, 20% from Saturdays and 10% from Sundays. The unweighted bases were 69% weekday, 24% Saturday, 7% Sunday. Values used for calculating average spend: • Nothing = 0 • Under £1 = 0.5 • £1-£4.99 = 3 • £5-£9.99 = 7.5 • £10-£14.99 = 12.5 • £15-£19.99 = 17.5 • £20-£29.99 = 25 • £30-£49.99 = 40 • £50-£74.99 = 62.5 • £75-£99.99 = 87.5 • £100-£149.99 = 125 • £150-£199.99 = 175 • £200+ = 225 The average number of days visiting the town centre per month was calculated using the following: • 5 or more days = 22 • 3-4 days = 14 • 2 days = 8 • once a week= 4 • once a fortnight = 2 • once a month = 1 • less than once a month = 0.4 • first time = 0.2

Appendix D
Cycle Booster Key Results

Demographics Table 76: Gender by town centre Location
Total %
Croydon %
Bexley-heath
% Bromley
% Ealing
% Harrow
% Kingston
%
Oxford St/ Regent St
% Male 70 81 73 86 43 70 62 75 Female 30 19 27 14 57 30 38 25 Base 362 48 48 51 49 63 50 53 Table 77: Age by town centre Location
Total %
Croydon %
Bexley-heath
% Bromley
% Ealing
% Harrow
% Kingston
%
Oxford St/ Regent St
% 16-24 25 29 40 31 8 21 30 17 25-34 23 33 19 10 29 24 10 36 35-44 19 21 19 18 20 21 14 21 45-54 17 15 8 18 31 14 18 13 55-59 6 0 8 6 6 5 10 8 60-64 3 0 2 4 6 3 4 4 65-74 4 2 2 12 0 6 4 2 75 or over 3 0 2 2 0 6 8 0 Refused * 0 0 0 0 0 2 0 Base 362 48 48 51 49 63 50 53
Table 78: Ethnicity by town centre Location
Total %
Croydon %
Bexley-heath
% Bromley
% Ealing
% Harrow
% Kingston
%
Oxford St/ Regent St
% White 80 65 79 90 88 68 90 83 Asian or Asian British 7 19 2 6 2 16 2 2 Black or Black British 9 13 17 4 4 11 6 6 Mixed 3 2 2 0 4 5 2 8 Chinese or other ethnic background 1 2 0 0 2 0 0 2 Base 362 48 48 51 49 63 50 53 Table 79: Employment Status by town centre Location
Total %
Croydon %
Bexley-heath
% Bromley
% Ealing
% Harrow
% Kingston
%
Oxford St/ Regent St
% Working full time (30+ hours a week) 47 56 27 29 51 46 46 72 Working part time (less than 30 hours a
week) 19 15 33 20 24 17 14 13
A full time student 11 8 13 18 10 6 14 11 A part time student 2 6 4 0 2 0 0 0 Not working, but looking for work 7 8 8 10 6 11 2 2 Not working and not looking for work 2 4 4 4 0 0 2 0 Retired 9 2 6 16 2 14 18 2 Looking after family and home 2 0 2 2 4 2 4 0 Other 1 0 0 2 0 2 0 0 Refused 1 0 2 0 0 2 0 0 Base 362 48 48 51 49 63 50 53

Table 80: Income by town centre Location
Total %
Croydon %
Bexley-heath
% Bromley
% Ealing
% Harrow
% Kingston
%
Oxford St/ Regent St
% Under £5,000 4 6 4 2 2 5 6 4 £5,000-£9,999 4 4 4 6 4 3 2 2 £10,000-£14,999 6 4 8 14 2 6 6 0 £15,000-£19,999 4 4 6 6 2 5 4 0 £20,000-£24,999 4 6 0 8 2 3 4 4 £25,000-£34,999 11 21 10 4 16 8 16 6 £35,000-£49,999 12 10 13 8 27 10 16 6 £50,000-£74,999 10 6 4 10 16 8 14 11 £75,000-£99,999 3 0 0 2 6 3 0 11 £100,000 or over 4 2 2 4 0 2 6 9 Don't know 17 15 25 20 4 21 16 21 Refused 21 21 23 18 18 27 10 26 Base 362 48 48 51 49 63 50 53 Table 81: Number of people in household by town centre Location
Total %
Croydon %
Bexley-heath
% Bromley
% Ealing
% Harrow
% Kingston
%
Oxford St/ Regent St
% One 19 21 10 14 12 25 24 23 Two 25 21 17 31 29 24 26 25 Three 20 25 31 18 35 8 4 23 Four 21 21 25 22 18 22 24 13 Five 11 8 8 14 6 10 20 11 Six or more 3 4 6 0 0 10 0 2 Refused 2 0 2 2 0 2 2 4 Base 362 48 48 51 49 63 50 53 Table 82: Access to a car by town centre Location
Total %
Croydon %
Bexley-heath
% Bromley
% Ealing
% Harrow
% Kingston
%
Oxford St/ Regent St
% Yes, but used another mode 50 35 48 55 61 43 59 53 No, no access to a car or van 49 65 52 45 39 56 39 45 Refused 1 0 0 0 0 2 2 2 Base 354 48 46 51 49 63 44 53 Table 83: Mobility by town centre Location
Total %
Croydon %
Bexley-heath
% Bromley
% Ealing
% Harrow
% Kingston
%
Oxford St/ Regent St
% No, none 96 96 88 98 98 95 96 100 Mobility impairment 1 0 6 0 0 0 4 0 Visual impairment 1 2 0 0 2 2 0 0 Hearing impairment 1 0 2 0 0 0 2 0 Learning disability 0 0 0 0 0 0 0 0 Mental health condition 1 2 2 0 2 2 0 0 Serious long term illness 1 0 2 2 2 0 2 0 Other * 0 0 0 0 2 0 0 Refused 0 0 0 0 0 0 0 0 Base 362 48 48 51 49 63 50 53

Table 84: Whether carrying anything by town centre Location
Total %
Croydon %
Bexley-heath
% Bromley
% Ealing
% Harrow
% Kingston
%
Oxford St/ Regent St
% Shopping bag(s)/shopping trolley 25 27 27 12 39 25 30 15 Buggy/pram * 0 0 0 0 0 2 0 Carrying a child/baby 0 0 0 0 0 0 0 0 Suitcase/rucksack 40 56 35 61 22 33 28 42 Other large/awkward object 1 0 2 0 0 2 2 0 Nothing 35 21 35 27 39 41 38 43 Base 362 48 48 51 49 63 50 53 Purpose of visit Table 85: Main purpose mentioned for visiting the town centre by town centre Location
Total %
Croydon %
Bexley-heath
% Bromley
% Ealing
% Harrow
% Kingston
%
Oxford St/ Regent St
% Shopping 52 63 44 37 73 51 50 47 Using service 15 10 19 16 8 21 26 2 Using public amenity 4 2 4 14 0 8 0 0 Eating/drinking out 6 10 4 6 6 2 10 2 Other social/leisure 5 4 6 8 4 8 2 4 Delivering goods 1 0 0 0 0 0 0 6 Window shopping * 0 2 0 0 0 0 0 Personal business 3 2 4 8 0 3 2 2 General recreation 1 0 0 2 0 2 2 0 Live here 2 0 2 0 6 0 0 4 Work here 8 6 10 2 0 3 6 28 Travelling through the area 1 0 0 4 0 2 2 0 Visiting friends and relatives 3 2 4 4 2 2 0 6 Base 362 48 48 51 49 63 50 53 Mode of Access to area today Table 86: Modes used to access each area by town centre Location
Total %
Croydon %
Bexley-heath
% Bromley
% Ealing
% Harrow
% Kingston
%
Oxford St/ Regent St
% Bicycle 99 100 100 100 100 100 100 91 Barclays Cycle Hire 1 0 0 0 0 0 0 9 Base 362 48 48 51 49 63 50 53 Frequency of visiting centre Table 87: Frequency of visiting town centre by town centre Location
Total %
Croydon %
Bexley-heath
% Bromley
% Ealing
% Harrow
% Kingston
%
Oxford St/ Regent St
% 5 or more days a week 25 23 27 24 22 25 24 28 3 or 4 days a week 20 17 25 24 12 25 32 6 2 days a week 17 10 25 14 22 14 18 13 Once a week 19 29 17 20 29 11 16 13 Once a fortnight 11 13 4 10 12 11 4 21 About once a month 5 2 0 6 0 8 6 9 Less than once a month 2 2 0 2 0 5 0 4 First time 2 4 2 2 2 0 0 6 Weekly mean 2.7 2.4 3.1 2.7 2.4 2.7 3.0 2.3 Base 362 48 48 51 49 63 50 53

Average Spend Table 88: Average spend today by town centre Location
Total %
Croydon %
Bexley-heath
% Bromley
% Ealing
% Harrow
% Kingston
%
Oxford St/ Regent St
% Nothing 15 10 10 14 8 29 12 19 Under £1 1 2 2 2 0 0 2 0 £1-£4.99 13 10 21 31 4 11 8 6 £5-£9.99 14 10 21 18 12 10 24 6 £10-£14.99 10 15 13 8 12 8 8 11 £15-£19.99 9 8 4 6 14 8 14 9 £20-£29.99 10 10 17 4 16 13 2 9 £30-£49.99 9 10 6 2 18 13 12 4 £50-£74.99 7 4 2 2 8 5 12 13 £75-£99.99 2 2 0 4 2 3 2 0 £100-£149.99 3 13 0 0 0 0 2 9 £150-£199.99 1 0 2 2 2 0 0 2 £200+ 2 0 2 2 2 2 0 8 Don't know 2 4 0 6 0 0 2 4 Mean (£) 28.11 32.51 20.69 19.54 31.53 20.95 22.97 49.71 Std. Deviation 43.87 40.65 40.37 43.06 40.48 33.72 26.83 66.57 Base 354 46 48 48 49 63 49 51
Table 89: Average spend per visit by town centre Location
Total %
Croydon %
Bexley-heath
% Bromley
% Ealing
% Harrow
% Kingston
%
Oxford St/ Regent St
% Nothing 5 8 2 4 2 5 6 6 Under £1 * 0 0 0 0 0 2 0 £1-£4.99 8 2 13 24 4 8 2 4 £5-£9.99 14 4 25 18 8 17 12 13 £10-£14.99 13 25 2 10 18 17 12 6 £15-£19.99 11 6 13 8 20 13 10 6 £20-£29.99 18 27 13 10 20 22 22 11 £30-£49.99 9 13 10 4 12 8 6 13 £50-£74.99 9 8 6 4 12 3 16 11 £75-£99.99 4 2 13 0 2 0 4 6 £100-£149.99 2 2 0 4 0 0 2 8 £150-£199.99 1 2 0 0 0 0 2 0 £200+ 1 0 0 0 0 3 0 0 Don't know 6 0 4 16 0 3 4 17 Mean (£) 28.28 29.64 27.93 18.84 26.02 24.55 32.93 38.98 Std. Deviation 32.38 31.96 28.37 27.91 19.62 39.55 34.29 36.98 Base 339 48 46 43 49 61 48 44
Table 90: Average total spend per week by town centre Location
Total %
Croydon %
Bexley-heath
% Bromley
% Ealing
% Harrow
% Kingston
%
Oxford St/ Regent St
% Nothing 5 8 2 5 2 5 6 7 Under £5 7 4 4 16 4 10 2 11 £5-£19.99 20 17 24 35 22 18 19 9 £20-£49.99 28 33 24 23 29 23 19 48 £50-£99.99 22 19 24 14 24 26 33 14 £100+ 17 19 22 7 18 18 21 11 Mean (£) 69.54 80.67 74.55 34.44 60.42 67.86 92.03 74.38Std. Deviation 115.04 151.08 79.99 47.26 59.34 109.52 151.91 149.08 Base 339 48 46 43 49 61 48 44

Table 91: Average total spend per month by town centre Location
Total %
Croydon %
Bexley-heath
% Bromley
% Ealing
% Harrow
% Kingston
%
Oxford St/ Regent St
% Nothing 5 8 2 5 2 5 6 7 Under £5 2 5 5 2 5 £5-£19.99 4 2 4 12 4 5 5 £20-£49.99 9 8 13 14 6 11 2 5 £50-£99.99 15 13 11 23 20 7 19 16 £100+ 65 69 70 42 67 67 71 64 Mean (£) 278.15 322.75 298.2 137.75 241.69 271.81 368.13 296.98Std. Deviation 460.17 604.29 319.96 189.05 237.35 437.93 607.64 596.62 Base 339 48 46 43 49 61 48 44
Improvements to town centres Table 92: Main priority for improvements in each area by town centre Location
Total %
Croydon %
Bexley-heath
% Bromley
% Ealing
% Harrow
% Kingston
%
Oxford St/ Regent St
% More shops 9 4 15 8 12 5 12 8 Better range of shops 22 27 27 8 47 24 12 9 Improve shops/better quality shops 19 17 25 8 43 14 10 19 Longer shop opening hours 17 23 33 10 8 13 8 25 More leisure facilities 23 25 35 12 24 16 24 28 More pleasant/greener environment 27 44 42 12 20 21 14 36 Cleaner streets 20 31 31 10 10 22 18 21 Reduce pollution 19 10 29 10 10 16 6 51 More public spaces 18 23 23 18 10 8 8 36 Remove undesirable element/more policing 13 10 33 10 6 13 8 11 Less traffic 22 15 23 22 20 10 14 55 High street should be pedestrianised 8 4 4 6 14 5 8 17 Improve pedestrian environment 5 2 0 6 12 8 0 6 More/easier parking 9 4 15 2 16 6 12 6 Better bus service 6 6 8 4 4 10 4 6 Improve access to bus stop locations 3 6 4 0 0 2 2 6 Improve cycle facilities 42 31 44 41 27 57 34 55 Other 2 0 0 4 4 3 4 0 Nothing 10 10 2 22 2 13 14 4 Don’t know 2 2 2 0 2 2 0 4 Base 362 48 48 51 49 63 50 53