tower semiconductor ltd. … · 3 investment thesis we are initiating coverage of tower...
TRANSCRIPT
EQUITY RESEARCH
INITIATION OF COVERAGE
Shawn [email protected]
Rick [email protected]
December 14, 2015
Stock Rating:
OUTPERFORM12-18 mo. Price Target $20.00TSEM - NASDAQ $15.02
3-5 Yr. EPS Gr. Rate NA52-Wk Range $18.29-$10.68Shares Outstanding 86.8MFloat 57.5MMarket Capitalization $1,214.9MAvg. Daily Trading Volume 430,627Dividend/Div Yield NA/NMBook Value $3.38Fiscal Year Ends Dec2015E ROE 81.0 %LT Debt $206.8MPreferred NACommon Equity $325MConvertible Available Yes
EPSGAAP Q1 Q2 Q3 Q4 Year Mult.
2014A 0.81 (0.31) (0.37) 0.01 0.08 NM2015E (1.15)A 0.09A 0.16A 0.26 (0.36) NM2016E 0.27 0.32 0.39 0.41 1.40 10.7x2017E -- -- -- -- 2.00 7.5xEPS Non-GAAP Q1 Q2 Q3 Q4 Year Mult.
2014A 0.41 0.62 0.58 0.83 2.46 6.1x2015E 0.78A 0.58A 0.62A 0.63 2.51 6.0x2016E 0.65 0.69 0.74 0.76 2.84 5.3x2017E -- -- -- -- 3.22 4.7xExcludes depreciation, amortization, stock-basedcompensation and one-time charges
Oppenheimer & Co Inc. 85 Broad Street, New York, NY 10004 Tel: 800-221-5588 Fax: 212-667-8229
For analyst certification and important disclosures, see the Disclosure Appendix.
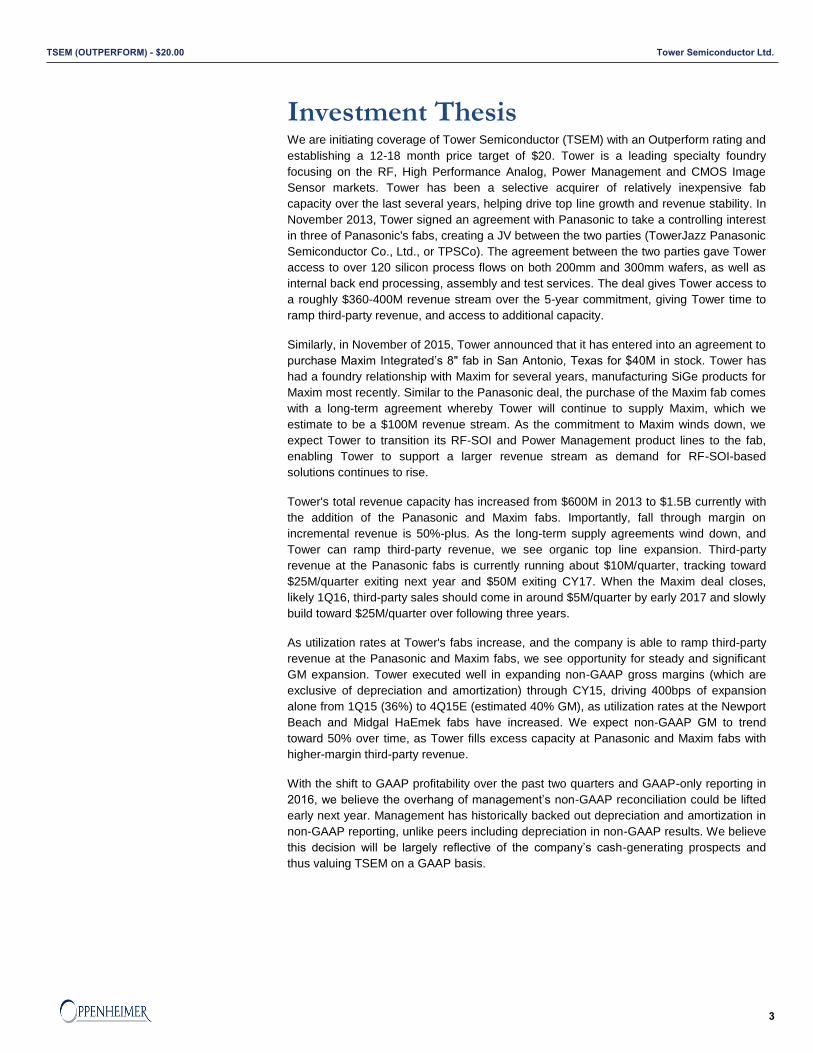
Stock Price Performance Company DescriptionTower Semiconductor Ltd. is anindependent specialty foundry dedicatedto the manufacture of semiconductors.
TECHNOLOGY/SEMICONDUCTORS & COMPONENTS
Tower Semiconductor Ltd.Initiating Specialty Foundry Leader with Outperform &$20 PTSUMMARY
We are initiating coverage of Tower Semiconductor (TSEM) with an Outperform and$20 PT. Tower is a specialty foundry focusing on the RF/HPA, Power Mgmt andImage Sensor markets. TSEM has been an acquirer of inexpensive fab capacity inrecent years, helping drive top-line growth and revenue stability. In November 2013,Tower signed an agreement with Panasonic to take a controlling interest in threeof Panasonic's fabs, creating a JV between the two parties (TPSCo). Additionally,the company recently announced the acquisition of MXIM's TX fab. These twoacquisitions have increased Tower's capacity from ~$600M in CY13 to $1.5B today.With a revenue run-rate of $1B and demand outstripping TSEM's supply, we see thecompany as a unique growth story with improving GMs/FCFs.
KEY POINTS
■ TPSCo increased TSEM's capacity by $650-700M/yr with a steady revenuestream from Panasonic of ~$360-400M. We believe TSEM has largely earmarkedthe remaining ~$300M in capacity with third-party deals. Third-party revenuestarted ramping in CY15 to $10M in 3Q. We estimate third-party revenues toincrease to $25M/qtr exiting CY16 and ~$50M/qtr exiting CY17.
■ The acquisition of MXIM's 8" San Antonio fab (closes early 1Q) should help TSEMalleviate capacity constraints longer term. MXIM adds ~$100M in annual revenues(~10-12% GM, <$1M opex) with an additional $100M in free capacity. We estimatethis deal adds ~$0.10/$0.30 to our CY16/17 GAAP EPS. Third-party revenues areexpected to ramp in late CY16 at 50%+ contribution margin.
■ With TSEM likely shifting to GAAP EPS reporting in 2016, we believe theoverhang of mgmt's non-GAAP reconciliation could be lifted early next year. Mgmthas historically backed out D&A in non-GAAP reporting, unlike peers includingdepreciation in non-GAAP results. We believe that, going forward, GAAP resultsshould be largely reflective of TSEM's cash-generating abilities.
■ TSEM executed well in expanding non-GAAP gross margins through CY15,driving 400bps of expansion from 1Q15's 36% to 4Q15E 40%, as utilization ratesincreased at Fab 2/3. We expect non-GAAP GM to trend toward 50% over time,as TSEM fills excess capacity at TPSCo/MXIM fabs with higher-margin third-partyrevenue. We are introducing CY15/16/17 GAAP EPS of ($0.36)/$1.40/$2.00.
■ TSEM shares are up 13% YTD (vs. SOX -4%) and trade at 7.5x our CY17E GAAPEPS, a significant discount to peers' 11x. We look for gradual multiple expansionas margins increase and GAAP reporting removes an overhang currently in theshares today. We are buyers of this unique growth and GM expansion story witha $20 PT.

2
5-YEAR PRICE PERFORMANCE
30
25
20
15
10
5
020152014201320122011
TSEM
Source: Bloomberg
INVESTMENT THESIS
Tower has been a selective acquirer of inexpensive fab capacity over thelast several years, helping drive top-line growth and revenue stability. InNovember 2013, Tower signed an agreement with Panasonic to take acontrolling interest in three of Panasonic's fabs. Additionally, the companyrecently announced the acquisition of MXIM's 8" San Antonio fab. Thesetwo acquisitions have increased Tower's total capacity from ~$600Min CY13 to $1.5B today. With a revenue run-rate of $1B and demandoutstripping TSEM's current supply, we see the company as a uniquegrowth story in semiconductors with improving GMs/FCFs.
BASE CASE ASSUMPTION■ Gradual GM expansion through 2017 as third-party revenue ramps
at both TPSCo and MXIM■ Switch to GAAP only reporting in early 2016■ Gradually filling excess capacity purchased in recent years through
2017■ Maintain high utilization levels in Fab 2 and Fab 3
CATALYSTS■ Closing MXIM fab acquisition in January 2016 and ramping third-
party revenue by exiting that year■ Switching to GAAP only reporting in early 2016■ Continued GM expansion as third-party revenue ramps at 50%-plus
contribution margin
UPSIDE SCENARIO■ Third-party revenue ramping at TPSCo and MXIM faster than initial
expectations■ GMs expanding toward mgmt's 50% non-GAAP target faster than
expected as third-party revenue ramps■ Continued share gains from GlobalFoundries in RF-SOI
DOWNSIDE SCENARIO■ Share loss in core markets, particularly RF SOI■ Inability to fill unused capacity at both TPSCo and MXIM over the
next several years■ GMs contracting due to lower ASPs and/or lower utilization■ Significant decrease in demand for consumer electronic devices,
particularly smartphones
PRICE TARGET CALCULATION
We are establishing a 12-18 month price target of $20. Our $20 price target is based on 10x our CY17 estimate of $2.00, a slight discountto peers' 11x. TSEM shares are currently trading at just 7.5x CY17, a significant discount to peers' 11x. We believe the shares trade ata discount due to TSEM's lower margin profile and confusing non-GAAP reconciliation. With the switch to GAAP-based reporting in early2016 and margin expectations increasing in 2016-17, we look for the shares to see gradual multiple expansion toward the group average.
KEY RISKS
Risks to our thesis include, but are not limited to: 1) Any significant decrease in the demand for smartphones, consumer electronics, PCsor other electronic devices may decrease the demand for Tower's services and products. 2) If ASPs of smartphones or tablets come underpressure, Tower may be pressured to reduce their own ASPs, which could impact the company’s revenues and margins significantly. 3)A slowdown in demand for consumer electronics could lead to elevated inventory levels at customers, which could result in Tower havingto lower utilization rates, which could impact margins. 4) Risk of dilution from convertible bonds could impact EPS. 5) Specialty foundriestypically operate one generation behind new technologies. If there is a technology breakthrough making newer generation tech cheaperand more economical, later generation fabricators could lose capacity and customers.
Shawn Simmons: 212-667-8387
Tower Semiconductor Ltd. TSEM (OUTPERFORM) - $20.00
3
Investment Thesis We are initiating coverage of Tower Semiconductor (TSEM) with an Outperform rating and
establishing a 12-18 month price target of $20. Tower is a leading specialty foundry
focusing on the RF, High Performance Analog, Power Management and CMOS Image
Sensor markets. Tower has been a selective acquirer of relatively inexpensive fab
capacity over the last several years, helping drive top line growth and revenue stability. In
November 2013, Tower signed an agreement with Panasonic to take a controlling interest
in three of Panasonic's fabs, creating a JV between the two parties (TowerJazz Panasonic
Semiconductor Co., Ltd., or TPSCo). The agreement between the two parties gave Tower
access to over 120 silicon process flows on both 200mm and 300mm wafers, as well as
internal back end processing, assembly and test services. The deal gives Tower access to
a roughly $360-400M revenue stream over the 5-year commitment, giving Tower time to
ramp third-party revenue, and access to additional capacity.
Similarly, in November of 2015, Tower announced that it has entered into an agreement to
purchase Maxim Integrated’s 8" fab in San Antonio, Texas for $40M in stock. Tower has
had a foundry relationship with Maxim for several years, manufacturing SiGe products for
Maxim most recently. Similar to the Panasonic deal, the purchase of the Maxim fab comes
with a long-term agreement whereby Tower will continue to supply Maxim, which we
estimate to be a $100M revenue stream. As the commitment to Maxim winds down, we
expect Tower to transition its RF-SOI and Power Management product lines to the fab,
enabling Tower to support a larger revenue stream as demand for RF-SOI-based
solutions continues to rise.
Tower's total revenue capacity has increased from $600M in 2013 to $1.5B currently with
the addition of the Panasonic and Maxim fabs. Importantly, fall through margin on
incremental revenue is 50%-plus. As the long-term supply agreements wind down, and
Tower can ramp third-party revenue, we see organic top line expansion. Third-party
revenue at the Panasonic fabs is currently running about $10M/quarter, tracking toward
$25M/quarter exiting next year and $50M exiting CY17. When the Maxim deal closes,
likely 1Q16, third-party sales should come in around $5M/quarter by early 2017 and slowly
build toward $25M/quarter over following three years.
As utilization rates at Tower's fabs increase, and the company is able to ramp third-party
revenue at the Panasonic and Maxim fabs, we see opportunity for steady and significant
GM expansion. Tower executed well in expanding non-GAAP gross margins (which are
exclusive of depreciation and amortization) through CY15, driving 400bps of expansion
alone from 1Q15 (36%) to 4Q15E (estimated 40% GM), as utilization rates at the Newport
Beach and Midgal HaEmek fabs have increased. We expect non-GAAP GM to trend
toward 50% over time, as Tower fills excess capacity at Panasonic and Maxim fabs with
higher-margin third-party revenue.
With the shift to GAAP profitability over the past two quarters and GAAP-only reporting in
2016, we believe the overhang of management’s non-GAAP reconciliation could be lifted
early next year. Management has historically backed out depreciation and amortization in
non-GAAP reporting, unlike peers including depreciation in non-GAAP results. We believe
this decision will be largely reflective of the company’s cash-generating prospects and
thus valuing TSEM on a GAAP basis.
Tower Semiconductor Ltd.TSEM (OUTPERFORM) - $20.00
4
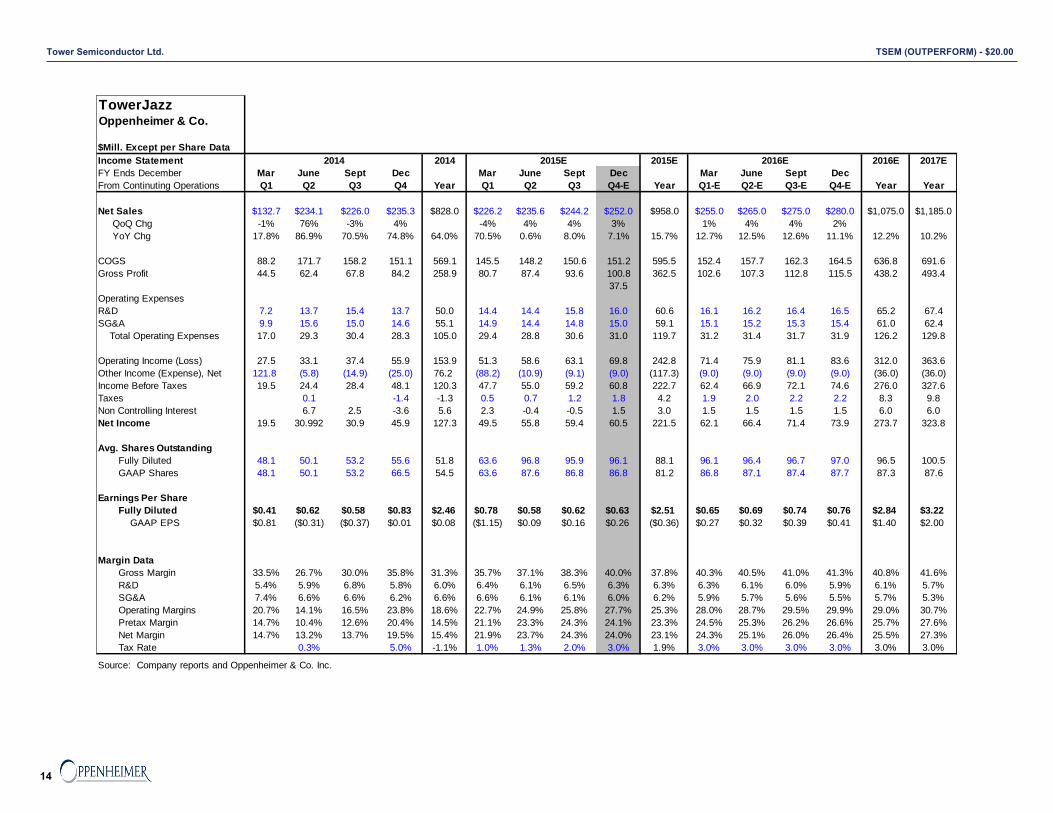
Estimates & Valuation We are introducing CY15/16/17 revenue estimates of $958M/$1.08B/$1.19B, respectively.
Our non-GAAP CY15/16/17 EPS estimates are $2.51/$2.84/$3.22, respectively. The
consensus CY16 EPS estimate is $2.99. Our CY15/16/17 GAAP EPS estimates are
($0.36), $1.40 and $2.00, respectively. We are modeling GMs to increase from an
expected 37.8% in CY15 to 41.6% in CY17 primarily on higher margin third-party revenue.
We are modeling operating margins to increase from 25.3% in CY15 to 30.7% in CY17.
We expect management to tightly control opex spend, compounding top-line and GM
gains.
Year-to-date, TSEM shares are up 13% vs. the SOX’s down 4%, and trade at just 7.5x our
CY17 GAAP EPS estimate, a significant discount to peers’ 11x. We believe the shares
trade at a discount due to TSEM's lower margin profile and confusing non-GAAP
reconciliation. With the switch to GAAP-based reporting in early 2016 and margins
expectations increasing in 2016-17, we look for the shares to see gradual multiple
expansion toward the group average.
Company Background TowerJazz Semiconductor Ltd. was founded in 1993 with the purchase of National
Semiconductor’s 150 mm wafer fabrication facility in Israel. Originally slated to produce
5,000 wafers per month, the facility, after significant modernization, is capable of 20,000
wafers per month with geometries ranging from 1.0 micron to 0.35 micron with capabilities
for CMOS image sensors, embedded flash and mixed-signal technologies. In 2003,
TowerJazz expanded to build a second Fab with 40,000 wafers per month capability and
geometries of 0.18-micron to 0.13 micron. In 2008, TowerJazz merged with Jazz
technologies. This brought along a third Fab, a second location (California), and new tech-
advanced analog, radio frequency, high voltage, bipolar and silicon germanium bipolar
complementary metal oxide semiconductor processes. The facility has a 24,000 wafers
per month capacity and geometries of 0.50-micron to 0.13-micron.
In 2011, TowerJazz entered into an agreement to purchase a Micron Technology facility
located in Japan. This nearly doubled TSEM’s capacity at the time by adding 60,000
wafers per month. With it came access to the Japanese market and three-year supply
agreement with Micron Technology. The facility supported geometries down to 95nm and
can be used for power management and high-end RF chips.
In June 2011, Tower acquired a fabrication facility in Nishiwaki City, Hyogo, Japan from
Micron, which they refer to as Fab 4. The assets and related business that were acquired
from Micron are held and conducted through a wholly owned Japanese subsidiary,
TowerJazz Japan Ltd. In 2014, the operations of Fab 4 ceased in the course of the
restructuring of activities and business in Japan as Micron shifted production elsewhere.
Tower Semiconductor is a pure play specialty foundry company. Most pure play foundries,
including Tower, do not offer their own products; rather, they focus on producing
integrated circuits based on the specifications of their customers. Tower primarily uses
third-party designs in their manufacturing processes. Tower has the capability to produce
geometries of 0.35, 0.50, 0.55, 0.60, 0.80-micron and above on 150-mm wafers and 0.35,
0.18, 0.16, 0.13, and 0.11-micron on 200nm wafers and 45nm and 65nm on 300-mm
wafers. They also offer design support and complementary technical services. The
products that are manufactured by Tower are incorporated into a wide range of products
in a diverse set of markets including consumer electronics, personal computers,
communications, automotive, industrial and medical device products.
Tower Semiconductor Ltd. TSEM (OUTPERFORM) - $20.00

5
Tower currently owns three fabrication facilities (Fab 1, Fab 2, and Fab 3) located around
the world and utilizes the capacity of three additional fabs in Japan. Their historical focus
has been standard digital complementary metal oxide semiconductor (“CMOS”) process
technology, which is the most widely used method of producing ICs. They are currently
focused on the emerging opportunities in specialized technologies including CMOS image
sensors, mixed-signal, radio frequency CMOS (RFCMOS), bipolar CMOS (BiCMOS), and
silicon-germanium BiCMOS (SiGe BiCMOS or SiGe), high voltage CMOS, radio frequency
identification (RFID) technologies and power management.
Most recently in March 2014, Tower acquired from Panasonic 51% of a newly established
company, TowerJazz Panasonic Semiconductor Co., Ltd., (“TPSCo”). This entity
manufactures products for Panasonic and potentially other third parties, using Panasonic's
three semiconductor manufacturing facilities located in Hokuriku Japan (Uozu E, Tonami
CD and Arai E). Pursuant to the transaction, Panasonic transferred its semiconductor
wafer manufacturing process and capacity tools (8-inch and 12-inch) at said three fabs to
TPSCo, and entered into a five-year manufacturing agreement for the manufacture of
products for Panasonic by TPSCo. This transaction provides Tower newfound capacity on
the 200nm and 300nm wafer level as well as internal back end processing, assembly and
test services.
Products & Segments TowerJazz (Tower) offers specialty process technologies including radio frequency (RF),
high-performance analog (HPA), integrated power management, CMOS image sensors,
mixed-signal/CMOS and micro-electromechanical systems (MEMS). Additionally, Tower
provides transfer optimization and development process services (TOPS) to IDMs and
fabless companies that need to expand capacity. Given the specialized nature of Tower's
product suite, the company tends to focus on lower-volume, higher-margin and highly-
differentiated applications, with high barriers to entry.
Radio Frequency & High-Performance Analog. Approximately 45% of sales, ex-
Panasonic (~30% RF-CMOS & ~15% SiGe). Tower offers a suite of Silicon Germanium
(SiGe) BiCMOS, RF-SOI and RF-CMOS solutions which enable high-speed/low-power
products across the consumer, infrastructure and automotive applications. RF/HPA seems
on track to grow 45% Y/Y in 2015 vs. 2014, and based on current customer forecasts,
Tower expects to see similar growth rates in 2016 driven by both RF-SOI and SiGe
based-solutions.
RF-Silicon-on-Insulator (RF-SOI) and RF-CMOS platforms. Tower's RF-SOI-based
switching and tuner solutions are primarily used in the smartphone market today. The
high-performance nature of these parts results in lower losses in smartphone switching,
lower power consumption, and improved reception. Smartphone OEMs are increasingly
focused on more advanced/complex RF front-ends to achieve higher-levels of data
throughput and global roaming capabilities. This complexity is driving higher levels of RF
content, thus tower has seen rapid growth in this segment of the last several years.
Silicon-Germanium (SiGe). Tower's SiGe solutions have traditionally been used in high-
speed data networks as they are ideally suited for handling high data traffic. More recently
however, Tower has seen SiGe expanding into power amplifiers and low-noise amplifiers
for smartphones. In 3Q15, Tower began production of a new line of power amplifiers for
mobile devices and began ramping their new low-noise amplifiers into the smartphone
market. While it is still early on, we believe the migration into these new, high-value
markets, should provide sustainable growth opportunities for Tower's SiGe products into
and beyond 2016.
Tower Semiconductor Ltd.TSEM (OUTPERFORM) - $20.00

6
Exhibit 1: RF / High-Performance Analog Applications and Technology
Power Management. Approximately 10% of sales, ex-Panasonic. Tower's power
management business offers solutions across a wide range of voltages based on their
bipolar-CMOS-DMOS (BCD) process technology. Tower's power management solutions
range from 1.8V to 700V and are used across a broad range of applications including
driver ICs, battery and portable power management, PC power control, Class-D audio
amplifiers as well as other consumer, communications, computing, automotive and
industrial applications. The advantage of Tower’s offerings compared to traditional analog
CMOS is Tower’s processes allow for higher levels of integration at higher voltage ranges.
Tower’s power platforms are designed for maximum flexibility, enabling customers to
create cost-effective products at varying levels of integration. Further, Tower’s solutions
are differentiated given the available integration of non-volatile memory (NVM) and digital
libraries, yielding cost-effective, enhanced power management solutions, with relatively
fast time to market.
Exhibit 2: Power Management Platforms and Applications
CMOS Image Sensors (CIS). Approximately 15% of sales, ex-Panasonic. Tower offers
advanced CMOS image sensor technology for use in the automotive, industrial, medical, consumer, and high-end photography markets. Tower estimates the silicon portion of the CMOS image sensor market to be a ~$10B TAM, with ~$3B potentially being served via foundry offerings. Today, roughly two-thirds of this market serves the cellular/smartphone camera market; however, the migration to image-based communication across the automotive, industrial, security and IoT markets is expanding the applications for Tower's
RF / HPA Applications and Technology
Power Amplifiers
Antenna SwitchRF SOI & SiGe Low Noise Amplifiers
Optical Fiber Networks
TIA, LA, Laser Drivers, CDRsHigh-Performance SiGe Photodetectors, Photonics
5G Wireless
Automotive RadarHigh-Performance SiGe 60GHz WiFi and Backhaul
DSL Line Drivers
HDD PreAmp for the CloudComplementary BiCMOS OpAmps, DAC, ADC
Source: Company Reports, Oppenheimer & Co.
Wireless Front-Ends
Wireline Front-Ends
mmWave
High-Performance Analog
Power Management Platforms and Applications
PMICs, DC/DC, Audio
Display/Motor Drivers1.8V / 5V - 60V POE
Automotive
Industrial80V - 200V Medical
AC/DC, IGBT
LED Lighting200V - 700V MOSFET Drivers
Source: Company Reports, Oppenheimer & Co.
High Voltage
Low Voltage
Medium Voltage
Tower Semiconductor Ltd. TSEM (OUTPERFORM) - $20.00
7
CIS offerings. Tower is tracking toward 35% Y/Y growth in this segment in 2015, outpacing the industry's 9% compounded growth rate, as the company has gained traction in areas previously not served by specialty foundries. Tower has IP related to highly customized pixels, which lend the technology to a wide variety of applications. We see opportunities in automotive, security/surveillance, medical imaging, and 3D gesture control driving sustainable growth in this segment long term. Transfer Optimization and Development Process Services (TOPS). Approximately 15-20% of sales, ex-Panasonic. Tower's TOPS business targets integrated device manufacturers (IDMs) that employ "fab-lite" strategies, or have capacity shortages (those looking for second sources) within internal fabs, or opt to close internal fabs to control costs. Tower's TOPS business also works with fabless semiconductor companies that have process IP and are looking for a manufacturing site, or process development at an R&D site. Tower's established transfer methodologies and manufacturing experience enables customers to get products to market faster, at lower risk and with the added benefit of flexible capacity.
End Markets Understanding and quantifying the scope and scale of TowerJazz’s end markets is a
challenging and imperfect exercise given the wide range of applications and expanding
TAM of many of today’s end markets. With that being said, below we attempt to size up
the various end markets by looking at the broader applications and how Tower’s
specialized foundry solutions fit into the overall mix.
RF & HPA Market Analysis: Given the highly specialized nature of Tower's products, we
have chosen to look at the Application Specific Standard Products (ASSPs) market.
ASSPs include radio frequency (RF) ICs in cellular phones, physical layer interface
devices for networking applications, read channels in hard disk drives, demodulators in
consumer electronics, battery management ICs in notebook computers, and engine and
power train control devices in automobiles. We forecast the ASSP market to grow at a 4%
CAGR, rising from $26.2B in 2014 to $32.1B in 2019. While the trend toward integration in
the digital logic segment continues to weigh on application-specific analog, particularly in
the Consumer and Computing segments, we view Tower's highly specialized product suite
as defensible, and believe Tower should be able to outgrow the overall market. RF
provider Qorvo estimates the total RF TAM will grow to $15B-plus by 2018, the majority of
which is power amplifiers, switching solutions and filters. Further, Tower sizes the RF-SOI
switching TAM at approximately $500-600M annually, and growing at a 15% CAGR.
Tower Semiconductor Ltd.TSEM (OUTPERFORM) - $20.00

8
Exhibit 3: ASSP Market Forecast 2009 – 2019E
Source: Gartner, WSTS, SIA, Oppenheimer & Co. Estimates
CIS End Market Analysis: CMOS image sensors fall into the broad category of
optoelectronics, and represent approximately 35% of total optoelectronic sales. This
category has experienced strong growth in the past driven primarily by the proliferation of
the smartphone. We expect the optoelectronics segment to grow at a 5% CAGR from
2014 to 2019, from $29.7B to $38.4B. We expect image sensor growth to outpace the
overall optoelectronics segment, and forecast growth at a 6% CAGR from 2014 to 2019 to
approximately $13.3B, from $10.4B in 2014.
Exhibit 4: Optoelectronics & Image Sensor Forecast 2009-19E
Source: Gartner, WSTS, SIA, Oppenheimer & Co. Estimates
$0
$5,000
$10,000
$15,000
$20,000
$25,000
$30,000
$35,000
$40,000
2009 2010 2011 2012 2013 2014 2015 2016 2017 2018 2019
Reve
nue ($
M)
Industrial
AutomotiveCommunications
Computer & StorageConsumer
$0
$5,000
$10,000
$15,000
$20,000
$25,000
$30,000
$35,000
$40,000
$45,000
2009 2010 2011 2012 2013 2014 2015 2016 2017 2018 2019
Re
venue
($
M)
All Other Optoelectronics
Image Sensors
Tower Semiconductor Ltd. TSEM (OUTPERFORM) - $20.00
9
Power Management Market Analysis: The power management segment is a stable
business and we expect a 7% CAGR from 2014 to 2019 from $34.5B to $45.2B. Tower
represents a small piece of this segment which is dominated by general purpose
components whereas Tower’s niche is the specialized segments. Still we think 5% growth
rate is reasonable for Tower’s end market as higher levels of semiconductors are
designed into automotive and industrial applications, and battery life becomes a critical
factor for consumer devices.
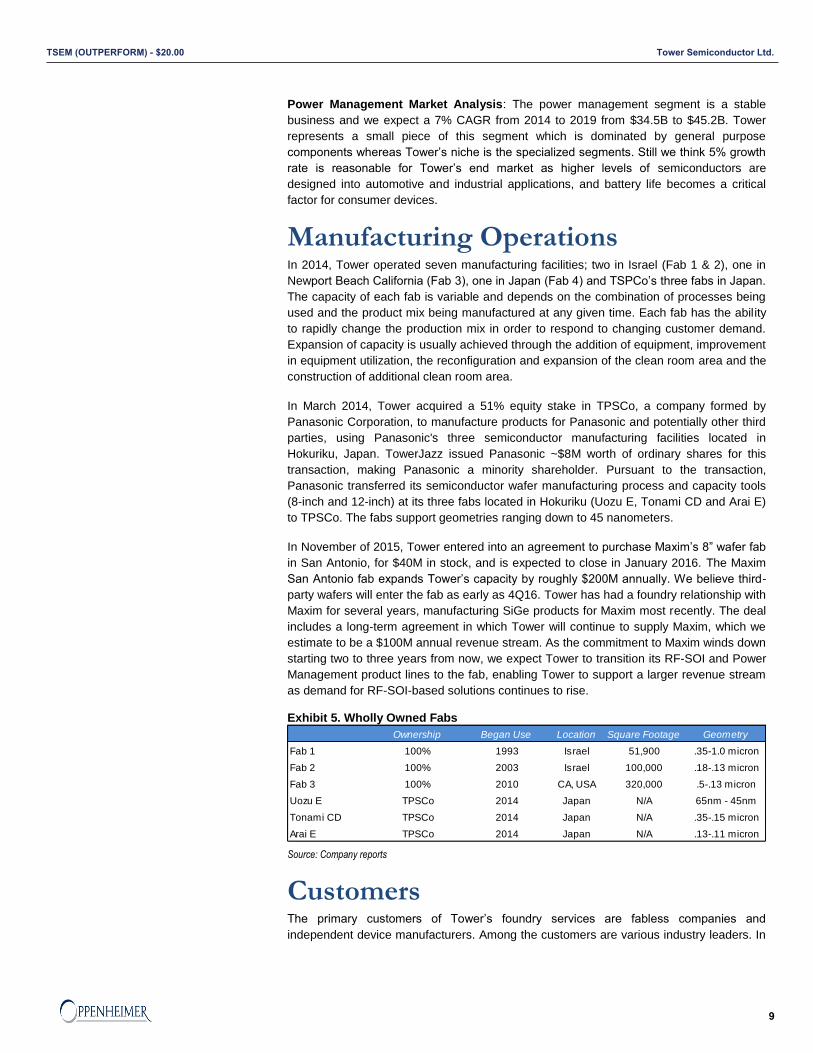
Manufacturing Operations In 2014, Tower operated seven manufacturing facilities; two in Israel (Fab 1 & 2), one in
Newport Beach California (Fab 3), one in Japan (Fab 4) and TSPCo’s three fabs in Japan.
The capacity of each fab is variable and depends on the combination of processes being
used and the product mix being manufactured at any given time. Each fab has the ability
to rapidly change the production mix in order to respond to changing customer demand.
Expansion of capacity is usually achieved through the addition of equipment, improvement
in equipment utilization, the reconfiguration and expansion of the clean room area and the
construction of additional clean room area.
In March 2014, Tower acquired a 51% equity stake in TPSCo, a company formed by
Panasonic Corporation, to manufacture products for Panasonic and potentially other third
parties, using Panasonic's three semiconductor manufacturing facilities located in
Hokuriku, Japan. TowerJazz issued Panasonic ~$8M worth of ordinary shares for this
transaction, making Panasonic a minority shareholder. Pursuant to the transaction,
Panasonic transferred its semiconductor wafer manufacturing process and capacity tools
(8-inch and 12-inch) at its three fabs located in Hokuriku (Uozu E, Tonami CD and Arai E)
to TPSCo. The fabs support geometries ranging down to 45 nanometers.
In November of 2015, Tower entered into an agreement to purchase Maxim’s 8” wafer fab
in San Antonio, for $40M in stock, and is expected to close in January 2016. The Maxim
San Antonio fab expands Tower’s capacity by roughly $200M annually. We believe third-
party wafers will enter the fab as early as 4Q16. Tower has had a foundry relationship with
Maxim for several years, manufacturing SiGe products for Maxim most recently. The deal
includes a long-term agreement in which Tower will continue to supply Maxim, which we
estimate to be a $100M annual revenue stream. As the commitment to Maxim winds down
starting two to three years from now, we expect Tower to transition its RF-SOI and Power
Management product lines to the fab, enabling Tower to support a larger revenue stream
as demand for RF-SOI-based solutions continues to rise.
Exhibit 5. Wholly Owned Fabs
Source: Company reports
Customers The primary customers of Tower’s foundry services are fabless companies and
independent device manufacturers. Among the customers are various industry leaders. In
Ownership Began Use Location Square Footage Geometry
Fab 1 100% 1993 Israel 51,900 .35-1.0 micron
Fab 2 100% 2003 Israel 100,000 .18-.13 micron
Fab 3 100% 2010 CA, USA 320,000 .5-.13 micron
Uozu E TPSCo 2014 Japan N/A 65nm - 45nm
Tonami CD TPSCo 2014 Japan N/A .35-.15 micron
Arai E TPSCo 2014 Japan N/A .13-.11 micron
Tower Semiconductor Ltd.TSEM (OUTPERFORM) - $20.00
10
2014, Tower had four customers that each accounted for somewhere between 7% and
38% of total revenue. That number is up from 2013, when there were only three significant
customers and they fell between 7% and 27% of overall revenue. Tower’s major
customers are Panasonic, Skyworks, Qorvo, Himax, Semtech, Fairchild, Intel and Avago.
Tower’s deal with Panasonic contributes roughly $90-105M of revenue per quarter
dependent on the Yen exchange rate. Panasonic revenues are closer to $90M as of the
latest quarter. Additionally, we estimate Tower’s deal with Maxim’s is slated to increase
revenues by $25M per quarter moving forward.
In terms of geographical distribution, revenue from customers based outside of the United
States accounted for 55% of total revenue. This is a significant jump from the 23% of
revenue generated outside of the United States in 2013. Japan was the second largest
international market in 2014, accounting for 40% of revenue. Asia, excluding Japan and
Europe, accounted for 11% and 4% of 2014 revenue respectively.
Competition Tower competes in a highly competitive semiconductor foundry industry. Major pure play
foundry competitors are Taiwan Semiconductor Manufacturing Corporation, United
Microelectronics Corporation, Global Foundries Inc. and Semiconductor Manufacturing
International Corp. Tower, along with its major competitors, primarily focuses on the 12”
deep-submicron CMOS processing. The rest of the foundry industry generally targets
either industry standard 8” CMOS processing or specialty process technologies. In the
specialty segment, the most direct competitors are Vanguard Semiconductor, DongBu, X-
Fab and HH Semi. On an integrated device level, Tower competes with GlobalFoundries,
STM and Samsung, all of which produce ICs for their own use and allocate excess
capacity for external customers. Most of the competing foundries are located in Asia-
Pacific and benefit from their proximity to companies involved in IC design and the Asian
customer base.
Management Russell Ellwanger – CEO
Mr. Ellwanger was appointed Chief Executive Officer in May 2005. Previously, from 1998
to 2005, he served in various positions for Applied Materials Corporation, including Group
Vice President, General Manager of the Applied Global Services division from 2004-2005,
and Group Vice President, General Manager of the CMP and Electroplating Business
Group from 2002-2004. Mr. Ellwanger also served as Corporate Vice President, General
Manager of the Metrology and Inspection Business Group from 2000-2002, during which
he was based in Israel. From 1998 to 2000, he served as Vice President of Applied
Materials’ 300-nm Program Office, USA. Mr. Ellwanger also served as General Manager
of Applied Materials’ Metal CVD Business Development, during which he was based in
Singapore. In addition, Mr. Ellwanger held various managerial positions at Novellus
Systems, Inc. from 1992 to 1996 and at Philips Semiconductors from 1980 to 1992.
Dr. Itzhak Edrei – President
Dr. Edrei was appointed President in November 2011. He previously served as an
Executive Vice President of Tower Business Units and Business Development since 2008
and as Senior Vice President of Product Lines and Worldwide Sales since August 2005. In
1996, Dr. Edrei established the Research and Development Group at Tower. He was the
Director for R&D and later Vice President of R&D from August 2001. From 1994 to 1996,
Dr. Edrei served as Tower’s Device and Yield Department Manager. Prior to joining
Tower, he was employed by National Semiconductor as Device and Yield Section Head.
Dr. Edrei received his Ph.D. in Physics and his B.Sc. in Computer Science and Physics
Tower Semiconductor Ltd. TSEM (OUTPERFORM) - $20.00
11
from Bar Ilan University in Israel in 1988 and 1983, respectively. From 1988-1990, he did
his Post Doctorate at Rutgers University, NJ.
Ephie Koltin – COO
Mr. Koltin was appointed COO in February of 2013. He previously served as Executive
Vice President of Worldwide Operations since November 2011, Senior Vice President of
Worldwide operations since 2009, Fab 1 Manager since April 2007, and Vice President of
Business Development since August 2005. He also served as Vice President, General
Foundry and Mixed Signal Technology since 2003 and as Senior Director, FAB2 Process
Engineering since 2000. From 1996-1999, Mr. Koltin served in several senior positions as
Director, NVM Technology, CIS Technology and ERS Manager, Fab1. Prior to joining
Tower, he was employed at National Semiconductor and the Technion – Israel Institute of
Technology. Mr. Koltin holds a M.Sc. in Materials Engineering and a B.Sc. in Mechanical
Engineering from the Technion – Israel Institute of Technology.
Oren Shirazi – CFO, Senior VP Finance
Mr. Shirazi was appointed CFO in November 2004, after serving as Controller since July
2000. He joined Tower in October 1998 serving as Vice Controller. Previously, he was
employed as an Audit Manager in the accounting firm of Ratzkovski-Fried & Co., which
merged with Ernst & Young (Israel), commencing August 1995. Mr. Shrazi is a Certified
Public Accountant in Israel, and has an MBA in Business Management from the Graduate
School of Business at Haifa University with honors and a B.A. in Economics and
Accounting from Haifa University.
Dalit Dahan – Senior VP HR and IT
Ms. Dahan was appointed Senior Vice President of Human Resources in April 2004, and
IT manager in January 1998. She served as Director of Personnel, Recreation &
compensation from 1998 through 2004 and as Compensation and Benefits Manager from
1993 to 2004. Previously, she was employed by ORS, a manpower company as the
manager of the company’s northern branch responsible for all recruitment activities and
the daily personnel and compensation activities of approximately 150 employees. Ms.
Dahan holds an MBA from the University of Derby and a B.A. in Social Science from Haifa
University.
Nati Somekh – Senior VP, Chief Legal Officer and Corporate Secretary
Ms. Somekh was appointed Senior Vice President, Chief Legal Officer and Corporate
Secretary in September 2008, having served as Corporate Secretary and General
Counsel since March 2005, and as Associate General Counsel since May 2004. From
2001-2004, she was employed by Goldsobel & Kirshen, Adv., specializing in the areas of
intellectual property, biotechnology and corporate law. Ms. Somekh holds an LL.M and
J.D. from Boston University and a B.A. from Johns Hopkins University. She is a member
of the Israeli Bar Association and the New York Bar.
Yossi Netzer – Senior VP of Corporate Planning
Mr. Netzer was appointed Senior Vice President of Corporate Planning in February 2013
after serving as Vice President of Corporate Planning since November 2008. Prior to this,
he served as General Manager of Mixed Signal, RF and Power Management Product
Lines since 2005 and as Director, FAB 2 Yield and Device Engineering Manager since
2000. From 1995 to 2000, Mr. Netzer served in various engineering management
positions within the R&D division dealing with CMOS, Mixed Signal, RF, and NVM
Technologies. Prior to joining Tower, he was employed at National Semiconductor and the
Technion – Israel Institute of Technology. Mr. Netzer holds a B.Sc. degree in electrical
engineering from the Technion – Israel Institute of Technology.
Tower Semiconductor Ltd.TSEM (OUTPERFORM) - $20.00
12
Rafi Mor – TowerJazz Japan, Ltd. Representative Director & CEO
Mr. Mor was appointed TowerJazz, Ltd. Representative Director and CEO of TowerJazz
Japan in January 2013 after serving as CEO of TowerJazz Japan from October 2012.
Prior he served as Senior Vice President and General Manager at Newport Beach from
September 2008. In April 2007, he was the vice President of Business Development for
Tower Semiconductor. Previously, he served as Tower’s Vice President and Fab 2
Manager since August 2005 and as Fab 1 Manager since March 2003. From November
2000 to March 2003, Mr. Mor served as Senior Director of Process Device and Yield of
Fab 1. From 1998 to 2000, he served as Director of Equipment & Support of Fab 1. Prior
to this, he was employed by National Semiconductor in various engineering and
management capacities. Mr. Mor earned his M.Sc. and B.Sc. in Chemical Engineering
from Ben Gurion University in Israel.
Key Risks Risks to our thesis include, but are not limited to: 1) Any significant decrease in the
demand for smartphones, consumer electronics, PCs or other electronic devices may
decrease the demand for Tower's services and products. 2) If ASPs of smartphones or
tablets come under pressure, Tower may be pressured to reduce their own ASPs, which
could impact the company’s revenues and margins significantly. 3) A slowdown in demand
for consumer electronics could lead to elevated inventory levels at customers, which could
result in Tower having to lower utilization rates, which could impact margins. 4) Risk of
dilution from convertible bonds could impact EPS. 5) Specialty foundries typically operate
one generation behind new technologies. If there is a technology breakthrough making
newer generation tech cheaper and more economical, later generation fabricators could
lose capacity and customers.
Recent Results & Outlook Tower reported solid 3Q results and 4Q outlook on November 11th. Sales for 3Q were
$244M (+4% Q/Q), in line with consensus, while non-GAAP EPS of $0.62 topped the
Street’s $0.58 estimate. Non-GAAP GMs increased 120bp sequentially to 38.3% primarily
on better utilization at Fab 2 & 3 and, to a lesser extent, third-party revenue ramping at
TPSCo. GMs are expected to increase to 40% in 4Q driven by better utilization. As
demand continues to outstrip supply for TSEM, management guided 4Q sales up 3% Q/Q
to $252M, besting the Street’s $250M. We believe continued strength in RF-SOI switching
from lead customers AVGO, SWKS and QRVO are driving the solid 4Q outlook.
Management also noted that seasonality likely would not impact 1Q sales as third-party
revenue at TPSCo continues to ramp.
Tower Semiconductor Ltd. TSEM (OUTPERFORM) - $20.00

13
Foundry & Specialty Foundry Research
Shaw n Simmons (212) 667-8387 - Director
Rick Schafer (720) 554-1119 - Managing Director
Price Price Mkt Total Net Ent. Net Cash EV Cash Flow Book Tang. Book Avg Day Short SI to Days to Div
Rating Ticker Name 12/14/2015 Target Cap Cash Cash Value Per Share Per Share Per Share Per Share Per Share Vol (M) Int (M) Float Cover Yield
Not Covered AMKR Amkor $6.25 NA $1,481 $432 -$1,008 $2,489 -$4.25 $10.50 $2.67 $5.01 $5.01 1.4 3.1 3% 2.5x 0.0%
Not Covered SMI Semiconductor Manufacturing International $4.98 NA $4,092 $1,293 $244 $3,847 $0.30 $4.68 $0.40 $4.39 $4.39 0.1 0.1 NA 2.7x 0.0%
Outperform TSEM Tow erJazz $15.25 $20 $1,465 $155 -$101 $1,565 -$1.05 $16.30 $2.17 $3.38 $3.31 0.8 1.6 3% 3.8x 0.0%
Not Covered TSM Taiw an Semiconductor Manufacturing Co. $22.33 NA $115,805 $1,923 $365 $115,440 $0.07 $22.26 $3.13 $7.43 $7.39 12.3 50.0 NA 5.1x 2.6%
Not Covered UMC United Manufacturiing Corp $1.79 NA $4,448 $1,607 -$110 $4,558 -$0.04 $1.83 $0.76 $2.71 $2.71 1.0 15.4 NA 13.3x 3.3%
CY EPS P/E P/E (Ex-Cash) FCF Price/ Price/ Price/ CY Sales P/S EV/Sales
Rating Ticker Name 16E 17E 16E 17E 16E 17E Yield Cash Book Tang.Book 16E 17E 16E 17E 16E 17E
Not Covered AMKR Amkor $0.42 $0.53 14.9x 11.8x 25.0x 19.8x 42.7% NM 1.2x 1.2x $3,794 $3,946 0.4x 0.4x 0.7x 0.6x
Not Covered SMI Semiconductor Manufacturing International $0.42 NA 11.9x NA 11.1x NM 8.1% 16.7x 1.1x 1.1x $2,556 NA 1.6x NA 1.5x NA
Outperform TSEM Tow erJazz $1.40 $2.00 10.9x 7.6x 11.7x 8.2x 14.2% NM 4.5x 4.6x $1,075 $1,185 1.4x 1.2x 1.5x 1.3x
Not Covered TSM Taiw an Semiconductor Manufacturing Co. $1.77 $1.92 12.6x 11.6x 12.6x 11.6x 14.0% 317.3x 3.0x 3.0x $27,762 $30,240 4.2x 3.8x 4.2x 3.8x
Not Covered UMC United Manufacturiing Corp $0.14 $0.17 12.8x 10.5x 13.1x 10.8x 42.7% NM 0.7x 0.7x $4,509 $4,759 1.0x 0.9x 1.0x 1.0x
AVERAGE 12.6x 10.4x 14.7x 12.6x 24.3% 167.0x 2.1x 2.1x $7,939 $10,033 1.7x 1.6x 1.8x 1.7x
MEDIAN 12.6x 11.1x 12.6x 11.2x 14.2% 167.0x 1.2x 1.2x $3,794 $4,352 1.4x 1.1x 1.5x 1.1x
Estimates for "Not Covered" Companies come from First Call and FactSet.
Source: FactSet, Company Reports and Oppenheimer & Co. Inc.
Tower Semiconductor Ltd.TSEM (OUTPERFORM) - $20.00
14
TowerJazz 1Q14 2Q14 3Q14 4Q14 1Q15 2Q15 3Q15 4Q15 1Q16 2Q16 3Q16 4Q16
Oppenheimer & Co.
$Mill. Except per Share Data
Income Statement 2014 2015E 2016E 2017E
FY Ends December Mar June Sept Dec Mar June Sept Dec Mar June Sept Dec
From Continuting Operations Q1 Q2 Q3 Q4 Year Q1 Q2 Q3 Q4-E Year Q1-E Q2-E Q3-E Q4-E Year Year
Net Sales $132.7 $234.1 $226.0 $235.3 $828.0 $226.2 $235.6 $244.2 $252.0 $958.0 $255.0 $265.0 $275.0 $280.0 $1,075.0 $1,185.0
QoQ Chg -1% 76% -3% 4% -4% 4% 4% 3% 1% 4% 4% 2%
YoY Chg 17.8% 86.9% 70.5% 74.8% 64.0% 70.5% 0.6% 8.0% 7.1% 15.7% 12.7% 12.5% 12.6% 11.1% 12.2% 10.2%
COGS 88.2 171.7 158.2 151.1 569.1 145.5 148.2 150.6 151.2 595.5 152.4 157.7 162.3 164.5 636.8 691.6
Gross Profit 44.5 62.4 67.8 84.2 258.9 80.7 87.4 93.6 100.8 362.5 102.6 107.3 112.8 115.5 438.2 493.4
37.5
Operating Expenses
R&D 7.2 13.7 15.4 13.7 50.0 14.4 14.4 15.8 16.0 60.6 16.1 16.2 16.4 16.5 65.2 67.4
SG&A 9.9 15.6 15.0 14.6 55.1 14.9 14.4 14.8 15.0 59.1 15.1 15.2 15.3 15.4 61.0 62.4
Total Operating Expenses 17.0 29.3 30.4 28.3 105.0 29.4 28.8 30.6 31.0 119.7 31.2 31.4 31.7 31.9 126.2 129.8
Operating Income (Loss) 27.5 33.1 37.4 55.9 153.9 51.3 58.6 63.1 69.8 242.8 71.4 75.9 81.1 83.6 312.0 363.6
Other Income (Expense), Net 121.8 (5.8) (14.9) (25.0) 76.2 (88.2) (10.9) (9.1) (9.0) (117.3) (9.0) (9.0) (9.0) (9.0) (36.0) (36.0)
Income Before Taxes 19.5 24.4 28.4 48.1 120.3 47.7 55.0 59.2 60.8 222.7 62.4 66.9 72.1 74.6 276.0 327.6
Taxes 0.1 -1.4 -1.3 0.5 0.7 1.2 1.8 4.2 1.9 2.0 2.2 2.2 8.3 9.8
Non Controlling Interest 6.7 2.5 -3.6 5.6 2.3 -0.4 -0.5 1.5 3.0 1.5 1.5 1.5 1.5 6.0 6.0
Net Income 19.5 30.992 30.9 45.9 127.3 49.5 55.8 59.4 60.5 221.5 62.1 66.4 71.4 73.9 273.7 323.8
Avg. Shares Outstanding
Fully Diluted 48.1 50.1 53.2 55.6 51.8 63.6 96.8 95.9 96.1 88.1 96.1 96.4 96.7 97.0 96.5 100.5
GAAP Shares 48.1 50.1 53.2 66.5 54.5 63.6 87.6 86.8 86.8 81.2 86.8 87.1 87.4 87.7 87.3 87.6
Earnings Per Share
Fully Diluted $0.41 $0.62 $0.58 $0.83 $2.46 $0.78 $0.58 $0.62 $0.63 $2.51 $0.65 $0.69 $0.74 $0.76 $2.84 $3.22
GAAP EPS $0.81 ($0.31) ($0.37) $0.01 $0.08 ($1.15) $0.09 $0.16 $0.26 ($0.36) $0.27 $0.32 $0.39 $0.41 $1.40 $2.00
Margin Data
Gross Margin 33.5% 26.7% 30.0% 35.8% 31.3% 35.7% 37.1% 38.3% 40.0% 37.8% 40.3% 40.5% 41.0% 41.3% 40.8% 41.6%
R&D 5.4% 5.9% 6.8% 5.8% 6.0% 6.4% 6.1% 6.5% 6.3% 6.3% 6.3% 6.1% 6.0% 5.9% 6.1% 5.7%
SG&A 7.4% 6.6% 6.6% 6.2% 6.6% 6.6% 6.1% 6.1% 6.0% 6.2% 5.9% 5.7% 5.6% 5.5% 5.7% 5.3%
Operating Margins 20.7% 14.1% 16.5% 23.8% 18.6% 22.7% 24.9% 25.8% 27.7% 25.3% 28.0% 28.7% 29.5% 29.9% 29.0% 30.7%
Pretax Margin 14.7% 10.4% 12.6% 20.4% 14.5% 21.1% 23.3% 24.3% 24.1% 23.3% 24.5% 25.3% 26.2% 26.6% 25.7% 27.6%
Net Margin 14.7% 13.2% 13.7% 19.5% 15.4% 21.9% 23.7% 24.3% 24.0% 23.1% 24.3% 25.1% 26.0% 26.4% 25.5% 27.3%
Tax Rate 0.3% 5.0% -1.1% 1.0% 1.3% 2.0% 3.0% 1.9% 3.0% 3.0% 3.0% 3.0% 3.0% 3.0%
Source: Company reports and Oppenheimer & Co. Inc.
2016E2015E2014
Tower Semiconductor Ltd. TSEM (OUTPERFORM) - $20.00

15
TowerJazzOppenheimer & Co.
BALANCE SHEET ($ MIL) Dec-13 Mar-14 Jun-14 Sep-14 Dec-14 Mar-15 Jun-15 Sep-15
ASSETS
Cash, Equivalents, & Short-term $122.9 $182.8 $192.2 $195.1 $187.2 $134.2 $142.5 $155.3
Accounts Receivable, net 80.3 82.7 106.6 86.3 99.2 105.5 112.6 122.7
Inventories 64.8 94.5 83.7 85.2 87.9 86.2 91.9 104.4
Other Current Assets 22.4 73.2 46.8 27.7 19.9 27.7 25.1 31.0
TOTAL CURRENT ASSETS 290.4 433.2 429.2 394.3 394.1 353.6 372.1 413.4
PP&E, net 350.0 483.5 485.2 447.6 419.1 408.5 415.1 430.5
Goodwill & Intangibles 39.4 33.9 56.6 52.6 49.0 48.2 46.3 43.7
Long-term Investments 14.5 14.1 14.4 13.8 11.9 11.8 12.4 12.1
Other Assets 11.5 10.9 10.8 10.4 10.0 6.4 7.4 7.2
TOTAL ASSETS $705.9 $975.6 $996.2 $918.8 $884.1 $828.5 $853.3 $906.9
LIABILITIES & SHAREHOLDER EQUITY
Short-term Debt $36.4 $46.4 $97.1 $64.7 $120.0 $26.7 $40.6 $49.2
Accounts Payable $66.4 $73.6 $100.5 $99.9 $98.6 $108.6 $106.7 $111.9
Other Current (Accrued) Liabilities 37.1 126.6 110.7 86.7 81.7 67.2 84.3 91.5
Total Current Liabilities 139.9 246.6 308.3 251.3 300.3 202.6 231.5 252.7
Long-term Debt 316.9 386.8 339.4 340.2 267.1 225.8 214.4 206.8
Other Long Term Liabilities 107.8 135.1 157.0 147.6 121.2 108.1 107.2 122.8
Shareholders' Equity 141.2 207.1 191.5 179.6 195.6 292.0 300.3 324.6
TOTAL LIAB. & SHRHOLDER EQUITY $705.9 $975.6 $996.2 $918.8 $884.1 $828.5 $853.3 $906.9
PROFITABILITY RATIOS
Return On Equity 54.3% 37.7% 64.7% 68.8% 93.9% 67.8% 74.3% 73.2%
Return on Avg Equity * 33.8% 35.3% 45.1% 62.7% 63.2% 65.1% 75.9% 81.0%
Return On Assets 10.9% 8.0% 12.4% 13.4% 20.8% 23.9% 26.2% 26.2%
Return On Net Assets 13.1% 9.8% 15.4% 17.1% 26.4% 28.5% 31.4% 31.6%
Return On Sales 14.2% 14.7% 13.2% 13.7% 19.5% 21.9% 23.7% 24.3%
EFFICIENCY RATIOS
Sales/Total Assets 0.8 0.5 0.9 1.0 1.1 1.1 1.1 1.1
A/R Days Sales Out 54.5 56.9 41.5 34.8 38.5 42.6 43.6 45.8
Inventory Turns 5.3 4.4 7.7 7.5 7.0 6.7 6.7 6.2
Days of Inventory 69.4 82.2 47.2 48.6 52.1 54.4 54.7 59.3
LIQUIDITY RATIOS
Current Ratio 2.1 1.8 1.4 1.6 1.3 1.7 1.6 1.6
Quick Ratio 1.6 1.4 1.1 1.2 1.0 1.3 1.2 1.2
Net Working Capital $150.5 $186.6 $120.9 $143.0 $93.8 $151.0 $140.6 $160.8
Long-term Debt/Equity 224.3% 186.7% 177.3% 189.4% 136.6% 77.3% 71.4% 63.7%
Total Debt/Equity 326.5% 274.4% 310.0% 307.6% 259.9% 123.5% 120.6% 116.7%
BOOK VALUE & CASH
Book Value Per Share $2.50 $4.31 $3.82 $3.38 $3.51 $4.59 $3.10 $3.38
Cash Per Share 2.44 4.09 4.12 3.93 3.58 2.30 1.60 1.75
Net Cash Per Share ($3.18) ($3.95) ($2.65) ($2.47) ($1.22) ($1.26) ($0.61) ($0.41)
Source: Company reports and Oppenheimer & Co. Inc.
Tower Semiconductor Ltd.TSEM (OUTPERFORM) - $20.00
16
Stock prices of other companies mentioned in this report (as of 12/11/15):Amkor Technology, Inc. (AMKR-NASDAQ, $6.2, Not Covered)Fairchild Semiconductor International, Inc. (FCS-NASDAQ, $20.65, Not Covered)Himax Technologies, Inc. (HIMX-NASDAQ, $7.97, Not Covered)International Business Machines Corp. (IBM-NYSE, $134.57, Not Covered)Micron Technology, Inc. (MU-NASDAQ, $14.04, Not Covered)Panasonic Corp. (6752-JP, ¥1261.5, Not Covered)Samsung Electronics Co., Ltd. (005930-KRX, W1261000, Not Covered)Semiconductor Manufacturing International Corp. (981-HKG, HK$0.8, Not Covered)STMicroelectronics NV (STM - NYSE, $6.59, Not Covered)Taiwan Semiconductor Manufacturing Co., Ltd. (2330-TAI, NT$139, Not Covered)United Microelectronics Corp. (UMC - NYSE, $1.79, Not Covered)Vanguard International Semiconductor Corp. (5347-TAI, NT$39.25, Not Covered)
Disclosure AppendixOppenheimer & Co. Inc. does and seeks to do business with companies covered in its research reports. As a result,investors should be aware that the firm may have a conflict of interest that could affect the objectivity of this report.Investors should consider this report as only a single factor in making their investment decision.
Analyst Certification - The author certifies that this research report accurately states his/her personal views about thesubject securities, which are reflected in the ratings as well as in the substance of this report. The author certifies that no partof his/her compensation was, is, or will be directly or indirectly related to the specific recommendations or views containedin this research report.Potential Conflicts of Interest:Equity research analysts employed by Oppenheimer & Co. Inc. are compensated from revenues generated by the firmincluding the Oppenheimer & Co. Inc. Investment Banking Department. Research analysts do not receive compensationbased upon revenues from specific investment banking transactions. Oppenheimer & Co. Inc. generally prohibits any researchanalyst and any member of his or her household from executing trades in the securities of a company that such researchanalyst covers. Additionally, Oppenheimer & Co. Inc. generally prohibits any research analyst from serving as an officer,director or advisory board member of a company that such analyst covers. In addition to 1% ownership positions in coveredcompanies that are required to be specifically disclosed in this report, Oppenheimer & Co. Inc. may have a long positionof less than 1% or a short position or deal as principal in the securities discussed herein, related securities or in options,futures or other derivative instruments based thereon. Recipients of this report are advised that any or all of the foregoingarrangements, as well as more specific disclosures set forth below, may at times give rise to potential conflicts of interest.
Important Disclosure Footnotes for Companies Mentioned in this Report that Are Covered byOppenheimer & Co. Inc:Stock Prices as of December 14, 2015Avago Technologies (AVGO - NYSE, $144.42, OUTPERFORM)Himax Technologies, Inc. (HIMX - NASDAQ, $7.97, PERFORM)Intel Corp. (INTC - NASDAQ, $34.27, PERFORM)Maxim Integrated Products (MXIM - NASDAQ, $37.79, PERFORM)Qorvo, Inc. (QRVO - NASDAQ, $56.19, PERFORM)Semtech Corp. (SMTC - OTC, $19.01, PERFORM)Skyworks Solutions, Inc. (SWKS - NASDAQ, $81.43, OUTPERFORM)
Tower Semiconductor Ltd. TSEM (OUTPERFORM) - $20.00
17
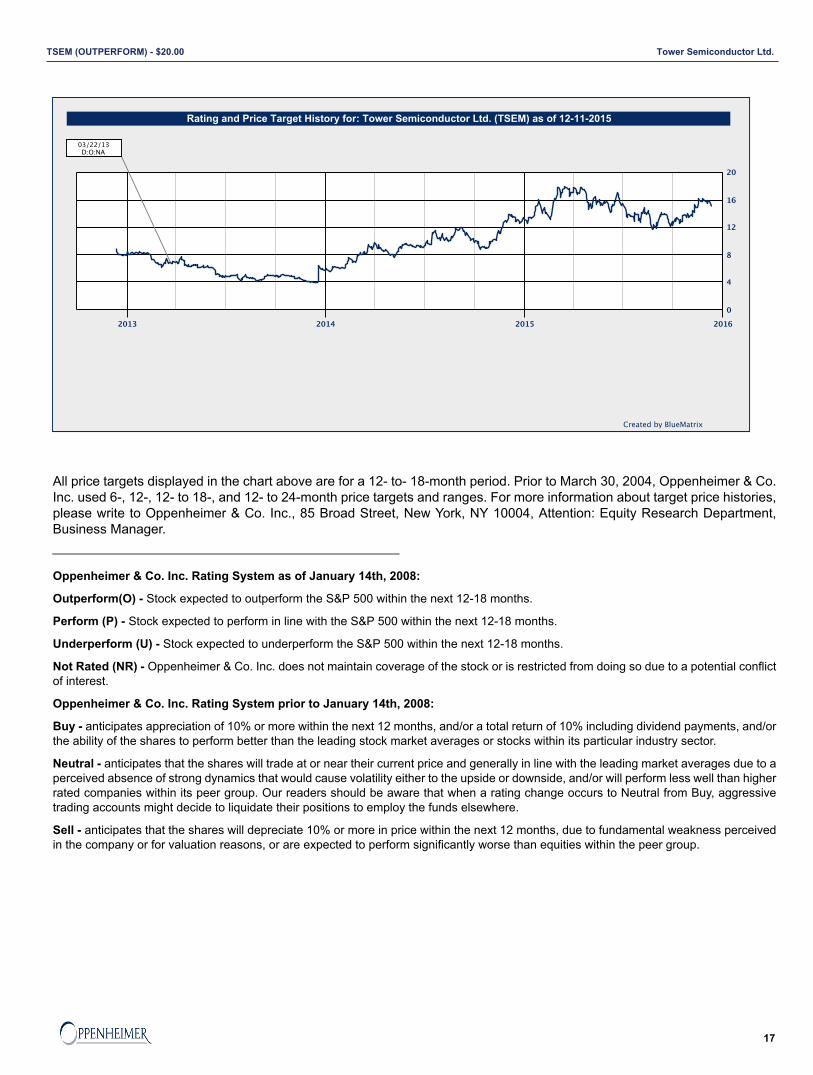
All price targets displayed in the chart above are for a 12- to- 18-month period. Prior to March 30, 2004, Oppenheimer & Co.Inc. used 6-, 12-, 12- to 18-, and 12- to 24-month price targets and ranges. For more information about target price histories,please write to Oppenheimer & Co. Inc., 85 Broad Street, New York, NY 10004, Attention: Equity Research Department,Business Manager.
Oppenheimer & Co. Inc. Rating System as of January 14th, 2008:
Outperform(O) - Stock expected to outperform the S&P 500 within the next 12-18 months.
Perform (P) - Stock expected to perform in line with the S&P 500 within the next 12-18 months.
Underperform (U) - Stock expected to underperform the S&P 500 within the next 12-18 months.
Not Rated (NR) - Oppenheimer & Co. Inc. does not maintain coverage of the stock or is restricted from doing so due to a potential conflictof interest.
Oppenheimer & Co. Inc. Rating System prior to January 14th, 2008:
Buy - anticipates appreciation of 10% or more within the next 12 months, and/or a total return of 10% including dividend payments, and/orthe ability of the shares to perform better than the leading stock market averages or stocks within its particular industry sector.
Neutral - anticipates that the shares will trade at or near their current price and generally in line with the leading market averages due to aperceived absence of strong dynamics that would cause volatility either to the upside or downside, and/or will perform less well than higherrated companies within its peer group. Our readers should be aware that when a rating change occurs to Neutral from Buy, aggressivetrading accounts might decide to liquidate their positions to employ the funds elsewhere.
Sell - anticipates that the shares will depreciate 10% or more in price within the next 12 months, due to fundamental weakness perceivedin the company or for valuation reasons, or are expected to perform significantly worse than equities within the peer group.
Tower Semiconductor Ltd.TSEM (OUTPERFORM) - $20.00
18
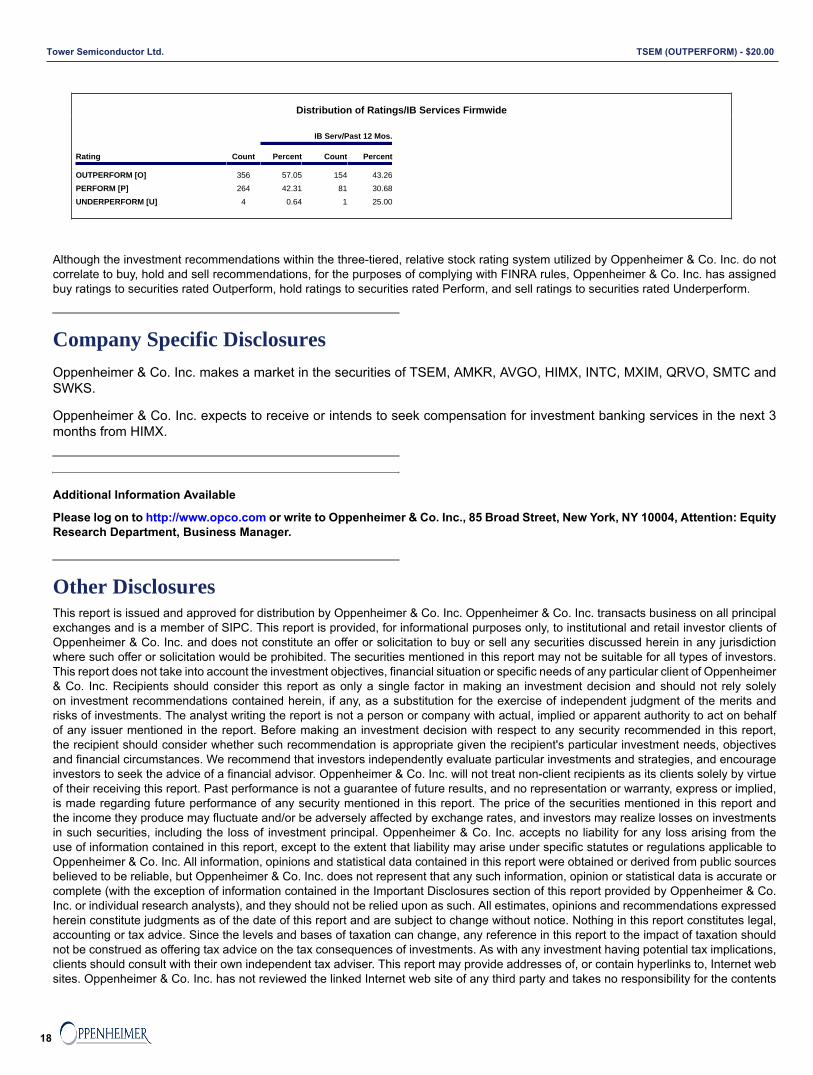
Distribution of Ratings/IB Services Firmwide
IB Serv/Past 12 Mos.
Rating Count Percent Count Percent
OUTPERFORM [O] 356 57.05 154 43.26
PERFORM [P] 264 42.31 81 30.68
UNDERPERFORM [U] 4 0.64 1 25.00
Although the investment recommendations within the three-tiered, relative stock rating system utilized by Oppenheimer & Co. Inc. do notcorrelate to buy, hold and sell recommendations, for the purposes of complying with FINRA rules, Oppenheimer & Co. Inc. has assignedbuy ratings to securities rated Outperform, hold ratings to securities rated Perform, and sell ratings to securities rated Underperform.
Company Specific DisclosuresOppenheimer & Co. Inc. makes a market in the securities of TSEM, AMKR, AVGO, HIMX, INTC, MXIM, QRVO, SMTC andSWKS.
Oppenheimer & Co. Inc. expects to receive or intends to seek compensation for investment banking services in the next 3months from HIMX.
Additional Information Available
Please log on to http://www.opco.com or write to Oppenheimer & Co. Inc., 85 Broad Street, New York, NY 10004, Attention: EquityResearch Department, Business Manager.
Other DisclosuresThis report is issued and approved for distribution by Oppenheimer & Co. Inc. Oppenheimer & Co. Inc. transacts business on all principalexchanges and is a member of SIPC. This report is provided, for informational purposes only, to institutional and retail investor clients ofOppenheimer & Co. Inc. and does not constitute an offer or solicitation to buy or sell any securities discussed herein in any jurisdictionwhere such offer or solicitation would be prohibited. The securities mentioned in this report may not be suitable for all types of investors.This report does not take into account the investment objectives, financial situation or specific needs of any particular client of Oppenheimer& Co. Inc. Recipients should consider this report as only a single factor in making an investment decision and should not rely solelyon investment recommendations contained herein, if any, as a substitution for the exercise of independent judgment of the merits andrisks of investments. The analyst writing the report is not a person or company with actual, implied or apparent authority to act on behalfof any issuer mentioned in the report. Before making an investment decision with respect to any security recommended in this report,the recipient should consider whether such recommendation is appropriate given the recipient's particular investment needs, objectivesand financial circumstances. We recommend that investors independently evaluate particular investments and strategies, and encourageinvestors to seek the advice of a financial advisor. Oppenheimer & Co. Inc. will not treat non-client recipients as its clients solely by virtueof their receiving this report. Past performance is not a guarantee of future results, and no representation or warranty, express or implied,is made regarding future performance of any security mentioned in this report. The price of the securities mentioned in this report andthe income they produce may fluctuate and/or be adversely affected by exchange rates, and investors may realize losses on investmentsin such securities, including the loss of investment principal. Oppenheimer & Co. Inc. accepts no liability for any loss arising from theuse of information contained in this report, except to the extent that liability may arise under specific statutes or regulations applicable toOppenheimer & Co. Inc. All information, opinions and statistical data contained in this report were obtained or derived from public sourcesbelieved to be reliable, but Oppenheimer & Co. Inc. does not represent that any such information, opinion or statistical data is accurate orcomplete (with the exception of information contained in the Important Disclosures section of this report provided by Oppenheimer & Co.Inc. or individual research analysts), and they should not be relied upon as such. All estimates, opinions and recommendations expressedherein constitute judgments as of the date of this report and are subject to change without notice. Nothing in this report constitutes legal,accounting or tax advice. Since the levels and bases of taxation can change, any reference in this report to the impact of taxation shouldnot be construed as offering tax advice on the tax consequences of investments. As with any investment having potential tax implications,clients should consult with their own independent tax adviser. This report may provide addresses of, or contain hyperlinks to, Internet websites. Oppenheimer & Co. Inc. has not reviewed the linked Internet web site of any third party and takes no responsibility for the contents
Tower Semiconductor Ltd. TSEM (OUTPERFORM) - $20.00

19
thereof. Each such address or hyperlink is provided solely for the recipient's convenience and information, and the content of linked thirdparty web sites is not in any way incorporated into this document. Recipients who choose to access such third-party web sites or followsuch hyperlinks do so at their own risk.This research is distributed in the UK and elsewhere throughout Europe, as third party research by Oppenheimer Europe Ltd, which isauthorized and regulated by the Financial Conduct Authority (FCA). This research is for information purposes only and is not to be construedas a solicitation or an offer to purchase or sell investments or related financial instruments. This research is for distribution only to personswho are eligible counterparties or professional clients and is exempt from the general restrictions in section 21 of the Financial Servicesand Markets Act 2000 on the communication of invitations or inducements to engage in investment activity on the grounds that it is beingdistributed in the UK only to persons of a kind described in Article 19(5) (Investment Professionals) and 49(2) High Net Worth companies,unincorporated associations etc.) of the Financial Services and Markets Act 2000 (Financial Promotion) Order 2005 (as amended). It is notintended to be distributed or passed on, directly or indirectly, to any other class of persons. In particular, this material is not for distribution to,and should not be relied upon by, retail clients, as defined under the rules of the FCA. Neither the FCA’s protection rules nor compensationscheme may be applied.Distribution in Hong Kong: This report is prepared for professional investors and is being distributed in Hong Kong by OppenheimerInvestments Asia Limited (OIAL) to persons whose business involves the acquisition, disposal or holding of securities, whether as principalor agent. OIAL, an affiliate of Oppenheimer & Co. Inc., is regulated by the Securities and Futures Commission for the conduct ofdealing in securities, advising on securities, and advising on Corporate Finance. For professional investors in Hong Kong, please [email protected] for all matters and queries relating to this report. This report or any portion hereof may not be reprinted, sold, orredistributed without the written consent of Oppenheimer & Co. Inc.
This report or any portion hereof may not be reprinted, sold, or redistributed without the written consent of Oppenheimer & Co. Inc. Copyright© Oppenheimer & Co. Inc. 2015.
Tower Semiconductor Ltd.TSEM (OUTPERFORM) - $20.00