towards retinal repair: bioelectric assessment of retinal ... · tampereen teknillinen yliopisto....
TRANSCRIPT

Tampere University of Technology
Towards Retinal Repair: Bioelectric Assessment of Retinal Pigment Epithelium in vitroand Electrode Materials for Retinal Implants
CitationOnnela, N. (2012). Towards Retinal Repair: Bioelectric Assessment of Retinal Pigment Epithelium in vitro andElectrode Materials for Retinal Implants. (Tampere University of Technology. Publication; Vol. 1037). TampereUniversity of Technology.Year2012
VersionPublisher's PDF (version of record)
Link to publicationTUTCRIS Portal (http://www.tut.fi/tutcris)
Take down policyIf you believe that this document breaches copyright, please contact [email protected], and we will remove accessto the work immediately and investigate your claim.
Download date:02.05.2020


Tampereen teknillinen yliopisto. Julkaisu 1037 Tampere University of Technology. Publication 1037
Niina Onnela Towards Retinal Repair: Bioelectric Assessment of Retinal Pigment Epithelium in vitro and Electrode Materials for Retinal Implants Thesis for the degree of Doctor of Science in Technology to be presented with due permission for public examination and criticism in Rakennustalo Building, Auditorium RG202, at Tampere University of Technology, on the 17th of October 2012, at 12 noon. Tampereen teknillinen yliopisto - Tampere University of Technology Tampere 2012

ISBN 978-952-15-2807-1 (printed) ISBN 978-952-15-2992-4 (PDF) ISSN 1459-2045

i
ABSTRACT
The aim of this thesis was to develop methods for future solutions to prevent eye diseases caused by the dysfunctions of retinal pigment epithelial (RPE) cells and to restore the vision of blind patients. On a cellular level, the degeneration of RPE cells is often the prime cause of eye diseases such as age-related macular degeneration and some forms of retinitis pigmentosa. RPE cell replacement therapy may provide new solutions for the prevention of eye diseases that lead to blindness. RPE cells differentiated from pluripotent stem cells provide a promising source for cell replacement therapy. However, the functionality of the differentiated cells is still not fully proven. One objective of this thesis was to provide solutions for testing the functionality of differentiated RPE cells. If blindness cannot be cured, artificial vision provided by retinal implant may be considered. The second objective of this thesis was to characterize the electrochemical properties of the different electrode materials used in retinal implants. The electrode materials used in retinal implants should be carefully considered in order to increase the resolution of the implant and to provide stable, safe, and biocompatible charge injection. All the methods used and developed in this thesis were based on bioelectrical phenomena.
The electrochemical characterization of five different electrode materials used in retinal implants used electrical impedance spectroscopy (EIS) and cyclic voltammetry (CV) measurements. We considered the effect of electrode size and material on charge capacity and impedance. Atomic force microscopy (AFM) was used to study the surface properties of the studied electrodes. The testing of the materials was done using exactly the same measurement conditions and electrode producing methods to provide easily comparable data.
In this thesis, the functionality of RPE cells differentiated from human embryonic stem cells (hESC-RPE) was studied with two different methods. EIS was used to compare the electrical properties between two different RPE cell lines (immortalized human RPE cell line (ARPE-19) and hESC-RPE). To our knowledge, EIS measurements of RPE cells have not been published before. EIS was also used to find out how the barrier properties of hESC-RPE cells differ when the cells are in different stages of maturity. In addition, we developed a method that could be used to study the functionality of hESC-RPE cells with in vitro electroretinography (ERG) measurements: Our hypothesis is that RPE cells enhance the ERG response of the mouse retina and enable longer culturing of the functional retina in vitro. Comparing the ERG responses of a mouse retina alone and of a mouse retina cultured together with hESC-RPE cells could reveal the functionality of hESC-RPE cells.
The EIS measurements were in accordance with biological analyses. The hESC-RPE cells resembled morphologically mature RPE, and thus created high transepithelial resistance (TER) indicating high integrity and tight junction formation. The EIS measurements revealed that during the maturation the TER of the cell culture increases, peak phase diagram shifts to lower frequencies, and the capacitance of the epithelium increases. Permeability measurements verified that EIS measurements reveal the tight junction
failures and integrity decrease caused by calcium chelation. With the developed setup we were able to measure ERG responses from both the co-culture of retina and RPE and the retina cultured alone. However, due to limited sample size and possibly due to short co-culture time in our culture setup as yet we were not able to prove the hypothesis by showing that RPE cells would enhance the ERG response of the retina in vitro. Both the retina cultured alone and the co-culture responded to light stimulus after one day of culturing. CV and EIS measurements of different electrodes showed that iridium-black (Ir-b) and platinum-black (Pt-b) electrodes were superior, i.e. they had higher charge injection capacity and lower impedance when compared to other tested materials (gold (Au), titaniumnitrate (TiN), titanium (Ti)).
Based on our findings we can conclude that novel biocompatible electrode materials that have the potential to be used in implantation are available. In the same way as in this thesis, the electrochemical testing of electrode materials should be done using similar testing methods for every material to enable easy comparison of the results between different materials. At the moment, cell replacement therapy and the use of RPE cells is seriously considered as a choice for eye disease treatment. Our results suggest that EIS is useful when evaluating the overall maturity, integrity, and functionality of the RPE cell culture. In forthcoming cell transplantation therapies, EIS could provide a means to test the validity of stem cell-derived RPE non-invasively and aseptically before implantation. Our initial tests show that studies to test the ability of RPE cells to rescue the photoreceptors in a mouse model by testing ERG responses in vitro should be continued. Even though our results did not produce conclusive evidence, the co-culture of the retina and hESC-RPE cells may be a useful in vitro model for investigating the RPE cell replacement therapy and possible drug releasing materials for the retina.

iii
ACKNOWLEDGEMENTS
The work for the thesis was carried out at the Department of Biomedical Engineering, Tampere University of Technology, BioMediTech and at the Department of Bioengineering and Robotics, Tohoku University, Japan, during the 5 months visiting researcher period in 2009.
I wish to express my gratitude to my supervisor, Professor Jari Hyttinen, PhD, for his guidance throughout this research.
I acknowledge the help of Leena Lehtonen, M.Sc., for setting up the multielectrode array equipment with me for the ERG measurements. I thank Virpi Savolainen, M.Sc., for her help with the EIS measurements and data analysis. I would like to thank Hanna Vaajasaari, Kati Juuti-Uusitalo, and Tanja Ilmarinen for culturing the cells used in the studies and for the biological evaluation of the cells. I would also like to thank Rami Peurakoski and colleagues for their technical help when constructing the measurement devices.
I would like to thank Professor Jari Viik for his advice and guidance with the writing processes of some of the articles and of this thesis. I would like to thank Professor Tetsu Tanaka for providing me the possibility for research exchange and for using the laboratory facilities of Tohoku University. I acknowledge Heli Skottman and her group for providing us the RPE cells used in the studies. I would like to thank Hannele Uusitalo-Järvinen for providing us the mice used in the study. I would like to thank Professor Hannu Uusitalo for his valuable advice. I am also indebted to all my colleagues at the Department of Biomedical Engineering.
I wish to thank Docent Ari Pääkkönen, PhD, (assistant chief physicist at the department of Clinical Neurophysiology, Kuopio University Hospital, Finland), Professor Arto Urtti, PhD, (Centre for Drug Research, Faculty of Pharmacy, University of Helsinki, Finland), and Professor Ari Koskelainen, PhD, (BECS, Department of Biomedical Engineering and Computational Science, Aalto University) for their constructive criticism and advice as examiners of this thesis. I also thank Peter Heath for carefully revising the English of my thesis.
The financial support of The Graduate School of Tampere University of Technology, The Finnish Cultural Foundation, The Pirkanmaa Regional Fund of the Finnish Cultural Foundation, and The Emil Aaltonen Foundation is gratefully acknowledged.
I would also like to thank my family for their support. My heartfelt gratitude goes to my husband Juha-Pekka. Our son brightens our life with his adorable smile. Thank you, Manu.
Tampere, September 2012

v
TABLE OF CONTENTS
ABSTRACT ..................................................................................................................................... i ACKNOWLEDGEMENTS .............................................................................................................. iii TABLE OF CONTENTS .................................................................................................................. v LIST OF ORIGINAL PUBLICATIONS ............................................................................................. vii AUTHOR’S CONTRIBUTION ...................................................................................................... viii LIST OF ABBREVIATIONS ............................................................................................................ ix LIST OF SYMBOLS ....................................................................................................................... xi
1 INTRODUCTION ..................................................................................................... 1 1.1 FUNCTIONALITY OF THE HESC-RPE CELLS ....................................................................................... 3 1.2 ARTIFICIAL VISION - RETINAL IMPLANT ............................................................................................ 4
2 OBJECTIVES OF THE STUDY .................................................................................... 6
3 REVIEW OF THE LITERATURE AND THEORETICAL BACKGROUND ............................. 7 3.1 RETINAL PIGMENT EPITHELIUM (RPE) ........................................................................................... 7
3.1.1 RPE cell models .............................................................................................................. 8 3.1.2 Assessing the RPE functionality ..................................................................................... 9
3.2 ELECTRORETINOGRAM (ERG) ..................................................................................................... 10 3.2.1 ERG wave forms .......................................................................................................... 11 3.2.2 Estimating the functionality of retina and RPE using ERG .......................................... 13
3.3 ELECTRICAL IMPEDANCE SPECTROSCOPY (EIS) ............................................................................... 14 3.3.1 Bioimpedance .............................................................................................................. 16 3.3.2 Data fitting .................................................................................................................. 18 3.3.3 Epithelial measurement setups ................................................................................... 20 3.3.4 Effect of electrodes in bioimpedance measurement ................................................... 21 3.3.5 Lead field theory concerning impedance measurement ............................................. 22
3.4 RETINAL IMPLANTS ................................................................................................................... 22 3.4.1 Epiretinal vs. Subretinal ............................................................................................... 23 3.4.2 Fully implantable retinal implant ................................................................................ 24 3.4.3 Design of the implant .................................................................................................. 25 3.4.4 Biocompatibility of retinal implant .............................................................................. 25 3.4.5 Threshold currents ....................................................................................................... 26 3.4.6 Electrode properties .................................................................................................... 27
4 MATERIALS AND METHODS ................................................................................. 30 4.1 CELL CULTURES ......................................................................................................................... 30 4.2 ELECTRICAL IMPEDANCE SPECTROSCOPY OF RPE CELLS .................................................................... 31
4.2.1 Measurement setup .................................................................................................... 31 4.2.2 Determining electrical parameters from impedance data .......................................... 33 4.2.3 Biological assessment of the cells ............................................................................... 35
4.3 ELECTRORETINOGRAM FROM RETINA-RPE CO-CULTURE .................................................................. 35 4.3.1 Mouse retina preparations .......................................................................................... 35 4.3.2 Multielectrode array recordings .................................................................................. 36
4.4 THE ELECTRICAL PROPERTIES OF THE ELECTRODE MATERIALS USED IN RETINAL IMPLANTS ...................... 38 4.4.1 Sample electrodes ....................................................................................................... 38 4.4.2 Methods to characterize the electrodes ...................................................................... 39
5 RESULTS .............................................................................................................. 42 5.1 RPE FUNCTIONALITY WITH EIS .................................................................................................... 42
5.1.1 hESC-RPE and ARPE-19 cells ........................................................................................ 42

vi
5.1.2 hESC-RPE cells in different stages of maturity ............................................................. 43 5.2 RPE FUNCTIONALITY SHOWN WITH ERG AND RETINA-RPE CO-CULTURE ............................................ 45
5.2.1 ERG measurements from retina alone ........................................................................ 45 5.2.2 ERG measurements from the retina and RPE .............................................................. 46
5.3 COMPARISON OF ELECTRODE MATERIALS USED IN RETINAL IMPLANTS ................................................ 48
6 DISCUSSION ......................................................................................................... 51 6.1 ERG ....................................................................................................................................... 51 6.2 EIS TO TEST RPE FUNCTIONALITY ................................................................................................ 53
6.2.1 EIS in the follow-up of the cell differentiation and maturation ................................... 53 6.2.2 EIS as a fixed part of the cell differentiation environment .......................................... 55
6.3 INCREASING RESOLUTION OF RETINAL IMPLANTS ............................................................................ 56
7 CONCLUSIONS ..................................................................................................... 60
8 REFERENCES ........................................................................................................ 62
9 ORIGINAL PUBLICATIONS ..................................................................................... 75

vii
LIST OF ORIGINAL PUBLICATIONS
This thesis is based on the following publications, referred to in the text by Roman numerals.
I. Onnela N, Savolainen V, Juuti-Uusitalo K, Vaajasaari H, Skottman H, Hyttinen J. Electric impedance of human embryonic stem cell derived retinal pigment epithelium. Medical & Biological Engineering & Computing, 50(2):107-116, 2011.
II. Savolainen V, Juuti-Uusitalo K, Onnela N, Vaajasaari H, Narkilahti S, Suuronen R, Skottman H, Hyttinen J. Impedance spectroscopy in monitoring the maturation of stem cell-derived retinal pigment epithelium. Annals of Biomedical Engineering, 39(12):3055-3069, 2011.
III. Onnela N, Takeshita H, Kaiho Y, Kojima T, Kobayashi R, Tanaka T, Hyttinen J. Comparison of electrode materials for the use of retinal prosthesis. Bio-Medical Materials and Engineering, 21(2):83-97, 2011.

viii
AUTHOR’S CONTRIBUTION
Publications I and II concern the EIS of retinal pigment epithelial cells. Jari Hyttinen originally presented the idea of studying the maturity of RPE cell cultures with EIS measurements. The author has designed the measurement setup used in publications I and II. The author has implemented the EIS method for RPE cells and prepared the results concerning EIS in co-operation with the co-author Virpi Savolainen. The author was the main author to write the publication I, and has participated in the writing of the manuscript of publication II. The idea of studying the correlation between permeability and impedance changes due to the supply of ethylene glycol tetraacetic acid (EGTA), was originally presented by Kati Juuti-Uusitalo. The immunostaining, microscopic evaluation and biological analysis of the cells were carried out by Kati Juuti-Uusitalo [I, II].
Publication III concerns the comparison of the electrical properties of different electrode materials used in retinal prostheses. The author has designed the measurements in co-operation with Professor Tetsu Tanaka from the Medical Nanosystem Engineering Laboratory, Graduate School of Biomedical Engineering, Tohoku University. The author has implemented the experimental measurements, analyzed the results, and has written the paper.
In addition to original articles, this thesis introduces in vitro ERG measurements of retina and RPE. Jari Hyttinen originally presented the idea of studying the functionality of RPE cell cultures by co-culture with retina and ERG measurements. The author has together with Leena Lehtonen, designed and realized the measurement setup for ERG measurements. The author has designed the measurement protocols and tested their capability for functionality testing of hESC-RPE cells. For this part of the research the author has conducted the measurements together with Leena Lehtonen and Mikko Koski, and analysed the signals.

ix
LIST OF ABBREVIATIONS
AC alternating current AFM atomic force microscopy AIROF activated iridium oxide film AMD age-related macular degeneration ARPE-19 immortalized human RPE cell line CPE constant phase element CV cyclic voltammetry DC direct current EGTA ethylene glycol tetraacetic acid EIS electrical impedance spectrometry/spectroscopy/spectra ERG electroretinogram, electroretinography FO fast oscillations GCL ganglion cell layer hESC human embryonic stem cell hESC-RPE human embryonic stem cell-derived retinal pigment epithelium hFF human foreskin fibroblasts INL inner nuclear layer iPS induced pluripotent stem IPL inner plexiform layer KO-DMEM KnockOut Dulbecco’s Modified Eagle Medium KO-SR KnockOut Serum Replacement LED light-emitting diode MEA microelectrode array MSC mesenchymal stem cell NEAA Non-Essential Amino Acid ONL outer nuclear layer OPL outer plexiform layer PDMS polydimethylsiloxane PEDF pigment epithelium-derived factor PET polyethylene terephthalate pH measure of the acidity or basicity of an aqueous solution PLL poly-L-lysine POS photoreceptor outer segments RCS Royal College of Surgeons ROI region of interest RP retinitis pigmentosa RPE retinal pigment epithelium SEM scanning electron microscopy SIROF sputtered iridium oxide film TEP transepithelial potential TER transepithelial resistance TIO tin-doped indium oxide VEGF vascular endothelial growth factor

x
3-D three dimensional

xi
LIST OF SYMBOLS
Ag|AgCl silver/silverchloride Al aluminum Au gold C capacitance Ca,b capacitance of apical/basal membrane of the epithelium Cd diffusion induced capacitance Cdl double layer capacitance Cele capacitance of the electrode Cepi epithelial capacitance CO2 carbon dioxide H2 dihydrogen Ir-b iridium black IrO iridium oxide j imaginary unit JLE lead field of the voltage measurement electrodes JLI lead field of the current feeding electrodes O2 oxygen in its molecular form Pt platinum Pt-b platinum black R resistance Ra,b resistance of apical/basal membrane of the epithelium Rbulk bulk resistance Rd diffusion induced resistance Rele resistance of the electrode Repi epithelial resistance Rpara paracellular resistance Rsub resistance caused by filter support in the cell cultures Rt double layer resistance Rtr transcellular resistance Si silicon ta,b implicit time of a/b-wave Ti titanium TiN titanium nitrate v volume Vmax saturated amplitude of the b-wave sensitivity curve w the weight used in the object function of data fitting ωmax the frequency of the peak of the Nyquist plot semi-circle X reactance 𝛘2 Chi-Square Z complex impedance |Z| impedance magnitude θ phase difference between voltage and current σ conductivity


1
1 INTRODUCTION
There are 285 million visually impaired people worldwide: 39 million are blind and 246 have poor vision (World Health Organization, WHO, 2011). Blindness can result when any step on the optical pathway is damaged: optics, retina, optic nerve, visual cortex, or other cortical area involved in the processing of vision. In developed societies, the main causes of visual impairment are retinal diseases such as age-related macular degeneration (AMD), retinitis pigmentosa (RP), diabetic retinopathy, and glaucoma. Diseases such as RP and AMD cause progressive degeneration of the outer retina: the loss or damage of photoreceptor cells in the retina cause visual impairment. Indeed, about 50% of all blindness is caused by damage to the retina (Zrenner 2002). The aim of this thesis is to develop bioelectric methods and testing systems for novel solutions for retinal repair.
AMD is one of the main causes of blindness (8.7%) in the world, and it is the leading cause of blindness in the elderly (WHO, 2011). Of all the causes of visual impairment worldwide, 78% are avoidable. At present, advanced stage of dry AMD is incurable, and there is no means to prevent the disease. AMD occurs when the macular or central retina develops degenerative lesions. It is thought that a reduction in the blood flow to the macular area also plays a part in the occurrence of the disease. For wet AMD, there are some palliative treatments such as the use of lasers, dynamic phototherapy, and sometimes surgery that appear to retard the progress of the disease. There is also rehabilitative training for those with impaired vision including the availability of bright lighting in living and work spaces and the use of special aids for viewing and computer use (WHO, 2011). Intravitreal vascular endothelial growth factor antagonists are effective in preventing vision loss and may even improve visual acuity in patients with neovascular AMD in the early stage of the disease (Enseleit et al. 2010). However, in advanced cases of exudative and nonexudative AMD, there is no effective cure. There is no cure for RP, but retinal prostheses have been developed to provide artificial vision for RP patients. A defect on the molecular level in some genes causes the vision loss in both AMD and in RP. The signaling pathway of the gene defect is not known as yet and, therefore, it is hard to find the actual mechanism that causes the disease. On a cellular level, the dysfunction of retinal pigment epithelium (RPE) has been shown to lead to either AMD or RP.

Introduction
2
Figure 1-1 Horizontal cross-section of the eye and the cellular structure of the retina.
RPE between the neural retina and choriocapillaris (Figure 1-1) has an important role in the health of the retina. The functions of RPE are light absorption, the epithelial transport of nutrients, the regeneration of visual pigment, the phagocytosis of shed photoreceptor outer segments, and growth factor secretion (Klimanskaya et al. 2004; Strauss 2005). RPE dysfunction plays an important role in the pathogenesis of the early form of dry AMD (Roth et al. 2004).
To prevent eye disease that leads to the degeneration of photoreceptors, the replacement of the RPE and the rehabilitation of the functioning of RPE cells may be sufficient. The potential feasibility of RPE transplantation to prevent photoreceptor loss has been reported in several animal studies and a few human trials (Algvere et al. 1997; Carr et al. 2009; Coffey et al. 2002; da Cruz et al. 2007; Falkner-Radler et al. 2011; Idelson et al. 2009; Li and Turner 1991; Lund et al. 2006; Zhu et al. 2011). In animal studies, human embryonic stem cell-derived RPE (hESC-RPE) cells have been shown to provide a potent cell source for the treatment of retinal diseases (Coffey et al. 2002; Idelson et al. 2009; Lund et al. 2006). Due to their developmental potential and replicative capacity, human embryonic stem cells (hESCs) provide a potent source of donor cells for cell-replacement therapy.
If neuroretinal cells are permanently lost, a retinal implant may be needed. A retinal implant provides artificial vision by electrically stimulating the neuronal cells of the retina (Ahuja et al. 2010; de Balthasar et al. 2008; Chow et al. 2004; Deguchi et al. 2004; Dobelle 2000; Kim et al. 2004; Komiya et al. 2008; Lee et al. 2009; Ohta et al. 2006; Roessler et al. 2009; Salzmann et al. 2007; Schanze et al. 2007; Scribner et al. 2007; Sekirnjak et al. 2006). These cells can still be vital for a few years after the start of the degeneration of photoreceptors (Ahuja et al. 2011; Kolomiets et al. 2008; Santos et al. 1997; Stone et al 1992).
Introduction
3
1.1 Functionality of the hESC-RPE cells
Before the potency of RPE cell replacement therapy to prevent RP or AMD can be clinically investigated, the cell candidates need to be carefully screened in vitro for their functionality. In biology, whole cell biosensing is often performed using optical detection methods including staining and specific labeling by fluorescent protein species (Carr et al. 2009; Defoe et al. 1994; Dunn et al. 1996; Haruta et al. 2004; Kawasaki et al. 2002; Vaajasaari et al. 2011). These methods, however, interfere with cellular pathways and do not leave the cells intact for further use. After visualizing the results of labeling, the cell cultures are most often not suitable for cell replacement treatment anymore. Therefore, there is a need for novel methods to study the functionality and maturity of the cell cultures non-invasively leaving the cells intact for later use in cell replacement therapy.
In a previous study of our collaborators (Vaajasaari et al. 2011), the functionality of the putative RPE cells has been shown by photoreceptor outer segments (POS) phagocytosis, pigment epithelium-derived factor (PEDF) secretion, polarization of cells, and the integrity of the epithelial structure by transepithelial resistance (TER) measurements. All these methods are widely used in the biological field (e.g.: Carr et al. 2009; Defoe et al. 1994; Dunn et al. 1996; Haruta et al. 2004; Kawasaki et al. 2002). These methods work well and give reliable answers about the functionality of the cells. However, the methods are invasive with the exception of TER measurements. In this thesis, the aim is to estimate the functionality and barrier properties of hESC-RPE cells non-invasively by applying an electrical impedance spectroscopy (EIS) measurement to cell culture characterization.
We aim to define the electrical parameters that can be used to non-invasively evaluate RPE cell maturity and barrier properties. For this purpose, we have designed an EIS measurement setup that can be applied to a cell culture insert without moving cells from the filter. In the EIS method, current is applied through the studied tissue and the resulting voltage is measured. Impedance is defined using Ohm’s laws. EIS may reveal the resistive and capacitive properties of the tissue. The resistive properties can be used to evaluate the integrity and the maturity of the cultured epithelium (Jovov et al. 1991; Wegener et al. 1996; Zhu et al. 2011). The capacitive properties describe the morphology of the epithelium (Wegener et al. 1999; 2000). Thus, the EIS measurement transduces some biological interaction into physical parameters. It may also enable the monitoring of cell maturation in real-time. The properties of many epithelial types have been studied using the EIS method (Krug et al. 2009; Lo et al. 1995; Rahman et al. 2009; Reiter et al. 2006; Wegener et al. 2000). However, to our knowledge, the EIS method has not been used before for RPE cell characterization.
We aim to develop a method that enables electroretinograph (ERG) measurements of an in vitro co-culture of hESC-RPE cells and mice retina. The co-culture may be a useful model for investigating RPE cell replacement therapy, and ERG measurements in vitro may give estimates about RPE functionality. We aim to use the ERG signal to show that RPE cells can restore vision or at least improve the visual response of photoreceptors. An ERG signal has waveforms that describe the functioning of different layers of the retina.

Introduction
4
The degeneration of photoreceptors makes ERG measurement impossible. We hypothesize that during in vitro cell culturing, RPE cells could enhance the survival of the vulnerable photoreceptors, as previously shown in many in vivo trials (Carr et al. 2009; Coffey et al. 2002; Da Cruz et al. 2007; Idelson et al. 2009; Lund et al. 2006). A retina cultured together with RPE cells in long-term culture may produce a measurable ERG signal for longer than a retina cultured alone. In vitro ERG may be used to study the functionality of RPE and retina. However, the method is not suitable for functionality screening for the RPE cells intended for transplantation because the RPE cells attach to the retina in vitro and thus are not transplantable after in vitro co-culture. In addition, using xenograft in the co-culture contaminates xeno-free culture conditions used in hESC-RPE cell differentiation at the Institute of Biomedical Technology (Vaajasaari et al. 2011). Thus, the in vitro ERG of RPE and retina may prove to be more suitable method to study drug testing and to do basic research considering the functionality of differentiated RPE cells.
1.2 Artificial vision - retinal implant
A retinal implant can provide artificial vision for blind people who still have intact retinal layers and whose blindness is caused by retinal damage and not by brain injuries or problems with the optic nerve (Ahuja et al. 2011; de Balthasar et al. 2008; Koch et al. 2008; Komiya et al. 2008; Rizzo et al. 2003; Roessler et al. 2009; Zrenner 2008). A retinal implant electrically stimulates the remaining retinal tissues (Figure 1-2). Electrical stimulation requires the creation of complicated subminiature electrode arrays and electrical circuits composed of materials that must be stable and relatively inert. We have to select an electrode material that can produce a high enough stimulus current without causing the electrode to corrode. Stimulation cannot exceed voltage limits that cause irreversible chemical reactions on the electrode-electrolyte interface (Beebe and Rose 1988; Brummer and Turner 1977; Cogan et al. 2009; Roessler et al. 2009; Rose and Robblee 1990). The charge injection capability of the electrode material used has to be high. In addition, the electrode materials also have to be biocompatible in long-term stimulation (Guenther et al. 1999; Mokwa 2003; Schanze et al. 2007). Two retinal implant types might soon become commercially available: Retina Implant AG (Zrenner et al 2008) and Argus II (Ahuja et al. 2011). Thus, artificial vision is on the edge of a technological breakthrough.
Introduction
5
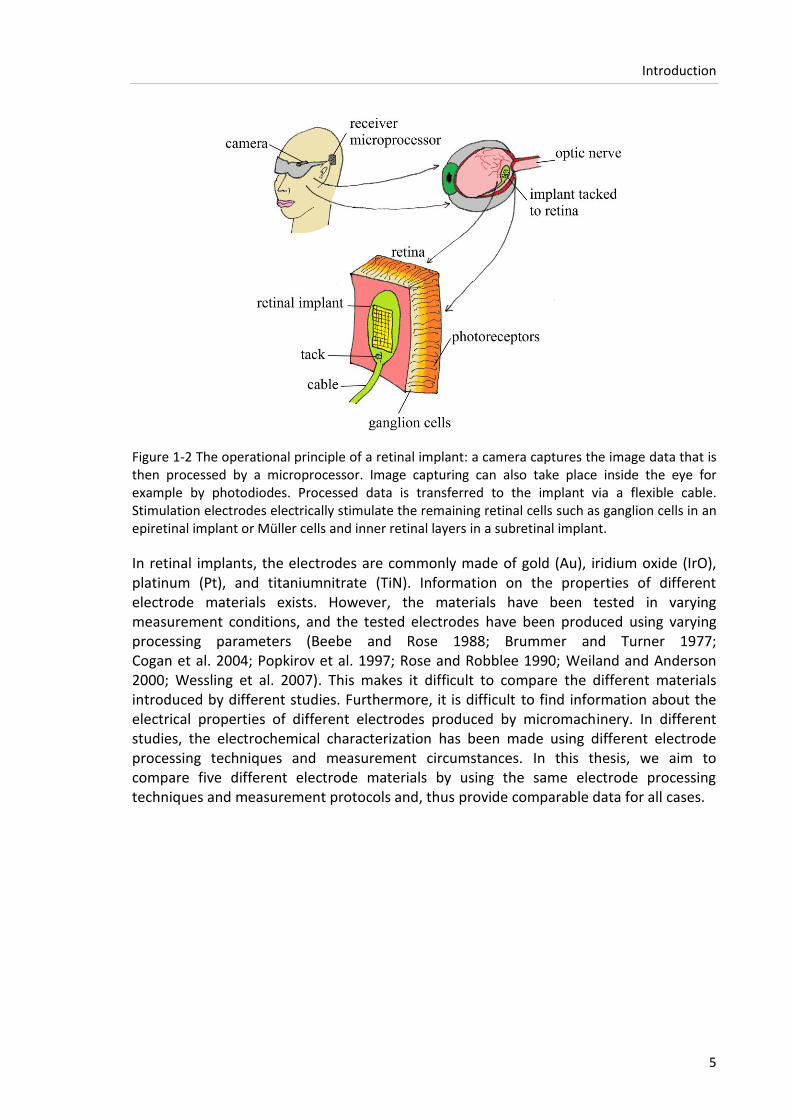
Figure 1-2 The operational principle of a retinal implant: a camera captures the image data that is then processed by a microprocessor. Image capturing can also take place inside the eye for example by photodiodes. Processed data is transferred to the implant via a flexible cable. Stimulation electrodes electrically stimulate the remaining retinal cells such as ganglion cells in an epiretinal implant or Müller cells and inner retinal layers in a subretinal implant.
In retinal implants, the electrodes are commonly made of gold (Au), iridium oxide (IrO), platinum (Pt), and titaniumnitrate (TiN). Information on the properties of different electrode materials exists. However, the materials have been tested in varying measurement conditions, and the tested electrodes have been produced using varying processing parameters (Beebe and Rose 1988; Brummer and Turner 1977; Cogan et al. 2004; Popkirov et al. 1997; Rose and Robblee 1990; Weiland and Anderson 2000; Wessling et al. 2007). This makes it difficult to compare the different materials introduced by different studies. Furthermore, it is difficult to find information about the electrical properties of different electrodes produced by micromachinery. In different studies, the electrochemical characterization has been made using different electrode processing techniques and measurement circumstances. In this thesis, we aim to compare five different electrode materials by using the same electrode processing techniques and measurement protocols and, thus provide comparable data for all cases.

6
2 OBJECTIVES OF THE STUDY
The aim of this thesis was to develop methods and to test protocols for future biological and engineering solutions that can contribute to future methods of retinal repair. Namely, the objectives were to develop bioelectric methods to test the functionality and maturity of hESC-RPE cells and to study the electric characteristics of electrode materials used in retinal implants.
The specific aims of the thesis were as follows:
To find means to estimate the goodness of the cell culture the objectives were to develop and test methods to get information on the barrier properties and the morphology of the RPE cell culture using EIS and to test our hypothesis on the ability of RPE cells to enhance the ERG response of retina.
In Publication I, the aim was to use ARPE-19 cells as an immature control to show the differences in EIS curves measured from mature hESC-RPE or immature ARPE-19 cells. Furthermore, the objective of the study was to introduce the first EIS measurements made for RPE cells.
In Publication II, the aim was to test the efficacy of the EIS method in the separation of the electrical properties of hESC-RPE cells at different stages of maturity. Furthermore, biological permeability assessment was used to validate the EIS data.
One objective of the thesis was to develop a setup that can be used to measure ERG responses from the in vitro co-culture of mouse retina and hESC-RPE cells. The aim was to test whether there are differences between the ERG responses of the co-culture and the retina cultured alone.
In Publication III, the aim was to provide objective data on the electrochemical properties of different electrode materials used in retinal implants. Electrode materials were compared for their impedance response, charge capacity, and surface roughness.

7
3 REVIEW OF THE LITERATURE AND THEORETICAL BACKGROUND
3.1 Retinal Pigment Epithelium (RPE) RPE is a monolayer located between the neural retina and the choriocapillaris at the back of the eye. These highly polarized, densely pigmented RPE cells control the water and ion balance of the eye and provide many essential photoreceptor support functions (Klimanskaya et al. 2004). Among the functions of the RPE are the absorption of scattered light, the transport of nutrients from the vascular choroid, the isomerism of all-trans retinal back to 11-cis retinal, the phagocytosis of photoreceptor outer segments, and growth factor secretion as shown in Figure 3-1 (Dunn et al. 1996; Strauss 2005).
Figure 3-1 RPE functions: On the apical membrane, the RPE has microvilli and tight junctions that connect the cells. The RPE controls ion composition and is responsible for the epithelial transport between the photoreceptors and the choroid on the basolateral side. The RPE secretes vascular endothelial growth factors (VEGF) and PEDF. The RPE re-isomerizes all-trans retinal back into 11-cis retinal and transports it back to the photoreceptors. The RPE takes care of the renewal process of the photoreceptor outer segments.

Review of the literature and theoretical background
8
Epithelial tissues form a controlled barrier and transport ions through the apical and basolateral ion channels. The RPE is part of the blood-retina barrier and controls the molecular transport between retina and choroid. The cell polarity of human RPE emerges in specific membrane transport mechanisms on the apical and basal membranes. There are a variety of pumps, co-transporters, and exchangers on both membranes that transport the ions (Quinn and Miller 1992). Polarized ion transport leads to a different distribution of positive and negative charges across the cell membrane that generates transepithelial potential (TEP) (Sherwood 2004). For human RPE, the TEP has been measured to be 1.9 ± 0.6 mV (Quinn and Miller 1992). RPE has high paracellular resistance that is formed by tight junctions that establish a barrier between the subretinal space and the choriocapillaris (Rizzolo 2007). The formation of tight junctions is a necessity for high transepithelial resistance. TER values measured from in vitro cultured human fetal RPE vary depending on the study: 330 ± 80 Ωcm2 (Frambach et al. 1990), 444 ± 65 Ωcm2 (Rajasekaran et al. 2003), and 501 ± 138 Ωcm2 (Maminishkis et al. 2006).
The microvilli of RPE cells penetrate between the photoreceptors and help the phagocytosis of the outer shed segments of the photoreceptors. The tight, sheath-like structure between the photoreceptors and microvilli may help to keep the retina adherent to the wall of the eye. The interaction between the RPE, photoreceptors, and choroid relies on extracellular matrices on both sides of the RPE. Active metabolism supports the retinal adhesion. (Marmor 1983; Wimmers et al. 2007) The RPE enables the visual cycle by isomerizing the all-trans retinal back to 11-cis retinal (Strauss 2005). The recovery of photoreceptors from photopigment bleaching is impossible without the presence of a functional RPE. Thus, the adaptation from intense light exposure is not possible for isolated retina alone without the RPE.
3.1.1 RPE cell models
Recently, many research groups have cultured RPE cells in vitro (Carr et al. 2009; Defoe et al. 1994; Dunn et al. 1996; Frambach et al. 1990; Joseph and Miller 1991; Maminishkis et al., 2006; Nevala et al. 2008; Quinn and Miller 1992; Vaajasaari et al. 2011). The aim has been to study the properties of RPE cells (Defoe et al. 1994; Frambach et al. 1990; Joseph and Miller 1991; Nevala et al. 2008; Rizzolo 2007), to develop models that can be used for drug testing (Rajasekaran et al. 2003) or for the study of certain eye diseases. There has also been interest in the development of cell sources for cell transplantation and eye disease rehabilitation (Carr et al. 2009; Coffey et al. 2002; da Cruz et al. 2007; Lund et al. 2006; Vaajasaari et al. 2011).
Different cell lines and RPE types have been used, and the different cell models each have their own benefits and drawbacks. Human fetal (Maminishkis et al. 2006) or donor RPEs (Quinn and Miller 1992) cultured in vitro are one branch of the RPE models. ARPE-19 (Dunn et al. 1996) is an immortalized human RPE cell line that is widely used all over the world (Hornof et al. 2005; Nevala et al. 2008). ARPE-19 cell line arose spontaneously in the laboratory of Dunn et al. (1996) from a primary culture of RPE cells from a male donor. The highly epithelial morphology of these cells and their rapid rate of proliferation distinguished them from other primary RPE cultures (Dunn et al. 1996). It is common for

Review of the literature and theoretical background
9
differentiated cells to lose their specialized properties after multiple passages, and thus primary cultures have been commonly used for RPE research (Dunn et al. 1996). Furthermore, hESC-RPE cells have been shown to be superior to other widely used cell line models such as ARPE-19, at least in comparisons of gene expression (Klimanskaya et al. 2004). ARPE-19 cells have had clearly lower TER values than human fetal RPE (ARPE-19: Dunn et al. 1996; Mannermaa et al. 2010; Nevala et al. 2008; Toimela et al. 2004, human fetal RPE: Frambach et al. 1990; Maminishkis et al. 2006; Rajasekaran et al. 2003). The TER values for human fetal RPE vary between 300 and 500 Ωcm2 (Frambach et al. 1990; Maminishkis et al. 2006; Rajasekaran et al. 2003), whereas TER values measured for ARPE-19 are < 40 Ωcm2 (Nevala et al. 2008), 81-95 Ωcm2 (Mannermaa et al. 2010), 50-100 Ωcm2 (Dunn et al. 1996), and 116 ± 57 Ωcm2 (Toimela et al. 2004). The reason for low TER might be the absence of differentiated properties or, as Dunn et al (1996) have supposed, more likely the heterogeneity of the ARPE-19 line.
Induced pluripotent stem (iPS) cells are based on an innovative technology that turns somatic cells into embryonic stem-like cells with pluripotency via the transduction of several key genes (Carr et al. 2009). RPE cells derived from the iPS cells of patients suffering from eye disease will be good candidates as a cell source for transplantation, since transplanted iPS-derived cells are supposed to avoid immune rejection. However, the generation of iPS cells may involve gene transfer that has not been fully studied. One obstacle to the generation of transplantable RPE is that the differentiation of stem cells into RPE cells using present methods is spontaneous (Vaajasaari et al. 2011) and the differentiation process is slow (Gearhart 2004). Thus, using the patients’ own iPS cells as a source would lead to long waiting times before the RPE cells are usable. If there are enough hESCs available, hESC-RPE cells can be cultured so that they are always available. With the present differentiation methods, however, the number of hESC-RPE cell grafts that are available for research is limited. In many countries, laws and ethics do not approve of the use of embryonics in research and this may slow down the development of differentiation methods.
Embryonic stem cells can be used to differentiate RPE cells (Haruta et al. 2004; Idelson et al. 2009; Klimanskaya et al. 2004; Vaajasaari et al. 2011). Embryonic stem cells are derived from the inner cell mass of blastocysts. Thomson et al. first reported the derivation of human embryonic stem cells in 1998. Human embryonic stem cells are obtained from surplus embryos that cannot be used in the infertility treatment of donating couples (Vaajasaari et al. 2011). Isolated cell masses are cultured in culture medium with growth factors on feeder cell layers that are often derived from other species (Gearhart 2004). The use of other species in the cell differentiation raises the threat of interspecies transfer of viruses (Gearhart 2004). However, at least Vaajasaari et al. (2011) have shown that RPE-like cells can be differentiated from hESCs in the xeno-free culture conditions that are mandatory for production of these cells for clinical use.
3.1.2 Assessing the RPE functionality
At present, RPE cells are evaluated based on their pigmentation, immunocytochemistry, morphology (polygonal shape), and the prevalence of known RPE markers such as RPE65

Review of the literature and theoretical background
10
and CRALB (Dunn et al. 1996; Vaajasaari et al. 2011). Optical detection methods include staining and specific labeling by fluorescent protein species (Carr et al. 2009; Defoe et al. 1994; Dunn et al. 1996; Haruta et al. 2004; Kawasaki et al. 2002; Vaajasaari et al. 2011). Fagocytosis of POS (Carr et al. 2009; Vaajasaari et al. 2011) is used to show that RPE cells are functional. Furthermore, the functionality of the RPE cells has been shown by PEDF secretion (Sonoda et al. 2010; Vaajasaari et al. 2011), polarization of cells (Dunn et al. 1996; Sonoda et al. 2010; Vaajasaari et al. 2011), and paracellular permeability is used to assess the RPE cell cultures (Dunn et al. 1996). These methods work well, but do not leave the cells intact for further use in transplantation. In addition, these methods do not measure the electrical barrier function of the epithelium or the operation of the visual cycle. Thus, we need to develop novel methods to evaluate the goodness of the differentiated RPE cell cultures.
For the assessment of epithelia, TER has been used to evaluate the epithelial tightness and polarity (Sonoda et al. 2010; Wegener et al. 1996; Zhu et al. 2011) and to provide information about the confluence of the cultured cell layer (Jovov et al. 1991). In previous studies, it has been shown that human RPE having TER levels above 300 Ωcm2 are functionally mature RPE cells (Sonoda et al. 2009; Zhu et al. 2011). In addition, the hESC-RPE cells differentiated from the Regea 08/023 (Skottman 2009) cell line are shown to express the markers of mature RPE when TER levels are above 300 Ωcm2 (Vaajasaari et al. 2011). Furthermore, specific morphological properties indicate the polarized nature of RPE. For example, RPE has basolateral infolding, microvilli that are growing on the apical membrane, and tight junctions connect the apical side of the cells (Dunn et al. 1996).
3.2 Electroretinogram (ERG)
ERG is a signal that is produced in the retinal part of the eye by different cellular events. ERG is normally measured with an electrode in contact with the corneal surface (Oakley 1977; Wu et al. 2004) and a reference electrode attached to the other eye or, for example, to the body of the patient. The signal is presented so that a positive peak represents a positive charge difference towards the cornea. The source of ERG signal, i.e. retina, was found by Holmgren and by Dewar and McKendrick at the end of 19th century. Einthoven and Jolly named the wave-forms of a typical ERG curve with letters from a to d that are still in use today. Ragnar Granit made a detailed analysis of the components of ERG in cats using different levels of anesthesia (Granit 1933). (Heckenlively and Arden 2006)
The development of stimulation, recording, and analysis protocols has enabled the evaluation of the functional properties of different retinal cell types (Wu et al. 2004). Light entering the photoreceptors (rods and cones) starts a process known as phototransduction. In transduction, the carotenoid chromophore is isomerized into cis-trans, and this leads to a change in the membrane potential of the cell, i.e. photoreceptors hyperpolarize. The photoreceptors are connected with horizontal and bipolar cells. Horizontal cells inhibit the neighboring receptor cells and, thus, enhance the contrast. The bipolar cells are activated by both hyper-polarization and depolarization depending on the way they react to a specific kind of light stimulus. The bipolar cells are

Review of the literature and theoretical background
11
connected to ganglion cells. Amacrine cells regulate the sensitivity of the transmission from the bipolar to the ganglion cells to suitable levels depending on previous light levels. The retinal network enables the processing of different stimuli in parallel. The ganglion cells interpret the messages from the rods and cones, transform the signal into action potentials, form the optic nerve, and transfer visual data to the brain. There are parallel channels that send the messages such as light onset and offset, resolution, illumination changes, and slow motion in certain directions to the visual cortex. (Kaufman and Alm 2003; Malmivuo and Plonsey 1995)
3.2.1 ERG wave forms
The typical features of an ERG signal measured after a light stimulus are a cornea-negative a-wave (originates in the photoreceptors) and a cornea-positive b-wave (originates in the inner retina) (Figure 3-2). Oscillatory potentials may be seen in the rising phase of the b-wave when a bright light is used as a stimulus. A- and b-waves are followed within a few seconds by another cornea-positive c-wave that is a sum of the positive wave produced by K+ ion flow into the apical membrane of the pigment epithelium (hyper-polarization of the apical membrane of the RPE) and a slow negative wave caused by Müller cells. The c-wave is followed by fast oscillations (FO) in a few minutes. The FOs have negative polarity that is mainly caused by the hyper-polarization of the basal membrane of the RPE. The FOs terminate the c-wave in ERG, and they are too slow to be recorded with standard ERG (Kaufman and Alm 2003; Marmor 1983; Wu et al. 2004)
The light stimulus intensity, color of the light, stimulus duration, and the interval between two stimuli all have a great influence on the measured ERG signal. The shape of the ERG response depends on the stimulus conditions, the state of the retina's adaptation, and the species (Marmor 1983; Wu et al. 2004). The basic waveforms represented in the upper figure in Figure 3-2 can be obtained from a healthy object by using full-field stimulation and stimulation with bright light flash. The use of different kinds of stimuli affects the components that can be achieved in ERG measurement. For example, early receptor potential is generated in the photoreceptors, and its amplitude depends directly on the stimulus intensity. Oscillatory potentials may be seen when a bright light stimulus is used. Prolonged stimulus duration may lead to a d-wave appearance. With short stimulus duration, the d-wave may blend with the b-wave. Scotopic threshold responses are recordable when using a very dim light stimulus for a dark-adapted retina. (Kolb et al. 2012)

Review of the literature and theoretical background
12
Figure 3-2 Typical features of an ERG signal. Above: the main components of ERG, such as a-, b-, and c-waves, are followed by FOs and a light peak. Below: RPE responses are lost when measuring the ERG from the isolated retina alone without the presence of the RPE. Only a- and b-waves and oscillatory potentials are measurable. Amplitudes and implicit times of a- and b-peaks (ta, tb) can be analysed from the ERG signal.
The b-wave is the most studied ERG component because of its great value in the clinical and experimental analysis of retinal functionality. The b-wave sensitivity curve plots the b-wave amplitude against the logarithmic luminance. From the curve, parameters such as saturated amplitude (Vmax) and luminance inducing amplitude of Vmax/2 can be determined (Cia et al. 2011; Ranchon et al. 1999). A b-wave sensitivity curve can be used to compare ERG responses measured from different groups of animals. Cia et al. (2011) studied the in vitro effects of bevacizumab (inhibits VEGF secretion and, thus slows the abnormal growth of blood vessels in wet AMD) on the ERG. They used the b-wave sensitivity curve to compare the exposed and control groups. They concluded that bevacizumab had no in vitro toxic effects since they found no significant differences in the survival curves of the b-wave. As for Ranchon et al. (1999), they studied the functional protective effect of a synthetic and a natural antioxidant against light-induced retinal degeneration. The differences that they found between control and treated groups after 24 hours of light exposure were as follows: in the untreated group, b-wave sensitivity curve collapsed and Vmax was reduced by a half on the first day after light exposure, and in the treated groups, the values of Vmax were not significantly changed.

Review of the literature and theoretical background
13
3.2.2 Estimating the functionality of retina and RPE using ERG
A positive c-wave originating in the RPE could be used to test the functioning of the RPE (Marmor 1983). There are, however, some difficulties such as the fact that the c-wave is a sum of two different electrical features of the cells and c-waves vary from one person to another. In addition, one person can have a variety of different c-wave amplitudes depending on, for example, the repetition times of the light impulses and the background illumination. Due to technical difficulties, the recording of the c-wave has not been widely used in mouse ERG studies (Nusinowitz et al. 2002). In response to light, RPE generates FOs and a light peak. These potentials provide information about RPE function and how it may be altered by disease or experimental manipulation (Wu et al. 2004). Thus, measuring and analyzing the major ERG components might give us a means to evaluate the success of RPE cell transplantation.
ERG measurements have been used to estimate the function of the retina in humans and in animals. Normally, ERG measurements are measured in vivo using electrodes on the cornea. In this case, measured ERGs express the function of the whole retina with all the neural layers and summated responses from different parts of the retina. In in vitro conditions many ERG wave forms are not measurable if the retina is detached from the eyecup. For example, RPE related signal wave forms are missed. The first question concerning the functionality testing of RPE with ERG in vitro is whether it is possible to reattach a retina detached from RPE and regain the functionality of the retina together with the RPE. The results of a study by Monaim et al. (2005) have shown that when both detachment and reattachment are carefully made, retinal functionality recovers quite well in toad retina: light microscopy revealed a renewed contact between the retina and RPE, and ERG studies showed that after 10 h the sensitivity of the b- and c-waves recovered fully even though it was significantly reduced immediately after the detachment and reattachment. After 10 h, the amplitudes of the b- and c-waves were only partially recovered. Monaim et al. (2005) made their studies with the retina and RPE of the same animal and species, but, as many researchers have shown, the photoreceptor survival can also be enhanced by using RPE cells differentiated from the pluripotent cells of a different animal other than the host (Haruta et al. 2004; Idelson et al. 2009; Inoue et al. 2007; Lund et al. 2006).
Haruta et al. (2004) transplanted the embryonic stem cell-derived RPE cells of a cynomolgus monkey into the subretinal space of an animal model of retinal disease, the Royal College of Surgeons (RCS) rats, in which photoreceptor loss was caused by a defect in the adjacent retinal pigment epithelium. They concluded that a monkey’s embryonic stem cell-derived RPE cells enhanced the survival of the photoreceptors of the host. They confirmed the effects of the transplanted RPE cells by histological analyses and behavioral tests. Furthermore, Lund et al. (2006) showed that hESC-RPE cells were capable of extensive photoreceptor rescue in RCS rat. Inoue et al. (2007) assessed the effect of bone marrow mesenchymal stem cell (MSC) transplantation on the retinal function of RCS rats by in vivo ERG. They showed that the ERGs were better preserved in the MSC-treated eyes than in the controls eyes. Idelson et al. (2009) transplanted hESC-RPE into RCS rat and showed by means of in vivo ERG measurements that the mean b-wave amplitudes in

Review of the literature and theoretical background
14
a full-field ERG response were significantly higher in transplanted eyes as compared with groups of control eyes Figure 3-3.
Figure 3-3 Transplanted hESC-RPE cells provide functional rescue in the RCS rat model of retinal degeneration. a) Representative full-field ERG responses to a series of white flashes of increasing intensity. b) Mean b-wave amplitudes in response to white flashes of increasing intensity. Transplanted eyes have significantly (p < 0.05) higher amplitudes when compared with groups of control eyes above 0.048 cds/m2 intensity. [Reprinted from Cell Stem Cell, vol. 5 issue 4, 2009, Idelson et al.,
Directed Differentiation of Human Embryonic Stem Cells into Functional Retinal Pigment Epithelium Cells, pages 396-408, copyright (2012) with permission from Elsevier.]
Ex vivo or in vitro measurement of the retina using a microelectrode array (MEA) enables the direct detection of the focal activities of the retina (Homma et al. 2009). MEA has a dense array of tiny electrodes (10-90μm wide electrodes with varying separation). Retina is placed on the MEA and, due to small size of the electrodes, they can also measure the local electrical activities of the retina with high spatial resolution. Extracellular recording with MEA offers a non-invasive method for monitoring the electrical functioning of in vitro cell cultures. Local cell activations and potential changes between the electrodes located both on the basal and apical membranes of retina are measured. The measured field potentials are amplified, and information on the functioning of the cell culture is derived from an analysis. The parameters that can be studied are, for example, peak amplitude, duration, implicit time, and the shape of a- and b- or other waves of the ERG.
3.3 Electrical impedance spectroscopy (EIS)
Based on AC measurements, Hermann Müller found the capacitive properties of tissue and the anisotrophy of muscle conductance during the 1870s. In 1873, James Clerk Maxwell calculated the resistance of the homogeneous suspension of spheres as a function of the volume concentration of the spheres. This mathematical model is still used today for cell suspensions and tissues. Rudolf Hoeber discovered that the conductivity of blood was frequency dependent (1911). In 1921, Philippson measured tissue impedance as a function of frequency. Gildemeister found the constant phase character of tissue in the late 1920s. (Grimnes and Martinsen 2008)
The Cole brothers contributed to the analytical and mathematical treatment of tissue immittivity and permittivity. In 1928, Kenneth S. Cole introduced the constant phase

Review of the literature and theoretical background
15
element (CPE), and he introduced an electric equivalent circuit with two resistors and a capacitor describing extra/intracellular liquids and cell membranes. In 1929, Debye deduced the Debye equation that describes a complex permittivity. In 1932, K.S. Cole discovered the similarity of the impedance data between tissue or cell suspensions and polarization on metal-electrolyte interphases. In 1940, he presented the famous Cole equation that gave mathematical expression to the impedance dispersion corresponding to the circular arc found experimentally. The Cole brothers used the concepts of dielectrics, Debye- and relaxation-theory, and dispersion. The Cole-Cole function describes di-electric relaxation characterized by a distribution of relaxation times (1941-42). Hermann Paul Schwan revealed for the first time the frequency dependence of muscle tissue capacitance (1950). Schwan described the α-dispersion in muscle tissue (1954) and introduced the α, β and γ classification of the dispersion of biological impedance (1957). In the beginning, impedance spectroscopy was mainly used to study the body composition and water content of the human body. (Grimnes and Martinsen 2008 pp. 441-418)
Since then, EIS has been increasingly used in cell and epithelium research (for example: Gitter et al. 1997; Jovov et al. 1991; Krug et al. 2009; Schifferdecker and Frömter 1978; Wegener et al. 2000). Gitter et al. (1997) used an Ussing chamber for the high-frequency transmural impedance analysis of several epithealial tissues. Jovov et al. (1991) assessed the confluence of epithelial cell culture using spectroscopic methods. Wegener et al. (1996, 1999, 2000) have cultured epithelia on gold electrodes and studied, for example, the barrier properties of porcine choroid plexus epithelial cells, epithelial and endothelial monolayers, and bovine aortic endothelial cells. EIS may show features that are not detectable with conventional biological methods. For example, Sörensen (2007) showed that frequency impedance sensing was able to visualise processes that were beyond the scope of optical microscopy. He exposed ovarian cancer cells to photoactivation that caused cell deaths. The cell deaths were not visually detectable, but photoactivation induced a strong impedance magnitude decrease. The decrease in impedance magnitude was due to an increase in intercellular space and, thus, due to cell damage. The definition of the pathogenesis on the cellular level, however, always requires other methods in addition to EIS.
Impedance spectroscopy can be used for the electrochemical characterization of materials. The method exploits electrically conducting electrodes. An electrical voltage (or current) stimulus is applied through the studied bulk material and, as a response, the resulting current passing through the material (or voltage between the current feeding electrodes) is measured. Using Ohm’s laws, the resulting impedance can be calculated from the ratio of the voltage to the current. The stimulus pattern that is applied through the measured material can vary. Often a small-amplitude alternating current (AC) is used. The frequency of the stimuli can be changed to cover a wide range of frequencies. The impedance response changes due to the changes of frequency and the impedance spectra bring out differences between the materials. For example, the resistivity of two different materials can be similar, but the capacitive properties vary. (Grimnes and Martinsen 2008)

Review of the literature and theoretical background
16
Complex impedance (Z) can be represented using polar or Cartesian forms that are respectively:
(1)
(2)
The polar form consists of the impedance magnitude |Z| that represents the ratio of the voltage to current amplitudes, phase difference between voltage and current (𝜃), and the imaginary unit j. The parameters of the polar form are used when the measured impedance spectrum is introduced using a Bode plot. A Bode plot shows phase angle and impedance magnitude plotted against frequency. A Nyquist plot depicts the imaginary part, reactance X, versus the real part, resistance R, of the impedance. Thus, the Nyquist plot uses the Cartesian form of the complex impedance. (Grimnes and Martinsen 2008)
3.3.1 Bioimpedance
An AC current is used for bioelectrical impedance analysis because it penetrates the body at low voltage levels. The impedance of biological tissue varies according to the frequency of the measurement current: the impedance magnitude of a tissue decreases at high frequencies in three main steps known as the α, β and γ dispersions (Figure 3-4) (Gabriel et al. 1996). The dispersions are related to defined relaxation mechanisms and to defined frequency ranges. The frequency ranges can vary between different tissue types, and clearly separated single dispersions such as in Figure 3-4 can be found with cell suspensions. In tissue, however, the dispersion regions may be broader and overlap. (Grimnes and Martinsen 2008)
At low frequencies, the bioelectrical current travels primarily through extracellular fluids and current must pass between the cells. Depending on the barrier properties of the membrane, i.e. how tight the cell-to-cell attachments are, the current opposing strength of the membrane can vary. As the frequency increases, the α dispersion at a frequency range of mHz – kHz starts to have an effect and the current starts to penetrate body tissues creating reactance. The low frequency α-dispersion is associated with ionic diffusion effects near the membrane surfaces, active cell membrane effects and gated channels, intracellular structures, and dielectric losses. The β dispersion, at the frequency range of 0.001-100 MHz, arises from the charging of the membrane capacitance (Foster et al. 2002; Gabriel et al. 1996). Other contributions to the β dispersion come from the polarization of protein and other organic macromolecules, intracellular organelle membranes, and from Maxwell-Wegner effects. At the β dispersion range, the bioelectrical current is assumed to penetrate all conductive body tissues. Capacitive properties of the body are overcome reducing reactance to zero. The γ dispersion, at the frequency range of 0.1-100 GHz, is due to the dipolar mechanisms in water molecules, salts, and proteins. (Gabriel et al. 1996; Grimnes and Martinsen 2008)

Review of the literature and theoretical background
17
Figure 3-4 Impedance magnitude of biological tissue decreases in three steps: α, β and γ dispersions. The graph is only representative, and in real tissue the dispersion regions can be of a different size. [Modified from Foster 2002]
Epithelial monolayers have previously been modeled in the simplest way by an equivalent electrical circuit that discriminates between epithelial resistance (Repi), capacitance (Cepi) (Figure 3-5), and Rsub caused by filter support in the cell cultures (Gitter et al. 1997). The Repi can be divided into paracellular (Rpara) and transcellular (Rtr) resistance (Krug et al. 2009). To be able to separate para- and transcellular resistances, the ion diffusion in the other electrical pathway must be blocked, and the one resistive element must be measured separately. At low frequencies, current passes between the cells and, thus in an equivalent circuit (Figure 3-5) the current takes the path Rpara. Cell interior contributes only slightly to the flow of current. At higher frequencies, the membrane capacitance allows the current to pass and it penetrates into the cells and flows everywhere according to local ionic conductivity. In the equivalent circuit (Figure 3-5), the current takes, in addition to Rpara, also the paths Cepi and Rtr. (Grimnes and Martinsen 2008)
Figure 3-5 Equivalent electrical circuits for epithelial monolayer. From left to right, the model becomes more detailed. In the circuit on the right, the Ca and Cb represent capacitances and the Ra Rb the resistances of apical and basal membranes respectively. Other symbols are introduced in the text.
Apical and basal sides or other distinct epithelia features may have their own electrical equivalent circuits (Figure 3-5), (Joseph and Miller 1991; Quinn and Miller 1992; Schifferdecker and Frömter 1978) which may be discriminated in the impedance spectra.

Review of the literature and theoretical background
18
To solve the parameters representing the barrier properties of apical and basal sides separately, intracellular measurements, such as an electrode penetrating into the trans-cellular space, can be used in impedance measurements. If the time constants of the two separate pathways e.g. apical and basolateral sides differ enough, EIS has the ability to show two separate declines as the frequency increases (Grimnes and Martinsen 2008).
Furthermore, there exist more detailed models for epithelia in which different cell types may be in different stage of maturity and, thus may have their own resistance/capacitance (RC) circuits, and the adjacent cells are connected with resistors that represent the functioning of gap junctions (Gitter et al. 1997). Theoretically, different cell parts and each ion channel can be modeled separately. Microelectrodes inside the cells and further patch clamping would enable us to measure the apical and basal parts separately or even individual ion channels (Quinn and Miller 1992). However, the measurement would then be no longer non-invasive. The measurement set-up introduced in this thesis is for a macro-scale measurement that represents the properties of the whole cell layer, and the set-up is designed for non-invasive follow up of the cells.
Epithelium can be electrically described using two quantities: TER and electric capacitance. TER gives estimates about the epithelial tightness (Wegener et al. 1996; Zhu et al. 2011) and provides information about the confluence of the cultured-cell layer (Jovov et al. 1991). The cell layer capacitance, C, is considered to represent mainly the membrane surface area: capacitance correlates to the amount of protrusions of the cell membrane, such as microvilli (Wegener et al. 1999; 2000). R establishes the cell layer’s bulk barrier function. The EIS provides information about both TER and the capacitive properties of the cell layer. Electrical parameters, i.e. the electrical properties of the investigated system are modeled from the measured experimental data. An electrical equivalent circuit that describes the resistive, capacitive or inductive properties of the system is developed. The parameter values of the equivalent circuit are obtained by data fitting.
3.3.2 Data fitting
In this thesis, the ZView program (Scribner Associates, Inc., NC USA) is used for data fitting. The ZView program uses complex nonlinear least squares fitting program (LEVM version 6.0, Macdonald 2011, 1969) that is based on the Levenberg-Marquardt algorithm (Marquardt 1963). The aim of the complez nonlinear least squares fitting procedures is to find a set of parameters x which will minimize the weighted sum of squares:
∑ ( )
(3)
The sum is taken over 1...m, where m is the total number of data points. wi is the weight associated with the ith point, yi is the ith data point value to be fitted, and f(x)i is the corresponding value of the calculated fitting function involving the set of parameters x (the size of the vector x depends on the number of electrical parameters in the fitted equivalent circuit model). Data weighting effects how much emphasis is applied to different portions of the data. LEVM provides a large variety of ways of computing wi. In

Review of the literature and theoretical background
19
this study data weighting was used where the weight of each data point is normalized by its magnitude (Macdonald 2011):
(4)
Equivalent circuit modeling works by an iterative process. The fitting is usually started with initial estimates of the values of circuit parameters. The spectra of the model is repeatedly calculated and compared to the original data set. During each iteration, the modeling program alters parameter values slightly to select the values that produce the best match.
There are various methods to estimate reasonable initial values of the parameters of the fitting model. A Nyquist plot can ease the selection of initial values: A semi-circle fit for a Nyquist plot is a geometric fit that requires no initial value estimation. R and C values are based on the assumption that the data really reflects a single parallel RC. A semicircle will be overlaid on the data. The intersections of the semicircle with the x-axis (real axis) are defined. The estimated R is the difference between the higher and lower x-values of the intersections. Thus, the R is the same as the diameter of the semi-circle. The center of the semicircle is described by the real center on the x-axis and the imaginary center on the y-axis. The depression angle shows the angle between the x-axis and a line drawn between the lower intersection and the center of the semicircle. ωmax is the frequency (in radians/s) of the peak of the semi-circle. Estimated C is calculated using the relationship: ωmax =1/RC and depends on the accuracy of ωmax. (ZView™ Operating Manual 2007)
Initial value estimates can be achieved also using the Bode plot. Normally, the fit is performed on only a portion of the data set and small, predefined circuit models are fitted to the selected portion of the data. A full circuit model for the entire data set may be very complicated, but often only a few of the elements are active over a particular frequency range. If the model involves many parameters of uncertain values, it is often useful to keep most of them fixed at feasible values during initial fit exploration. When many parameters are free to vary, the more likely the program is to get stuck at a local (not absolute) minimum of the weighted sum of squares. (Macdonald 2011)
According to the ZView™ Operating Manual (2007), Chi-Square that estimates the goodness of fit is “the square of the standard deviation between the original data and the calculated spectrum”. The Chi-Squared value of the ZView program is the weighted sum of squares (equation 3) divided by the number of degrees of freedom (Johnson 2012). The chi-square can be defined also as follows (Yuan et al. 2010):
∑ ( ( )) ]2 (5)
in which σi is the standard deviation of the ith data point. Weighted sum of squares (equation 3) is another method to evaluate the goodness of the data fitting.
In the ZView program, element error estimates are calculated by testing several solutions near the best fit. All values within the estimated error will fit equally well. For example, if the best value for a particular capacitor is 1.5 µF, the value is increased until the goodness

Review of the literature and theoretical background
20
of fit starts to decrease. If 1.4 and 1.6 µF produce a very similar goodness of fit, but 1.3 and 1.7 µF produce a poorer fit, the error is reported as 0.1 µF. Thus, the error values represent the variation between element values producing a good fit.
3.3.3 Epithelial measurement setups
Impedance spectroscopy has been used in many applications in biology and biomedical engineering such as cell assessment (Arndt et al. 2004; Depaola et al. 2001; Guo et al. 2006) and the assessment of various epithelia (Krug et al. 2009; Lo et al. 1995; Rahman et al. 2009; Reiter et al. 2006; Wegener et al. 1996). The Ussing chamber (Warner Instruments, LLC, Hamden, CT, USA) is a commercial device meant for the electrochemical characterization of epithelium. The device is widely used for the measurements of the ion transport in a monolayer of cells (Frambach et al. 1990; Hongya et al. 2004; Maminishkis et al. 2006; Quinn and Miller 1992). The Ussing chamber consists of two chambers filled with medium, a tissue insert that can be placed between the chambers, current and voltage electrodes in both chambers, and a perfusion system. The electrodes are connected to the tissue through the medium. TER and TEP are normally measured with the Ussing chamber, but EIS is not as yet widely measured using the chamber.
Another technique to connect the electrodes to the tissue is to grow the cells directly on the electrodes. This method combined with EIS is called electric cell-substrate impedance sensing. MEA could serve as the base for cell growth. With the MEA the spatial resolution of the impedance measurement would be increased. A proper cell attachment to the electrodes, however, might require some coating to improve the hydrophilicity and other cell appealing properties of the electrodes. Confluence and cell attachment can be easily followed with this kind of system as transepithelial impedance increases with increasing coverage of the electrodes until a confluent cell layer is reached (Wegener et al. 1996; 2000). In addition, changes in cell shape (Arndt et al. 2004) and micromotion can be followed in real time. Keese et al. (2004) studied wound healing by growing cells on small electrodes. They subjected cells to currents that resulted in severe electroporation and subsequent cell death. After this, the electrode's impedance was monitored to chart the migration and ultimate healing of the wound.
The commercially available TER measurement devices are mainly simple handheld probes with electrodes. For example, the Millicell-ERS voltohmmeter (Millipore, Bedford, MA, USA) is used by Nevala et al. (2008), and Vaajasaari et al. (2011). Nevala et al. evaluated the paracellular ionic permeability of the ARPE-19 cells with the TER measurements, and Vaajasaari et al. studied how the TER changes during the increasing maturity of the hESC-RPE cells. Rajasekaran et al. (2003) studied the effect of Na,K-ATPase inhibition on the tight junction structure and permeability in human RPE cells. They used the EVOM epithelial voltohmmeter (World Precision Instruments, Sarasota, FL, USA) and showed that TER was decreased due to an increase in paracellular shunt conductance. Also Zhu et al. (2011) used the EVOM epithelial voltohmmeter and determined the polarization of the hESC-RPE cells by the formation of functional tight junctions as measured by the TER. These commercial devices are easy to use, but the repeatability or stability of the measurement is user-dependent, as the probe can be freely positioned.
Review of the literature and theoretical background
21
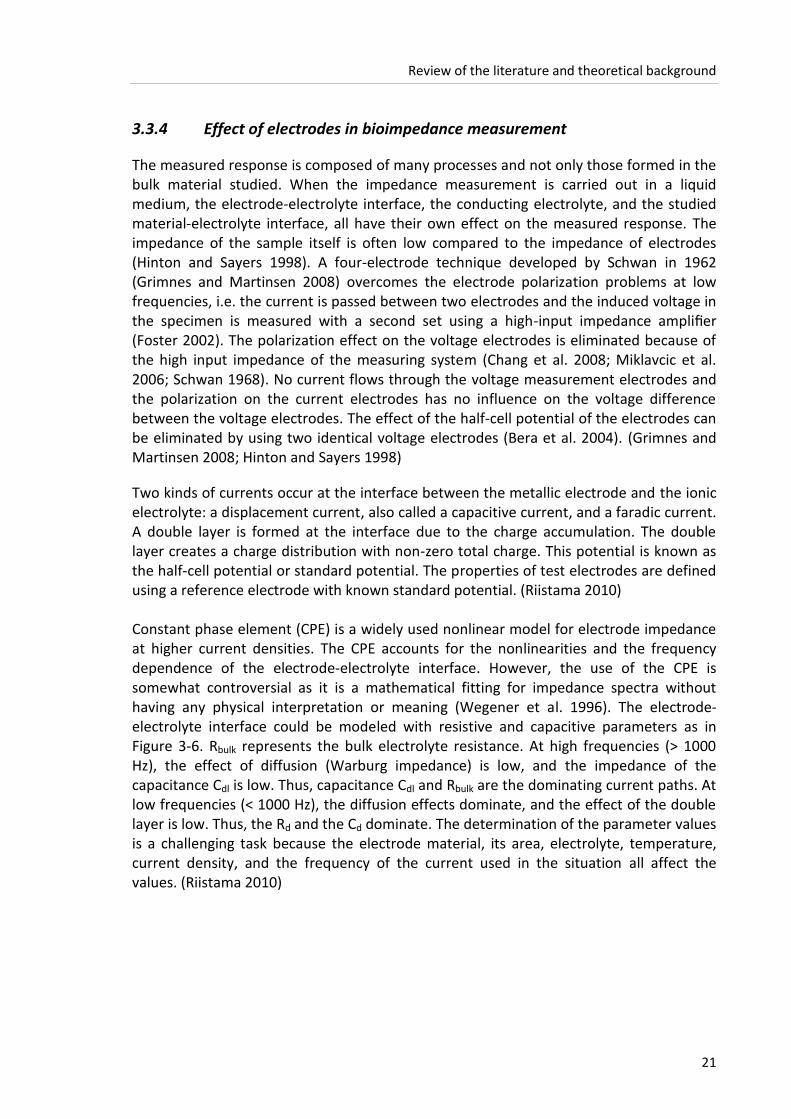
3.3.4 Effect of electrodes in bioimpedance measurement
The measured response is composed of many processes and not only those formed in the bulk material studied. When the impedance measurement is carried out in a liquid medium, the electrode-electrolyte interface, the conducting electrolyte, and the studied material-electrolyte interface, all have their own effect on the measured response. The impedance of the sample itself is often low compared to the impedance of electrodes (Hinton and Sayers 1998). A four-electrode technique developed by Schwan in 1962 (Grimnes and Martinsen 2008) overcomes the electrode polarization problems at low frequencies, i.e. the current is passed between two electrodes and the induced voltage in the specimen is measured with a second set using a high-input impedance amplifier (Foster 2002). The polarization effect on the voltage electrodes is eliminated because of the high input impedance of the measuring system (Chang et al. 2008; Miklavcic et al. 2006; Schwan 1968). No current flows through the voltage measurement electrodes and the polarization on the current electrodes has no influence on the voltage difference between the voltage electrodes. The effect of the half-cell potential of the electrodes can be eliminated by using two identical voltage electrodes (Bera et al. 2004). (Grimnes and Martinsen 2008; Hinton and Sayers 1998)
Two kinds of currents occur at the interface between the metallic electrode and the ionic electrolyte: a displacement current, also called a capacitive current, and a faradic current. A double layer is formed at the interface due to the charge accumulation. The double layer creates a charge distribution with non-zero total charge. This potential is known as the half-cell potential or standard potential. The properties of test electrodes are defined using a reference electrode with known standard potential. (Riistama 2010) Constant phase element (CPE) is a widely used nonlinear model for electrode impedance at higher current densities. The CPE accounts for the nonlinearities and the frequency dependence of the electrode-electrolyte interface. However, the use of the CPE is somewhat controversial as it is a mathematical fitting for impedance spectra without having any physical interpretation or meaning (Wegener et al. 1996). The electrode-electrolyte interface could be modeled with resistive and capacitive parameters as in Figure 3-6. Rbulk represents the bulk electrolyte resistance. At high frequencies (> 1000 Hz), the effect of diffusion (Warburg impedance) is low, and the impedance of the capacitance Cdl is low. Thus, capacitance Cdl and Rbulk are the dominating current paths. At low frequencies (< 1000 Hz), the diffusion effects dominate, and the effect of the double layer is low. Thus, the Rd and the Cd dominate. The determination of the parameter values is a challenging task because the electrode material, its area, electrolyte, temperature, current density, and the frequency of the current used in the situation all affect the values. (Riistama 2010)

Review of the literature and theoretical background
22
Figure 3-6 Electrical equivalent circuit of the electrode-electrolyte interface. Rbulk = electrolyte bulk resistance, Rt = double layer resistance, Cdl = double layer capacitance, Rd, Cd = diffusion induced resistance and capacitance.
3.3.5 Lead field theory concerning impedance measurement
Geselowitz (1971) proved the relationship between the measured impedance changes and the changes in conductivity within a volume conductor using the lead field concept (Malmivuo and Plonsey 1995):
ΔZ= ʃv 1/Δσ *JLE(t0) ∙ JLI(t1) dv (6)
where ΔZ=impedance change [Ω/m3], σ=conductivity [1/Ω*m], JLE=lead field of the voltage measurement electrodes for unit reciprocal current [1/m2], JLI=lead field of the current feeding electrodes for unit current [1/m2], v=volume [m3]. The region v consists of an inhomogeneous volume conductor whose conductivity (as a function of position) at time t0 is σ(t0). At t1, this has changed to σ(t1), and it is this change σ(t1)- σ(t0)=Δσ that is responsible for the measured impedance change. When the current feeding electrodes are different from those of the voltage measurement electrodes, the sensitivity distribution is the dot product of the lead fields of the voltage electrodes JLE and the current electrodes JLI. Thus, the macroscopic resistivity is derived from the spatial distribution of conductivity weighted by the dot product of the lead fields of the current and voltage electrodes. (Malmivuo and Plonsey 1995)
3.4 Retinal Implants
In 1929, Foerster discovered that the electrical stimulation of the occipital pole caused phosphenes for the subject (Foerster 1929). The idea to restore a blind patients’s vision with an electronic prosthetic device was introduced by Tassiker in 1956 (Tassiker 1956). He described how a light-sensitive selenium cell placed behind the retina of a blind patient restored the patient’s ability to see light. Later attempts to restore vision were made by electrodes implanted into the visual cortex of blind patients (Brindley and Lewin 1968; Dobelle and Mladejowski 1974). The results of later human trials with cortical implants have been more promising (Dobelle 2000; Normann et al. 1996; Schmidt 1996). The advantage of cortical stimulation is that it will be beneficial in patients with non-

Review of the literature and theoretical background
23
functioning retina or optic nerves. Spatial resolution may still, however, turn out to be an unsolved problem when using cortical stimulation in vision implants. (Ong and da Cruz 2011; Zrenner 2002)
Taking a different approach, Veraart et al. (1998) stimulated the optic nerve of a blind patient. The patient was able to localize single bright spots of light, but high spatial resolution cannot be expected with such a stimulation arrangement (Veraart et al. 1998; Zrenner 2002). In the 1990s, advances in biomaterials, microfabrication, electronics, and retinal surgery enabled the development of a prosthesis that could be implanted directly into the retina (Guenther et al. 1999; Humayun et al. 1999; Stelzle et al. 2000; Stieglitz et al. 1997; Trieu et al. 1998). (Ong and da Cruz 2011; Zrenner 2002)
Retinal degeneration causes well-documented morphological changes in the outer and inner retina (Humayun et al. 1999). However, after substantial loss of photoreceptors, the functional state of the rescued retinal ganglion cells remains light sensitive (Ahuja et al. 2011; Kolomiets et al. 2008; Santos et al. 1997; Stone et al 1992). Ganglion cells also maintain their basic network properties. Thus, if in RP and AMD the inner retinal layers and ganglion cell layers remain viable, the retinal implant could electrically stimulate the remaining retinal neurons and provide useful vision. To date, a number of human trials and clinical experiments of retinal prostheses have been carried out (de Balthasar et al. 2008; Humayun et al. 1999; Koch et al. 2008; Rizzo et al. 2003; Zrenner et al. 2008).
3.4.1 Epiretinal vs. Subretinal
There are two kinds of retinal implants under development: subretinal (de Balthasar et al. 2008, Chow et al. 2004; Koch et al. 2008; Mokwa 2003; Schanze et al. 2007; Schwiebert et al. 2002; Scribner et al. 2007; Zrenner et al. 2008) and epiretinal (Ahuja et al. 2011; Kim et al. 2004; Lee et al. 2009; Roessler et al. 2009; Salzmann et al. 2007; Stelzle et al. 2000; Wang et al. 2005). The subretinal device is implanted between RPE and the outer layer of the retina. The epiretinal device is implanted onto the innermost layer of the retina that contains the ganglion cells, between the vitreous body and the retina.
Unlike the subretinal implant, the epiretinal implant does not use the remaining network of the retina for information processing. Thus, the epiretinal sensor has to encode visual information as trains of electrical impulses that are then conveyed by the electrode array directly into the axons of ganglion cells, which unite to form the optic nerve. In subretinal implants, it is posited that the retina’s remaining intact neural network is still capable of processing electrical signals. One great advantage of the epiretinal implant is a better ability to dissipate heat, as it is not isolated under tissue (Schwiebert et al. 2002). The stimulation of the retina with current injection dissipates power and heat. This causes the risk that the elevated temperature produced by the electronics could lead to infection. A subretinal implant may also hamper the metabolism between RPE tissue and the remaining cell layers of the retina. In addition, the surgical approach in the vitreous cavity, i.e. in the placement of the epiretinal device is well understood and routine (Ong and da Cruz 2011). The subretinal devices have the advantage that they can use the retina to hold the electrodes in close proximity to the viable retinal cells (Ong and da Cruz 2011).

Review of the literature and theoretical background
24
3.4.2 Fully implantable retinal implant
Normally, a small video camera is placed outside the eye, for example behind the person’s glasses (Ahuja et al. 2011), and it sends a visual signal to a device with multiple electrodes that are implanted. In a fully implantable retinal implant, the image capturing elements are implanted inside the eyeball and no camera outside the eye is needed (Deguchi et al. 2004; Zrenner et al. 2008). The implant can have a three-dimensional (3-D) stacked retinal prosthesis chip that uses 3-D integration technology (Figure 3-7). All the key components are vertically stacked into one chip and completely implanted on the surface of the retina (Deguchi et al. 2004; Motonami et al. 2006).
Figure 3-7 Principle of the 3-D stacked retinal prosthesis chip developed at Tohoku University using 3-D integration technology. Modified from (Motonami et al. 2006 & Deguchi et al. 2004)
By implanting the 3-D stacked retinal prosthesis chip into the eyeball, the patients can employ their own lens and cornea, and can shift a gaze point by moving the eyeball. This leads to high-speed visual information processing by using saccadic effects. The 3-D stacked retinal prosthesis chip has a layered structure similar to a human retina. Thus, information processing can be done inside the eye (Deguchi et al. 2004; Komiya et al. 2008; Motonami et al. 2006). Similarly, in the subretinal implant developed by Zrenner et al. (2008), the wirebound microphotodiode arrays comprise photodiodes, amplifiers, and circuits that adapt the electrical signal to the nerve cells to the strength of the brightness of the object to be seen and its surroundings. The Artificial Silicon Retina implant (Optobionics Corporation) has microphotodiodes that derive energy from incident light

Review of the literature and theoretical background
25
(Ong and da Cruz 2011). Thus, in this device, even the energy source is stacked into the implantable device. EPIRET3 (Roessler et al. 2009) can be implanted completely within the eye and energy and data are provided via an inductive link placed in front of the eye.
3.4.3 Design of the implant
The retinal surface is curved. To obtain a good contact between electrodes and stimulated cells, the implant should be flexible or the structure should be shaped to fit the anatomy of the target organs. Increasing the distance between the stimulation electrodes and the retinal surface reduces the cortical responses achieved by the electrical stimulation of the retina (Kim et al. 2004): an increase of only 50 µm in distance between the fiber electrode and the retinal surface was enough to half the cortical responses of a cat. The dependence of the stimulating threshold on the distance between electrodes and tissue has also been proven in human tests, i.e. distance increases the threshold stimulating currents (Mokwa 2003; Schanze et al. 2007).
Scribner et al. (2007) have realized the spherical, convex shape of the electrode array with microwire glass electrodes: hollow channels are filled with metal and one surface of the glass is polished to a spherical shape consistent with the curvature of the retina. Polymers such as polyimide are widely used as a substrate material to produce flexible retinal implants (Humayun et al. 1999; Roessler et al. 2009; Salzmann et al. 2007; Schanze et al. 2002; Sekirnjak et al. 2006; Zrenner et al. 2008). Flexible material is favored not only because it enables close proximity between the electrodes and the ganglion cells, but also because during surgery a flexible implant can be inserted into the eye in folded form to reduce the size of the surgical wound (Humayun et al. 1999; Roessler et al. 2009).
Trieu et al. (1998) have realized the mechanical flexibility of the retinal prosthesis by applying backside etching of the Si wafer to thin the Si substrate in selected areas, i.e. between the electrodes and the chips: electronic components lay on rigid Si parts that are connected mechanically by flexible Si crosspieces. Stieglitz et al. (1997) used polyimide, but they still tested different geometrical shapes to evaluate the flexibility of the implant design and the handling properties for an implantation in cooperation with retina surgeons. They ended up with a structure of interconnected rings within each other. The curvature shape of the device was realized in a temper step before implantation (Stieglitz et al 1997).
3.4.4 Biocompatibility of retinal implant
Electrode and implant materials have to be biocompatible so that the body does not reject the implant. In long-term implantation, the biocompatibility of any implant has to be carefully considered. The biocompatibility of the materials used in retinal implants has been studied in in vivo and in vitro studies. Polyimide is widely used as a substrate material to produce flexible retinal implants (Kim et al. 2004; Ohta et al. 2006; Roessler et al. 2009; Salzmann et al. 2007; Schanze et al. 2007; Stieglitz et al. 1997; Zrenner et al. 2008) and the biocompatible properties of polyimide have been tested and proven to be good (Kim et al. 2004; Stieglitz et al. 1997). To enhance the biocompatibility of implants,

Review of the literature and theoretical background
26
some groups have encapsulated their retinal prostheses with Parylene C (Koch et al. 2008; Roessler et al. 2009; Schanze et al. 2007), and to avoid the infiltration of water and to encapsulate the electronics in proper shape they have used silicon (Koch et al. 2008; Roessler et al. 2009; Schanze et al. 2007; Trieu et al. 1998). Biocompatible epoxy resin is used to cover the entire retina chip to ensure durability in the biological environment (Ohta et al 2006; Scribner et al. 2007). The cytotoxicity of the implant coatings has been studied. For example, Schanze et al. (2007) have concluded that polydimethylsiloxane (PDMS) Sylgard® 184 exhibited no toxic effects in cytotoxicity testing. They used mouse fibroblast cell line in vitro and investigated vitality, spreading of the cells, DNA-synthesis, and mitochondria activity using different staining techniques and assays.
In retinal implants, the electrodes are continually stressed with stimulation. The current has to be high enough to overpass the threshold to generate the action potential of the target cells. Epi- and subretinal implants may have different threshold values as the target cells are different: ganglion cells in epiretinal implants and Müller cells or inner retinal cell layers in subretinal implants. Still, to induce the required current, voltage limits that cause irreversible chemical reactions of the electrode cannot be exceeded. Implant and electrode material should resist body fluids without the formation of dangerous corrosion products. Pt and Au show good biocompatibility when used for measurement purposes (Campbell and Jones 1992; Robinson and Johnson 1961; Stensaas and Stensaad 1978). In stimulation purposes, Au will easily be corroded due to the high current density at the interface, whereas Pt shows better stimulation capability (Campbell and Jones 1992). Salzmann et al. (2007) studied Pt electrodes on a polyimide substrate in vivo. They implanted the electrodes in the subretinal space of a rat for 1.5 months and detected no fibrous reaction in the vicinity of the implant (Salzmann et al. 2007). Pt electrodes have also been used in blind humans for almost three years for retina stimulation and no evidence of electrode corrosion has been detected (de Balthasar et al. 2008). Ti is a widely used material, for example in pacemakers, and Ti has an excellent compatibility with tissues. Ti forms an oxide layer on the surface that makes the material even more susceptible to corrosion (Campbell and Jones 1992; Dymond et al. 1970; Sul et al. 2001). Trieu et al (1998) implanted retina prosthesis with TiN electrodes epiretinally on a rabbit eye for up to ten months and observed no significant changes in the electrodes. Guenther et al. (1999) evaluated the adhesion and survival of rat retinal cells on different materials of the multi-photodiode array of a subretinal implant. They noticed that cell adherence on plain subtrates was low for all retinal cell types, and thus, the electrodes needed to be pre-coated with poly-L-lysine (PLL) before use. The electrode material TiN seemed to have a reduced biocompatibility. Decreased survival of the cells on TiN was not due to a toxic compound released by the material, but rather to the surface structure of TiN or surface charges that prevented proper coating with PLL (Guenther et al. 1999).
3.4.5 Threshold currents
We have to know the threshold current that is needed to elicit phosphenes in patients so that we can develop stimulation electrodes that tolerate the required current. Threshold values determined in different studies are reviewed in Publication II. Experimental data with blind patients is still limited and, thus, generalized recommendations are difficult to

Review of the literature and theoretical background
27
define. The lowest thresholds have been achieved in animal experiments. For normal-sighted volunteers the thresholds have been lower than for blind patients or patients who have severe RP. Both Humayan et al. (1999) and Rizzo et al. (2003) showed that the minimal charge required to induce phosphene is higher in patients with more severe retinal degeneration. De Balthasar et al. (2008) showed with six patients that threshold tended to increase during a three-year period after the implantation. The movement of electrode array away from the retina was assumed to cause the threshold increase. Charge-threshold that is needed to elicit phosphenes varies from 8 µC/cm2 to 80 mC/cm2 for blind patients or patients with a severe RPE (de Balthasar et al. 2008; Humayun et al. 1999; Koch et al. 2008; Rizzo et al. 2003), and from 80 µC/cm2 to 4.8 mC/cm2 for normal-sighted volunteers (Humayun et al. 1999; Rizzo et al. 2003).
Different regions of the retina can have different stimulation thresholds. For example, Humayun et al. (1999) noticed a great difference in thresholds between the macular and the extramacular regions. They believed that the difference was due to the nonhomogeneous distribution of the retinal damage caused by RP. Schanze et al. (2003) pointed out that the higher the stimulation current the higher the temporal resolution. Low currents are not efficient enough to produce percepts of fast moving objects with a retina implant.
3.4.6 Electrode properties
Potential limits for the electrode corrosion are usually determined by limits that exclude H2 and O2 evolution. For safe stimulation, the electrode has to be capable of delivering a sufficient charge without reaching these critical potential limits. Electrical properties such as the impedance and charge injection capacity of different materials are listed in Table 3.1. It seems that IrO has a clearly higher charge injection capacity than Au and Pt. However, it is difficult to compare the results of different studies: Cogan et al. (2009) have used 0.75 ms pulses to define the charge injection capacity of Pt, sputtered iridium oxide films (SIROF) and activated iridium oxide film (AIROF). Previously, they used pulse duration of 0.2 ms and obtained lower charge injection capacity values for Pt. For stimulation with shorter pulses, the charge available from reversible processes is smaller whereas longer pulses permit the reactions to go to completion and, thus, result in higher charge limits (Rose and Robblee 1990). Varying stimulation waveforms may give different charge injection limits. Scan rate that is used during the cyclic voltammetry (CV) collection varies between different studies. The higher the used scan rate, the higher charge injection capacities are obtained. Processing techniques used for the electrodes affect the charge injection capacity and impedance. For example, SIROFs have higher charge injection capacity and lower impedance when the thickness of the SIROF film is increased (Cogan et al. 2009). Thus, it is important to report the electrode processing details but still, the comparison of different studies is not easy.

Review of the literature and theoretical background
28
Table 3-1 The measured electrical properties of various electrode materials.
Material Geom. Area
Impedance at 1kHz
Pulse
duration
Charge injection capacity
Cathodic charge storage capacity
Reference
Pt 700 µm2 800-1100 kΩ
Qwane Biosciences 2011
1260 µm2 400-600 kΩ
Qwane
Biosciences2011
Pt 0.4
mC/cm2 (Brummer et al.
1983)
Pt 0.2 ms 50-150
µC/cm2 (Rose and
Robblee 1990)
Pt 0.05 cm2 0.75 ms
0.3
mC/cm2 (Cogan et al.
2009)
Pt 0.05 cm2 0.2 ms
0.1
mC/cm2 (Cogan et al.
2004)
Pt-b 1.0 mm2 < 1 Ωcm2
Schwan 1963
(Grimnes and Martinsen 2008)
Au 700 µm2 1000-1300 kΩ
Qwane Biosciences 2011
1260 µm2 600-800 kΩ
Qwane
Biosciences 2011 Au
covered with IrO
95 mC/cm2
EPIRET3 (Roessler et al. 2009)
SIROF 1960 – 125600
µm2
1-9
mC/cm2
(Cogan et al.
2009)
IrO
3 mC/cm2 (Beebe and Rose 1988)
SIROF (80 nm),
AIROF 0.05 cm2
0.37
mC/cm2
18mC/cm2 (Cogan et al.
2009)
Small electrodes are required to increase the resolution of the retina implant. The EPIRET3 device (Roessler et al. 2009) has 25 3-D electrodes. The Artificial Silicon Retina implant (Optobionics Corporation) comprises approximately 5000 independently functioning electrode tipped microphotodiodes (Ong and da Cruz 2011). The Argus II (Second Sight Medical Products Inc, California, USA) has 60 independently controllable electrodes (Ahuja et al. 2011), and the Retina Implant AG has 1500 TiN electrodes of 50 x 50 µm (Zrenner et al. 2008). However, it is reported that even a 25 x 25 pixel array is already enough to enable reading at a Snellen acuity level of 20/25 and similar pixel numbers in a coarser array makes it possible for persons to navigate through a maze (Cha et al. 1992). The visual field in subjects with a prosthetic device is directly related to the size of the stimulated area of the retina (Ong and da Cruz 2011; Zrenner et al. 2008). Thus, the diameter of the electrode array should be increased to increase the visual field. The Argus II has been implanted in 27 patients. The estimated completion of the clinical

Review of the literature and theoretical background
29
trial (July 2014) will reveal safety issues and possible improvement in visual acuity produced by the prosthesis.

30
4 MATERIALS AND METHODS
Various methods were used in the studies of the present thesis. Two different RPE cell types were studied: EIS measurements revealed electrochemical properties of the hESC-RPE cells in Publications I and II, and in Publication I also the ARPE-19 cells were studied. Electrical equivalent circuit fitting was used to define the parameter values of electrical parameters representing the barrier properties of the studied epithelia. In Publication II, the permeability of the epithelium was defined measuring the flux of fluorescent particles. Ethylene glycol tetraacetic acid (EGTA) was added to the apical side of the hESC-RPE. EGTA violates tight junctions and, thus, increases the permeability of the epithelium. Changes in permeability were compared to changes in EIS curve to validate the EIS method and to show that the EIS method can measure changes in the integrity of the epithelium. Furthermore, in this thesis, we developed methods to measure ERG responses from co-cultured mice retinas and hESC-RPE cells in vitro to test our hypothesis that RPE support to photoreceptor function can be estimated in vitro. The ERG responses of the co-cultures were compared with the responses measured from mice retinas cultured alone. In Publication III, the electrochemical characterization of five different electrode materials included EIS, CV, and atomic force microscopy (AFM) measurements.
4.1 Cell cultures
The hESC line Regea 08/023 (Skottman 2009) was derived and characterized in the Institute of Biomedical Technology, Tampere, Finland. Researchers at the institute have developed methods to differentiate hESCs into RPE cells (Skottman 2009; Vaajasaari et al. 2011). Putative RPE cells in Publications I and II, and in the ERG measurements were differentiated from the hESC line by using the differentiation method that is described in detail by Vaajasaari et al. (2011). The experiment’s pigmented cell aggregates (Figure 4-1 a) were selected manually from the hESC-RPE culture. Both hESC-RPE and ARPE-19 cells were cultured on BD BioCoat™ Cell Culture Collagen IV inserts (BD Biosciences, San Jose, CA, USA) that are designed for 24-well plates. In their previous study, Vaajasaari et al. (2011) have shown that hESC-RPE cells differentiated in the Institute of Biomedical Technology display a typical RPE morphology (Figure 4-1 b) and express genes and proteins that are characteristic for RPE. Additionally, the cells phagocytose POS and secrete PEDF, which is crucial for functional RPE.

Materials and methods
31
Figure 4-1 hESC-RPE cells: a) Pigmented cell aggregates b) Cobblestone morphology of hESC-RPE cells. [Figure from the group of Heli Skottman]
In Publication I, we used hESC-RPE cells to model the properties of tight and mature epithelium. The hESC-RPE cells were cultured for 77 days and, during that time, cultures reached TER levels above 300 Ωcm2, indicating functionally mature RPE cells (Sonoda et al. 2009; Zhu et al. 2011). A commercially available ARPE-19 cell line (American Type Culture Collection, ATCC, Manassas, VA, USA) was used as a control to model leaky, immature epithelium. ARPE-19 cells were cultured for 28 days after seeding onto the insert. In Publication II, the hESC-RPE cells were cultured for various periods of time and the 13 samples used in the measurements were grouped according to their integrity, which was evaluated by TER values (Ωcm2).
4.2 Electrical impedance spectroscopy of RPE cells
4.2.1 Measurement setup
Impedance spectra were measured using the Solartron Model 1260A Frequency Response Analyzer and the 1294A Impedance Interface (Solartron Analytical, Hampshire, UK). Measurements were led via a laptop computer equipped with SMaRT Impedance Measurement Software (Solartron Analytical, Hampshire, UK). Impedance measurements were performed at a frequency range from 1 Hz to 1 MHz with ten samples per decade using a 10-µA effective sine-wave alternating current. The amplitude was selected to be as small as possible to avoid cell damage. [I, II]
A setup for electrodes was developed to enable EIS measurement of epithelia using permeable culture inserts (Cell Culture Collagen IV insert for 24-well plates, BD Biosciences, San Jose, CA, USA) as a culture surface for the studied cells. The electrodes were attached to the cover of commercial 12-well plate (Corning Incorporated, NY, USA) to a fixed height and location on each well to ensure the constant positioning of the electrodes for each insert in the well plate. Wires were attached to the electrodes to enable the connection between the electrodes and impedance analyser (Figure 4-2 and Figure 4-3).

Materials and methods
32
Figure 4-2 The setup of tissue base and electrodes in one well. Electrodes are connected to impedance analyzer. Voltage electrodes measure the transepithelial voltage, which changes due to alternating transepithelial current. A laptop is used to collect and analyze the impedance data. [I] [Reprinted from Med Biol Eng Comput, vol. 50 issue 2, 2011, Onnela et al., Electric impedance of human embryonic
stem cell derived retinal pigment epithelium, pages 107-116, copyright (2012) with permission from Springer.]
The culture insert divides the well in two compartments, each equipped with two electrodes, as illustrated in Figure 4-2. The plastic insert acts as an insulator for the electric current, directing the current through the microporous membrane in the bottom of the insert and, thus, through the cell layer. The setup (Figure 4-3) enables stable and repeatable measurements as shown in (Savolainen 2010).
Figure 4-3 Electrodes are attached to the cover of the 12-well plate. An impedance analyser is connected to the measurement electrodes in the well containing red medium. [Modified from
Savolainen 2011]
In our setup, the voltage electrodes are not between the current electrodes like in a traditional four electrode impedance measurement setup. Thus, the current field is not homogeneous on voltage electrodes. However, the sensitivity distribution of the measurement can be discussed with the aid of the lead field theory. In our setup (Figure 4-4), the position of the electrodes is fixed, and the plastic culture insert and the amount

Materials and methods
33
and composition of the electrolyte are the same in every measurement. Thus, the impedance change is affected only by the change of the conductivity of the epithelium and by the dot product of the lead fields of the current and voltage electrodes in the volume of the epithelium (Equation 6 in the chapter 3.3.5). The electrodes have to be at fixed positions in all of the measurements so that the lead fields do not vary between measurements. By changing the electrode size, shape, and position, we could alter the lead field sensitivity. The voltage electrodes do not have to be in a homogeneous current field, but the lead fields of both current and voltage electrodes should be homogeneous across the epithelium to ensure that the whole epithelium will be measured.
Figure 4-4 Lead fields of the EIS measurement setup: JLE indicates the lead field of the voltage measurement electrodes and JLI indicates the lead field of the current feeding electrodes. The dot product of JLE and JLI determines the sensitivity of the measurement.
4.2.2 Determining electrical parameters from impedance data
The impedance behaviour of biological tissues can be analyzed by using equivalent electric circuit models that reflect the basic epithelial barrier properties of the measured tissue (Section 3.3). Cell layer electric resistance and capacitance values can be extracted from the impedance spectra by means of equivalent circuit modelling and data fitting (Strauss 2005). Electrical equivalent circuits used for data fitting in Publications I and II are shown in Figure 4-5. For the hESC-RPE cells [I, II], the effect of the measurement setup (electrodes, medium, empty filter insert) was small in comparison to the response of the epithelium itself. For ARPE-19 cells that were measured in Publication I, the effect was substantial. The impedance response of the ARPE-19 cells was on the same level with the response caused by the measurement setup. For this reason, it was important to model the bulk (electrodes, medium, empty culture insert) more precisely in Publication I.

Materials and methods
34
a) b)
Figure 4-5 Equivalent electrical circuits: a) In Publication II the circuit had one RC circuit in series with the Rbulk resistor. Repi and Cepi were the electrical components describing the electrical behaviour of the epithelium. b) In Publication I the bulk (the effect of electrodes, medium and empty filter insert on the measured response) was defined more precisely with one RC circuit in series with the Rbulk. Rele, Cele = resistance and capacitance of electrodes. Epithelium was modelled similarly to the previous study.
The impedance spectra were analyzed with the software ZView (Scribner Associates, Inc., NC USA). For a quantitative analysis of the impedance spectra, an equivalent circuit model describing the resistive and capacitive properties of the RPE was fitted to the impedance data. Equivalent circuit fitting was based on a successive approximation method that finds a best fit by altering the estimated element values and checking the match between the model and the data (chapter 3.3.2). [I, II] In Publication I, the equation used for data fitting was
(7)
with ω being the circular frequency (2πf) and j the square root of -1. For near DC conditions, i.e. , the equation simplifies to
(8)
For very high frequencies, the equation simplifies to
(9)
In Publication II, the equation used for data fitting was
(10)

Materials and methods
35
For near DC conditions, i.e. , the equation simplifies to
(11)
For very high frequencies, the equation simplifies to
(12)
4.2.3 Biological assessment of the cells
Previously, the hESC-RPE cell lines used in this study have been characterized by Vaajasaari et al. (2011). Vaajasaari et al. showed that they generated putative RPE cells with a typical pigmented cobblestone-like morphology. The cells expressed genes and proteins characteristic for RPE cells, were able to phagocytose POS, and secrete PEDF. Cultured hESC-RPE cells formed a polarized epithelium with high integrity. (Vaajasaari et al. 2011)
In Publication II, the junctional integrity defined with EIS was compared to that assessed by measuring the flux of 4 kDa FITC dextran (Sigma-Aldrich, St. Louis, MO, USA) in the culture medium. The fluorescence of the medium samples was analyzed using a fluorescent plate reader (Wallac Victor 1420 Multilabel, Turku, Finland). The permeability of the cell cultures was calculated according to the method described by Krug et al. (2009). The correlation of EIS and permeability data were evaluated using linear regression. After impedance and permeability experiments, immunostaining was used to study the morphology of the cell cultures. The nuclei were stained, and intracellular fibrillar actin was stained to study actin reorganization after EGTA treatment. [II]
4.3 Electroretinogram from retina-RPE co-culture
4.3.1 Mouse retina preparations
C57BL/6J –strain mice (Harlan, Denmark) were obtained from the animal laboratory of the University of Tampere. In the measurements using only retina (the measurement series 1 in Table 4-1), mice were dark-adapted for more than 10 hr. The preparation was performed under dim red light (Darkroom Light, Kaiser Fototechnik, Germany) to minimize photo pigment bleaching of the retina. Mice were sedated (Domitor, Ketalar) and, after decapitation, their eyeballs were removed in dim red light. In other measurements (measurement series 2-3 in Table 4-1), the eye-ball removal was done in normal room light, and the eyes were dark adapted for one hour after that. Control retinas and those cultured together with the RPE cells were prepared from the same animal to minimize the differences between different animals.

Materials and methods
36
The co-cultures of retina and hESC-RPE cells and control retinas cultured alone were placed in an incubator (95/5% O2/CO2, 37°C) for 1.5 – 4 hours before starting the measurements. Initial state of the ERG response of the samples was measured before the incubation. Incubation of the retina and retina-RPE co-cultures was realized in deep dishes with custom-made stands. These enabled the retina (ganglion cell side) to face the incubator atmosphere and RPE cells to be in contact with the medium.
4.3.2 Multielectrode array recordings
In our previous study (Nöjd et al. 2008) we tested the developed ERG measurement setup. In that study, voltage, current, and light driven stimulation were used. The objective of the measurements in this thesis was to use the MEA measurement system developed in (Nöjd et al. 2008) to measure ERG responses from the in vitro co-culture of mouse retina and hESC-RPE cells. The aim was to evaluate the developed method and to test the use of ERG to assess the differences between the responses of the co-culture and the retina cultured alone.
Measurements were carried out with a commercial microelectrode array system (Multi Channel Systems MCS GmbH, Germany). The system (see Figure 4-6) consists of the MEA, a preamplifier (amplification 1100, bandwidth 10 Hz – 3 kHz) with a heating element and a temperature sensor (MEA1060-Inv-BC-Standard, MCS GmbH), a stimulus generator (STG2004) controlled through software (MC_Stimulus II version 3.0.1, MCS GmbH), a temperature controller, and software for recording the data (MC_Rack version 3.7.0, MCS GmbH).
Figure 4-6 The principle of ERG measurements using MEA. Stimulus generator controls the LED and, thus, the light stimulation. The voltage measured between the ground electrode (pellet dipped into the medium) and the MEA is amplified. Data is recorded and analysed using a laptop.

Materials and methods
37
HexaMEA (MCS GmbH) is specially designed for the measurements of retinal explants and was, therefore, selected for the measurements (Figure 4-7 a). An Ag/AgCl pellet was dipped into the solution and used as a reference electrode (Figure 4-7 b). The dish around the electrodes enables the use of medium during the measurements (Figure 4-7 c). We used a carbogenised (95% O2 5% CO2) bicarbonate HEPES buffered Ames (A1420-10x1 1, Sigma) solution in our measurements, pH 7.4, 37°C. A ring made of PDMS was placed on top of the membrane carrier to keep the retina firmly at the right location on the MEA (Figure 4-7 c). Working phases of the ERG measurements are represented in Figure 4-8.
a) b) c)
Figure 4-7 a) HexaMEA is specially designed for the measurements of retinal explants. b) Ag/AgCl pellet was dipped into the medium, and it served as a reference electrode. c) PDMS ring was used to keep the tissue firmly on the bottom of the MEA.
Stimuli to retinal explants were given with a light stimulator that was specially designed for these measurements. The stimulus generator controlled the light stimulator. The stimulator uses a light-emitting diode (LED) light (Luxeon Rebel, Philips Lumileds, LXML-PE01-0060) with a wavelength of 490-520 nm. The wavelength fits into the spectral sensitivity of the photoreceptors in the mouse eye (Nusinowitz et al. 2002). Mouse rods are most sensitive to wavelengths of 500-510 nm and type M cones are most sensitive to wavelengths of approximately 510 nm. The S-type cones of the mouse eye are most sensitive to wavelengths of approximately 360 nm, but since only one wavelength was chosen, this was ignored. In the measurements series 1 (Table 4-1), the light was mirrored with a concave mirror from the led to the cells (illumination power 200 – 9000 lux). The illuminance range of the stimulator without mirroring was 600 – 26000 lux. Maximum illumination power (26 klux) was used during the measurement series 3 (Table 4-1). Illuminance values were measured with a Panlux electronic (Gossen) light intensity measurement device. During the measurement series 2, a monochromator was used (510 nm).
In the measurement series 1 (Table 4-1), the change in the b-wave amplitude with increasing light intensity was measured (n=4). In the measurement series 2, the b-wave amplitudes measured from the co-cultures of retinas and hESC-RPE cells were compared with the b-wave amplitudes measured from retinas cultured alone (n=4). The b-wave amplitude of the ERG response was used as an indicator for the recovery from the bleaching and to show the vitality of the photoreceptors during the long term incubation. In the measurement series 3, we tested if the retina cultured alone and the co-culture of retina and hESC-RPE cells are able to respond to light stimulation after one day of

Materials and methods
38
incubation. In all measurements, the stimulus duration was 15 ms and the interstimulus interval 15 s.
Table 4-1 Details of different series of measurements
Nr) and purpose of the
series of measurements
Total number of
retina samples
Sample Age (days) and sex of
mouse
Time in incubator
before measurements
Position of the retina on the
MEA
1) b-wave sensitivity
curve
4 Retina 1, 2, 3, 4
77 0, 52,91, 131 min
Photoreceptors face the MEA
2) Comparison between the
b-wave amplitude of retina and of
retina-RPE co-culture
8 (4 ret,
4 ret-RPE)
Retina 5 retina-RPE 5
Retina 6 retina-RPE 6
Retina 7 retina-RPE 7
Retina 8 retina-RPE 8
92
92
85
85
110 min 110 min 240 min 240 min 95 min 95 min
215 min 230 min
Photoreceptors (RPE cells in co-cultures) face
the MEA
3) Will retina of retina-RPE
co-culture respond to light stimuli
after one day in vitro
culture?
2 Retina 9 Retina-RPE 9
0 and 1 days
Day 1: Ganglion cells face the MEA
Day 2: Photoreceptors face the MEA
4.4 The electrical properties of the electrode materials used in retinal implants
4.4.1 Sample electrodes
We fabricated flat round stimulus electrodes. The sizes of the electrodes were 5, 7.5, 10, 12.5, 15, 20, 25, 30, 40, 50, 60, 70, 80, 90, 100, 125, 150, 200, 300 and 500 μm in diameter. The electrodes were fabricated using five different materials, i.e. Au, Ir-b, Ti, TiN and Pt-b. The stimulus electrodes were fabricated on a Si wafer by using standard photolithographic techniques. The fabricated stimulus electrodes that were used for electrode material testing are shown in Figure 4-8.

Materials and methods
39
Figure 4-8 Fabricated stimulus electrodes: Sample electrodes were made of five different materials (Au, Ir-b, Ti, TiN, and Pt-b) and in 20 different sizes. [III] [Reprinted with permission]
4.4.2 Methods to characterize the electrodes
The electrochemical characterization included CV and EIS. Measurements were made in a three-electrode cell using a large-area Pt counter electrode and a Ag|AgCl reference electrode (Figure 4-9). Voltage was applied between the counter and test electrodes and the resulting current between the reference electrode and test electrodes was measured. In the CV measurements, the amplitude of the voltage was varied to determine the charge injection capacity of the test electrode on different voltages. In the EIS measurements, the frequency of the applied current (or voltage) was varied and the resulting voltage (or current) was measured to determine the frequency dependent impedance of the test electrodes.
Solartron Analytical SI1260 Impedance/Gain-Phase Analyzer and SI1287 Electrochemical Interface (Solartron Analytical, Hampshire, England) were used for the recordings. We used recording software CorrWare and Zplot, and analyzing softwares CorrView 2.9b and ZView (Scribner Associates Inc., NC). Slow sweep rate CV measurements (50 mV/s) between potential limits of −0.01 and 0.01 V (versus open circuit potential) were used to compare the charge storage capacities of different electrode materials. Then the voltage range was increased step by step until the H2 and O2 evolution limits for each material were reached. The CV measurements were taken also using this maximum voltage range.
The EIS measurements were made over a 100–106 Hz frequency range using a 10 mV rms sinusoidal excitation voltage, and a DC voltage of 0 V versus open circuit potential. Surface roughness information of different electrode materials was obtained with an AFM device (MultiMode AFM from Veeco Instruments Corp).

Materials and methods
40
Figure 4-9 Measurement setup used for EIS and CV measurements of different electrode materials.


42
5 RESULTS
5.1 RPE functionality with EIS
5.1.1 hESC-RPE and ARPE-19 cells
In Publication I, we showed that EIS measurements could reveal differences between epithelia that have properties of mature (hESC-RPE) and immature (ARPE-19) RPE cells. Biological assessment of the epithelia was used to compare the results of EIS to biological markers that are used to evaluate the maturity of the epithelium. Tight junction localization with ZO-1 staining revealed that hESC-RPE cells formed a uniform layer of pigmented and highly pigmented cells with cobblestone morphology, all typical of mature RPE cells (Figure 4 in [I]). There was also a strong phalloidin labelling at the cell edges and nicely formed tight junctions, as seen with their intense ZO-1 staining (Figure 4 in [I]). Accordingly, for morphologically mature hESC-RPE, TER values were high indicating high barrier function, but for morphologically immature ARPE-19 the TER values were very low compared to hESC-RPE. Thus, traditional microscopic evaluation gave similar results to our non-invasive EIS results. [I]
The impedance spectra of hESC-RPE and ARPE-19 cells represented by Bode and Nyquist plots are shown in Figure 5-1. The resistive properties (impedance magnitude on low frequencies) are considerably greater for hESC-RPE cells than for ARPE-19 cells. For both cell types, the impedance magnitude decreases after a certain frequency, meaning that the capacitive element of the equivalent circuit – and the cell membrane – starts to conduct. Time constants, and thus, the frequencies on which the cell membranes start to conduct, are very different for immature ARPE-19 cells and for mature hESC-RPE cells. [I]
TER and C values were calculated from the measured impedance spectra. The TER values of hESC-RPE cells were 390 Ωcm2 and those of ARPE-19 cells were 10.3 Ωcm2. The TER values of hESC-RPE cells correspond to those of the human fetal RPE cultured in vitro (Frambach et al. 1990; Maminishkis et al. 2006; Rajasekaran et al. 2003). The C values for hESC-RPE and ARPE-19 cells were 7.1 and 0.8 µFcm-2 respectively. [I]
Despite similar culturing conditions and origin of the cultured cells, the individual cell grafts had varying electrical properties: hESC-RPE cells were seeded at the same time with

Results
43
the same density. Despite their same origin, the different hESC-RPE cell cultures had quite different TER values (Figure 5-1). Thus, differences between individual cell sheets are likely to appear. [I]
Figure 5-1 Impedance spectra of the hESC-RPE cells: a) impedance magnitude vs. log frequency, b) phase angle vs. log frequency, and c) Nyquist plot. Impedance spectra of the ARPE-19 cells: d) impedance magnitude vs. log frequency, e) phase angle vs. log frequency, and f) Nyquist plot. The effect of measurement setup is subtracted to get a pure cellular response. [I] [Reprinted from Med
Biol Eng Comput, vol. 50 issue 2, 2011, Onnela et al., Electric impedance of human embryonic stem cell derived retinal pigment epithelium, pages 107-116, copyright (2012) with permission from Springer.]
5.1.2 hESC-RPE cells in different stages of maturity
In Publication II, the hESC-RPE cells were cultured for various periods of time. The 13 samples used in the measurements were grouped according to their integrity, which was evaluated by TER values (Ωcm2) obtained from the impedance spectrum at a frequency of 10 Hz, the common TER measurement frequency. The sample with the highest TER had the most homogeneous pigmentation relative to samples with lower TER values. It seemed that the amount of pigmentation increased with maturation. [II]
The cellular junctions visualized with fibrillar actin staining had compact and clear actin labeling on the cell edges in samples with TER over 20 Ωcm2. In samples with

Results
44
TER < 20 Ωcm2, the junctional staining was somewhat weak, but stress fibers were more prominent. Thus, based on microscopic evaluation, the morphology of RPE cells shifted from fibroid of the sparse, i.e. subconfluent culture to more tightly packed and hexagonal when the cells matured and formed a continuous, i.e. confluent layer of cells. [II]
The integrity of hESC-RPE cell monolayer was assessed in addition to EIS measurements using a small molecular weight fluorescent marker. Samples with higher TER were less permeable than samples with low TER. Thus, permeability and TER seemed to have inverse correlation. EGTA treatment was used to modify the tight junctions of the epithelium. EGTA treatment increased the permeability of the samples regardless of their initial TER values. In the presence of EGTA, low frequency impedance values decreased and the peak frequency of the impedance phase increased. Low frequency impedance corresponds somewhat to TER, and thus, in the presence of EGTA, TER decreased and permeability increased. Furthermore, statistical analysis of the data from the permeability and impedance measurements indicated that these two methods were correlated especially with hESC-RPE cell samples of high integrity. [II]
Impedance data measured from hESC-RPE samples of different integrity showed that while the integrity of the cell layer decreased, the low-frequency impedance decreased and cutoff frequency increased (Figure 5-2) [II]. This was also seen in Publication [I]: ARPE-19 cells with low maturity and poor integrity had low TER and higher cut-off frequency than hESC-RPE cells, which had high integrity and were morphologically mature.
We derived five parameters that can be used to study the maturity of the epithelium using EIS. TER increases as the epithelium matures. TER decreases as tight junctions are opened with EGTA treatment, and thus, the integrity of the cell culture can be detected using TER. The frequency of the highest phase angle decreases and the value of the peak phase in degrees increases with increasing maturity. The angle of depression of the semicircle seen in the Nyquist plot representation of EIS data is lower for high maturity samples. [II]

Results
45
Figure 5-2 Bode and Nyquist plot of the hESC-derived RPE cells grouped according to their TER values (Ωcm2). The curves were drawn using the average impedance data for each group. Impedance spectra were measured at intervals of 1 h for 2 h (t = 0, 60, and 120 min) (dark blue). EGTA was added at 120 min. After addition of EGTA, measurements were continued at 45 min intervals (t = 165, 210, 255, and 300 min) (blue). EGTA addition was repeated in the group with TER>250 Ωcm2 in order to achieve complete disassembly of the tight junction network. Following this, impedance measurements were continued at 15-min intervals for 45 min (t = 315, 330, and 345 min) (green). The impedance curves in the absence of EGTA are shown in dark blue, those after addition of 2 mM EGTA in blue and those after addition of 4 nM EGTA in green. [II] [Reprinted
from Annals of Biomedical Engineering, vol. 39 issue 12, 2011, Savolainen et al., Impedance spectroscopy in monitoring the maturation of stem cell-derived retinal pigment epithelium, pages 3055-3069, copyright (2012) with permission from Springer.]
5.2 RPE functionality shown with ERG and retina-RPE co-culture
5.2.1 ERG measurements from retina alone
In this thesis, a light stimulator system that works at the maximum range of retinal spectral sensitivity and is easy to regulate was developed and included into the measurement setup developed in our previous work (Nöjd et al. 2008). ERG responses were successfully measured with the developed system (Figure 5-3).
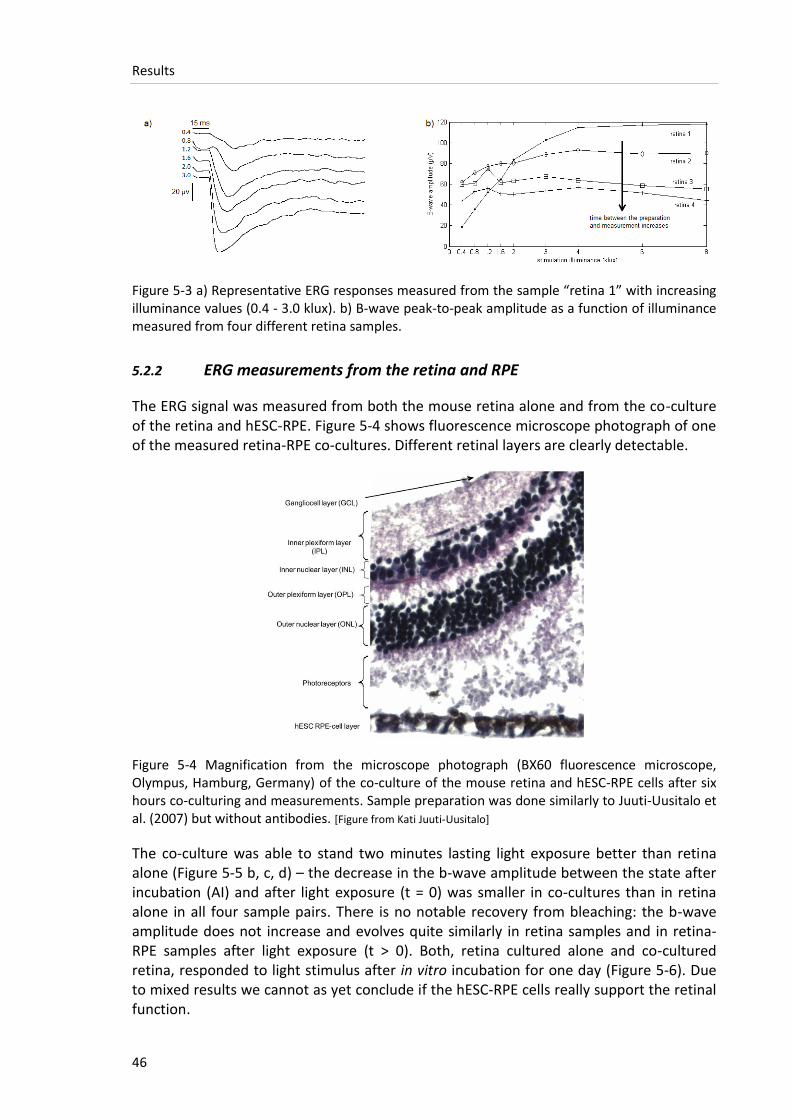
Results
46
Figure 5-3 a) Representative ERG responses measured from the sample “retina 1” with increasing illuminance values (0.4 - 3.0 klux). b) B-wave peak-to-peak amplitude as a function of illuminance measured from four different retina samples.
5.2.2 ERG measurements from the retina and RPE
The ERG signal was measured from both the mouse retina alone and from the co-culture of the retina and hESC-RPE. Figure 5-4 shows fluorescence microscope photograph of one of the measured retina-RPE co-cultures. Different retinal layers are clearly detectable.
Figure 5-4 Magnification from the microscope photograph (BX60 fluorescence microscope, Olympus, Hamburg, Germany) of the co-culture of the mouse retina and hESC-RPE cells after six hours co-culturing and measurements. Sample preparation was done similarly to Juuti-Uusitalo et al. (2007) but without antibodies. [Figure from Kati Juuti-Uusitalo]
The co-culture was able to stand two minutes lasting light exposure better than retina alone (Figure 5-5 b, c, d) – the decrease in the b-wave amplitude between the state after incubation (AI) and after light exposure (t = 0) was smaller in co-cultures than in retina alone in all four sample pairs. There is no notable recovery from bleaching: the b-wave amplitude does not increase and evolves quite similarly in retina samples and in retina-RPE samples after light exposure (t > 0). Both, retina cultured alone and co-cultured retina, responded to light stimulus after in vitro incubation for one day (Figure 5-6). Due to mixed results we cannot as yet conclude if the hESC-RPE cells really support the retinal function.

Results
47
Figure 5-5 Comparison of the b-wave peak-to-peak amplitudes of test measurements of the retina-RPE co-culture and of the retina alone. In figures a-e) the b-wave amplitude is normalized to the b-wave amplitude measured from the retina alone before incubation. Retinas in each co-culture and control retina pair (retRPE(n) & ret(n)) are prepared from the same animals left and right eye. The time in x-axis starts from the first measurement after the light exposure lasting 2 minutes. BI = the b-wave amplitude measured before putting samples into an incubator and AI = the amplitude after incubation. B-wave amplitude (µV) is averaged from 5 repetitions measured with a) 47 and 60 electrodes for ret1 and retRPE1 respectively, b) 60 electrodes for ret2 and retRPE2, c) 42 and 48 electrodes for ret3 and retRPE3 respectively, and d) 45 and 43 electrodes for ret4 and retRPE4 respectively. e) b-wave responses of retina and retina-RPE co-cultures are averaged from all samples (n=4 for both groups).
a) b)
Figure 5-6 a) Representative filtered and averaged (30 sweeps) ERG responses from one channel before the incubation (upper figures) and after the incubation (lower figures) from the retina cultured alone (left figures) and from the co-culture of retina and RPE (right figures). ERG data on the first day were measured immediately after the preparation, and the measurement on the second day was carried out 24 hours later. b) B-wave amplitude (±SD) of the ERG response measured on the same day with the preparation (grey column, day 1) and on the next day for retina alone as well as for retina-RPE co-culture.

Results
48
5.3 Comparison of electrode materials used in retinal implants
The electrochemical characterization made for five different electrode materials included CV measurements and EIS. We used exactly the same measurement conditions for each electrode material and, thus, enabled the comparison of the electrical properties. According to our CV measurements, Ir-b and Pt-b exhibit more charge injection capacity than Au, Ti or TiN (Figure 5-7). For the sample electrodes having a diameter of 150 µm, the anodic charge capacities were 0.45, 0.71, 7.30, 13.8 and 23.9 mC/cm2 and cathodic charge capacities 0.21, 0.32, 0.76, 15.0 and 34.9 mC/cm2 for Au, TiN, Ti, Ir-b, and Pt-b respectively. [III]
a) b)
Figure 5-7 CV: a) CVs measured for Au, TiN, Ti, Pt-b and Ir-b samples. The diameter of these sample electrodes was 150 μm and the CV curves are normalized to the geometrical surface area. b) The total charge calculated from CV data (maximum voltage range excluding H2 and O2 evolution). Axes are logarithmical. The charge injection capacities of different materials can be compared. Ir-b and Pt-b have greater charge injection capacities than other materials. [III] [Reprinted with permission]
Charge injection capacity is a property of the material, but the real surface area of the used electrode also affects: normally, the greater the real or geometric surface area, the greater the charge injection capacity. Ir-b and Pt-b had greater surface roughness than for example Au. The real surface area of the electrode can be estimated from AFM photographs that give estimations of the surface roughness (Figure 4 in [III]). Relationships between frequency and impedance magnitude for different materials measured with an electrode diameter of size 150 µm are shown in Figure 5-8 a). Figure 5-8 b) shows the relationships between stimulus electrode diameter and impedance magnitude for different materials at 1 kHz frequency. TiN was also a porous material like Ir-b and Pt-b. Still, TiN had clearly poorer impedance (Figure 5-8) and charge injection capacity (Figure 5-7) properties than the two previous materials. Usually porous materials are favored because they have higher initial charge transfer capacity.

Results
49
a) b)
Figure 5-8 EIS: a) Impedances of Au, TiN, Pt-b and Ir-b measured between 100 Hz and 1 MHz frequencies. The diameter of these sample electrodes was 150 μm. Pt-b has the lowest impedance values at frequencies below 0.1 MHz. b) Impedance values of all the different electrode sizes measured on 1 kHz frequency. Pt-b electrodes (blue squares) have the lowest impedance values. To suppress irreversible reaction of stimulus electrodes the impedance magnitude less than 25 kΩ is required when the threshold current to induce an action potential is 40 μA. [III] [Reprinted with permission]

51
6 DISCUSSION
Diseases that cause blindness reduce the quality of life of patients. We have to work towards a better understanding of the pathogenesis of these diseases and to discover new strategies to prevent their development or progression. Human embryonic stem cells and other pluripotent cells provide an important source for regenerative medicine and also for drug testing (Carr et al. 2009; Kaempf et al. 2008; Kobuch et al. 2008; Zhu et al. 2011). With microelectronics, we can study cells in vitro (Homma et al. 2009; Krug et al. 2009; Rahman et al. 2009) and provide new information about living cells and also develop novel methods to follow the cell differentiation and maturation non-invasively. Microelectronics and new materials enable the manufacturing of tiny implantable technology products such as retinal implants (Ahuja et al. 2010; de Balthasar et al. 2008; Roessler et al. 2009; Zrenner et al. 2008). Thus, artificial vision may become a reality sooner than we can imagine, just like auditory implants.
This study has introduced a novel non-invasive method that can be used in the follow-up of the cell maturation and differentiation. EIS has been used for epithelia research earlier (Arndt et al. 2004; Depaola et al. 2001; Gitter et al. 1997; Guo et al. 2006; Krug et al. 2009; Lo et al. 1995; Rahman et al. 2009; Schifferdecker and Frömter 1978; Wegener et al. 1996 & 1999), but in cell differentiation and especially for hESC-RPE or RPE studies it has not been applied before. In this thesis, ERG measurements of retinal explants cultured with RPE cells were done to test if the RPE cells are functional and enhance the vitality of a retina in in vitro culture. In addition, we studied the electrode materials used in retinal implants. We will develop electrode materials further and we have already started a project in which we will consider conductive polymer coatings as a more biocompatible alternative to metal electrodes.
6.1 ERG
ES cells from various species have been successfully differentiated into retinal progenitor and RPE cells (Hirano et al. 2003; Kawasaki et al. 2002; Klimanskaya et al. 2004; Vaajasaari et al. 2011). Our long term aim is to develop methods to assess the functionality of differentiated RPE cells. As part of this, we aimed to develop methods to study the ability of these cells to rescue the functionality of photoreceptors in a mouse model by testing ERG responses in vitro. In addition, the co-culture of the retina and hESC-RPE cells may be

Discussion
52
a useful in vitro model for investigating the RPE cell replacement therapy and possible drug releasing materials for retina.
Our setup has potential to reveal RPE cell functionality since the retinal recovery from an intense light exposure causing photopigment bleaching is substantially depressed without the presence of a functional RPE (Strauss 2005). B-wave amplitude measured from an eyecup with the functional RPE can recover from the prolonged light stimulation: Newman and Bastosch (1999) showed that b-wave amplitude recovered over a 15 min period following a 2 min bleaching light exposure. Thus, dark adaptation manifested by ERG response could be used as an indicator of the functionality of the co-culture and thus, as an indicator of the RPE functioning. In addition, co-culturing retina together with hESC-RPE cells might prolong the time the retinas are able to respond to light stimuli, as RPE cells may support the metabolism of photoreceptors (Kaempf et al. 2008). This may also be used to observe the functionality of the hESC-RPE cells.
Our preliminary data showed mixed results when we studied the ability of the RPE cells to enhance the b-wave amplitude of the co-cultured retinas compared to control retinas. We showed in Publications I and II that differentiated hESC-RPE cell cultures can have different electrical properties (TER) despite the same culture conditions and stem cell line. Thus, there are differences between the hESC-RPE cells that can contribute to the ability of RPE cells to function together with the retina. In addition, the variability of the measurements between different retinas might be explained by the differences between the retina samples: retinas are prepared by hand and there may be differences between the preparations. In addition, the age of animal can affect the condition of the retina and different animals can produce varying ERG responses. In addition to biological variation, the distance between the retina and the MEA electrodes can affect to the measured ERG amplitudes (Eleftheriou et al. 2012). We minimized the tissue-electrode distance by using a PDMS ring on top of the membrane carriers to keep the retina firmly at the right location on the MEA. However, there might have been variation in the tissue-electrode distance between different samples.
We measured ERG responses from the retina-RPE co-culture and control retina and found out that those produced a typical ERG signal after one day of in vitro environment. Our recent measurements in slightly different culture conditions showed that we were not able to record ERG responses after in vitro incubation of three days (data not shown). One problem for the mixed ERG results in this thesis might be too short co-culture period. However, culturing techniques for prolonged measurements have been developed (Johnson and Martin 2008; Kaempf et al. 2008; Koizumi et al. 2007; Kobuch et al. 2008; Kretz et al. 2004). For example, it has been shown by Johnson and Martin (2008) that retina explants of adult rat can stay vital for at least 17 days in in vitro culture conditions. In addition, Kobuch et al. (2008) have shown that the photoreceptor outer and inner segments are the most vulnerable retinal structures of an in vitro cultured retina. The first signs of degeneration of ONL and INL are already observable after 24 hours of culture (Kobuch et al. 2008), whereas the ganglion cell layer seemed to stay intact longer. Thus, it might be possible to record electrical stimulus driven ganglion cell responses after a few days of incubation. ERG responses are not possible to record after photoreceptors degenerate and, according to Kobuch et al. (2008), this could already be the case after

Discussion
53
one day of incubation. This might also explain why we were not able to measure ERG data on the third day of incubation.
One possible way to prolong the vitality of retina is that we could enhance our in vitro culture conditions. Kobuch et al. (2008) conluded that a perfusion culture was superior when compared with a static one. They wrote that the perfusion culture managed to keep the adult porcine retina-RPE-choroid tissues morphologically intact for at least ten days when the tissue in static culture lost its structure after only four days. We used no perfusion during the culture of retina-RPE tissues in the incubator, and this can be one reason why we have not succeeded in measuring of ERG responses after in vitro cultivation of a few days. This should be improved in future measurements. New perforated MEAs that are commercially available, for example from Multi Channel Systems (Reutlingen, Germany), could provide one useful solution for the perfusion in the incubator. We used standard retinal commercial MEA that had no integrated perfusion.
We hypothesized that co-culturing of retina together with hESC-RPE cells might prolong the time the retinas are able to respond to light stimuli, as RPE cells may support the metabolism of photoreceptors. In Kaempf et al. (2008), porcine retina-RPE cultures were compared with retina alone and freshly isolated retinas. The results suggested that having the RPE-choroid in contact with the retina preserves the photoreceptors better than when culturing the retina alone in three days culture. Furthermore, Kobuch et al. (2008) noticed that a good attachment between retina and RPE seemed to be a precondition for the preservation of the photoreceptors for up to 4 days in perfusion culture. Carr et al. (2009) showed that iPS-RPE cells were able to phagocytose the photoreceptor outer segments of porcine retina and signs of this phagocytosis were on view after 3 hours. Thus, the co-culture of retina and RPE cells show physiological functioning (phagocytosis) after 3 hours of cultivation. We could, therefore, expect that after 3 hours, the co-culture of RPE cells and retina could also show some changes in electrophysiological functioning compared to retina cultured alone.
Due to challenges in in vitro ERG recordings our research group has already started tests of hESC-RPE cell functionality in vivo. However, in vitro studies are important in themselves: they provide valuable information about the properties and function of certain tissue layers without extrinsic factors that can interfere with the results. In an in vitro environment, it is easier to control the factors affecting the measured phenomena. For example, if the co-culture of the retina and hESC-RPE cells is used as an in vitro model for investigating drug releasing materials used together with the RPE transplantation, the control of drug release and targeting is easier than in an in vivo situation because the metabolism does not flush the drugs away.
6.2 EIS to test RPE functionality
6.2.1 EIS in the follow-up of the cell differentiation and maturation
In Publication I, the set-up for the EIS measurement of cell-culture was developed. Our results show that the EIS method has the ability to reveal the integrity of the cultured cell

Discussion
54
sheet. The method shows clear differences between the cells having poor integrity, i.e. low TER values, and the cells with high morphological maturity and high TER values. The cells with higher integrity, and thus with a higher level of maturity, have not only higher TER values but also the impedance phase peak is shifted to lower frequencies. This means that the higher cell layer integrity results in a higher capacitance value. Capacitance represents the morphological properties of the measured epithelia (Wegener et al. 1999 & 2000). The high value of capacitance may indicate high maturation of the cell with protrusions, such as microvillus. Our data suggest that increases in epithelial permeability, destructions of tight junctions, and morphological changes could be studied using the EIS method. Thus, EIS could provide a suitable tool for the evaluation of the electrical functionality and barrier properties of stem cell-derived cells. Furthermore, EIS could be used in vitro to characterize and evaluate the effects of toxins and drugs on cell behavior: EIS measurement can reveal changes in cell shape, for example, during apoptosis (Arndt et al. 2004; endothelial cells). Drugs, toxins, and other compounds can alter the tight junction structure and the permeability of human RPE (Rajasekaran et al. 2003), which, as our results showed, can be followed using EIS measurements.
In Publication I, the electrical properties of two different RPE cell types (ARPE-19 and hESC-RPE cells) were compared. In our study, ARPE-19 cells were immature (ZO-1 were localized on stress fibers), but in other studies (Dunn et al. 1996; Mannermaa et al. 2010; Nevala et al. 2008; Toimela et al. 2004) the ARPE-19 cells were mature. Due to the immaturity of the ARPE-19 cells, we were not able to compare the electrical parameter values with other studies. It would have been interesting to compare the TER values of ARPE-19 cells obtained from the EIS data fitting to the values obtained using conventional measurements setups. However, the ARPE-19 data validated that our measurement setup clearly shows differences between the mature and immature cell cultures. In Publication II, we used 13 hESC-RPE samples at different stages of maturity. While the integrity of the cell layer increased (TER value increased, permeability of small molecular weight particles decreased), the plateau in the impedance magnitude became narrower and higher, indicating higher low-frequency impedance and decreased cut-off frequency. The phase peak was shifted to lower frequencies. Thus, similar differences between the cell groups having different stage of maturity were seen in the Publication II as in Publication I between the hESC-RPE and ARPE-19 cells. It would be worthy of research to also carry out EIS measurements for other widely used RPE cell types such as iPS-derived RPE and human RPE cultured in vitro.
Sources of errors of the EIS measurement setup were previously estimated in the Master of Science thesis of Savolainen (2011). We noticed that repeatability was good indicating that impedance spectra were stabile from sweep to sweep. Different wells of the well plate were giving slightly different impedance values, but the differences were only resistive and probably due to medium amount changes. The variations in the amount of medium or in the electrode contact area, however, cancel out in equivalent circuit fitting. The main element values, i.e., tissue resistance and capacitance are not affected. The effects of electrodes, electrolyte, and empty insert have to be taken into account when forming equivalent circuits representing the measured biological system, for example epithelium. For tissues that have high impedance, the effect of bulk (electrodes,

Discussion
55
electrolyte, empty filter insert) on impedance responses is minor, whereas for low resistance tissues such as ARPE-19 cells in Publication I, the bulk affects the modeled electrical parameters.
Our results emphasize that the choice of the right electrical equivalent circuit has to be done with both biological and physical aspects in mind. For example, the electrical functionality shown by the ARPE-19 response can be produced with several different models, i.e. the response of the epithelium could have been modeled with two RC circuits in series or in parallel. Either model may indicate mature cells, for example with diverged apical and basal processes or heterogeneous cell sheet. In our study, immature ARPE-19 cells without well-developed tight junctions could not provide diverged apical and basal processes (Rizzolo 2007). Careful examination of the responses indicated that the second order behavior originated from the measurement setup, not from the cells.
We used an equivalent electrical circuit that discriminates between epithelial resistance and capacitance. This was not a complete model, however, because the epithelial resistance could be divided into paracellular and transcellular resistance (Krug et al. 2009), the apical and basal sides could have their own electrical equivalent circuits (Schifferdecker and Frömter 1978), and theoretically, different cell parts and each ion channel could be modeled separately. However, to define the parameter values of such detailed models would require intracellular measurements, microelectrodes inside the cells, patch clamping, or blocking the ion diffusion in specific electrical pathways of the epithelium. This would mean that the measurement was no longer non-invasive. Our measurement setup is intended for a macro-scale measurement that represents the properties of the whole cell layer. The setup is designed for the non-invasive follow-up of the entire developing epithelia.
The EIS method can be automated and, thus, it can provide automated follow-up of the cell differentiation and maturation. It provides an objective way for the biologists to estimate the goodness of a cell graft objectively, as they do not have to check the confluence nor pigmentation only by looking. As concluded in Publication I and II, there is no direct correlation between the culture period and integrity. Despite similar culturing conditions, the same seeding time and density, and origin of the cultured cells, the individual cell grafts had slightly different electrical properties. This indicates that there are many other factors, such as growth factors, that determine the development of polarity in individual cultures (Harhaj and Antonetti 2004). Furthermore, this highlights the need for an automated non-invasive method for the follow-up of the cell culture differentiation.
6.2.2 EIS as a fixed part of the cell differentiation environment
At the moment, there are two methods to replace RPE cells. New cell candidates can be injected into the subretinal space in suspension: the cell aggregates float in a medium that is injected by needle in to the right place (e.g., Carr et al. 2009; da Cruz et al. 2007). The other method is to seed the cells as a monolayer growth on a graft (e.g., Maaijwee et al. 2006). Aged submacular Bruch’s membrane does not necessarily support the long-

Discussion
56
term survival of transplanted RPE (da Cruz et al. 2007) and, thus, reconstruction of the Bruch’s membrane may be as important as the replacement of RPE cells in cell replacement therapy (Del Priore et al. 2006). The artificial graft mimicking the Bruch’s membrane could help the RPE cells to reach a monolayer organization. Furthermore, the biomimetic graft could make the transition from in vitro culture to in vivo situation easier, and a nondegradable graft could provide long lasting support for transplanted RPE cells (da Cruz et al. 2007; Yao et al. 2011).
The transportation functions of RPE are based on the polarization of the epithelium (Zhu et al. 2011). Potential gradient and ion concentration differences on different sides of the epithelium are due to the polarized nature of the apical and basal membranes of the epithelium (Rizzolo 2007). An environment that supports the polarization of the RPE may be already important in the differentiation phase. We noticed in our Publication III, that although morphologically the polarization of the hESC-RPE cells was seen as tight junction formation and localization onto the cell boundaries, electrical polarization was still unfinished. The measured TEP values were both negative and positive. This means that the directional transport, i.e. the polarized electrical functionality, was not yet fully established in these epithelia.
If the cells were differentiated on the biomimetic graft between two different medium chambers, the chambers could provide an environment for a measurement setup that would enable the EIS follow-up of the developing epithelia. An artificial graft mimicking the Bruch’s membrane should be porous to enable the metabolism between choroid and RPE after the RPE transplantation. Furthermore, porous material enables the current flow through the graft and, thus, enables the EIS measurements and electrical stimulation. During the differentiation of the cells, the medium and growth factor concentrations are controlled. In addition, the pressure and electrical potential difference as well as other chemical and physical factors between the chambers could be adjusted. The electrodes used in EIS measurements would provide the possibility to control the electrical environment of the cell culture.
The development of this kind of new differentiation system would be worthy of research aimed at a more developed manufacturing process for the differentiation of stem cells. At the moment, there are no RPE cell differentiation systems available that would enhance the cell functionalization. Cell differentiation is performed in normal cell culturing conditions that do not necessarily support the functionalization of the cells: medium ion and growth factor concentrations can be controlled to guide the differentiation, but the control of the electrical environment is not used to our knowledge. The maturation process could be followed online as the EIS measurement could be integrated in the cell culture environment. Cell replacement therapies can be predicted to increase and, thus, the differentiation methods also have to be optimized and automated.
6.3 Increasing resolution of retinal implants
A retinal implant can provide artificial vision for blind people by electrically stimulating the remaining retinal cell layers. If the central eyesight is mostly gone but some

Discussion
57
neuroretinal cells remain, both cell replacement therapy and a retinal implant may be beneficial: a retinal implant could stimulate the remaining neural cells, whereas the replaced functional RPE would support the metabolism and, thus, prevent the progression of retinal damage.
High resolution of the retinal implant enables sharp visual sensation: Reducing the electrode size will enable more electrodes within the implant and, thus, more pixels per degree of visual angle. New techniques enable the production of very tiny and dense electrode arrays. For example, Fiscella et al. (2012) have produced a high-density MEA with 11,011 platinum electrodes at an electrode density of 3,150 electrodes per mm2. However, there are several aspects that challenge the possibilities to produce high resolution. The power transmission via magnetic fields and induction induces heat. Heat increase is not healthy for the tissues and, thus, the power consumption of the implant should be minimized. Reducing the driving voltage and hence the power required to inject the stimulus pulse is achieved by using a material with high charge injection capacity and low impedance (Cogan et al. 2009). In this thesis, we defined the electrochemical properties of five different electrode materials [III]. As our results have shown, small electrodes may not have a great enough charge capacity to produce the required stimulus intensity. Ir-b and Pt-b clearly exhibited a higher charge injection capacity than Au, Ti, and TiN. Pt-b had the lowest impedance at a frequency of 100 Hz.
In this thesis, the electrodes were produced on a Si wafer by using standard photolithographic techniques [III]. The methods used for electrode processing can vary depending on the material that is used. The charge carrying capacity of iridium electrodes can be increased by forming iridium oxide on the electrode surface (Weiland and Anderson 2000). For example, AIROF is formed from iridium metal by electrochemical potential cycling in an aqueous electrolyte. More oxide is grown with each cycle (Weiland and Anderson 2000). In addition, iridium oxides can be produced using electrodeposition or thermal decomposition of iridium salt solutions. Furthermore, SIROFs can be deposited on different metals and patterned by photolithography (Cogan et al. 2009). High-porosity fractal TiN is formed by reactive sputtering (Cogan et al. 2009). Titanium has excellent corrosion resistance due to a thin passive film forming spontaneously on the surface when oxygen is present. Furthermore, the native oxide thickness can be increased by anodic polarization. The oxidation conditions determine whether the film grows dense or porous, amorphous or crystalline, or as arrays of nanotubes (Jaeggi et al. 2012).
Iridium oxides are porous, hydrous, multilayer oxide films (Weiland and Anderson 2000). The charge injection capacity of SIROF can be increased by increasing the thickness of the SIROF coating (Cogan et al. 2009). At frequencies below 103 Hz, the impedance also decreases with increasing film thickness (Cogan et al. 2009). Increasing the film thickness of SIROF changes the surface morphology of the electrode from smooth and featureless to nodular and rough (Cogan et al. 2009). Titanium oxides have excellent resistance to corrosion indicated by a low level of electronic conductivity, thermodynamically great stability, and a low ion-formation tendency in aqueous environments (Sul et al. 2001).
At the moment, the development of the electrode materials research is directed towards increased roughness and the porosity of stimulation electrodes: porous materials allow

Discussion
58
higher initial charge transfer capacity because of their large real surface area (Cogan et al. 2009). In addition, conducting polymers and their use as electrode coating is being studied (Ates 2011). The implant design focuses on exploiting materials that are durable and do not erode in the body. The coating of retinal implant electrodes with conductive polymers or carbon nanotube based structures could further increase the biocompatibility of the electrodes (Ates 2011; Wang 2005; Yao et al. 2011). Carbon nanotube electrodes may provide a better coupling between the retinal tissue and the electrodes than conventionally used TiN electrodes (Eleftheriuou et al. 2012). In addition, Stamm et al. (2012) have shown that carbon nanotube electrodes have 50 % lower impedance at 1 kHZ than TiN electrodes used in the standard MEA (Multi Channel Systems GmbH).
The electrochemical characterization methods used in Publication III were further used in (Savolainen et al. 2012) to test the electrical properties of polypyrrole coated electrodes. Polypyrrole has ability to give high electrical conductivity, good environmental stability in the oxidized form, relative ease of synthesis, and good redox reversibility (Ates 2011). We predict that the polypyrrole coating would be stable in long-term stimulation and that it is more biocompatible than conventional electrode materials. The stability of electrical properties will be tested using various standard biomaterial tests such as wetting in body mimicking liquids to model the long-term implantation or in vitro cultivation environments. In addition, the stability of the electrodes in long-term stimulation will be tested. Cytotoxicity testing in vitro using hESC-RPE cells could provide novel information about the biocompatibility of electrode materials used in retinal applications. Cytotoxicity, however, is a multifaceted problem and also requires other methods to be studied properly.
An open question is how the retinal tissues tolerate the electrical stimulation. Stimulus parameters should be adjusted at an appropriate level for the tissues. A threshold current to induce action potential in retinal cells has been studied but it is difficult to define any generalized recommendations: Thresholds vary between blind patients and patients with eye disease depending on the severity of the disease (de Balthasar et al. 2008; Humayun et al. 1999; Koch et al. 2008; Rizzo et al. 2003). In addition, the threshold current depends on the region of the retina to be stimulated (Humayun et al. 1999) and the on the stimulus duration.

60
7 CONCLUSIONS
The purpose of this thesis was to develop new methods to study the functionality of hESC-RPE cells in vitro. A second aim of this thesis was to study the electrode materials used in retinal implants that could be used to provide artificial vision for blind people and to provide objective data about the electrochemical properties of different electrode materials used in retinal implants.
Electrical impedance spectroscopy (EIS) was applied to hESC-RPE cell culture characterization. It was found that the electrical parameters analyzed from EIS using an equivalent electrical circuit gave information about the barrier properties and the morphology of the epithelial cell culture. In this work, it was demonstrated that EIS measurements provide information about the maturity and goodness of the differentiated RPE cell culture. We showed that differences between the EIS curves of immature and mature cell cultures were clear.
Permeability measurements using conventional biological methods (small fluorescent particles) had correlation to impedance data for high integrity samples. Based on our results, EIS could provide a useful tool to validate the maturity and basic electrical functionality of RPE noninvasively during culture and before implantation to assure the efficacy of the transplantation.
Electroretinograms (ERG) were measured with the microelectrode array (MEA) from the mouse retina alone and from the co-culture of retina and RPE in vitro. Small number of samples was a problem: Due to biological variation in the hESC-RPE cells and retina samples and possible differences in the electrode-tissue distances between the samples, our results were mixed. We could not prove the assumption that RPE cells enhance the ERG response of the retina cultured in vitro. However, the method itself may be useful and ERG measurements from the co-culture of RPE cells and retina have potential to be used as a tool for assessing the functionality of stem cell-derived RPE cells. In addition, novel methods for the long-term culturing of the retina have to be investigated to get the full potential of the method.
Electrodes of different sizes and materials were employed and compared for their impedance response, charge capacity, and surface roughness. We used the same measurement setup and circumstances for all electrodes and provided

Conclusions
61
comparable data about the electric properties of various electrode materials. CV and EIS methods proved to be suitable for future studies and they are also used in on-going material testing made for novel conductive polymer coated electrodes. [III]

62
8 References
Ahuja AK, Dorn JD, Caspi A, McMahon MJ, Daqnelie G, da Cruz L, Stanga P, Humayun MS, Greenberg RJ and Argus II Study Group. Blind subjects implanted with the Argus II retinal prosthesis are able to improve performances in a spatial-motor task. British Journal of Ophthalmology, 95(4):539-543, 2010.
Algvere PV, Berglin L, Gouras P, Sheng Y, Kopp ED. Transplantation of RPE in age-related macular degeneration: Observations in disciform lesions and dry RPE atrophy. Graefe’s Archive for Clinical and Experimental Ophthalmology, 235(3):149-158, 1997.
Arndt S, Seebach J, Psathaki K, Galla H-J, Wegener J. Bioelectrical impedance assay to monitor changes in cell shape during apoptosis. Biosensors and Bioelectronics,19:583-594, 2004.
Ates Murat. Review study of electrochemical impedance spectroscopy and equivalent electrical circuits of conducting polymers on carbon surfaces. Progress in Organic Coatings, 71:1-10, 2011.
de Balthasar C, Patel S, Roy A, Freda R, Greenwald S, Horsager A, Mahadevappa M, Yanai D, McMahon MJ, Humayun MS, Greenberg RJ, Weiland JD, Fine I. Factors Affecting Perceptual Thresholds in Epiretinal Prostheses. Investigative Ophthalmololgy & Visual Science, 49(6):2303-2314, 2008.
Beebe X, Rose TL. Charge injection limits of activated iridium oxide electrodes with 0.2 ms pulse bicarbonate buffered saline. IEEE Transactions on Biomedical Engineering, 35(6):494-495, 1988.
Bera SC, Chattopadhyay S, Chakraborty B. An experimental analysis of the non-linear behaviour of a bio-electrode polarisation impedance with excitation frequency. Measurement, 35:363-370, 2004.
Brindley G, Lewin W. The sensations produced by electrical stimulation of the visual cortex. Journal of Physiology, 196(2):479-493, 1968.
Brummer SB, Turner MJ. Electrical stimulation with Pt electrodes: I – A method for determination of “real” electrode areas & II – Estimation of maximum surface redox (theoretical non-gassing) limits. IEEE Transactions on Biomedical Engineering, BME24(5):436-443, 1977.
Brummer SB, Robblee LS, Hambrecht FT. Criteria for selecting electrodes for electrical stimulation: Theoretical and practical considerations. Annals of the New York Academy of Sciences, 405:159-171, 1983.

References
63
Campbell PK, Jones KE. Materials for implantable electrodes and electronic devices. Materials Science and Technology, A Comprehensive Treatment: Medical and Dental Materials, 14(10):345-372, 1992.
Carr A-J, Vugler AA, Hikita ST, Lawrence JM, Gias C, Chen LL, Buchholz DE, Ahmado A, Semo M, Smart MJK, Hasan S, da Cruz L, Johnson LV, Clegg DO, Coffey PJ. Protective Effects of Human iPS-Derived Retinal Pigment Epithelium Cell Transplantation in the Retinal Dystrophic Rat. PLoS ONE 4(12): e8152, DOI:10.1371/journal.pone.0008152, 2009.
Cha K, Horch KW, Normann RA. Mobility performance with a pixelized vision system. Vision Research, 32(7):1367-1372, 1992.
Chang C-Y, Pop GAM, Meijer GCM. A comparison of two- and four-electrode techniques to characterize blood impedance for the frequency range of 100 Hz to 100 MHz. IEEE Transactions on Biomedical Engineering, 55:1247-1249, 2008.
Chow AY, Chow VY, Packo KH, Pollack JS, Peyman GA, Schuchard R. The artificial silicon retina microchip for the treatment of vision loss from retinitis pigmentosa. Archives of Opthalmology, 122:460-469, 2004.
Cia D, Cluzel J, Jacquemot N, Doly M. Effects of bevacizumab (Avastin®) on the electroretinogram of isolated rat retina. Ophthalmic research, 46(3):145-151, 2011.
Coffey PJ, Girman S, Wang SM, Hetherington L, Keegan DJ, Adamson P, Greenwood J, Lund RD. Long-term preservation of cortically dependent visual function in RCS rats by transplantation. Nature Neuroscience, 5(1):53-56, 2002.
Cogan SF, Plante TD, Ehrlich J. Sputtered iridium oxide films (SIROFs) for low-impedance neural stimulation and recording electrodes. Proceedings of the 26th Annual International Conference of the IEEE EMBS, San Francisco, CA, USA, 1 – 5 September, 2004.
Cogan SF, Ehrlich J, Plante TD, Smirnov A, Shire DB, Gingerich M, Rizzo JF. Sputtered Iridium Oxide films for neural stimulation electrodes. Journal of Biomedical Materials Research Part B: Applied Biomaterials, 89B(2):353-361, 2009.
da Cruz L, Chen FK, Ahmado A, Greenwood J, Coffey P. RPE transplantation and its role in retinal disease. Progress in Retinal and Eye Research, 26(6):598-635, 2007.
Defoe DM, Ahmad A, Chen W, Hughes BA. Membrane polarity of the Na+ - K+ Pump in Primary Cultures of Xenopus Retinal Pigment Epithelium. Experimental Eye Research, 59(5):587-596, 1994.
Deguchi J, Watanabe T, Nakamura T, Nakagawa Y, Fukushima T, Shim J-C, Kurino H, Abe T, Tamai M, Koyanagi M. Three-dimensionally stacked analog retinal prosthesis chip. Japanese Journal of Applied Physics, 43(4B):1685-1689, 2004.
Del Priore LV, Tezel TH, Kaplan HJ. Maculoplasty for age-related macular degeneration: reengineering Bruch’s membrane and the human macula. Progress in Retinal and Eye Research, 25:539-562, 2006.
Depaola N, Phelps JE, Florez L, Keese CR, Minnear FL, Giaver I, Vincent P. Electrical impedance of cultured endothelium under fluid flow. Annals of Biomedical Engineering, 29:648/656, 2001.

References
64
Dobelle WH, Mladejowski WG. Phosphenes produced by electrical stimulation of human optical cortex, and their application to the development of a prosthesis for the blind. Journal of Physiology, 243(553), 1974.
Dobelle WH. Artificial vision for the blind by connecting a television camera to the visual cortex. American Society for Artificial Internal Organs Journal, 46:3-9, 2000.
Dunn KC, Aotaki-Keen AE, Putkey FR, Hjelmeland LM. ARPE-19, a human retinal pigment epithelial cell line with differentiated properties. Experimental Eye Research, 62(2):155-170, 1996.
Dymond AM, Kaechele LE, Jurist JM, Crandall PH. Brain tissue reaction to some chronically implanted materials. Journal of Neurosurgery, 33(5):574-580, 1970.
Eleftheriou CG, Zimmermann J, Kjeldsen H, Pur MD, Hanein Y, Serganor E. Towards the development of carbon nanotube-based retinal implant technology: Electrophysiological and ultrastructural evidence of coupling at the biohybrid interface. In the Proceedings of the MEA Meeting 2012, Reutlingen, 10 – 13 July, 2012.
Enseleit F, Michels S and Ruschitzka F. Anti-VEGF therapies and blood pressure: more than meets the eye. Current Hypertension Reports, 12(1):33-38, 2010.
Falkner-Radler C, Krebs I, Glittenberg C, Považay B, Drexler W, Graf A, Binder S. Human retinal pigment epithelium (RPE) transplantation: outcome after autologous RPE-choroid sheet and RPE cell-suspension in a randomised clinical study. British Journal of Ophthalmology, 95:370-375, 2011.
Fiscella M, Farrow K, Jones IL, Jäckel D, Müller J, Frey U, Bakkum DJ, Roska B, Hierlemann A. Targeting defined populations of retinal ganglion cells with CMOS microelectrode arrays. In the Proceedings of the MEA Meeting 2012, Reutlingen, 10 – 13 July, 2012.
Foster KR. Herman P. Schwan: a scientist and pioneer in biomedical engineering. Annual Review of Biomedical Engineering, 4:1-27, 2002.
Foerster O. Beitriige zur Pathophysiologie der Sehbahn und der Sehsphare. Journal of Psychology & Neuroscience, 39:463-485, 1929.
Frambach DA, Fain GL, Farber DB, Bok D. Beta adrenergic receptors on cultured human retinal pigment epithelium. Investigative Ophthalmolology & Visual Science, 31(9):1767-1772, 1990.
Gabriel C, Gabriel S, Corthout E. The dielectric properties of biological tissues: I. literature survey. Physics in Medicine and Biology, 41:2231-2249, 1996.
Gearhart J. New human embryonic stem cell lines - more is better. The New England Journal of Medicine, 350:1275-1276, 2004.
Giaever I, Keese CR. Micromotion of mammalian cells measured electrically. Proceedings of the National Academy of Sciences of the United States of America, 88(17):7896-7900, 1991.
Giaever I, Keese CR. Monitoring fibroblast behaviour in tissue culture with an applied electric field. Proceedings of the National Academy of Sciences of the United States of America, 81(12):3761-3764, 1984.

References
65
Gitter AH, Schulzke J-D, Sorgenfrei D, Fromm M. Ussing chamber for high-frequency transmural impedance analysis of epithelial tissues. Journal of Biochemical and Biophysical Methods, 35(2):81-88, 1997.
Granit R. The components of the retinal action potential in mammals and their relation to the discharge in the optic nerve. Journal of Physiology, 77:207-239, 1933.
Grimnes S, Martinsen OG (Eds.). Bioimpedance and bioelectricity basics. 2nd ed., Oslo, Norway, Academic Press, 2008.
Guenther E, Tröger B, Schlosshauer B, Zrenner E. Long-term survival of retinal cell cultures on retinal implant materials. Vision Research, 39(24):3988-3994, 1999.
Guo M, Chen J, Yun X, Chen K, Nie L, Yao S. Monitoring of cell growth and assessment of cytotoxicity using electrochemical impedance spectroscopy. Biochimica et Biophysica Acta, 1760:432-439, 2006.
Harhaj NS, Antonetti DA. Regulation of tight junctions and loss of barrier function in pathophysiology. International Journal of Biochemistry & Cell Biology, 36(7):1206-1237, 2004.
Haruta M, Sasai Y, Kawasaki H, Amemiya K, Ooto S, Kitada M, Suemori H, Nakatsuji N, Ide C, Honda Y, Takahashi M. In Vitro and In Vivo Characterization of Pigment Epithelial Cells Differentiated from Primate Embryonic Stem Cells. Investigative Ophthalmology & Visual Science, 45(3):1020-1025, 2004.
Heckenlively JR, Arden GB. Principles and Practise of Clinical Electrophysiology of Vision, 2nd ed. MIT Press, USA 2006.
Hinton AJ, Sayers B. Advanced instrumentation for bioimpedance measurements. Solartron, Victoria Rd., Farnborough, Hampshire, UK, 1998.
Hirano M, Yamamoto A, Yoshimura N, Tokunaga T, Motohashi T, Ishizaki K, Yoshida H, Okazaki K, Yamazaki H, Hayashi S-I, Kunisada T. Generation of structures formed by lens and retinal cells differentiating from embryonic stem cells. Developmental Dynamics, 228(4):664-671, 2003.
Homma K, Osakada F, Hirami Y, Jin Z-B, Mandai M, Takahashi M. Detection of Localized Retinal Malfunction in Retinal Degeneration Model Using a Multielectrode Array System. Journal of Neuroscience Research, 87(9):2175-2182, 2009.
Hongya L., Sheppard DN, Hug MJ. Transepithelial electrical measurements with the Ussing chamber. Journal of Cystic Fibrosis, 3(2):123-126, 2004.
Hornof M, Toropainen E, Urtti A. Cell culture models of the ocular barriers. European Journal of Pharmaceutics and Biopharmaceutics, 60(2):207-225, 2005.
Humayun MS, de Juan Jr E, Weiland JD, Dagnelie G, Katona S, Greenberg R, Suzuki S. Pattern electrical stimulation of the human retina. Vision Research, 39(15):2569-2576, 1999.
Humayun MS, Prince M, de Juan Jr E, Barron Y, Moskowitz M, Klock IB, Milam AH. Morphometric analysis of the extramacular retina from postmortem eyes with retinitis pigmentosa. Investigative Ophthalmology & Visual Science, 40(1):143-138, 1999.

References
66
Idelson M, Alper R, Obolensky A, Ben-Shushan E, Hemo I, Yachimovich-Cohen N, Khaner H, Smith Y, Wiser O, Gropp M, Cohen MA, Even-Ram S, Berman-Zaken Y, Matzrafi L, Rechavi G, Banin E, Reubinoff B. Directed Differentiation of Human Embryonic Stem Cells into Functional Retinal Pigment Epithelium Cells. Cell Stem Cell, 5(4):396-408, 2009.
Inoue Y., Iriyama A, Ueno S, Takahashi H, Kondo M, Tamaki Y, Araie M, Yanagi Y. Subretinal transplantation of bone marrow mesenchymal stem cells delays retinal degeneration in the RCS rat model of retinal degeneration. Experimental Eye Research, 85(2):234-241, 2007.
Ishikane H, Ganqi M, Honda S, Tachibana M. Synchronized retinal oscillations encode essential information for escape behavior in frogs. Nature Neuroscience, 8(8):1087-1095, 2005.
Jaeggi C, Parlinska-Wojtan M, Kern P. Correlation of electrolyte-derived inclusions to crystallization in the early stage of anodic oxide film growth on titanium. Thin Solid Films, 520:1804-1808, 2012.
Jin G-H, Ye JH, Lee TS, Goo YS. Electrical stimulation of isolated rabbit retina. Engineering in Medicine and Biology 27th Annual Conference, Shanghai, China, pp. 5967-5970, 2005.
Johnson D from the software and applications support of the Scribner, personal communication, March 8th 2012.
Johnson TV, Martin KR. Development and characterization of an adult retinal explant organotypic tissue culture system as an in vitro intraocular stem cell transplantation model. Invest. Ophthalmology and Visual Science, 49:3503-3512, 2008.
Joseph DP, Miller SS. Apical and vasal membrane ion transport mechanisms in bovine retinal pigment epithelium. Journal of Physiology, 435:439-463, 1991.
Jovov B, Wills NK, Lewis SA. A spectroscopic method for assessing confluence of epithelial cell cultures. American Journal of Physiology - Cell Physiology, 261(6):C1196-C1203, 1991.
Juuti-Uusitalo K, Mäki M, Kainulainen H, Isola J, Kaukinen K. Gluten affects epithelial differentiation-associated genes in small intestinal mucosa of coeliac patients. Clinical & Experimental Immunology, 150(2):294-305, 2007.
Kaempf S, Walter P, Salz AK, Thumann G. Novel organotypic culture model of adult mammalian neurosensory retina in co-culture with retinal pigment epithelium. Journal of Neuroscience Methods, 173:47-58, 2008.
Kaufman PL, Alm A. Adler’s Physiology of the Eye – Clinical Application, 10 th ed., Mosby, USA, 2003.
Kawasaki H, Suemori H, Mizuseki K, Watanabe K, Urano F, Ichinose H, Haruta M, Takahashi M, Yoshikawa K, Nishikawa S-I, Nakatsuji N, Sasai Y. Generation of dopaminergic neurons and pigmented epithelia from primate ES cells by stromal cell-derived inducing activity. Proceedings of the National Academy of Sciences of the United States of America, 99(3):1580-1585, 2002.
Keese CR, Wegener J, Walker SR, Giaver I. Electrical wound-healing assay for cells in vitro. Proceedings of National Academy of Sciences of the United States of America, 101(6):1554-1559, 2004.

References
67
Kim ET, Seo JM, Zhou JA, Kirn SJ. A retinal implant technology based on flexible polymer electrode and optical/ electrical stimulation. IEEE International Workshop on Biomedical Circuits and Systems, 1-3 Dec, doi: 10.1109/BIOCAS.2004.1454190, 2004.
Klimanskaya I, Hipp J, Rezai KA, West M, Atala A, Lanza R. Derivation and comparative assessment of retinal pigment epithelium from human embryonic stem cells using transcriptomics. Cloning and Stem Cells, 6(3):217-245, 2004.
Kobuch K, Herrmann WA, Framme C, Sachs HG, Gabel V-P, Hillenkamp J. Maintenance of adult porcine retina and retinal pigment epithelium in perfusion culture: Characterisation of an organotypic in vitro model. Experimental Eye Research, 86(4):661-668, 2008.
Koch C, Mokwa W, Goertz M, Walter P. First results of a study on a completely implanted retinal prosthesis in blind humans. Sensors, IEEE Sensors, 26 – 29 Oct, doi: 10.1109/ICSENS.2008.4716667, 2008.
Koizumi A, Zeck G, Ben Y, Masland RH, Jakobs TC. Organotypic culture of physiologically functional adult mammalian retinas. PLoS ONE, 2(2):e221, 2007.
Kolb H, Nelson R, Fernandez E, Jones B (eds.). Webvision – The Organization of the Retina and Visual System. University of Utah, WordPress. Online textbook. [Internet]. Available: http://webvision.med.utah.edu/book/, [accessed 20.3.2012]
Kolomiets B, Dubus E, Simonutti M, Rosolen S, Sahel JA, Picaud S. Functional Properties of Retinal Ganglion Cells in P23H Homozygote Rat Model of Retinitis Pigmentosa During Photoreceptor Degeneration. Neurobiology of Disease, 38(1):47-58, 2010.
Komiya K, Kobayashi R, Kobayashi T, Sato K, Fukushima T, Tomita H, Kurino H, Tanaka T, Tamai M, Koyanagi M. Power supply system using electromagnetic induction for three-dimensionally stacked retinal prosthesis chip. Japanese Journal of Applied Physics, 47(4):3244-3247, 2008.
Kretz A, Hermening SH, Isenmann S. A novel primary culture technique for adult retina allows for evaluation of CNS axon regeneration in rodents. Journal of Neuroscience Methods, 136:207-219, 2004.
Krug SM, Fromm M, Günzel D. Two-path impedance spectroscopy for measuring paracellular and transcellular epithelial resistance. Biophysical Journal, 97(8):2202-2211, 2009.
Lee SW, Seo JM, Ha S, Kim ET, Chung H, Kim SJ. Development of microelectrode arrays for artificial retinal implants using liquid crystal polymers. Investigative Ophthalmology & Visual Science, 50:5859-5866, 2009.
Li L, Turner JE. Optimal conditions for long-term photoreceptor cell rescue in RCS rats: The necessity for healthy RPE transplants. Experimental Eye Research, 52(6):669-679, 1991.
Lo CM, Keese CR, Giaver I. Impedance analysis of MDCK cells measured by electric cell-substrate impedance sensing. Biophysical Journal, 69(6):2800-2807, 1995.
Lund D, Wang S, Klimanskaya I, Holmes T, Ramos-Kelsey R, Lu B, Girman S, Bischoff N, Sauvé Y, Lanza R. Human embryonic stem cell-derived cells rescue visual function in dystrophic RCS rats. Cloning and Stem Cells, 8(3):189-199, 2006.

References
68
Maaijwee KJ, van Meurs JC, Kirchhof B, Mooij NM, Mackiewicz J, Kobuch K, Joussen AM. Histological evidence for revascularization of an autologous RPE-choroid graft in the pig. Journal of Ophthalmology, 2006
Macdonald R. Review of Some Experimental and Analytical Equations of State. Reviews of Modern Physics, 41(2):316-349, 1969.
Macdonald R. LEVM/ LEVMW Manual, Version 8.11. CNLS (Complex Nonlinear Least Squares) – Immittance, Inversion, and Simulation Fitting Programs for WINDOWS and MS-DOS. [Internet]. Available: http://www.jrossmacdonald.com/LEVM/LEVMMANUAL.pdf, [accessed 20.3.2012].
Malmivuo J, Plonsey R. The Electric Signals Originating in the Eye. In Bioelectromagnetism: Principles and Applications of Bioelectric and Biomagnetic Fields, New York: Oxford University Press, 1995.
Maminishkis A, Chen S, Jalickee S, Banzon T, Shi G, Wang FE, Ehalt T, Hammer AJ, Miller SS. Confluent monolayers of cultured human fetal retinal pigment epithelium exhibit morphology and physiology of native tissue. Investigative Ophthalmology & Visual Science, 47(8):3612-3624, 2006.
Mannermaa E, Reinisalo M, Ranta VP, Vellonen KS, Kokki H, Saarikko A, Kaarniranta K, Urtti A. Filter-cultured ARPE-19 cells as outer blood-retinal barrier model. European Journal of Pharmaceutical Sciences, 40(4):289-296, 2010.
Marmor MF. From sea lemons to c-waves. Cellular and Molecular Neurobiology, 3(4):285-295, 1983.
Marquardt D. An Algorithm for Least-Squares Estimation of Nonlinear Parameters. SIAM Journal on Applied Mathematics, 11(2):431-441, 1963.
Mazinani BA, Vehr AK, Lin Y-L, Roessler GF, Plange N, Walter P. Which examination duration is required for a sufficient recording quality in multifocal ERG? Abstract in the Proceedings of the Association for Research in Vision and Ophthalmology, 2 – 6 May, Fort Lauderdale, Florida, USA, 2010.
Miklavcic D, Pavselj N, Hart FX. Electric properties of tissues. In: Wiley Encyclopedia of Biomedical Engineering, edited by M. Akay. New York, John Wiley & Sons, 2006, pp. 3578-3589.
MITCogNet, The Brain Sciences Connection, 2010. http://cognet.mit.edu/
Mokwa W. Ophthalmic Implants. Sensors, 2003. Proceedings of IEEE, doi: 10.1109/ICSENS.2003.1279089, 2003.
Monaim MA, Suleiman JH and Ashraf M. Morphological recovery in the reattached retina of the toad Bufo marinus: a new experimental model of retinal detachment, Archives of Medical Research, 36(2):107-112, 2005.
Motonami K, Watanabe T, Deguchi J, Fukushima T, Tomita H, Sugano E, Sato M, Kurino H, Tamai M, Koyanagi M. Evaluation of electrical stimulus current applied to retina cells for retinal prosthesis. Japanese Journal of Applied Physics, 45:3784-3788, 2006.

References
69
Nevala H, Ylikomi T, Tähti H. Evaluation of the selected barrier properties of retinal pigment epithelial cell line ARPE-19 for an in vitro blood-barrier model. Human & Experimental Toxicology, 27(10):741-749, 2008.
Newman E, Bartosch R. An eyecup preparation for the rat and mouse. Journal of Neuroscience Methods, 93:169-175, 1999.
Normann RA, Maynard EM, Guillory KS, Warren DJ. Cortical implants for the blind. IEEE Spectrum, 33:54-59, 1996.
Nusinowitz S, Ridder WH, Heckenlively JR. Electrophysiological testing of the mouse visual system. In Systematic Evaluation of the Mouse Eye: Anatomy, Pathology, and Biomethods, Smith R (Eds.), CRC Press, 2002.
Nöjd N (the maiden name of Niina Onnela), Ilmarinen T, Lehtonen L, Skottman H, Suuronen R, Hyttinen J. Using MEA system in verifying the functionality of retinal pigment epithelium cells differentiated from human embryonic stem cells. In the Proceedings of the 4th European Conference of the International Federation for Medical and Biological Engineering, Antwerp, Belgium, 23 – 27 November, 2008.
Oakley B. Potassium and the Photoreceptor-Dependent Pigment Epithelial Hyperpolarization. The Journal of General Physiology, 70(4):405-425, 1977.
Ohta J, Tokuda T, Kagawa K, Furumiya T, Uehara A, Terasawa Y, Ozawa M, Fujikado T, Tano Y. Silicon LSI-Based Smart Stimulators for Retinal Prosthesis - A Flexible and Extendable Microchip-Based Stimulator. Engineering in Medicine and Biology Magazine, IEEE, 25(5):47-59, 2006.
Ong JM, da Cruz L. The bionic eye: a review. Clinical and Experimental Ophthalmology, published online 20 Jul 2011.
Popkirov GS, Barsoukov E, Schindler RN. Investigation of conducting polymer electrodes by impedance spectroscopy during electropolymerization under galvanostatic conditions. Journal of Electroanalytical Chemistry, 425:209-216, 1997.
Quinn RH, Miller SS. Ion transport mechanisms in native human retinal pigment epithelium. Investigative Ophthalmology & Visual Science, 33(13):3513-3527, 1992.
Qwane Biosciences SA, Lausanne, Switzerland. [Internet]. Available: http://www.qwane.com/mea_MEA60biochips.html, [accessed: 20.3.2012].
Rahman A, Lo C-M, Bhansali S. A detailed model for high-frequecny impedance characterization of ovarian cancer epithelial cell layer using ECIS electrodes. IEEE Transactions on Biomedical Engineering, 56(2):485-492, 2009.
Rajasekaran SA, Hu J, Gopal J, Gallemore R, Ryazantsev S, Bok D, Rajasekaran AK. Na, K-ATPase inhibition alters tight junction structure and permeability in human retinal pigment epithelial cells. American Journal of Physiology - Cell Physiology, 284(6):C1497-C1507, 2003.
Ranchon I, Gorrand JM, Cluzel J, Droy-Lefaix MT, Doly M. Functional protection of photoreceptors from light-induced damage by dimethylthiourea and Ginkgo biloba extract. Investigative Ophthalmology & Visual Science, 40(6):1191-1199, 1999.

References
70
Reiter B, Kraft R, Gunzel D, Zeissig S, Schulzke J-D, Fromm M, Harteneck C. TRPV4-mediated regulation of epithelial permeability. FASEB Journal, 20:1802-1812, 2006.
Retina Implant AG, [Internet]. Available: www.retina-implant.de, [accessed 20.3.2012].
Riistama J. Characterisation of wearable and implantable physiological measurement devices. Thesis for the degree of Doctor of Technology, Department of Automation Science and Engineering, Tampere University of Technology, 2010.
Rizzo JF, Wyatt J, Loewenstein J, Kelly S, Shire D. Methods and Perceptual Thresholds for Short-Term Electrical Stimulation of Human Retina with Microelectrode Arrays. Investigative Ophthalmology & Visual Science, 44(12):5355-5361, 2003.
Rizzolo LJ. Development and role of tight junctions in the retinal pigment epithelium. International Review of Cytology, 258:195-234, 2007.
Robinson FR, Johnson MT. Histopathological studies of tissue reactions to various metals implanted in cat brains. Aeronautical Systems Div Wright-Patterson AFB Ohio Aterospace Medical Div, 1961.
Roessler G, Laube T, BrockmannC, Kirschkamp T, Mazinani B, Goertz M, Koch C, Krisch I, Sellhaus B, Trieu HK, Weis J, Bornfeld N, Röthgen H, Messner A, Mokwa W, Walter P. Implantation and explantation of a wireless epiretinal retina implant device: observations during the EPIRET3 prospective clinical trial. Investigative Ophthalmology & Visual Science, 50:3003-3008, 2009.
Rose TL, Robblee LS. Electrical stimulation with Pt electrodes. VIII. Electrochemically safe charge injection limits with 0.2 ms pulses. IEEE Transactions on Biomedical Engineering, 37(11):1118-1120, 1990.
Roth F, Bindewald A, Holz FG. Key pathophysiologic pathways in age-related macular disease. Greafe’s Archive for Clinical and Experimental Ophthalmology, 242(8):710-716, 2004.
Salzmann J, Guyomard JL, Linderholm OP, Kolomiets B, Kasi H, Paques M, Simonutti M, Dubus E, Rosolen S, Sahel J, Renaud P, Safran AB, Picaud S. Retinal prosthesis: testing prototypes on a dystrophic rat retina. 18th European Conference on Circuit Theory and Design, 27 – 30 Aug 2007, doi:10.1109/ECCTD.2007.4529596, 2007.
Santos A, Humayun MS, de Juan E Jr, Greenburg RJ, Marsh MJ, Klock IB, Milam AH. Preservation of the inner retina in retinitis pigmentosa; a morphometric analysis. Archives of Ophthalmolology, 115(4):511-515, 1997.
Savolainen V. Impedance measurements of retinal pigment epithelium. Master of Science Thesis, Tampere University of Technology, 2010.
Savolainen V, Hiltunen M, Albrecht K, Nymark S, Kellomäki M, Hyttinen J. Fabrication of electroconductive polypyrrole coatings on platinum electrodes. In the Proceedings of the MEA Meeting 2012, Reutlingen, 10 – 13 July, 2012.
Schanze T, Greve N, Hesse L. Towards the cortical representation of form and motion stimuli generated by a retina implant. Graefe’s Archive for Clinical and Experimental Ophthalmology, 241(8):685-693, 2003.

References
71
Schanze T, Hesse L, Lau C, Greve N, Haberer W, Kammer S, Doerge T, Rentzos A, Stieglitz T. An Optically Powered Single-Channel Stimulation Implant as Test System for Chronic Biocompatibility and Biostability of Miniaturized Retinal Vision Prostheses. IEEE Transactions on Biomedical Engineering, 54(6):983-992, 2007.
Schanze T, Wilms M, Eger M, Hesse L, Eckhorn R. Activation zones in cat visual cortex evoked by electrical retina stimulation. Graefe’s Archive for Clinical and Experimental Ophthalmology, 240(11):947-954, 2002.
Schifferdecker E, Frömter E. The AC impedance of necturus gallbladder epithelium. Pflügers Archive European Journal of Physiology, 377(2):125-133, 1978.
Schmidt EM, Bak MJ, Hambrecht FT, Kufta CV, O’Rourke DK, Vallabhanath P. Feasibility of a visual prosthesis for the blind based on intracortical microstimulation of the visual cortex. Brain, 119:507-522, 1996.
Schwan HP. Electrode polarization impedance and measurements in biological materials. Annals of New York Academy of Sciences, 148:191-209, 1968.
Schwiebert L, Gupta SKS, Auner PSG, Abrams G, Iezzi R, McAllister P. A biomedical smart sensor for the visually impaired. Proceedings of IEEE Sensors. Hyatt Orlando, FL, USA, 2002.
Scribner D, Johnson L, Skeath P, Klein R, Ilg D, Wasserman L, Fernandez N, Freeman W, Peele J, Perkins FK, Friebele EJ, Bassett WE, Howard JG, Krebs W. A Retinal Prosthesis Technology Based on CMOS Miscroelectronics and Microwire Glass Electrodes. IEEE Transactions on Biomedical Circuits and Systems, 1(1):73-84, 2007.
Sekirnjak C, Hottowy P, Sher A, Dabrowski W, Litke AM, Chichilnisky EJ. Electrical stimulation of mammalian retinal ganglion cells with multielectrode arrays. Journal of Neurophysiology, 95(6):3311-3327, 2006.
Sherwood L. Human Physiology: From Cells to Systems. Yolanda Cossio, Brooks/Cole - Thomson Leaning, 5th ed., 2004.
Skottman H. Derivation and characterization of three new human embryonic stem cell lines in Finland. In Vitro Cellular & Developmental Biology - Animal, 46(3-4):206-209, 2009.
Sonoda S, Spee C, Barron E, Ryan SJ, Kannan R, Hinton DR. A protocol for the culture and differentiation of highly polarized human retinal pigment epithelial cells. Nature Protocols, 4:662-673, 2009.
Stamm B, Schneider K, Herrmann T, Fleischer M, Burkhardt C, Nisch W, Kern DP, Stett A. Carbon nanotube electrodes for neuronal recording and stimulation. In the Proceedings of the MEA Meeting 2012, Reutlingen, 10 – 13 July, 2012.
Stelzle M, Stett A, Brunner B, Graf M, Nisch W. Micro-Photodiode Arrays as Artificial Retina Implant: Electrical Properties. Engineering in Medicine and Biology Society, Proceedings of the 22nd Annual International Conference of the IEEE, Chicago IL. 2000.
Stensaas SS, Stensaad LJ. Histopathological evaluation of materials implanted in the cerebral cortex. Acta Neuropathologica, 41:145-155, 1978.

References
72
Stieglitz T, Beutel H, Keller R, Blau C, Meyer J-U. Development of flexible stimulation devices for a retina implant system Engineering in Medicine and Biology Society, Proceedings of the 19th Annual International Conference of the IEEE, Chicago IL, 1997.
Stone JL, Barlow WE, Humayun MS, de Juan E Jr, Milam AH. Morphometric analysis of macular photoreceptors and ganglion cells in retinas with retinitis pigmentosa. Archives of Ophthalmology, 110:1634-1639, 1992.
Strauss O. The retinal pigment epithelium in visual function. Physiological Reviews, 85(3):845-881, 2005.
Sul Y-T, Johansson CB, Jeong Y, Albrektsson T. The electrochemical oxide growth behavior on titanium in acid and alkaline electrolytes. Medical Engineering & Physics, 23(5):329-346, 2001.
Sörensen SP. Development of a Cell-Based Drug Screening Platform - Extracellular Recording and Electrochemical Impedance Spectroscopy on Microelectrode Array chips. Thesis for the degree of Doctor of Philosophy, Department of Chemistry, University of Bath, 2007.
Tassiker G, Retinal stimulator. US patent 2,760,483. August 28, 1956.
Thomson JA, Itskovitz-Eldor J, Shapiro SS, Waknitz MA, Swiergiel JJ, Marshall VS, Jones JM. Embryonic stem cell lin3es derived from human blastocysts. Science, 282:1145-1147, 1998.
Toimela T, Mäenpää H, Mannerström M, Tähti H. Development of an in vitro blood-barrier model-cytotoxicity of mercury and aluminum. Toxicology and Applied Pharmacology, 195(1):73-82, 2004.
Trieu HK, Ewe L, Mokwa W, Schwarz M, Hosticka BJ. Flexible Silicon Structures for a Retina Implant. The 11th Annual International Workshop on Micro Electro Mechanical Systems, MEMS 98. Proceedings, 1998.
Vaajasaari H, Ilmarinen T, Juuti-Uusitalo K, Rajala K, Onnela N, Narkilahti S, Suuronen R, Hyttinen J, Uusitalo H, Skottman H. Towards defined and xeno-free differentiation of functional human pluripotent stem cell -derived retinal pigment epithelial cells. Molecular Vision, 17:558-575, 2011.
Wang J. Carbon-Nanotube Based Electrochemical Biosensors: A Review. Electroanalysis, 17(1):7-14, 2005.
Wang X, Peng C, Zhao Z, Luo X, Hu N, Zhang H. Research Progress of Subretinal Implant based on Electronic Stimulation. Engineering in Medicine and Biology Society, 27th Annual International Conference of the IEEE, Shanghai, doi:10.1109/IEMBS.2005.1616662, 2005.
Watanabe T, Kobayashi R, Komiya K, Fukushima T, Tomita H, Sugano E, Kurino H, Tanaka T, Tamai M, Koyanagi M. Evaluation of Platinum-Black Stimulus Electode Array for Electrical Stimulation of Retinal Cells in Retinal Prosthesis System. Japanese Journal of Applied Physics, 46(4B):2785-2791, 2007.
Wegener J, Hakvoort A, Galla H-J. Barrier function of porcine choroid plexus epithelial cells is modulated by cAMP-dependent pathways in vitro. Brain Research, 853(1):115-124, 2000.
Wegener J, Sieber M and Galla H-J. Impedance analysis of epithelial and endothelial cell monolayers cultured on gold surfaces. Journal of Biochemical and Biophysical Methods, 32(3):151-170, 1996.

References
73
Wegener J, Zink S, Rösen P, Galla H-J. Use of electrochemical impedance measurements to monitor β-adrenergic stimulation of bovine aortic endothelial cells. Pflügers Archiv European Journal of Physiology, 437(6):925-934, 1999.
Weiland J, Anderson D. Chronic Neural Stimulation with Thin-Film, Iridium Oxide Electrodes. IEEE Transactions on Biomedical Engineering, 47(7):911-918, 2000.
Veraart C, Raftopoulos C, Mortimer JT, Delbeke J, Pins D, Michaux G. Visual sensations produced by optic nerve stimulation using an implanted self-sizing spiral cuff electrode. Brain Research, 813:181-186, 1998.
Wessling B, Besmehn A, Mokwa W, Schnakenberg U. Reactively sputtered iridium oxide – Influence of plasma excitation and substrate temperature on morphology, composition, and electrochemical characteristics. Journal of Electrochemical Society, 154(5):F83-F89, 2007.
Wimmers S, Karl MO, Strauss O. Ion channels in the RPE. Progress in Retinal and Eye Research, 26(3):262-301, 2007.
World Health Organization (WHO), 2011. Prevention of Blindness and Visual Impairment. [Internet]. Available: http://www.who.int/blindness/en/, [accessed October, 2011].
Wu J, Peachey NS, Marmorstein AD. Light-evoked responses of the mouse retinal pigment epithelium. Journal of Neurophysiology, 91(3):1134-1142, 2004.
Yao J, Tao SL, Young M. Sythetic polymer scaffolds for stem cell transplantation in retinal tissue engineering. Polymers, 3:899-914, 2011.
Yuan X-Z, Song C, Wang H, Zhang J. Electrochemical Impedance Spectroscopy in PEM Fuel Cells: Fundamentals and Applications. Springer, 2010, Hardcover ISBN: 978-1-84882-845-2.
Zhu D, Deng X, Spee C, Sonoda S, Hsieh C-L, Barron E, Pera M, Hinton DR. Polarized secretion of PEDF from human embryonic stem cell-derived RPE promotes retinal progenitor cell survival. Investigative Ophthalmology & Visual Science, 52(3):1573-1585, 2011.
Zrenner E. Will Retinal Implants Restore Vision? Science, 295(5557):1022-1025, 2002.
Zrenner E, Wilke R, Sachs H, Bartz-Schmidt K, Gekeler F, Besch D, Greppmaier U, Harscher A, Peters T, Wrobel G, Wilhelm B, Bruckmann A, Stett A and SUBRET Study Group. Visual sensations mediated by subretinal microelectrode arrays implanted into blind retinitis pigmentosa patients. Proceedings of the 13th Annual Conference of the IFESS, 21 – 25 September, Freiburg, Germany, 2008.
ZView™: Operating Manual of the impedance/ gain phase graphing and analysis software. Version 3.2. Scribner Associates, Inc. Southern Pines, NC, USA, 2007.

