towards perspective-free object counting with deep...
TRANSCRIPT

Towards perspective-free object counting withdeep learning
Daniel Onoro-Rubio and Roberto J. Lopez-Sastre
GRAM, University of Alcala, Alcala de Henares, [email protected] [email protected]
Abstract. In this paper we address the problem of counting objectsinstances in images. Our models are able to precisely estimate the num-ber of vehicles in a traffic congestion, or to count the humans in a verycrowded scene. Our first contribution is the proposal of a novel convolu-tional neural network solution, named Counting CNN (CCNN). Essen-tially, the CCNN is formulated as a regression model where the networklearns how to map the appearance of the image patches to their co-rresponding object density maps. Our second contribution consists ina scale-aware counting model, the Hydra CNN, able to estimate objectdensities in different very crowded scenarios where no geometric infor-mation of the scene can be provided. Hydra CNN learns a multiscalenon-linear regression model which uses a pyramid of image patches ex-tracted at multiple scales to perform the final density prediction. Wereport an extensive experimental evaluation, using up to three differentobject counting benchmarks, where we show how our solutions achievea state-of-the-art performance.
1 Introduction
Take an image of a crowded scene, or of a traffic jam. We address here thehard problem of accurately counting the objects instances in these scenarios. Todevelop this type of ideas makes possible to build applications that span fromsolutions to improve security in stadiums, to systems that precisely monitor howthe traffic congestions evolve.
Note that the covered applications define the typical scenarios where in-dividual object detectors (e.g. [1, 2]) do not work reliably. The reasons are: theextreme overlap of objects, the size of the instances, scene perspective, etc. Thus,approaches modeling the counting problem as one of object density estimationhave been systematically defining the state-of-the-art [3–7]. For this reason, wepropose here two deep learning models for object density map estimation.
As illustrated in Figure 1, we tackle the counting problem proposing deeplearning architectures able to learn the regression function that projects theimage appearance into an object density map. This allows the derivation of anestimated object density map for unseen images.
The main contributions of this work are as follows. First, in Section 3.2,we propose a novel deep network architecture, named Counting CNN (CCNN),

2 Daniel Onoro-Rubio and Roberto J. Lopez-Sastre
CNN REGRESSOR
PATCH EXTRACTION FORWARD PASSDENSITY MAP
ASSEMBLY
Fig. 1. We define the object counting task like a regression problem where a deeplearning model has to learn how to map image patches to object densities.
which is an efficient fully-convolutional neural network able to perform an ac-curate regression of object density maps from image patches. Second, we showthat object densities can be estimated without the need of any perspective mapor other geometric information of the scene, in contrast to most of the state-of-the-art methods [3–8], which require this information. Thus, we introduce inSection 3.3 the Hydra CNN architecture, a scale-aware model, which works lear-ning a multiscale regressor for mapping the appearance of a pyramid of multiplescale patches to an object density map. Like the mythological Hydra creature,each head of our Hydra learns the feature representation for a particular scale ofthe pyramid. Then, all these head features are concatenated and passed througha set of fully-connected layers, forming the body of the Hydra, which is in chargeof learning the high-dimensional representation which performs the final densityestimation. Third, in Section 4, we report a thorough experimental validation ofthe proposed models. Three publicly available datasets are used, two for crowdcounting [4, 9] and one for vehicle counting [10]. We show how our solutionsreport state-of-the-art results in all these heterogeneous scenarios.
2 Related Work
Significant progress has been made to count objects in images. We refer thereader to the survey of Loy et al. [8]. Following the taxonomy introduced in [8],the algorithms can be classified into three groups: counting by detection [1, 2,11–16], counting by clustering [17, 18], and counting by regression [3–7, 19, 20].
Here we focus the review of the literature on the counting by regression mo-dels, because our approaches belong to this group too. But also because theseapproaches have so far been more accurate and faster, compared to the othergroups, defining the state-of-the-art results in most of the benchmarks. Essen-tially, these methods work defining a mapping from the input image featuresto the object count. A special attention deserves the learning-to-count model ofLempitsky et al. [6]. They introduce a counting approach, which works by lear-ning a linear mapping from local image features to object density maps. With asuccessful learning, one can provide the object count by simply integrating overregions in the estimated density map. This strategy is followed also in [5, 20]

Towards perspective-free object counting with deep learning 3
where a structured learning framework is applied to the random forests so as toobtain the object density map estimations. In [3], the authors propose an inte-ractive counting system, which simplifies the costly learning-to-count approach[6], proposing the use of a simple ridge regressor.
Our models also treat the counting problem as an object density estimationtask, but they are deep learning based approaches which significantly differ fromthese previous works. To the best of our knowledge, only two works [7, 21] haveaddressed the object counting problem with deep learning architectures. In [21]a multi-column CNN is proposed, which stacks the features maps generated byfilters of different sizes and combine them to generate the final prediction forthe count. Zhang et al. [7] propose a CNN architecture to predict density maps,which needs to be trained following a switchable learning process that uses twodifferent loss functions. Moreover, for the crowd counting problem they do notuse the direct density estimation of the network. Instead, they use the output ofthe network as features to fit a ridge regressor that actually performs the finaldensity estimation. Our models are different. First, the network architectures donot coincide. And second, we do not need to either integrate two losses or to usean extra regressor: the object density map is the direct output of our networks,which are trained with a single regression loss.
3 Deep learning to count objects
3.1 Counting objects model
Let us first formalize our notation and counting objects methodology. In thiswork, we model the counting problem as one of object density estimation [6].
Our solutions require a set of annotated images, where all the objects aremarked by dots. In this scenario, the ground truth density map DI , for an imageI, is defined as a sum of Gaussian functions centered on each dot annotation,
DI(p) =∑µ∈AI
N (p;µ,Σ) , (1)
where AI is the set of 2D points annotated for the image I, and N (p;µ,Σ)represents the evaluation of a normalized 2D Gaussian function, with mean µand isotropic covariance matrix Σ, evaluated at pixel position defined by p.With this density map DI , the total object count NI can be directly obtainedby integrating the density map values in DI over the entire image, as follows,
NI =∑p∈I
DI(p). (2)
Note that all the Gaussian are summed, so the total object count is preservedeven when there is overlap between objects.
Given this object counting model, the main objective of our work is to designdeep learning architectures able to learn the non-linear regression function R

4 Daniel Onoro-Rubio and Roberto J. Lopez-Sastre
CCNN
Conv1 Conv2 Conv3 Conv4 Conv5 Conv6
72x72x32 31x31x32 18x18x32 18x18x1000 18x18x400 18x18x1
7x7
3x3
7x7
1x1 1x1 1x1
18x18
72x72
Input ImagePatch
Density Prediction
Fig. 2. Our novel CCNN model. The input image patch is passed forward our deepnetwork, which estimates its corresponding density map.
that takes an image patch P as an input, and returns an object density map
prediction D(P )pred,
D(P )pred = R(P |Ω) , (3)
where Ω is the set of parameters of the CNN model. For the image patch P ∈Rh×w×c, h,w and c correspond to the height, width and number of channels
of the patch, respectively. In the density prediction D(P )pred ∈ Rh′×w′
, h′ and w′
represent the height and width of the predicted map. Thus, given an unseen testimage, our model densely extracts image patches from it, and generates theircorresponding object density maps, which are aggregated into a density map forthe whole test image.
3.2 The Counting CNN
We introduce in this section our first deep learning architecture, the CountingCNN (CCNN). It is shown in Figure 2. Let us dissection it.
The architecture consists of 6 convolutional layers. Conv1 and Conv2 layershave filters of size 7x7 with a depth of 32, and they are followed by a max-poolinglayer, with a 2x2 kernel size. The Conv3 layer has 5x5 filters with a depth of 64,and it is also followed by a max-pooling layer with another 2x2 kernel. Conv4 andConv5 layers are made of 1x1 filters with a depth of 1000 and 400, respectively.Note that we do not integrate any fully-connected layer in the model. With theseConv4 and Conv5 layers, we propose a fully convolutional architecture [22]. Allthe previous layers are followed by rectified linear units (ReLU). Finally, Conv6is another 1x1 filter with a depth of 1. Conv6 is in charge of returning the density
map estimation D(P )pred for the input patch P .
Like we specify in Equation (3), we want our deep network to learn a non-linear mapping from the appearance of an image patch to an object density map.Thus, our CCNN has to be trained to solve such a regression problem. For doingso, we connect to the Conv6 layer the following Euclidean regression loss,

Towards perspective-free object counting with deep learning 5
l(Ω) =1
2N
N∑n=1
∥∥∥R(Pn|Ω)−D(Pn)gt
∥∥∥22, (4)
where N corresponds to the number of patches in the training batch, and D(Pn)gt
represents the ground-truth density for the associated training patch Pn. Recallthat Ω encodes the network parameters. We have implemented our networkdesign using the excellent Caffe [23] framework, and we make use of the popularstochastic gradient descent algorithm to fit the parameters of our models.
How do we implement the prediction stage? Given a test image, we firstdensely extract image patches. As illustrated in Figure 2, we feed the CCNNwith image patches scaled to a fixed size of 72x72 pixels. These input patches arepassed through our CCNN model, which produces a density map estimation foreach of them. Note that due to the two max-pooling layers, the size of the outputobject density map estimation is 1/4 of the size of the input image patch, i.e.18x18 pixels. Therefore, all the predicted object density maps DP
pred = R(P |Ω)are rescaled in order to fit the original input patch size. Note that this rescalinggenerates a density map DP
pred whose associated count does not necessarily matchwith the original count before the rescaling. Therefore, this new resized densitymap must be normalized as follows,
DPpred =
∑∀pD
Ppred(p)∑
∀p DPpred(p)
DPpred. (5)
The last step of the prediction stage consists in the assembly of all the pre-dicted density maps for the patches. In order to generate the final object densitymap estimation DIt , for the given test image It, we simply aggregate all thepredictions obtained for all the extracted patches into a unique density map ofthe size of the test image (see Figure 1). Note that due to the dense extractionof patches, the predictions will overlap, so each position of the final density mapmust be normalized by the number of patches that cast a prediction in it.
Like we have previously mentioned, we are not the first ones proposing adeep learning model for object counting. Zhang et al. [7] introduce the novelCrowd CNN architecture. In a detailed comparison of both the CCNN and theCrowd CNN, we can discover the following differences. First, the network de-signs are different. For instance, instead of using fully-connected layers, in ourCCNN we have incorporated the fully convolutional 1x1 layers Conv4, Conv5and Conv6. This speeds up both the training a forwards pass [22]. Second, theirlearning strategy is more complex. The Crowd CNN model needs to incorporatetwo different loss functions (one for the density maps and one for the total countof the patches). During the optimization, they implement an iterative switch-ing process to alternatively optimize with one loss or the other. In contrast,our CCNN only uses one loss. And third, our model is more compact. For theproblem of crowd counting, Zhang et al. [7] do not use the direct estimation ofthe Crowd CNN network to obtain the final object density estimation. Instead,they report the results feeding a ridge regressor with the output features of their

6 Daniel Onoro-Rubio and Roberto J. Lopez-Sastre
S0 (72X72)
S1 (72X72)
Fc6
Fc7
Fc8
512 512 324
HYDRA CNN
18X18
Sn (72X72)Sn
CCNN_Sn
CCNN_S0
CCNN_Sn
CCNN_S1
CCNN_S0
CCNN_Sn
Fig. 3. Hydra CNN. The network uses a pyramid of input patches (they are croppedand rescaled to a size of 72x72). Each level of the pyramid, representing a differentscale, feeds a particular head of the Hydra. All the head outputs are concatenated andpassed to a fully-connected bank of layers, which form the body of the hydra.
Crowd CNN network. On the contrary, we do not need any extra regressor, ournovel CCNN is learned in an end-to-end manner to directly predict the objectdensity maps. Finally, our experiments (see Section 4.2) reveal that the CCNNimproves the results of the Crowd CNN in three of four subsets of the UCSDdataset [4].
3.3 The Hydra CNN
In a typical pipeline of a counting by regression model, a geometric correctionof the input features, using an annotated perspective map of the scene, for in-stance, results fundamental to report accurate results. This phenomenon hasbeen described in several works, reporting state-of-the-art results (e.g. [6, 8, 5,7]). Technically, the perspective distortion exhibited by an image, causes thatfeatures extracted from the same object but at different scene depths would havea huge difference in values. As a consequence, erroneous results are expected bymodels which uses a single regression function.
With the Hydra CNN model, we want to solve this problem. That is, HydraCNN must be a scale-aware architecture, which is not allowed to use any previousgeometric correction of the scene. Our architecture should be able to learn a non-linear regression mapping, able to integrate the information from multiple scalessimultaneously, in order to cast a precise object density map estimation. Thisaspect brings a fundamental benefit: Hydra CNN can work in scenarios anddatasets which consider not only a single calibrated scene. For instance, a singleHydra CNN model should be able to accurately predict the number of objectsfor a variety of unseen scenes, exhibiting different perspectives, and generalizingwell to real-world scenarios.
We attack this problem with the idea shown in Figure 3. Our Hydra CNNhas several heads and a body, remembering the ancient serpentine water monstercalled the Hydra in Greek and Roman mythology. Each head is in charge oflearning the representation for a particular scale si from the input pyramid of

Towards perspective-free object counting with deep learning 7
image patches. Therefore, during learning we feed each head with image patchesextracted at a particular scale. We have to understand the output of the heads asa set of features describing the images at different scales. Then, all these featuresare concatenated to feed the body, which is made of fully-connected layers. Notice,that the heads are not necessarily restricted to the same architecture, so theirfeatures may have different dimensions, hence the use of fully convolutional layersin the body may not be suitable. Therefore, we use fully-connected layer in orderto provide to the net full access to all the head features for the different scales.Essentially, the body learns the high-dimensional representation that merges themultiscale information provided by the heads, and it is in charge of performingthe final object density map estimation.
Technically, as illustrated in Figure 3, for each head of the Hydra CNN, wepropose to use a CCNN model (CCNN s0, . . . , CCNN sn). Note that we simplyexclude in each CCNN model for the heads, its final Conv6 layer. Then, theoutputs of the different heads are concatenated and passed to the body, wherewe use two fully-connected layers, with 512 neurons each one. These are the layersFc6 and Fc7 in Figure 3, which are followed by a ReLu and a dropout layer. Weend the architecture with the fully-connected layer Fc8, with 324 neurons, whoseoutput is the object density map. To train this Hydra CNN model we use thesame loss function defined in Equation (4). Again the Caffe [23] library is used,following for the optimization the stochastic gradient descent algorithm. Finally,given a test image, we follow the same procedure described for the CCNN modelto produce the final object density map estimation.
The network design of the novel Hydra CNN is inspired by the work of Li etal. [24] for visual saliency estimation. In [24], they propose a different networkarchitecture but using a multiple input strategy, which combines the features ofdifferent views of the whole input image in order to return a visual saliency map.In our Hydra CNN model, we adapt this idea to use the multi-scale pyramid setof image patches to feed our network.
4 Experiments
We have evaluated our solutions using three challenging benchmarks. Two havebeen proposed for the crowd counting problem: the UCSD pedestrian [4] and theUCF CC 50 [9] datasets. The third one is the TRANCOS dataset [10], whichhas been designed for vehicle counting in traffic jam scenes.
4.1 TRANCOS dataset
Experimental setup TRANCOS is a publicly available dataset, which pro-vides a collection of 1244 images of different traffic scenes, obtained from realvideo surveillance cameras, with a total of 46796 annotated vehicles. The objectshave been manually annotated using dots. It also provides a region of interest(ROI) per image, defining the region considered for the evaluation. This database

8 Daniel Onoro-Rubio and Roberto J. Lopez-Sastre
provides images from very different scenarios, which have not been paramete-rized. Moreover, the cameras can move in the same scene, and no perspectivemaps are provided.
We strictly follow the experimental setup proposed in [10], using only thetraining and validation sets for learning our models. In each training image,we randomly extract 800 patches of 115x115 pixels. We also perform a dataaugmentation strategy by flipping each patch, having in total 1600 patches pertraining image. These patches are then resized to 72x72 to feed our networks.We generate the ground truth object density maps with the code provided in[10], which places a Gaussian Kernel (with a covariance matrix of Σ = 15 ·12x2)in the center of each annotated object.
For the CCNN model, we perform a cross-validation to adjust the standarddeviation values of the Gaussian noise that is necessary to initialize the weightsof each layer of the deep network. The Xavier initialization method [25] was usedto, but with it, our CCNN models are not able to converge in our experiments.
To train the Hydra CNN, we follow the same patch extraction procedureas for the CCNN model. The only difference is that from each patch we buildits corresponding pyramid of s different scales, being s the number of heads ofour Hydra CNN. Therefore, the first level of the pyramid contains the originalpatch. For the rest of levels we build centered and scaled crops, of size 1/s, ofthe original patch. For example, in the case of a Hydra CNN with two heads,the first level of the pyramid corresponds to the original input patch, and thesecond level contains a crop of size 50% of the original size. When three headsare used, the second and third levels of the pyramid contain a crop of size 66%and 33% of the original size, respectively.
To initialize the heads of the Hydra CNN model, we use the same parametersdiscovered by the cross-validation for the CCNN. Then we perform a cross-validation to adjust the standard deviation for the layers Fc6 and Fc7.
The test is performed by densely scanning the input image with a stride of10 pixels, and assembling all the patches as it is described in Section 3.2.
The TRANCOS benchmark comes with an evaluation metric to be used: theGrid Average Mean absolute Error (GAME) [10]. This GAME is computed asfollows,
GAME(L) =1
N
N∑n=1
(
4L∑l=1
∣∣∣DlIn −D
lIgtn
∣∣∣) , (6)
where N is the total number of images, DlIn
corresponds to the estimated object
density map count for the image n and region l, and DlIgnt
is the corresponding
ground truth density map. For a specific level L, the GAME(L) subdivides theimage using a grid of 4L non-overlapping regions, and the error is computed asthe sum of the mean absolute errors in each of these subregions. This metricprovides a spatial measurement of the error. Note that a GAME(0) is equivalentto the mean absolute error (MAE) metric.

Towards perspective-free object counting with deep learning 9
1 2 3 4 5 6 7 8 9 10Database division
0
5
10
15
20
25
30
MAE
CCNNHydra s3
Fig. 4. Comparison of CCNN and Hydra CNN in the TRANCOS dataset when thenumber of objects increases.
Vehicle counting results Table 1 shows a detailed comparison of our modelswith the state-of-the-art methods [5, 6] reported in [10].
Method GAME 0 GAME 1 GAME 2 GAME 3
[5] 17.77 20.14 23.65 25.99
[6] 13.76 16.72 20.72 24.36
CCNN 12.49 16.58 20.02 22.41
Hydra 2s 11.41 16.36 20.89 23.67
Hydra 3s 10.99 13.75 16.69 19.32
Hydra 4s 12.92 15.54 18.45 20.96
Table 1. TRANCOS dataset. Comparison with the of state-of-the-art models.
First, note how all our models outperform the state-the-art. The more simplearchitecture of CCNN already improves the results of the previously reportedmodels [5, 6]. Hydra CNN should be able to report the best results in TRAN-COS, given the high level of variability in terms of perspective and variety ofscenes that the images of this dataset exhibits. Table 1 shows that a HydraCNN with just 2 scales improves the results with respect to the CCNN for aGAME(0), while for GAME(1) to GAME(3) the performance is very similar. Ifwe go further, and train a Hydra CNN with 3 heads, we are now able to reportthe best results for this dataset for all the GAMES. Note how the error for thehigher levels of the GAME, where this metric is more restrictive, drastically de-creases. This reveals that the Hydra CNN is more precise not only predictingthe object density maps, but also localizing the densities within them. If wecontinue increasing the number of heads of Hydra CNN, this does not guaran-tee an increment of the performance. On the contrary, we have experimentallyobserved that the model saturates for 4 heads (see last row of Table 1), whilethe complexity dramatically increases.
Overall, these results lead us to two conclusions. First, the object densitymaps can be accurately and efficiently estimated using the CCNN model, whichworks remarkably well. Second, the Hydra CNN idea of having a pyramid of
10 Daniel Onoro-Rubio and Roberto J. Lopez-Sastre
PR
ED
ICTI
ON
GR
OU
ND
TR
UTH
73.8
75.2
30.0
31.6
28.2
27.4
20.3
70.1
29.3
92.5
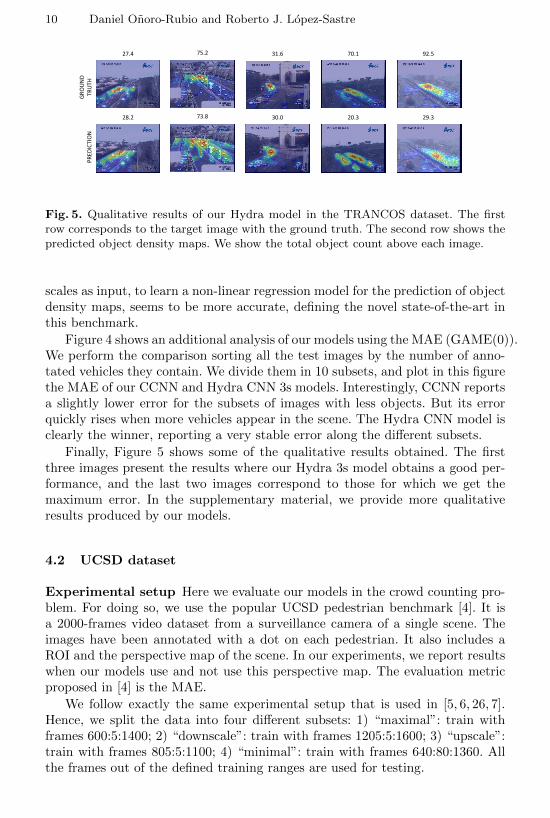
Fig. 5. Qualitative results of our Hydra model in the TRANCOS dataset. The firstrow corresponds to the target image with the ground truth. The second row shows thepredicted object density maps. We show the total object count above each image.
scales as input, to learn a non-linear regression model for the prediction of objectdensity maps, seems to be more accurate, defining the novel state-of-the-art inthis benchmark.
Figure 4 shows an additional analysis of our models using the MAE (GAME(0)).We perform the comparison sorting all the test images by the number of anno-tated vehicles they contain. We divide them in 10 subsets, and plot in this figurethe MAE of our CCNN and Hydra CNN 3s models. Interestingly, CCNN reportsa slightly lower error for the subsets of images with less objects. But its errorquickly rises when more vehicles appear in the scene. The Hydra CNN model isclearly the winner, reporting a very stable error along the different subsets.
Finally, Figure 5 shows some of the qualitative results obtained. The firstthree images present the results where our Hydra 3s model obtains a good per-formance, and the last two images correspond to those for which we get themaximum error. In the supplementary material, we provide more qualitativeresults produced by our models.
4.2 UCSD dataset
Experimental setup Here we evaluate our models in the crowd counting pro-blem. For doing so, we use the popular UCSD pedestrian benchmark [4]. It isa 2000-frames video dataset from a surveillance camera of a single scene. Theimages have been annotated with a dot on each pedestrian. It also includes aROI and the perspective map of the scene. In our experiments, we report resultswhen our models use and not use this perspective map. The evaluation metricproposed in [4] is the MAE.
We follow exactly the same experimental setup that is used in [5, 6, 26, 7].Hence, we split the data into four different subsets: 1) “maximal”: train withframes 600:5:1400; 2) “downscale”: train with frames 1205:5:1600; 3) “upscale”:train with frames 805:5:1100; 4) “minimal”: train with frames 640:80:1360. Allthe frames out of the defined training ranges are used for testing.

Towards perspective-free object counting with deep learning 11
PR
ED
ICTI
ON
GR
OU
ND
TR
UTH
47.0
44.6
36.6
33.6
17.9
17.9
15.4
14.4
20.6
21.5
Fig. 6. CCNN qualitative results for the UCSD dataset. The first row shows the targetimage with its ground truth. The second row shows the predicted object density map.We show the total object count above each image.
In order to train our CCNN model, for each image we collect 800 patches,of 72x72 pixels, randomly extracted all over the image, and their correspondingground truth density maps. We perform a data augmentation by flipping eachpatch. Therefore, in total, we have 1600 training samples per image. As usual,when the perspective map is used, the ground truth object density maps arebuilt scaling the covariance of the 2D Gaussian kernels, where we fix a baseΣ = 8 · 12x2, as it is described in [6].
To train the Hydra CNN models, we follow the same patch extraction detailedfor the TRANCOS dataset. This time, 800 random patches of 72x72 pixels areextracted per training image. The pyramid of scaled versions of the patches isbuilt using the same procedure explained before. We initialize both the CCNNand the Hydra CNN models following the procedures previously explained forthe TRANCOS dataset. Finally, to perform the test we fix a stride of 10 pixelsand then we proceed as it is described in Section 3.2.
Crowd counting results We start analyzing the performance of the CCNNmodel. Table 2 shows a comparison with all the state-of-the-art methods. OurCCNN, trained using the perspective map provided, like all the competingapproaches, obtains the best results for the “upscale” subset. If we comparethe performance of the two deep learning models, i.e. CCNN vs. the CrowdCNN of Zhang et al. [7], our model gets a better performance in 3 of the 4subsets.
Figure 6 shows some qualitative results. We have chosen five frames thatbest represent the object density differences in the dataset. The last two framescorrespond with the maximal error produced by our CCNN model. In the supple-mentary material, we provide videos with all the qualitative results.
We now proceed to analyze the results obtained by the Hydra CNN modelsin this benchmark. Even though this dataset offers images of a fixed scene,providing its perspective map, where the objects appear at similar scales, wehave decided to conduct this extra experiment with the Hydra CNN approach,

12 Daniel Onoro-Rubio and Roberto J. Lopez-Sastre
Method ‘maximal’ ‘downscale’ ‘upscale’ ‘minimal’
[6] 1.70 1.28 1.59 2.02
[5] 1.70 2.16 1.61 2.20
[20] 1.43 1.30 1.59 1.62
[3] 1.24 1.31 1.69 1.49
[7] 1.70 1.26 1.59 1.52
Our CCNN 1.65 1.79 1.11 1.50
Table 2. Mean absolute error. Comparison with the state-of-the-art methods for theUCSD pedestrian dataset.
Method ‘maximal’ ‘downscale’ ‘upscale’ ‘minimal’
Hydra 2s 2.22 1.93 1.37 2.38
Hydra 3s 2.17 2.99 1.44 1.92
Table 3. MAE comparison of our Hydra 2s and Hydra 3s models trained withoutperspective information in the UCSD dataset.
to evaluate its performance with the state-of-the-art models. Table 3 shows theMAE results for our Hydra with two and three heads. Recall that we do not usethe perspective information. We can observe two things. The first one is that botharchitectures report a good performance, even if they do not improve the state-of-the-art. To support this conclusion, Figure 7 shows a comparison between theground truth, the CCNN model (trained using the perspective map), and theestimation generated by our Hydra with two and three heads, which does notuse the perspective information. Hydra CNN models are able to closely followboth the CCNN and the GT. We belive that Hydra CNN does not outperformCCNN due to the small variability and the low perspective distortion exhibitedby this dataset. In this situation, adding more scales does not seem to providereally useful information. Hence, the use of Hydra CNN does not offer here aclear advantage.
4.3 UCF CC 50 dataset
Experimental setup The UCF CC 50 dataset [9] consists of 50 pictures, col-lected from publicly available web images. The counts of persons range between94 and 4543, with an average of 1280 individuals per image. People have been an-notated by dots, and no perspective maps are provided. The images contain verycrowded scenes, which belong to diverse set of events: concerts, protests, stadi-ums, marathons, and pilgrimages. This dataset proposes a challenging problem,especially due to the reduced number of training images, and the variabilitybetween the scenarios covered. We have followed the same experimental setupdescribed in [9]. We randomly split the dataset into 5 subsets and perform a5-fold cross-validation. To report the results the MAE and the Mean StandardDeviation (MSD) are used.
For training our models, we scale the images in order to make the largestsize equal to 800 pixels. We follow the same experimental setup described inSection 4.1. We now randomly extract 1200 image patches of 150x150 pixels

Towards perspective-free object counting with deep learning 13
0 100 200 300 400 500 600 700maximal
10
15
20
25
30
35
40
45
50
Ground TruthCCNN Prediction
Hydra 2s PredictionHydra 3s Prediction
0 50 100 150 200 250 300 350downscale
25
30
35
40
45
50
0 50 100 150 200 250upscale
10
15
20
25
30
0 100200 300400 500600 700800minimal
10
15
20
25
30
35
40
45
Fig. 7. Comparison of ground truth, CCNN and Hydra CNN of two and three headsin the UCSD benchmark.
with their corresponding ground truth. We also augment the training data byflipping each sample. Finally, the covariance matrix for the ground truth densitymap generation with the Gaussian functions is fixed to Σ = 15 · 12x2. For theinitialization of the CCNN and the Hydra CNN models, we follow the cross-validation procedure already described for the other datasets. To do the test, wedensely scan the image with a stride of 10 pixels.
Crowd counting results Table 4 shows a comparison of our models with thestate-of-the-art approaches. In this dataset, the best performance is given by ourHydra CNN 2s, which is able to drastically reduce the MAE. Hydra CNN with3 scales outperforms 3 of 5 models previously published. The CCNN approachonly improves the results reported in [19, 6]. Analyzing the results, we find thatthe performance of the CCNN decreases especially in those images with thehighest number of humans and where the perspective really matters. In Figure9 we include some qualitative examples of the CCNN model where this can beappreciated. This issue and the results provided, confirm the advantages of thescale-aware Hydra model for the very crowded scenes of the UCF CC 50 dataset.
Figure 8 shows some of the qualitative results that are obtained by our HydraCNN model with two heads. The first three columns correspond with resultswhere our network reports a good performance, while the last two columns showthe maximum errors.
5 Conclusions
In this paper, we have introduced two novel deep learning approaches to countobjects in images. To the best of our knowledge, only two methods have previ-ously explored similar ideas [7, 21]. Therefore, our research affords novel insightsinto the problem of object counting with deep learning.
With our first architecture, the CCNN model, we show that object densitymaps can be accurately and efficiently estimated, letting the network learn themapping which transforms the appearance of image patches into object densitymaps. We are able to match and improve the counting accuracy of much more

14 Daniel Onoro-Rubio and Roberto J. Lopez-Sastre
PR
EDIC
TIO
NG
RO
UN
D
TRU
TH
1331.6
441.9
1334.1
2106.3
381.2
163.8
1196.5
1116.0
3008.9
3407.0
Fig. 8. UCF CC 50 dataset qualitative results for Hydra CNN with two scales. Firstrow corresponds to the target image with the GT. Second row shows the predictedobject density maps. We show the total object count above each image.
Table 4. MAE andMSD comparison for theUCF CC 50 dataset.
Method MAE MSD
[19] 655.7 697.8
[6] 493.4 487.1
[7] 467.0 498.5
[9] 419.5 541.6
[21] 377.6 509.1
CCNN 488.67 646.68
Hydra 2s 333.73 425.26
Hydra 3s 465.73 371.84
PREDICTIONGROUND
TRUTH
783.4730.4
1651.42549.3
1920.7917.8
Fig. 9. Qualitative results of the CCNN inthe UCF CC 50 dataset.
complex models, such as [7], where multiple loss functions and extra regressorsare used in conjunction with the deep model.
Our second model, Hydra CNN, goes one step further, and provides a scale-aware solution, which is designed to learn a non-linear regressor to generate theobject density maps from a pyramid of image patches at multiple scales. Theexperimental validation reveals that Hydra not only improves the results of itspredecessor, our CCNN, but also that it is able to improve the state-of-the-artof those benchmarks that propose to count object in different scenes, showingvery crowded situations, and where no geometric information for the scene, likeits perspective map, is provided.
By making our software and pre-trained models available 1, we make iteffortless for future researches to reproduce our results and to facilitate furtherprogress towards more accurate solutions for this challenging task.
Acknowledgements. This work is supported by the projects of the DGTwith references SPIP2014-1468 and SPIP2015-01809, and the project of theMINECO TEC2013-45183-R.
1 https://github.com/gramuah/ccnn

Towards perspective-free object counting with deep learning 15
References
1. Dalal, N., Triggs, B.: Histograms of oriented gradients for human detection. In:CVPR. (2005)
2. Felzenszwalb, P.F., Girshick, R.B., McAllester, D., Ramanan, D.: Object detectionwith discriminatively trained part-based models. IEEE Trans. Pattern Anal. Mach.Intell. (2010)
3. Arteta, C., Lempitsky, V., Noble, J.A., Zisserman, A.: Interactive object counting.In: ECCV. (2014)
4. Chan, A.B., Liang, Z.S.J., Vasconcelos, N.: Privacy preserving crowd monitoring:Counting people without people models or tracking. In: CVPR. (2008)
5. Fiaschi, L., Kthe, U., Nair, R., Hamprecht, F.A.: Learning to count with regressionforest and structured labels. In: ICPR. (2012)
6. Lempitsky, V., Zisserman, A.: Learning to count objects in images. In: NIPS.(2010)
7. Zhang, C., Li, H., Wang, X., Yang, X.: Cross-scene crowd counting via deepconvolutional neural networks. In: CVPR. (June 2015)
8. Loy, C., Chen, K., Gong, S., Xiang, T.: Crowd counting and profiling: Methodologyand evaluation. In: Modeling, Simulation and Visual Analysis of Crowds. (2013)
9. Idrees, H., Saleemi, I., Seibert, C., Shah, M.: Multi-source multi-scale counting inextremely dense crowd images. In: CVPR. (2013)
10. Guerrero-Gomez-Olmedo, R., Torre-Jimenez, B., Lopez-Sastre, R., Maldonado-Bascon, S., Onoro Rubio, D.: Extremely overlapping vehicle counting. In: IberianConference on Pattern Recognition and Image Analysis (IbPRIA). (2015)
11. Chen, S., Fern, A., Todorovic, S.: Person count localization in videos from noisyforeground and detections. In: CVPR. (2015)
12. Leibe, B., Seemann, E., Schiele, B.: Pedestrian detection in crowded scenes. In:CVPR. (2005)
13. Li, M., Zhang, Z., Huang, K., Tan, T.: Estimating the number of people in crowdedscenes by mid based foreground segmentation and head-shoulder detection. In:ICPR. (2008)
14. Patzold, M., Evangelio, R.H., Sikora, T.: Counting people in crowded environmentsby fusion of shape and motion information. In: AVSS. (2010)
15. Viola, P., Jones, M.J.: Robust real-time face detection. International Journal ofComputer Vision (2004)
16. Wang, M., Wang, X.: Automatic adaptation of a generic pedestrian detector to aspecific traffic scene. In: CVPR. (2011)
17. Rabaud, V., Belongie, S.: Counting crowded moving objects. In: CVPR. (2006)
18. Tu, P.H., Sebastian, T., Doretto, G., Krahnstoever, N., Rittscher, J., Yu, T.: Uni-fied crowd segmentation. In: ECCV. (2008)
19. Rodriguez, M., Laptev, I., Sivic, J., Audibert, J.Y.: Density-aware person detectionand tracking in crowds. In: ICCV. (2011)
20. Pham, V.Q., Kozakaya, T., Yamaguchi, O., Okada, R.: COUNT forest: CO-votinguncertain number of targets using random forest for crowd density estimation. In:ICCV. (2015)
21. Zhang, Y., Zhou, D., Chen, S., Gao, S., Ma, Y.: Single-image crowd counting viamulti-column convolutional neural network. In: CVPR. (June 2016)
22. Long, J., Shelhamer, E., Darrell, T.: Fully convolutional networks for semanticsegmentation. In: CVPR. (2014)

16 Daniel Onoro-Rubio and Roberto J. Lopez-Sastre
23. Jia, Y., Shelhamer, E., Donahue, J., Karayev, S., Long, J., Girshick, R., Guadar-rama, S., Darrell, T.: Caffe: Convolutional architecture for fast feature embedding.arXiv preprint arXiv:1408.5093 (2014)
24. Li, G., Yu, Y.: Visual saliency based on multiscale deep features. In: CVPR. (2015)25. Glorot, X., Bengio, Y.: Understanding the difficulty of training deep feedforward
neural networks. In: AISTATS. (2010)26. Ryan, D., Denman, S., Fookes, C., Sridharan, S.: Crowd counting using multiple
local features. In: DICTA. (2009)