towards improved design of diversion structures in...
TRANSCRIPT
Towards Improved Design of Diversion Structures in Spate Irrigation System: Case Study of Raya Valley, Ethiopia
Hintsa Libsekal Gebremariam
MSc Thesis WSE-HELWD-14.14 April 2014

Towards Improved Design of Diversion Structures in Spate
Irrigation System: Case Study of Raya Valley, Ethiopia
Master of Science Thesis
by
Hintsa Libsekal Gebremariam
Supervisors Prof. Charlotte de Fraiture, PhD, MSc.
Mentors Abraham Mehari Haile, PhD, MSc.
Examination committee
Prof. Charlolotte de Fraiture, PhD, MSc. (UNESCO-IHE)
Abraham Mehari Haile, PhD, MSc. (UNESCO-IHE)
Eyasu Yazew Hagos, PhD, MSc. (Mekelle University, Ethiopia)
This research is done for the partial fulfilment of requirements for the Master of Science degree at the
UNESCO-IHE Institute for Water Education, Delft, the Netherlands
Delft
April 2014


©2014by Hintsa Libsekal Gebremariam. All rights reserved. No part of this publication or the information
contained herein may be reproduced, stored in a retrieval system, or transmitted in any form or by any
means, electronic, mechanical, by photocopying, recording or otherwise, without the prior permission of
the author. Although the author and UNESCO-IHE Institute for Water Education have made every effort to
ensure that the information in this thesis was correct at press time, the author and UNESCO-IHE do not
assume and hereby disclaim any liability to any party for any loss, damage, or disruption caused by errors
or omissions, whether such errors or omissions result from negligence, accident, or any other cause.


i
Abstract
Spate irrigation is a resource system, whereby flood water is emitted through normally dry wadi and
conveyed to irrigable fields. This is commonly used in arid and semi arid areas of the world where
annual evapo-transpiration is greater than annual rainfall. This includes letting of flood
water to irrigation land through temporary or permanent channel. Now a day's traditional
spate irrigation are changing to improved and modern once. Modern spate irrigation
schemes are mainly known for their ridge and permanent diversion structures constructed
across the river. Weir, intake, sluice gate, retaining wall and main canals are main part of
modern spate structures. Modernization has been taking place in Raya valley since 1998
while the efficiencies are not as intended. So far there are no appropriate design standards
for spate scheme and this lead for poor scheme performance. The main objective of this study
was to investigate spate schemes design development, identify current design problems,
develop problem based design alternatives and to recommend the best alternative for better
flood and sediment management in Raya valley. Design report collection, preliminary design
assessment, field observation for selected schemes were made. Among the visited sites Dayu
spate irrigation was found relatively best performing scheme and was selected for further
study of design limitation. Primary data like river topography survey sediment analysis
structure measurements, discussion with farmers and design experts was made. River
bathymetry, cross section, slope, discharge estimation, hydrograph development and sediment
concentration estimation was undertaken from the collected data. Based on the farmers and
spate irrigation designs experts perception and current problems three design alternatives
was developed in addition to the current design. Delft3D model was employed to simulate
hydrodynamics and morpho-dynamic to evaluate the flow pattern, depth average velocity,
water level and erosion/sedimentations for scenarios. The result of spate irrigation design
development in Raya valley shows significant changes; for example widening of intake,
increasing of deflection angle, excluding of rain fall during irrigation water requirement and
reducing of irrigation time. The current problems of relatively best performing schemes are
sedimentation around intakes, less spate flow and low overall low scheme performances. The
simulation result of Delft3D showed improving of intake deflection angle from 1200 to 150
0
for 3 meter wide intake can increase the irrigation area by 21%. Improving of intake width
from 3 meter to 5 meter at 1200
deflection angle can increase the total irrigation area by
81%. Improving of intake width from 3 meter to 5 meter and deflection angle from 1200
to
1500
can improve the irrigation area by 100%. These interventions in deflection angle and
intake width did not result in any significant reduction of sediment deposition at the intake.
However, the enhanced supply of water through the main spate flow gates may convince
farmers not to block the scour sluice gates, which are primarily designed to remove coarse
sediments. From purely design point of view an intake with 5 m wide and 1500 deflected angle
could be recommended. A detailed cost benefit analysis is required to make a final
recommendation. Furthermore, before deciding and implementation before deciding and
implementation of this design alternative it is worthy to make proper study on the structural
and geotechnical stability and cost comparisons of the option.
Key words: Spate irrigation, sedimentation, intake, diversion structure, Delft3D, improved
design, flood water


iii
Acknowledgements
This thesis work wouldn't be complete without the involvement of many people to whom I have the
pleasure of expressing my deepest appreciation and gratitude.
I would like to express my sincere thanks to Tigray Agricultural Research Institute (TARI), NUFFIC and
UNESCO-IHE for giving me the opportunity to pursue my MSc. study.
I would like to give my special thanks for my mentors Dr. Abraham Mehari Haile senior lecturer in land
and water development UNESCO-IHE and Dr. Atinkut Mezgebu Wibneh dean, college of dry land and
agriculture and natural resources Mekelle University, Ethiopia for their excellent guidance, scientific
advice, good encouragement and support in both my field work and thesis writings.
I want to say thank you for my supervisor Prof. Charlotte De Fraiture professor of land and water
development UNESCO-IHE for her constructive comments and continuous advice during the study. I
cannot forget to thank my local supervisor Mr. Tesfa-alem Gebreegziabher lecturer in Mekelle University,
Ethiopia for his advice and sharing me his knowledge, skill and experience of spate irrigation system
design and construction.
I would like to thank all my colleagues and friends Mr. Teklay Abebe, Mr. Tuemay Tassew, Mr. Zebrhe
Teklay, Dr. Teshale Tekulu, Mr. Gebru Eyasu and all staff members of Alamata Agricultural Research
Center (AARC), for their priceless support during my field work. Without their brotherly support in
materials, manpower and morals I would never manage the field work. Other special thank goes to Mr.
Lijalem and other staff of Mekelle Soil Research Center (MSRC) whom plays a vital role in laboratory soil
analysis work
I have no words to express my deepest gratitude to all staff of Amara Water Work Construction Enterprises
and especially to Mr. Alelgn Yesuf, Jemal, Tilahun Mekonen and Getahun Wendimkun also my colleagues
in UNESCO-IHE for their excellent and enthusiastic technical and material supports during my field work.
I want to appreciate the interest and willingness of Raya Alamata and Raya Azebo wereda or district Water
resources mines and energy offices for giving me the data of spate irrigation in their district. Farmers, local
experts and spate irrigation system designers of both wereda play to me a vital contribution in accessing the
design development and field visit to schemes.
Special thanks goes to Mr. Kibrom Ambachew Gebrehiwot senior lecturer in Haramaya University and Dr.
F.X. Suryadi Senior lecturer in Land and Water Development, UNESCO-IHE for supporting and sharing
their knowledge and experience of Delft3D model during my model setup.
Last but not least, I would like to thank all Land and Water Development lecturers and students for their
positive interaction during our study.

v
Table of Contents
Abstract i
Acknowledgements iii
List of Figures vii
List of Tables viii
Abbreviations ix
1. Introduction 1 1.1. General 1 1.2. Background of study area 2 1.3. Problem of Statement 4 1.4. Objective of the Study 6 1.5. Research Questions 6 1.6. Research setup 6
2. Research Methodology 7
3. Literature Review 10 3.1. Spate irrigation system 10 3.2. Spate typology 11
3.2.1. Traditional intakes and canals 11 3.2.2. Improved traditional systems 11 3.2.3. Modernized and new systems 11
3.3. Hydrology of spate 12 3.3.1. Flood estimation 12 3.3.2. Shape of the spate hydrograph 13
3.4. Structures in spate irrigation 14 3.4.1. Diversion structures (Intakes) 14 3.4.2. Spate canals and water control structures 15 3.4.3. Wadi bed retrogression and wadi training 15 3.4.4. Bank protection 15
3.5. Sediment transport 15 3.6. Delft3D 16
3.6.1. Physical processes 16 3.6.2. Major assumptions of Delft3D-FLOW 17 3.6.3. Governing Equations in Delft3D 17
3.7. SHARC 19
4. Data collection and analysis 20 4.1. Secondary data collection 20 4.2. Schemes visit and observation 20 4.3. Primary data collection and analysis 21
4.3.1. Topography surveying 21
vi
4.3.2. Head work measurements 22 4.3.3. Sediment Grading 23 4.3.4. Flood marks 25 4.3.5. River discharge 26 4.3.6. Hydrograph 27
4.4. Irrigation water requirement 28 4.5. Sediment concentration 29
5. Model setup 31 5.1. Grid generation 31 5.2. Bathymetry 32 5.3. Delft3D flow module parameter 33 5.4. Model calibration 35 5.5. Scenarios 35
6. Result and Discussion 37 6.1. Design development of spate irrigation structures 37 6.2. Problems of best schemes in relation to sediment management and spate flow 42
6.2.1. Causes of the problems 42 6.2.2. Remedial solutions for the problems 42
6.3. Scenario development for alternative main intake design 43 6.4. Simulation results of design alternatives 43
6.4.1. Scenario one (S1) 44 6.4.2. Scenario two (S2) 46 6.4.3. Scenario three (S3) 47 6.4.4. Scenario four (S4) 49
7. Conclusion and Recommendation 54 7.1. Conclusion 54 7.2. Recommendation 55
References 57
Appendices 60 Appendix A River cross section data taken by total station 60 Appendix B Sediment bed material grading analysis 63 Appendix C River discharge calculation 64
vii
List of Figures
Figure 1.1 Location map of Raya valley (adopted from Gebreezgi A.H., 2010) ....................................... 2 Figure 1.2 Drainage networks in Raya valley ( sources: Adopted from Gebreezgi A.H., 2010) .............. 3 Figure 1.3 Unsuccessful modernized spate irrigation scheme in Hara, Raya valley ................................. 4 Figure 1.4 Different problems of modernization spate schemes in Raya valley ........................................ 5 Figure 2.1 Research methodology flow chart ............................................................................................ 9 Figure 3.1 Monthly rainfall and evapo-transpiration in two spate irrigated areas. (Source: Laurence
and Van Steenbergen, 2005) ................................................................................................... 10 Figure 3.2 Spate flood hydrograph from wadi Rima, Yemen (Source: P Laurence and Van
Steenbergen, 2005) ................................................................................................................. 13 Figure 3.3 Deflecting spur type traditional intakes (Source: adopted from Van Steenbergen et al.
2010) ....................................................................................................................................... 14 Figure 3.4 Bund type traditional intake (Source: adopted from Van Steenbergen et al., 2010) .............. 15 Figure 3.5 Components of total sediment load (source Ratsey, 2011) .................................................... 16 Figure 4.1 River cross section at cross section number five (X-5). (not in scale) ................................... 21 Figure 4.2 River bed slope in longitudinal direction (not in scale) ......................................................... 22 Figure 4.3 Measurements of diversion structure dimensions in Dayu scheme ........................................ 23 Figure 4.4 Sediment bed material grading manual sieving at field (left) and mechanical sieving at
laboratory (right) .................................................................................................................... 24 Figure 4.5 Sediment grading graph at different cross sections of the river.............................................. 25 Figure 4.6 Discharge sensitivity at different values of roughness coefficient (n) .................................... 27 Figure 4.7 River flow hydrograph of dayu spate scheme ........................................................................ 28 Figure 4.8 Comparisons of depth estimates from different alluvial friction predictor of DORC model . 30 Figure 4.9 Estimation of sediment concentration .................................................................................... 30 Figure 5.1 Grid development and grid properties .................................................................................... 32 Figure 5.2 River bathymetry of Dayu ...................................................................................................... 33 Figure 5.3 Layout of the developed scenarios ......................................................................................... 36 Figure 6.1 Headwork structures of Hara and Tirke.................................................................................. 38 Figure 6.2 Headwork structures of Fokissa and Beyru spate schemes .................................................... 39 Figure 6.3 Headwork structures of Tengago and Dayu spate schemes .................................................... 40 Figure 6.4 headwork structure of Oda spate irrigation system ................................................................ 41 Figure 6.5 Flow patterns of the flood for scenario one ............................................................................ 44 Figure 6.6 Intake hydrograph ................................................................................................................... 45 Figure 6.7 Cumulative erosion/sedimentation scenario one .................................................................... 45 Figure 6.8 Flood pattern of scenario two ................................................................................................. 46 Figure 6.9 Intake hydrograph ................................................................................................................... 46 Figure 6.10 Cumulative erosion/sedimentation scenario two .................................................................... 47 Figure 6.11 Flood patterns of scenario three .............................................................................................. 47 Figure 6.12 Intake hydrograph ................................................................................................................... 48 Figure 6.13 Cumulative erosion/sedimentation scenario three .................................................................. 49 Figure 6.14 Flow patterns of scenario four ................................................................................................ 49 Figure 6.15 Intake hydrograph ................................................................................................................... 50 Figure 6.16 Cumulative erosion/sedimentation scenario four ................................................................... 50 Figure 6.17 Total volume of water abstraction under low flood condition ................................................ 51 Figure 6.18 Total volume of water abstraction under medium flood condition......................................... 51 Figure 6.19 Total volume of water abstraction under high flood condition .............................................. 52

viii
List of Tables
Table 1.1 Spate irrigation characteristics in mid land and lowland areas of Ethiopia .............................. 2 Table 4.1 Topography survey data for cross section five (X-5) ............................................................. 21 Table 4.2 flood marks of the river at three cross sections. ..................................................................... 25 Table 4.3 Discharge calculations in cross section one (X-1) .................................................................. 26 Table 4.4 Average discharges of the river for different flow type .......................................................... 27 Table 4.5 Farmers observation to river flow hydrograph ....................................................................... 28 Table 4.6 Irrigation water requirement of sorghum and teff .................................................................. 29 Table 5.1 Mminimum requirement and achieved results of grid properties ........................................... 32 Table 6.1 Summery of spate structures design development .................................................................. 41 Table 6.2 Combination of design factors or scenario ............................................................................. 43 Table 6.3 Total water to be diverted and area to be irrigated under all scenarios .................................. 52 Table 6.4 Sediment accumulation around intake for all scenarios ......................................................... 53 Table B.1 Retained weight of sediment in kilo grams (kg) per sieve size at field by hand sieving ........ 63 Table B.2 Retained weight of sediment in grams (g) per sieve size in laboratory, mechanical sieving . 63

ix
Abbreviations
AARC Alamata Agricultural Research Centre
CFL Courant (Friedrichs-Lewy) Number
Co-SAERT Commission for Sustainable Agricultural and Environmental Rehabilitation in Tigray
CSA Central Static's Agency
CWR Crop Water Requirements
DORC Design of Regime Canals (model)
D/S Downstream
GIWR Gross Irrigation Water Requirement
FAO Food and Agriculture Organization
IFAD International Fund for Agricultural Development
IWR Irrigation Water Requirement
Masl mean above sea level
MSRC Mekelle Soil Research Centre
NIWR Net Irrigation Water Requirement
Ppm Parts per million
REST Relief Society of Tigray
RVADP Raya Valley Agricultural Development Program
SHARC Sediment and Hydraulic Analysis on Rehabilitation of Canals
S1 Scenario one
S2 Scenario Two
S3 Scenario Three
S4 Scenario four
TRBARD Tigray Region Bureau of Agriculture and Rural Development
TARI Tigray Agricultural Research Institute
UNDP United Nations Development program
U/S Upstream
V-Weir Weir parallel to the flow direction
WUA water use association
X-1 Cross Section One
X-5 Cross Section Five
X-11 Cross Section Eleven

x
List of Symbols
mm millimetre
m metre
km kilometre
m3 cubic metre
m2 square metre
m/s metre per second
m3/s cubic metre per second
Q flow rate
Qs Sediment load concentration
% percent
A area
ha hectare
n Manning's roughness coefficient
R hydraulic radius
d average water depth
S channel slope
& and
u flow velocity in ξ direction
ν fluid velocity in η or y direction
ζ water level above horizontal reference level (datum)

Towards Improved Design of Diversion Structures in Spate Irrigation System: Case Study of Raya Valley, Ethiopia 1
1.1. General
According to UNDP and FAO (1987) spate irrigation define as “an ancient irrigation practice that involves
the diversion of flashy spate floods running off from mountainous catchments where flood flows, usually
flowing for only a few hours with appreciable discharges and with recession flows lasting for only one to a
few days, are channelled through short steep canals to bunded basins, which are flooded to a certain depth”.
Mehari et al. (2007) also defines spate irrigation in the simple way as “a resource system, whereby flood
water is emitted through normally dry wadi and conveyed to irrigable fields”. Moisture stress resistant
crops, often sorghum and maize are grown in the spate irrigated agricultures and planted after the first flood
irrigation water has occurred. In many areas crops can get matured and give reasonable yield using two or
more floods depending on the water holding capacity of the soil.
According to Van Steenbergen et al. (2010) rough estimates, global spate irrigation coverage extends up to
3.3 million hectares even though uncertainty is there. According to the reference made by Mehari et al.
(2011) spate irrigation is frequently practiced in the Middle East, North Africa, West Asia, East Africa and
parts of Latin America. Although spate irrigation is uncertain type of investment economically it is very
important practice in countries such as Yemen, Pakistan, Eritrea and Ethiopia where agriculture is a vital
component of their economy (Ratsey, 2011). Even though spate irrigation contributes a lot for food security
enhancement in the drought prone areas little concern and emphasis had been given in its developments.
In Ethiopian spate irrigation is a common practice in midlands as supplementary and in lowland area used
as dominantly full irrigation while both systems have different characteristics as shown in Table 1.1.
According to Van Steenbergen et al. (2011) in Ethiopia both farmer's initiative and public investments are
the driving forces for spate irrigation development. Currently the cultivated areas under spate irrigation
estimates to be 140,000 ha of which 20,000 ha is modern spate irrigation and 70,000 ha still need
improvements and other 50,000 ha are under design and construction phases (Van Steenbergen et al.,
2011).
Spate irrigation system in Ethiopia is increasing in arid areas particularly; south Tigray (Raya valley),
Oromia (Bale, Arusi, West and east Hararghe), Dire Dawa Administrative Region, Southern Nations,
Nationalities and Peoples Region (Konso), Afar and Amhara (Mehari et al., 2011).
CHAPTER 1
Introduction
Introduction 2
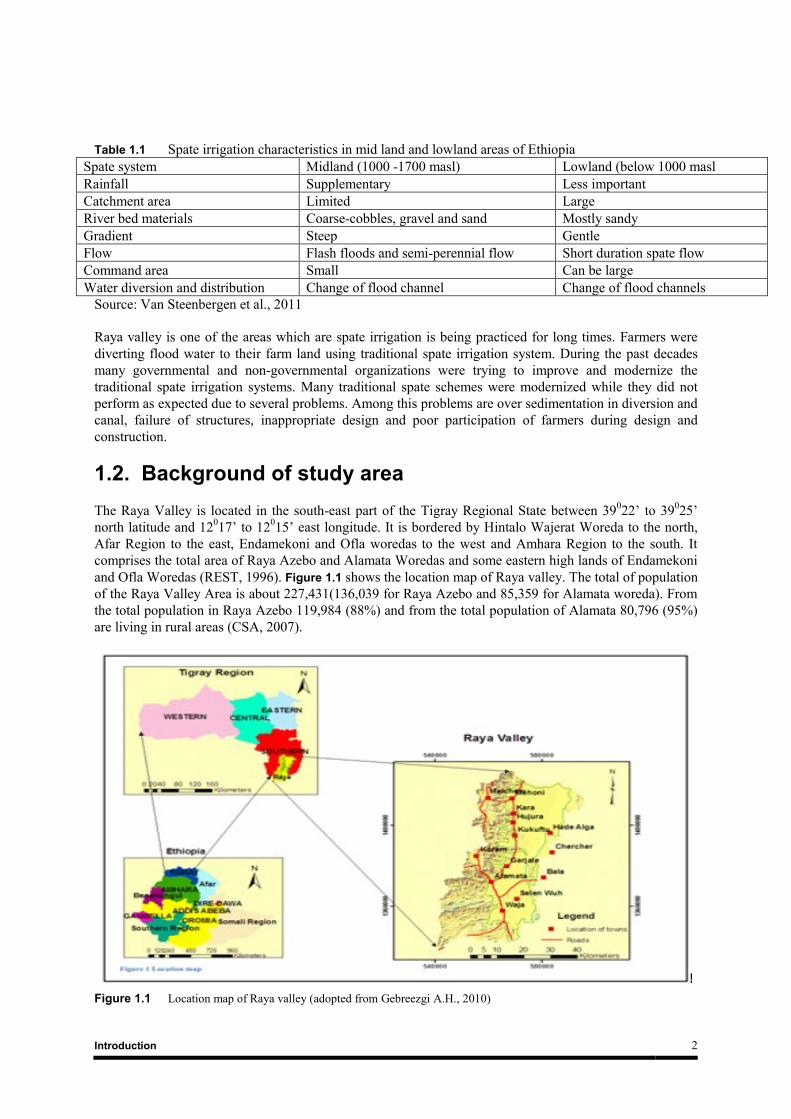
Table 1.1 Spate irrigation characteristics in mid land and lowland areas of Ethiopia
Spate system Midland (1000 -1700 masl) Lowland (below 1000 masl
Rainfall Supplementary Less important
Catchment area Limited Large
River bed materials Coarse-cobbles, gravel and sand Mostly sandy
Gradient Steep Gentle
Flow Flash floods and semi-perennial flow Short duration spate flow
Command area Small Can be large
Water diversion and distribution Change of flood channel Change of flood channels
Source: Van Steenbergen et al., 2011
Raya valley is one of the areas which are spate irrigation is being practiced for long times. Farmers were
diverting flood water to their farm land using traditional spate irrigation system. During the past decades
many governmental and non-governmental organizations were trying to improve and modernize the
traditional spate irrigation systems. Many traditional spate schemes were modernized while they did not
perform as expected due to several problems. Among this problems are over sedimentation in diversion and
canal, failure of structures, inappropriate design and poor participation of farmers during design and
construction.
1.2. Background of study area
The Raya Valley is located in the south-east part of the Tigray Regional State between 39022’ to 39
025’
north latitude and 12017’ to 12
015’ east longitude. It is bordered by Hintalo Wajerat Woreda to the north,
Afar Region to the east, Endamekoni and Ofla woredas to the west and Amhara Region to the south. It
comprises the total area of Raya Azebo and Alamata Woredas and some eastern high lands of Endamekoni
and Ofla Woredas (REST, 1996). Figure 1.1 shows the location map of Raya valley. The total of population
of the Raya Valley Area is about 227,431(136,039 for Raya Azebo and 85,359 for Alamata woreda). From
the total population in Raya Azebo 119,984 (88%) and from the total population of Alamata 80,796 (95%)
are living in rural areas (CSA, 2007).
Figure 1.1 Location map of Raya valley (adopted from Gebreezgi A.H., 2010)

Towards Improved Design of Diversion Structures in Spate Irrigation System: Case Study of Raya Valley, Ethiopia 3
Topographically the Raya Valley is divided in to two major zones: low land areas with an altitude less than
1500 m.a.s.l which mostly covers large part of the central part of the valley; and the high land areas having
altitude above 1500 m.a.s.l which covers the western and eastern edges of the valley. According to the
moisture index criteria provided by REST (1996) the Raya Valley area is classified as dry climates of semi-
arid and arid types.
Raya Valley has a bimodal rainfall pattern. Though diminishing from time to time, the area experiences a
short rainy season locally known as Belg which runs from February to April followed by the main rain
season called Kiremt which runs from June to early September (REST, 1996). The eastern and western
highland of the valley experience better rainfall. For instance the Chercher highlands get average rainfall of
620 mm while the Mai-chew highlands get up to 775 mm of rainfall annually. The high fluctuation and
unreliability becomes most common in the lowland valley of Mekoni and Alamata areas. The average
annual rainfall collected from Mekoni and Alamata meteorological stations show that it is 486 and 693 mm
annually respectively (Gebreezgi, A.H., 2010). This shortage of rainfall needs special attention on
development of spate irrigation agricultures. Most of the rivers in Raya valley flow from western high lands
to east. Figure 1.2 show the drainage network of Raya valley.
Figure 1.2 Drainage networks in Raya valley ( sources: Adopted from Gebreezgi A.H., 2010)
Introduction 4
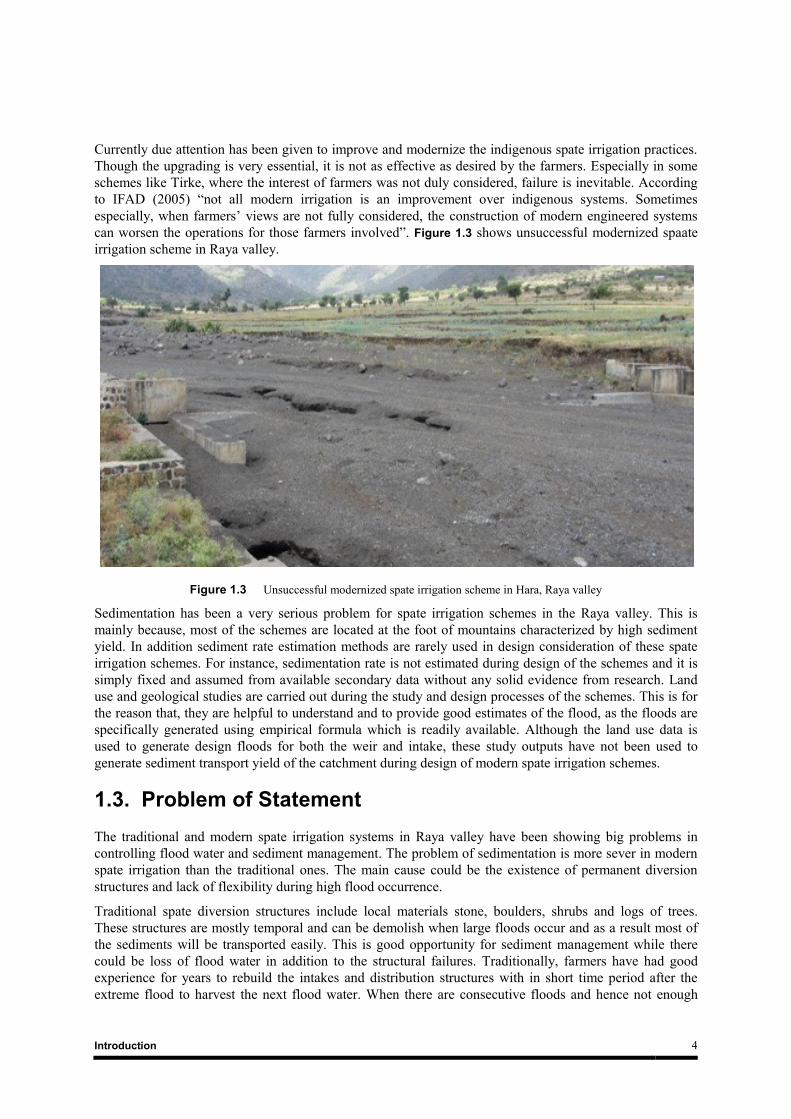
Currently due attention has been given to improve and modernize the indigenous spate irrigation practices.
Though the upgrading is very essential, it is not as effective as desired by the farmers. Especially in some
schemes like Tirke, where the interest of farmers was not duly considered, failure is inevitable. According
to IFAD (2005) “not all modern irrigation is an improvement over indigenous systems. Sometimes
especially, when farmers’ views are not fully considered, the construction of modern engineered systems
can worsen the operations for those farmers involved”. Figure 1.3 shows unsuccessful modernized spaate
irrigation scheme in Raya valley.
Figure 1.3 Unsuccessful modernized spate irrigation scheme in Hara, Raya valley
Sedimentation has been a very serious problem for spate irrigation schemes in the Raya valley. This is
mainly because, most of the schemes are located at the foot of mountains characterized by high sediment
yield. In addition sediment rate estimation methods are rarely used in design consideration of these spate
irrigation schemes. For instance, sedimentation rate is not estimated during design of the schemes and it is
simply fixed and assumed from available secondary data without any solid evidence from research. Land
use and geological studies are carried out during the study and design processes of the schemes. This is for
the reason that, they are helpful to understand and to provide good estimates of the flood, as the floods are
specifically generated using empirical formula which is readily available. Although the land use data is
used to generate design floods for both the weir and intake, these study outputs have not been used to
generate sediment transport yield of the catchment during design of modern spate irrigation schemes.
1.3. Problem of Statement
The traditional and modern spate irrigation systems in Raya valley have been showing big problems in
controlling flood water and sediment management. The problem of sedimentation is more sever in modern
spate irrigation than the traditional ones. The main cause could be the existence of permanent diversion
structures and lack of flexibility during high flood occurrence.
Traditional spate diversion structures include local materials stone, boulders, shrubs and logs of trees.
These structures are mostly temporal and can be demolish when large floods occur and as a result most of
the sediments will be transported easily. This is good opportunity for sediment management while there
could be loss of flood water in addition to the structural failures. Traditionally, farmers have had good
experience for years to rebuild the intakes and distribution structures with in short time period after the
extreme flood to harvest the next flood water. When there are consecutive floods and hence not enough
Towards Improved Design of Diversion Structures in Spate Irrigation System: Case Study of Raya Valley, Ethiopia 5
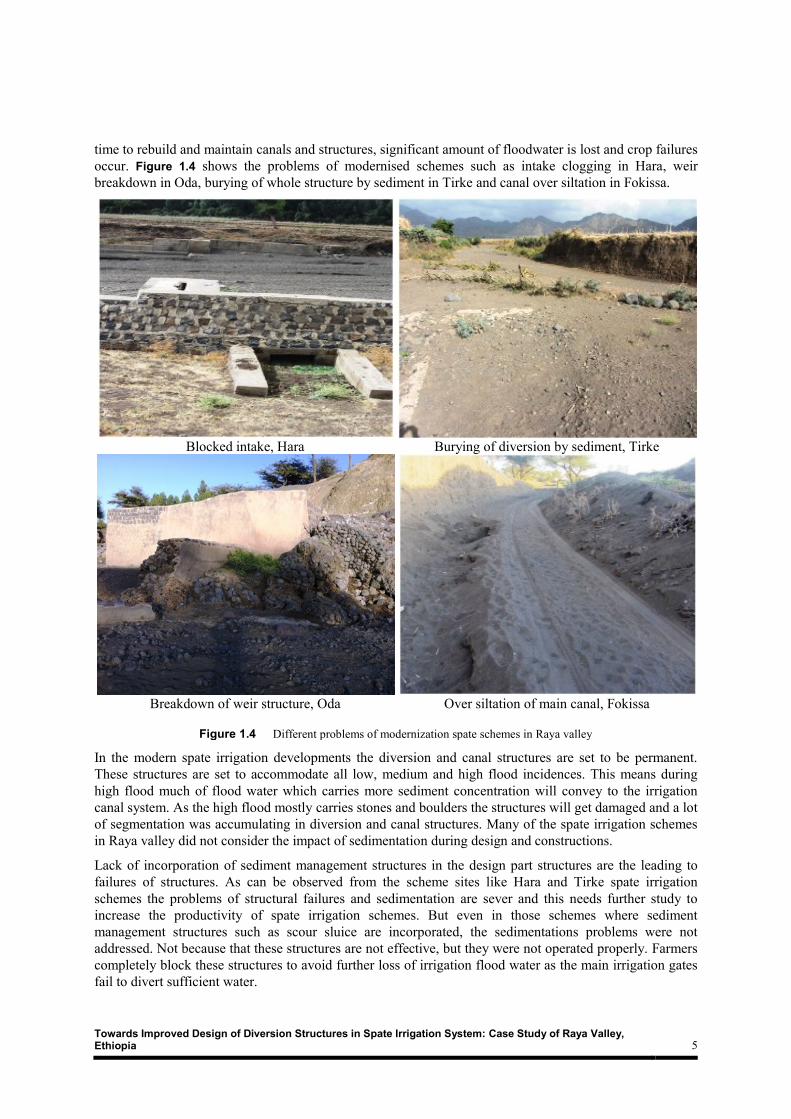
time to rebuild and maintain canals and structures, significant amount of floodwater is lost and crop failures
occur. Figure 1.4 shows the problems of modernised schemes such as intake clogging in Hara, weir
breakdown in Oda, burying of whole structure by sediment in Tirke and canal over siltation in Fokissa.
Blocked intake, Hara
Burying of diversion by sediment, Tirke
Breakdown of weir structure, Oda
Over siltation of main canal, Fokissa
Figure 1.4 Different problems of modernization spate schemes in Raya valley
In the modern spate irrigation developments the diversion and canal structures are set to be permanent.
These structures are set to accommodate all low, medium and high flood incidences. This means during
high flood much of flood water which carries more sediment concentration will convey to the irrigation
canal system. As the high flood mostly carries stones and boulders the structures will get damaged and a lot
of segmentation was accumulating in diversion and canal structures. Many of the spate irrigation schemes
in Raya valley did not consider the impact of sedimentation during design and constructions.
Lack of incorporation of sediment management structures in the design part structures are the leading to
failures of structures. As can be observed from the scheme sites like Hara and Tirke spate irrigation
schemes the problems of structural failures and sedimentation are sever and this needs further study to
increase the productivity of spate irrigation schemes. But even in those schemes where sediment
management structures such as scour sluice are incorporated, the sedimentations problems were not
addressed. Not because that these structures are not effective, but they were not operated properly. Farmers
completely block these structures to avoid further loss of irrigation flood water as the main irrigation gates
fail to divert sufficient water.
Introduction 6
1.4. Objective of the Study
To build up on the efforts over the last 15 years and further improve the design of main intakes for better
spate flow diversion and sediment management.
Specific objectives
Assess the historical evolvement of designs of spate irrigation structures over the past 15 years.
Make an in-depth assessment of limitations and strengths of the latest main intake design with
regard to spate flow diversion efficiency and sediment
Develop alternatives of improved main intake design and recommend the most suitable design of
diversion structure with regard to ease of operation and management requirement
1.5. Research Questions
How has the design of spate irrigation structures evolved over the past 15 years?
What are the main problems of the relatively best performing main intake design of the spate
irrigation systems with regard to sediment management and reliable spate flow?
What alternative of main intake designs could be recommended to address the existing problems?
Which alternative design could be recommended to the Raya valley, the focal study area?
1.6. Research setup
The research work was prepared in seven chapters. The first chapter deals with an introduction of the
thesis. The introduction part includes generals of spate irrigation systems, backgrounds of the study area,
problem statements, objectives and research questions of the thesis work.
The second chapter deals about the research methodology and explains the overall steps followed to
accomplish the study work. The third chapter also deals about the literature review and gives detail
information about the spate irrigations systems, spate typology, hydrology of spate, structures of spate
irrigation system, sediment transport and management, Delft3D and SHARC models.
Chapter four deals with the data collection and analysis part of the thesis work. The data collection includes
secondary data collection, scheme visit and primary data like measurement of topography survey, flood
water marks, sediment analysis. The collected data are analyzed accordingly so as to get the necessary
information about the study area. Mainly the analysis emphasis on design development through time,
profiles of the river, sediment grading analysis and discharge and hydrograph determinations. The fifth
chapter explains about the model set up of Delft3D and gives detail information about the model
parameters used for set up.
Chapter six elaborates about the result and discussions of the thesis work. The main purpose of the result
and discussion part is to present the major finding of the study. This chapter emphasised on the design
developments, problems and limitation of the current spate design standards, alternative designs and their
importance in relation to sediment management and spate flow. Chapter seven deals about the conclusion
and recommendation resulted from the study work.

Towards Improved Design of Diversion Structures in Spate Irrigation System: Case Study of Raya Valley, Ethiopia 7
Introduction
This chapter deals about the research methodology followed to achieve the scope of the study. This study
was takes place in two parts which is field work and followed by data compiling and modelling. Literature
review was also main component of the research work in all chapters. The detailed methodologies followed
to answer the research question of the study are presented as follows:
1) How has the design of spate irrigation structures evolved over the past 15 years?
In order to answer this research question several data were collected from respective organizations. The
collected data are mainly engineering feasibility study, design reports and head work structure drawing and
specification of the modernized spate irrigation schemes. The collected reports of the schemes were
reviewed and evaluation was made on the development of spate irrigation structure designs over the past 15
years in Raya valley. An intensive field visit was also undertaken to envision the modern spate irrigation
schemes. During the field visit an exhaustive interview and discussion was held with local experts and
farmers so as to get detail information about the construction, implementation and problems of modern
spate irrigation schemes. Therefore the designs developments of spate irrigation structure were determined
based on the collected data and field observation. The relatively best performing designs were identified
and selected for further study.
2) What are the main problems of the relatively best performing main intake design of the spate irrigation
systems with regard to sediment management and reliable spate flow?
Based on the current status of the modern spate irrigation schemes in Raya valley one best scheme was
selected for further detail study of problems and limitations in relation to spate flow and sediments. An
assessment was made to the diversion design problems and limitations of the relatively best performing.
The current conditions and problems of the scheme related to spate flow and sedimentation was evaluated.
Discussion was made with professional experts of spate irrigation designer, local experts and farmers to
identify the current problems and limitation.
3) What alternative of main intake designs could be recommended to address the existing problems?
To answer this research questions an assessment of the traditional spate irrigation was undertaken so as to
determine the reason for their sustainability. An alternative design of intake structures was developed based
on traditional knowledge of farmers and the experience of design engineers. The alternatives designs
include the farmer's perception, reflections of spate design expert and engineering point of view. Therefore
the alternative designs or scenarios were developed based on intake width and deflection angle of the intake
to the flowing water.
CHAPTER 2
Research Methodology
Research Methodology 8
4) Which alternative design could be recommended to the Raya valley, the focal study area?
To recommend the best alternative design or scenario a simulation modelling was made using Delft3D
software program. This software program simulates the hydrodynamics and morphodynamics of the river
reach and it is well known model for river flow and sediment transports. Delft3D needs several inputs for
simulations and some of these inputs were organized from secondary data, measured inputs, derived inputs
from the measured once and from literatures. The main inputs of Delft3D were organized as follows.
All the head work dimensions were measured using a measuring tape. This data were used to
develop the detail size of the diversion structures like gate size, angle and weir axis length. This
data are use full parameters for bathymetry generation and used as an inputs for delft 3D software
program
Topography survey was made using total station surveying instrument. The river was surveyed in
eleven cross sections for 591 meter long river reach. These data was used to drive the slope, cross
sectional areas, grid and bathymetry of the river.
Flood marks of the river for minimum, medium, maximum and extreme flood events were
collected from the farmers' interview. Suitable river cross sections were selected on the river reach
around the diversion structure.
Flood frequency and magnitude of the river was collected from interview held with farmers. The
number of flood occurrence during dry, medium and wet seasons was estimated. The duration of
minimum, medium, maximum and extreme floods were also collected from the farmers experience
and observations.
Discharge of the river was calculated from the river cross sectional area and flood marks. Manning
and Bathurst formula was used for flood discharge calculation. Manning roughness coefficient was
determined from literature based on the river bed materials.
Sediment sample was collected from representative sample points on the river. Eight samples of
1m3(1*1*1 meter) each were taken from three river cross section and one sample from the intake
of the diversion. Manual sieve was made in the field for sediment size greater than 5mm and for
the sediment material less than 5 mm around two kilograms of sample were collected for
laboratory sieve analysis and analysis was made in Mekelle Soil Research Centre.
Sediment concentration was determined from DORC module of SHARC software. The main
inputs of DORC model are bed material size and river hydraulic parameters like velocity and flow
depth. The river hydraulic data of depth and velocity are estimated from DORC model alluvial
friction predictor part. The alluvial friction predictor part of DORC has alternative methods of
predictor of Brownlie, Engelund and Hansens, Van Rijn and White, Paris and Bettess. Comparison
was made to all methods of alluvial friction predictor and observed or calculated data of the river
and the best fitted was selected for generation of sediment concentration

Towards Improved Design of Diversion Structures in Spate Irrigation System: Case Study of Raya Valley, Ethiopia 9
Figure 2.1 Research methodology flow chart
Literature Review 10
3.1. Spate irrigation system
The evolution of spate irrigation dates back long time era. The remaining of some diversion dam structures
in ephemeral rives of Iran and Balochistan dates back to 3,000 BCE. It is believes that spate irrigation was
started in Yemen, when the climate becomes arid and it has been practicing for about five thousand years
(Laurence and Van Steenbergen, 2005). Spate irrigation system is a sort of floodwater gleaning and
managing, exclusive to arid regions nearby highland areas (Mehari et al., 2011). Notwithstanding its
potential to sound contribution of livelihood improvement of poor people in the delicate ecosystems, it is
hardly neglected and has been given less emphasis in many countries of developmental program and
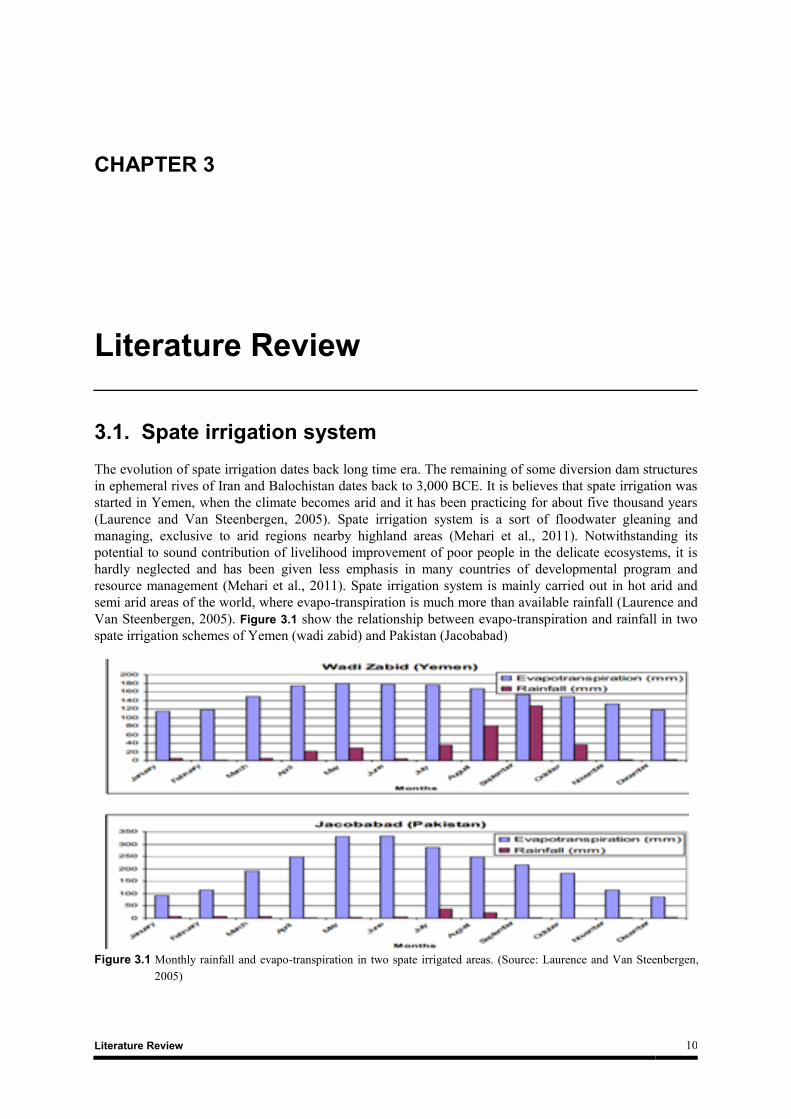
resource management (Mehari et al., 2011). Spate irrigation system is mainly carried out in hot arid and
semi arid areas of the world, where evapo-transpiration is much more than available rainfall (Laurence and
Van Steenbergen, 2005). Figure 3.1 show the relationship between evapo-transpiration and rainfall in two
spate irrigation schemes of Yemen (wadi zabid) and Pakistan (Jacobabad)
Figure 3.1 Monthly rainfall and evapo-transpiration in two spate irrigated areas. (Source: Laurence and Van Steenbergen,
2005)
CHAPTER 3
Literature Review
Towards Improved Design of Diversion Structures in Spate Irrigation System: Case Study of Raya Valley, Ethiopia 11
3.2. Spate typology
According to Van Steenbergen et al. (2010) spate irrigation classified based on: scheme size (small,
medium and large), infrastructure (traditional, improved and modernized), operation and maintenance
(farmers managed, farmers supported from agencies and agency managed) and flow regimes (only spate
flow, flow includes significant base flow and conjunctive use of spate and groundwater). Classification of
spate in relation to infrastructure includes traditional intakes and canals, improved traditional systems and
modernized and new systems.
3.2.1. Traditional intakes and canals
According to Van Steenbergen et al. (2010) traditional diversion/headwork includes deflecting spurs or in
flatter plain areas, bunds that are constructed right across the flood channel. The construction of diversion
is quite simple and temporal. The traditional canals are mainly short and sometimes can include secondary
canals Usually water distribution between fields takes place through letting water to pass by breaking field
bunds when the predetermined water depth reaches. When extreme flood occurs the structure can fail and
much of the sediment moves along the river flow. There for small amount of sediment can enter to the
canals and scheme and it can be easily maintain. The adverse effect of traditional spate irrigation; it needs
frequent maintenance, labour intensive and uses a lot of bushes and trees for reconstruction of the structure.
This is also main causes of flood water losses when harvestable flood followed by extreme flood in short
time, which is before reconstruction of diversion structures (Van Steenbergen et al., 2010). This problems
lead to an improvement of traditional spate irrigation.
3.2.2. Improved traditional systems
According to Van Steenbergen et al. (2010) improve traditional spate irrigation is diversion of flood water
from the river and mainly the structures could have flow throttling structures, rejection spillways near canal
heads, drop structures and flow division structures in main canals. In some area the construction of
improved structures may need huge investment and farmers can hire bulldozers. During support for
improvements from outside agencies, bulldozers may be provided at subsidized rates, and simple gabion
masonry structures may be used at diversions. Improved water control structures may also be incorporated
in the canal and field systems. Although this improvement solves some of the problems occurred in
traditional system but there are many problem are still occurring like sedimentation of canals, siltation of
diversion structures and this needs huge investment for operation and maintenance. Money traditional and
improved spate irrigation schemes are modernized in the past decades so as to increase the overall
efficiency of the irrigation systems.
3.2.3. Modernized and new systems
Modern spate irrigation is the diversion of spate to farm lands using strong structures, mainly cement
masonry and concrete structures. The design concept is to divert significant amount of the flood, the
amount varies through experience and practice, at a point to serve a large command area. In large systems,
numerous traditional intakes are replaced with concrete diversion weirs, with sediment sluices. Owing to
the high costs of permanent structures a single permanent weir often replaces many traditional intakes. In
newer schemes, steep canals and sediment management structures are provided to minimize sedimentation.
Even in new schemes, where farmers may not have the traditional practices needed to manage spate flows,
a range of diversion types, including large semi-permanent soil bunds and small, simple diversion weirs,
are used (Van Steenbergen et al., 2010).

Literature Review 12
3.3. Hydrology of spate
Spate hydrology is characterized by a great variation in the size and frequency of floods which directly
influence the availability of water for agriculture. Wadi is also characterized by very high sediment loads
and important groundwater recharge through seepage in the wadi bed. All these characteristics are specific
to wadi hydrology. Management of floods and high sediment load therefore require a good estimate of the
main hydrological characteristics of the wadi (Van Steenbergen et al., 2010).
Spate hydrology describes the runoff and sediment transport processes that influence spate irrigation
practices and the design of improved spate irrigation schemes. This provides some simple methods that can
be used to derive the hydrological information needed to design intakes and canals for spate irrigation
systems (Van Steenbergen et al., 2010).
Understanding of spate hydrology has great implication for design of spate irrigation schemes. The high-
intensity rainfall events that generate spate flows in wadi are characterized by a wide variability in space
and time. In many areas information on the spatial characteristics of rainfall wadi watersheds is inadequate.
3.3.1. Flood estimation
Flood amount of a river is an important parameter for knowing of hydrograph and this play a vital role in
design of spate irrigation structures. According to Ratsey (2011) there are several methods of flood
estimations among this:
Analysis of long term records of measured flood discharge
Analysis of synthetic long term run off data derived from stochastic modelling
Rational method
Regional flood frequency relationships
Slope area method
Velocity area measurement of actual floods.
These methods use different input data and have different accuracy. In spate irrigation practices it is
difficult to get long term and detail data inputs. Slope area method could be relatively best method for
estimation of flood discharges in many wadi.
Slope area method
This method depends on the flood marks of the river banks. Knowing of the actual river cross section is and
longitudinal river slops are also important parameters. According to Ratsey (2011) three to four river cross
sections have to survey so as to develop independent estimation of discharge. Roughness coefficient of the
river bed also needs estimation either from table or empirical formula. Slope area method can use either
Manning or Bathurst formula.
Manning formula
Manning formula mainly uses bed roughness coefficient for calculation of the discharge
Manning
Where:
Q = Discharge in m3/s
A = Cross section of river in m2
R = Hydraulic radius which is area per wetted perimeter in m
S = River slope in m/m
n = manning roughness coefficient
g = acceleration due to gravity m/s2

Towards Improved Design of Diversion Structures in Spate Irrigation System: Case Study of Raya Valley, Ethiopia 13
Bathurst formula
Bathurst formula used to estimate flood discharge and it mainly based on size of bed material
Bathurst, 1985
Where:
Q = Discharge in m3/s
A = Cross section of river in m2
R = Hydraulic radius which is area per wetted perimeter in m
S = River slope in m/m
d = mean flow depth, similar with R
D84 = size of bed material with 84 percent is finer in m
g = acceleration due to gravity m/s2
According to Arcement and Schneider (1989) for area which have know median size bed material it is
better to use Bathurst formula instead of Manning equation. Bathurst formula is independent of Manning
roughness coefficient and mainly depend on the D84 of bed materials.
3.3.2. Shape of the spate hydrograph
Flows move down the channel network as a flood wave. Runoff from different parts of a catchment
converges in the steep wadi channels, sometimes generating multi-peaked spate flows at the water
diversion sites in the lower wadi reaches. Flood hydrographs are characterized by an extremely rapid rise in
time, followed by a short recession, as illustrated in Figure 3.2. In this case, the discharge at a spate
diversion site in Wadi Rima in Yemen increased from less than 1.0 m³/s to about 550 m³/s in around 30
minutes, with a second smaller peak occurring the next day. The lower water surface elevation after the
flood is due to bed scour (Laurence and Van Steenbergen, 2005).
Figure 3.2 Spate flood hydrograph from wadi Rima, Yemen (Source: P Laurence and Van Steenbergen, 2005)
Literature Review 14
3.4. Structures in spate irrigation
According to Van Steenbergen et al. (2010) spate irrigation structures like any other conventional irrigation
schemes spate irrigation also consists different structures like intakes, canals, water control structures, wadi
bed retrogression and wadi training. Unlike conventional irrigation structures the spate structures requires
special attention in construction, implementation and maintenance phases as the flood/water availability is
different. Conventional irrigation has flow almost all over the year where as in spate the flood water occurs
from few minutes to days with high flood discharge rate. The details of the spate irrigation structures are
discussed below.
3.4.1. Diversion structures (Intakes)
The main purpose of diversion structures is to divert large amount flood water in unreliable levels to the
canal system. These structures have to convey sufficient amount of flood water to guarantee commanded
irrigated fields. They have to avoid delivering of uncontrolled flood flows to the canals, so as to reduce
damage to channels and irrigation field and limit the entrance of the high concentrations of coarse
sediments that occurs in large flood events. These functions need to achieve in unstable wadi, characterized
by irregular lateral movements of low-flow channels within the wider wadi cross-sections, bank cutting and
vertical movements of the wadi bed caused by scour and sediment deposition during floods.
Intake structures have to give function over the longer term with rising irrigation command levels caused
by sediment deposition on the irrigated fields and degradation of wadi bed levels due to changing
hydrological conditions, climate change and catchment deforestation. Traditional diversion structures have
either Spur-type deflector or Bund type diversions while the modern spate diversion structures consists of
weir, Spur-type deflector, scour sluice and canal head regulator (Van Steenbergen et al., 2010).
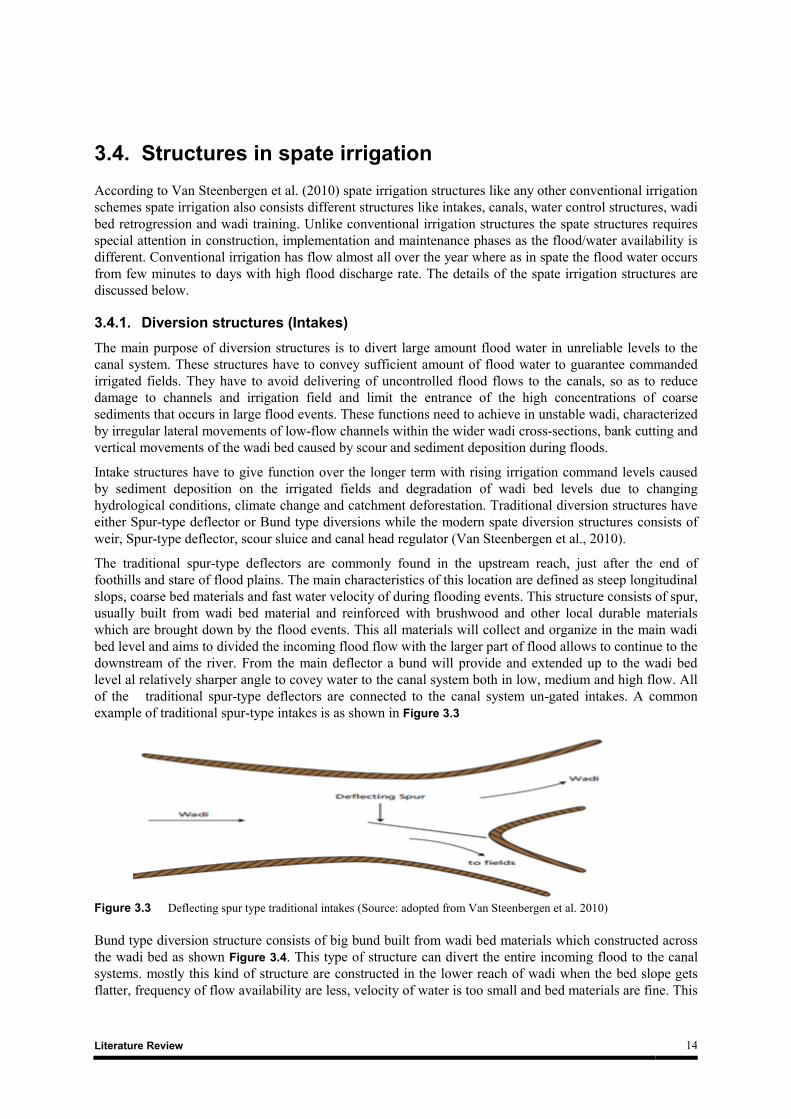
The traditional spur-type deflectors are commonly found in the upstream reach, just after the end of
foothills and stare of flood plains. The main characteristics of this location are defined as steep longitudinal
slops, coarse bed materials and fast water velocity of during flooding events. This structure consists of spur,
usually built from wadi bed material and reinforced with brushwood and other local durable materials
which are brought down by the flood events. This all materials will collect and organize in the main wadi
bed level and aims to divided the incoming flood flow with the larger part of flood allows to continue to the
downstream of the river. From the main deflector a bund will provide and extended up to the wadi bed
level al relatively sharper angle to covey water to the canal system both in low, medium and high flow. All
of the traditional spur-type deflectors are connected to the canal system un-gated intakes. A common
example of traditional spur-type intakes is as shown in Figure 3.3
Figure 3.3 Deflecting spur type traditional intakes (Source: adopted from Van Steenbergen et al. 2010)
Bund type diversion structure consists of big bund built from wadi bed materials which constructed across
the wadi bed as shown Figure 3.4. This type of structure can divert the entire incoming flood to the canal
systems. mostly this kind of structure are constructed in the lower reach of wadi when the bed slope gets
flatter, frequency of flow availability are less, velocity of water is too small and bed materials are fine. This

Towards Improved Design of Diversion Structures in Spate Irrigation System: Case Study of Raya Valley, Ethiopia 15
structure can divert water until the flow starts overtopping above the bund and scouring happens by large
flood events.
Figure 3.4 Bund type traditional intake (Source: adopted from Van Steenbergen et al., 2010)
3.4.2. Spate canals and water control structures
Canals need to convey large volumes of water to fields quickly in the short periods when flood flows occur.
The timing, duration and maximum discharge of spate flows are unpredictable and thus canal capacities
have to cope with a wide range of design conditions. Water distribution systems developed for perennial
irrigation are thus not appropriate for spate irrigation systems as canal capacities are determined for a
relatively narrow and predictable range of design conditions. Traditional intakes and their modern
replacements can be adapted to meet spate design conditions, although the design parameters will be very
different, resulting for large differences in cost and maintenance requirements
3.4.3. Wadi bed retrogression and wadi training
The bed level of wadi can be significantly lowered than the initial level during the existence of large flood
events. In traditional spate schemes it is necessary to change place of intake or to extend a diversion spur
further upstream to deliver the desired amount of water for the command area otherwise it will be
impossible to divert the water. In some areas it is also necessary to construct small check dam structures to
trap sediments and raise the bed levels.
Providing structures to control bed levels is an option but it is often difficult to justify in small spate
schemes. The preferred material for bed sills is mass concrete, which can be cast into excavated trenches.
Gabion bed sills have also been used.
3.4.4. Bank protection
High flow velocities during spates often erode wadi banks, particularly in the meandering middle and lower
reaches. The sinuous flow alignments within the wider wadi channel result in scouring and undercutting of
wadi banks at the outer curves and sedimentation at the inner curves. These causes Meander patterns to
develop and migrate downstream. Bank erosion scours out valuable irrigated land and can threaten canals
running parallel to the wadi banks.
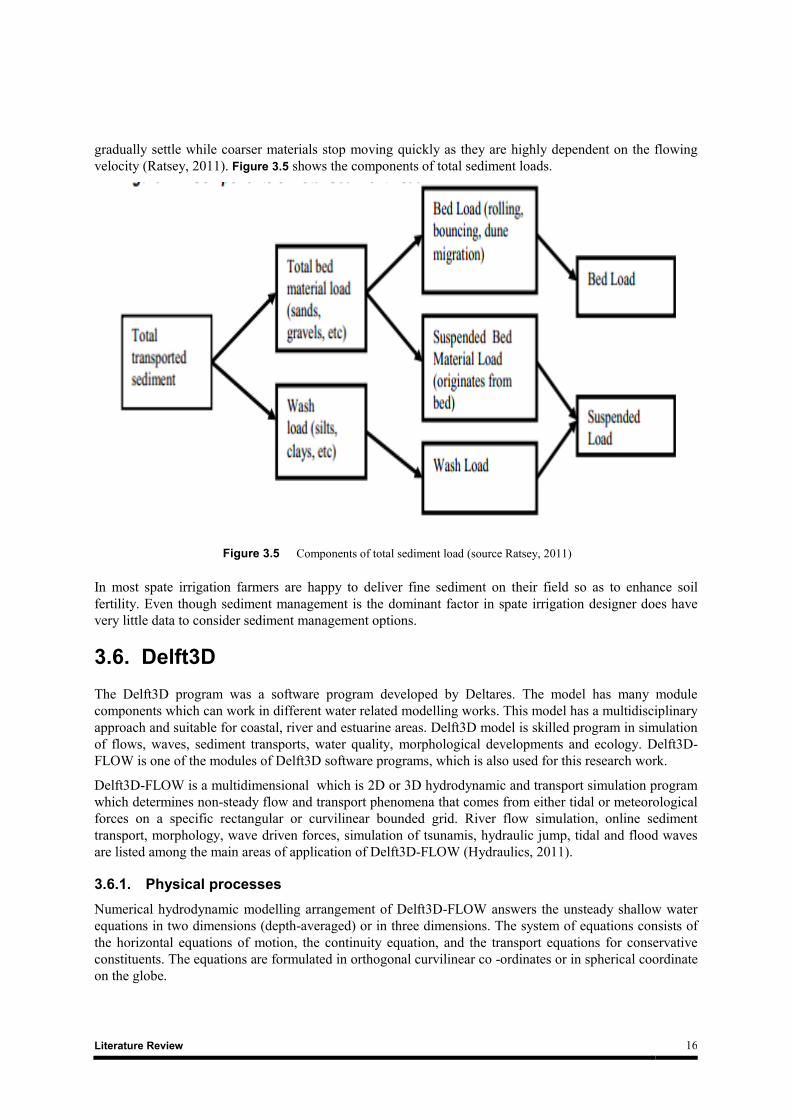
3.5. Sediment transport
All floods carry numerous amounts of sediment and delivers to the diversion, canals and field. According
to Xiaoqing (2003) sediments can classify based on laws and patterns of movements in to bed load and
suspended load. It can also group in to bed material load and wash load depending to their origin, particle
size and impact on fluvial developments. Wash load sediments remains in suspension for long time and
Literature Review 16
gradually settle while coarser materials stop moving quickly as they are highly dependent on the flowing
velocity (Ratsey, 2011). Figure 3.5 shows the components of total sediment loads.
Figure 3.5 Components of total sediment load (source Ratsey, 2011)
In most spate irrigation farmers are happy to deliver fine sediment on their field so as to enhance soil
fertility. Even though sediment management is the dominant factor in spate irrigation designer does have
very little data to consider sediment management options.
3.6. Delft3D
The Delft3D program was a software program developed by Deltares. The model has many module
components which can work in different water related modelling works. This model has a multidisciplinary
approach and suitable for coastal, river and estuarine areas. Delft3D model is skilled program in simulation
of flows, waves, sediment transports, water quality, morphological developments and ecology. Delft3D-
FLOW is one of the modules of Delft3D software programs, which is also used for this research work.
Delft3D-FLOW is a multidimensional which is 2D or 3D hydrodynamic and transport simulation program
which determines non-steady flow and transport phenomena that comes from either tidal or meteorological
forces on a specific rectangular or curvilinear bounded grid. River flow simulation, online sediment
transport, morphology, wave driven forces, simulation of tsunamis, hydraulic jump, tidal and flood waves
are listed among the main areas of application of Delft3D-FLOW (Hydraulics, 2011).
3.6.1. Physical processes
Numerical hydrodynamic modelling arrangement of Delft3D-FLOW answers the unsteady shallow water
equations in two dimensions (depth-averaged) or in three dimensions. The system of equations consists of
the horizontal equations of motion, the continuity equation, and the transport equations for conservative
constituents. The equations are formulated in orthogonal curvilinear co -ordinates or in spherical coordinate
on the globe.

Towards Improved Design of Diversion Structures in Spate Irrigation System: Case Study of Raya Valley, Ethiopia 17
The model also includes a mathematical conceptualization which takes in to account the following physical
phenomena:
Free surface gradients (barotropic effects)
The effect of the Earth's rotation (Coriolis forces)
Turbulence induced mass and momentum fluxes (turbulence closure models)
Space and time varying wind shear -stress at the water surface
Space varying shear-stress at the bottom
Space and time varying atmospheric pressure on the water surface
Time varying sources and sinks
Effect of secondary flow on depth-averaged momentum equations
Lateral shear-stress at wall
Vertical exchange of momentum due to internal waves
Wave induced stresses (radiation stress) and mass fluxes
Flow through hydraulic structure
3.6.2. Major assumptions of Delft3D-FLOW
In the co-ordinate system the depth is assumed to be much smaller than the horizontal length scale.
For such a small aspect ratio the shallow water assumption is valid, which means that the vertical
momentum equation is reduced to the hydrostatic pressure relation. Thus, vertical accelerations are
assumed to be small compared to the gravitational acceleration and are therefore not taken into
account. When this assumption is not valid then Delft3D provides an option to apply the so-called
Non hydrostatic pressure model in the Z -model.
In Cartesian reference frame, the impact of the Earth's curvature is not considered.
At the bottom a fall boundary condition is assumed, a quadratic underneath stress
conceptualization is applied.
The formulation for the enhanced bed shear-stress due to the combination of waves and currents is
based on a 2D flow field, produced from the velocity close to the bed using logarithmic estimate.
For a dynamic online coupling between morphological changes and flow the 3D sediment and
morphology Add-on is available.
The equations of DELFT3D-FLOW are capable of solving the turbulent scales (large eddy
simulation), but usually the hydrodynamic grids are too coarse to resolve the fluctuations.
Therefore, the basic equations are Reynolds-averaged introducing so-called
Reynolds stresses. These stresses are related to the Reynolds-averaged flow quantities by a
turbulence closure model.
The boundary conditions for the turbulent kinetic energy and energy dissipation at the free surface
and bottom assume a logarithmic law of the wall (local equilibrium).
3.6.3. Governing Equations in Delft3D
The main governing equations in Delft3D software program are Continuity, Momentum and transport
equations.
Continuity Equation
The depth-averaged continuity equation is given by:
Literature Review 18
Where Q is representing the contributions per unit area due to the discharge or withdrawal of water,
precipitation and evaporation:
With qin and qout are local sources and sinks of water per unit of volume [1/s], respectively,
P is the non-local source term of precipitation and
E is the non-local sink term due to evaporation. We remark that the intake of a power plant is, for example,
a withdrawal of water and should be modelled as a sink.
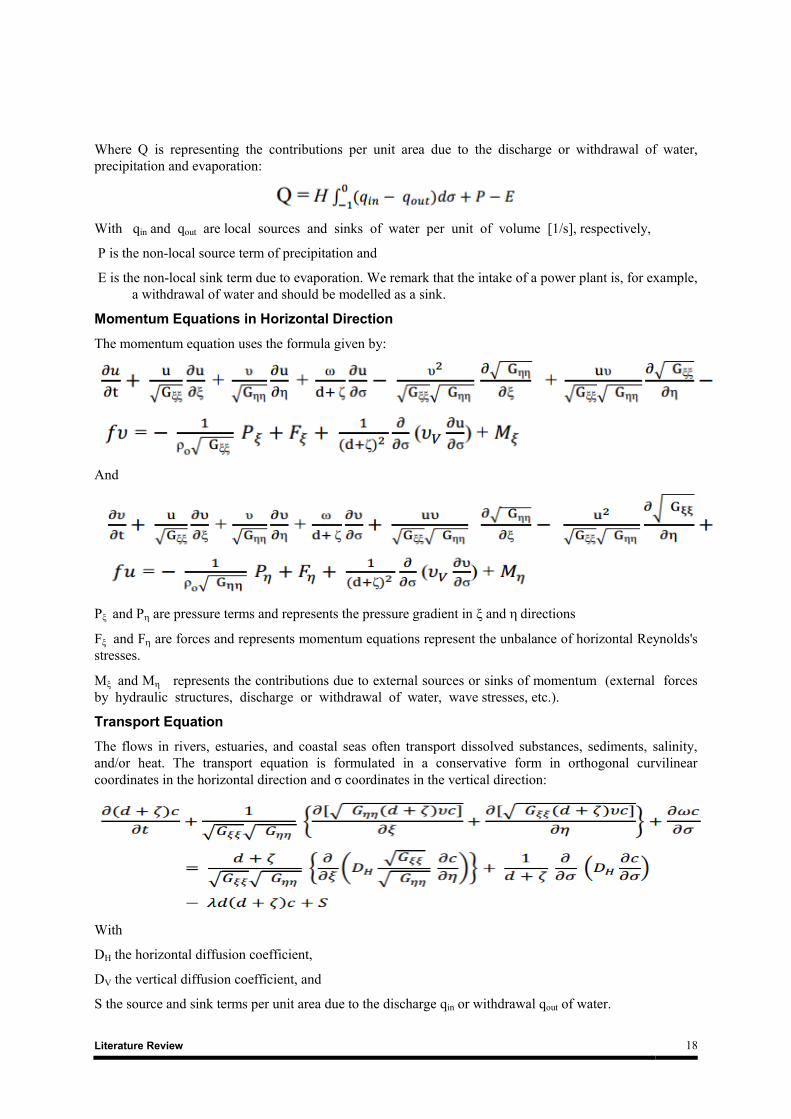
Momentum Equations in Horizontal Direction
The momentum equation uses the formula given by:
And
Pξ and P are pressure terms and represents the pressure gradient in ξ and directions
Fξ and F are forces and represents momentum equations represent the unbalance of horizontal Reynolds's
stresses.
Mξ and M represents the contributions due to external sources or sinks of momentum (external forces
by hydraulic structures, discharge or withdrawal of water, wave stresses, etc.).
Transport Equation
The flows in rivers, estuaries, and coastal seas often transport dissolved substances, sediments, salinity,
and/or heat. The transport equation is formulated in a conservative form in orthogonal curvilinear
coordinates in the horizontal direction and σ coordinates in the vertical direction:
With
DH the horizontal diffusion coefficient,
DV the vertical diffusion coefficient, and
S the source and sink terms per unit area due to the discharge qin or withdrawal qout of water.

Towards Improved Design of Diversion Structures in Spate Irrigation System: Case Study of Raya Valley, Ethiopia 19
3.7. SHARC
SHARC (Sediment and Hydraulic Analysis for Rehabilitation of Canals) is a suite of integrated programs
designed to assist in the identification and solution of sediment problems at intakes in rivers and canal
systems. Main module components of SHARC model are problem diagnosis and analysis, preliminary
economic screening, design tools, hydraulic simulations, environmental impact and economic analysis.
A design tool is one of the main module components of SHARC and deals on Intake models. Design tool
has three components namely DORC used for design of alluvial canals, DACSE deals on sediment
extractors system and DOSSBAS used for design of settling basins.
DORC is used for design of canals to transport sediments and to determine the existing canals conditions.
DORC design appropriate canals to match with the incoming sediment concentration. This method has
alternatives of sediment transport predictors like Brownlie, Engelund and Hansen, Van Rijn and White,
Paris and bettess. For this study DORC was used for determination of the river sediment concentration
(Lawrence et al., 2001).
Data collection and analysis 20
Introduction
This chapter deals about the data collection and analysis methods followed to achieve the objective of the
research study. This chapter includes collection of different design related reports from relevant offices,
field observation and assessment of selected schemes and filed data measurements. The selection of
schemes for field observation was decided by their year of construction at least one scheme was selected
from each schemes which were designed and constructed in the same year with the same design standard.
Primary data was collected and analysed from the relatively best performance scheme. The collected data
was analysed, interpreted and prepared in the input form for the Delft3D model. DORC module of SAHRC
software program was used to develop and estimate the bed material sediment concentration in the river
reach.
4.1. Secondary data collection
Secondary data mainly study design report, design specification and scheme locations were collected from
relevant organizations of Tigray Water Resources, Mines and Energy Bureau, Mekelle University, Raya
Alamata and Raya Azebo weredas or districts. After having this secondary data rough evaluation on the
design development in time was made and seven schemes namely Hara, Tirke, Fokissa, Beyru, Tengago,
Dayu and Oda were selected for field observation and assessment. Hara, Tirke and Oda modern spate
irrigation schemes did not have any report. Therefore analysis was made to this sites based on the current
condition in the field and farmers perceptions.
4.2. Schemes visit and observation
An intensive scheme visit and observation was made for the seven selected schemes so as to envision the
current situations in the ground. Headwork structures measurement was also made to Hara, Tirke, Fokissa,
Beyru, Tengago, Dayu and Oda modern spate irrigation schemes. The field observation was aimed to
measure the headwork structures and to observe the practical problems in the field. Structures like intake
size, weir dimensions, sluice gates and main canals were measured. This data are used for comparison of
design development with other scheme designs. Discussion with local farmers and experts were held in all
visited schemes to determine the perception of the beneficiaries.
CHAPTER 4
Data collection and analysis
Towards Improved Design of Diversion Structures in Spate Irrigation System: Case Study of Raya Valley, Ethiopia 21
4.3. Primary data collection and analysis
4.3.1. Topography surveying
The river topography was surveyed using the surveying instrument which is called total station. Total
station measures both X, Y, Z coordinates of a point. So as to know the detail topography level of the river
a surveying was made for 385 meter long upstream of the diversion structure within seven cross section and
206 meter long of four cross sections downstream of the river. The selection of cross section sites were
based on the availability of river bend or meanderings in either side of the river bank. These helps to have a
the representative river bank sides. From the surveyed topographic data river cross section and slope were
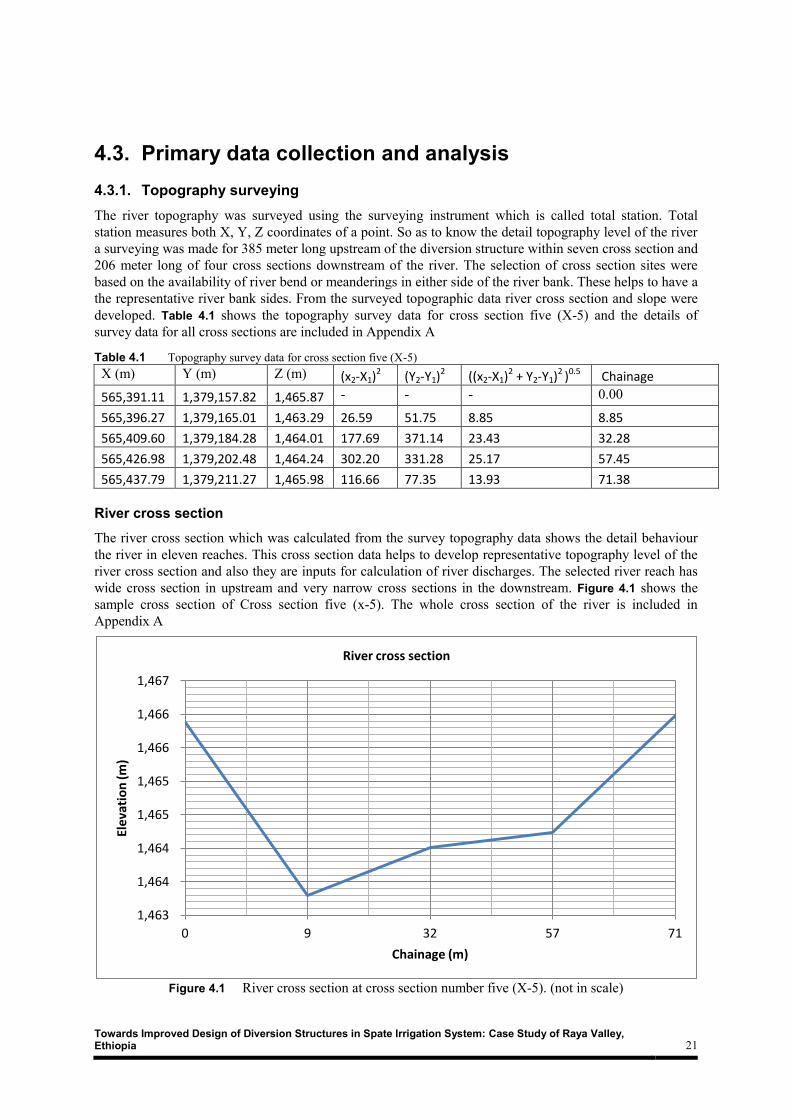
developed. Table 4.1 shows the topography survey data for cross section five (X-5) and the details of
survey data for all cross sections are included in Appendix A
Table 4.1 Topography survey data for cross section five (X-5)
X (m) Y (m) Z (m) (x2-X1)2 (Y2-Y1)2 ((x2-X1)2 + Y2-Y1)2 )0.5 Chainage
565,391.11 1,379,157.82 1,465.87 - - - 0.00
565,396.27 1,379,165.01 1,463.29 26.59 51.75 8.85 8.85
565,409.60 1,379,184.28 1,464.01 177.69 371.14 23.43 32.28
565,426.98 1,379,202.48 1,464.24 302.20 331.28 25.17 57.45
565,437.79 1,379,211.27 1,465.98 116.66 77.35 13.93 71.38
River cross section
The river cross section which was calculated from the survey topography data shows the detail behaviour
the river in eleven reaches. This cross section data helps to develop representative topography level of the
river cross section and also they are inputs for calculation of river discharges. The selected river reach has
wide cross section in upstream and very narrow cross sections in the downstream. Figure 4.1 shows the
sample cross section of Cross section five (x-5). The whole cross section of the river is included in
Appendix A
Figure 4.1 River cross section at cross section number five (X-5). (not in scale)
1,463
1,464
1,464
1,465
1,465
1,466
1,466
1,467
0 9 32 57 71
Elev
atio
n (m
)
Chainage (m)
River cross section

Data collection and analysis 22
Slope
The slope of the river which was determined from the surveyed river topography shows that the average
upstream part of the river diversion has a slope of 0.010 m/m and the average slope of the downstream of
diversion was 0.013 m/m. Therefore the total average slope of river reach is 0.011 m/m. Figure 4.2 shows
the longitudinal river slope profile above and below diversion structure. Slope of the river is an important
input for discharge calculation when using Manning and Bathurst formulas. It is also important parameter
for grid and bathymetry developments.
Figure 4.2 River bed slope in longitudinal direction (not in scale)
4.3.2. Head work measurements
All the head work dimensions were measured using a measuring tape. This data were used to generate the
detail size and location of the diversion structures like gate size, angle and weir axis length. This data are
use full parameters for bathymetry generation and used as an inputs for delft 3D software program.
The measured dimensions of diversion structures are:
Total weir length 29 m
Intake width 3 m in the right side of river
Deflection angle of intake 1200 to the river flow direction
2 Under sluice gate 0.9 m and 2.7 long
Upstream retaining wall length 28 m in both sides
Height of upstream retaining wall ranges 2.2 to 3 m
Weir depth above apron level 3 m
Apron length 20 m
Downstream retaining wall length left side 25 m and 30 right side
Height of downstream retaining wall 4.4 m
1,456
1,458
1,460
1,462
1,464
1,466
1,468
0 100 200 300 400 500 600 700
Ele
vati
on
(m)
Longitudinal river length (m)
River slope
Weir axis
Towards Improved Design of Diversion Structures in Spate Irrigation System: Case Study of Raya Valley, Ethiopia 23
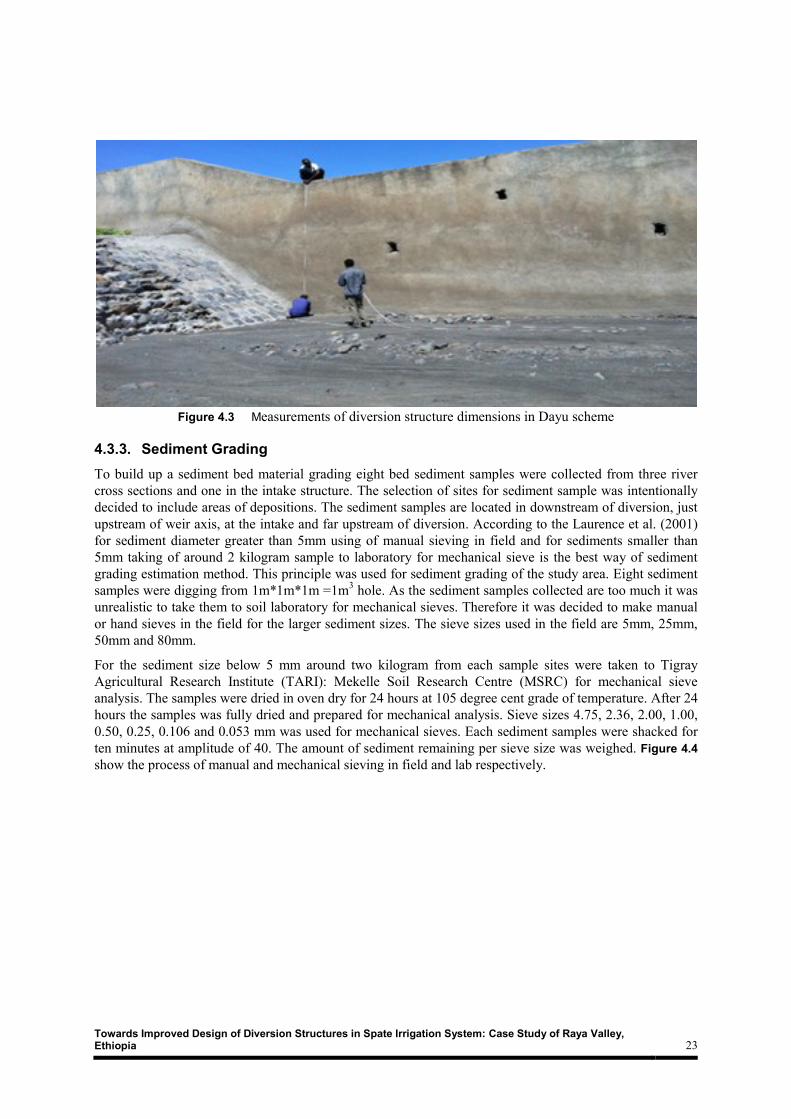
Figure 4.3 Measurements of diversion structure dimensions in Dayu scheme
4.3.3. Sediment Grading
To build up a sediment bed material grading eight bed sediment samples were collected from three river
cross sections and one in the intake structure. The selection of sites for sediment sample was intentionally
decided to include areas of depositions. The sediment samples are located in downstream of diversion, just
upstream of weir axis, at the intake and far upstream of diversion. According to the Laurence et al. (2001)
for sediment diameter greater than 5mm using of manual sieving in field and for sediments smaller than
5mm taking of around 2 kilogram sample to laboratory for mechanical sieve is the best way of sediment
grading estimation method. This principle was used for sediment grading of the study area. Eight sediment
samples were digging from 1m*1m*1m =1m3 hole. As the sediment samples collected are too much it was
unrealistic to take them to soil laboratory for mechanical sieves. Therefore it was decided to make manual
or hand sieves in the field for the larger sediment sizes. The sieve sizes used in the field are 5mm, 25mm,
50mm and 80mm.
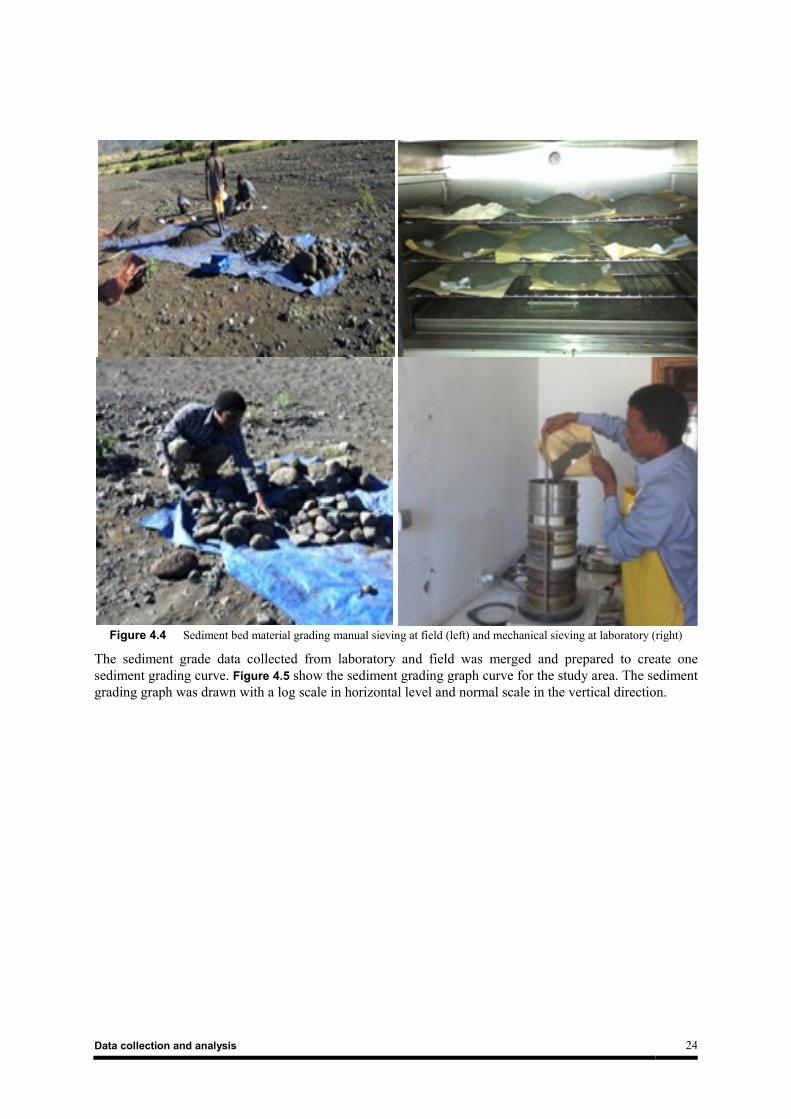
For the sediment size below 5 mm around two kilogram from each sample sites were taken to Tigray
Agricultural Research Institute (TARI): Mekelle Soil Research Centre (MSRC) for mechanical sieve
analysis. The samples were dried in oven dry for 24 hours at 105 degree cent grade of temperature. After 24
hours the samples was fully dried and prepared for mechanical analysis. Sieve sizes 4.75, 2.36, 2.00, 1.00,
0.50, 0.25, 0.106 and 0.053 mm was used for mechanical sieves. Each sediment samples were shacked for
ten minutes at amplitude of 40. The amount of sediment remaining per sieve size was weighed. Figure 4.4
show the process of manual and mechanical sieving in field and lab respectively.
Data collection and analysis 24
Figure 4.4 Sediment bed material grading manual sieving at field (left) and mechanical sieving at laboratory (right)
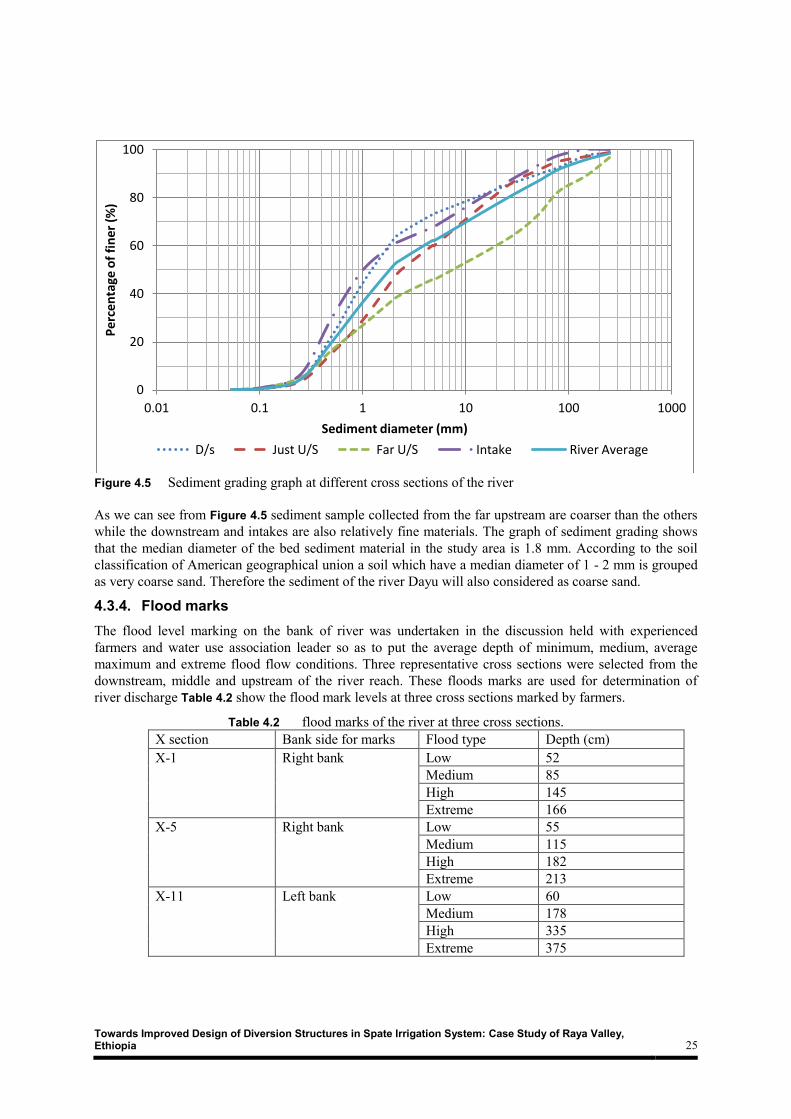
The sediment grade data collected from laboratory and field was merged and prepared to create one
sediment grading curve. Figure 4.5 show the sediment grading graph curve for the study area. The sediment
grading graph was drawn with a log scale in horizontal level and normal scale in the vertical direction.
Towards Improved Design of Diversion Structures in Spate Irrigation System: Case Study of Raya Valley, Ethiopia 25
Figure 4.5 Sediment grading graph at different cross sections of the river
As we can see from Figure 4.5 sediment sample collected from the far upstream are coarser than the others
while the downstream and intakes are also relatively fine materials. The graph of sediment grading shows
that the median diameter of the bed sediment material in the study area is 1.8 mm. According to the soil
classification of American geographical union a soil which have a median diameter of 1 - 2 mm is grouped
as very coarse sand. Therefore the sediment of the river Dayu will also considered as coarse sand.
4.3.4. Flood marks
The flood level marking on the bank of river was undertaken in the discussion held with experienced
farmers and water use association leader so as to put the average depth of minimum, medium, average
maximum and extreme flood flow conditions. Three representative cross sections were selected from the
downstream, middle and upstream of the river reach. These floods marks are used for determination of
river discharge Table 4.2 show the flood mark levels at three cross sections marked by farmers.
Table 4.2 flood marks of the river at three cross sections.
X section Bank side for marks Flood type Depth (cm)
X-1 Right bank Low 52
Medium 85
High 145
Extreme 166
X-5 Right bank Low 55
Medium 115
High 182
Extreme 213
X-11 Left bank Low 60
Medium 178
High 335
Extreme 375
0
20
40
60
80
100
0.01 0.1 1 10 100 1000
Pe
rce
nta
ge o
f fi
ner
(%
)
Sediment diameter (mm)
D/s Just U/S Far U/S Intake River Average

Data collection and analysis 26
4.3.5. River discharge
Since there is no discharge data on the study area a slope area method of Manning`s and Bathurst formula
were employed to determination or estimate river discharge. The main inputs for these equations are
manning roughness coefficient, river cross section and slope of the river reach.
Manning
Bathurst, 1985
Where:
Q = Discharge in m3/s
A = Cross section of river in m2
R = Hydraulic radius which is area per wetted perimeter in m
S = River slope in m/m
n = manning roughness coefficient
d = mean flow depth, similar with R
D84 = size of bed material with 84 percent is finer in m
G = acceleration due to gravity m/s2
Using the flood marks of three different cross sections and other river parameters like slope, manning
coefficients the discharge for each flow levels were calculated using the Manning`s and Bathurst formula.
Table 4.3 presents discharge calculation using Manning`s and Bathurst formula at cross section one. The
discharge of cross sections 1, 5 and 11 are also included in Appendix C in details. And finally the average
discharges of the three cross sections were used as the discharge of the river flow.
Table 4.3 Discharge calculations in cross section one (X-1)
Flow type
River cross Section one (X-1)
Head
(m)
Area
(m2)
Perimeter
(m)
R
(m)
S
(m/m)
n
(-)
Manning`s
Q (m3/s)
D84
(m)
D*
(-)
Bathurst`s
Q (m3/s)
Minimum 0.52 5.84 22.32 0.26 0.011 0.030 8 0.04 8.58 8
Medium 0.85 26.68 72.97 0.37 0.011 0.030 48 0.04 9.39 50
Maximum 1.45 75.85 88.33 0.86 0.011 0.030 239 0.04 11.48 265
Extreme 1.66 95.03 96.54 0.98 0.011 0.030 329 0.04 11.81 366
According to Arcement and Schneider (1989) the roughness coefficient (n) of gravel with median size of
bed material 1-2 mm ranges from 0.026 - 0.035. As the median size bed sediment material of the study area
are 1.8 mm an average roughness coefficient of 0.030 was used for the calculation of discharge using
Manning formula and an analysis of discharge sensitivity analysis was made to different roughness
coefficient in the range value of coarse sand bed material as presented in Figure 4.6
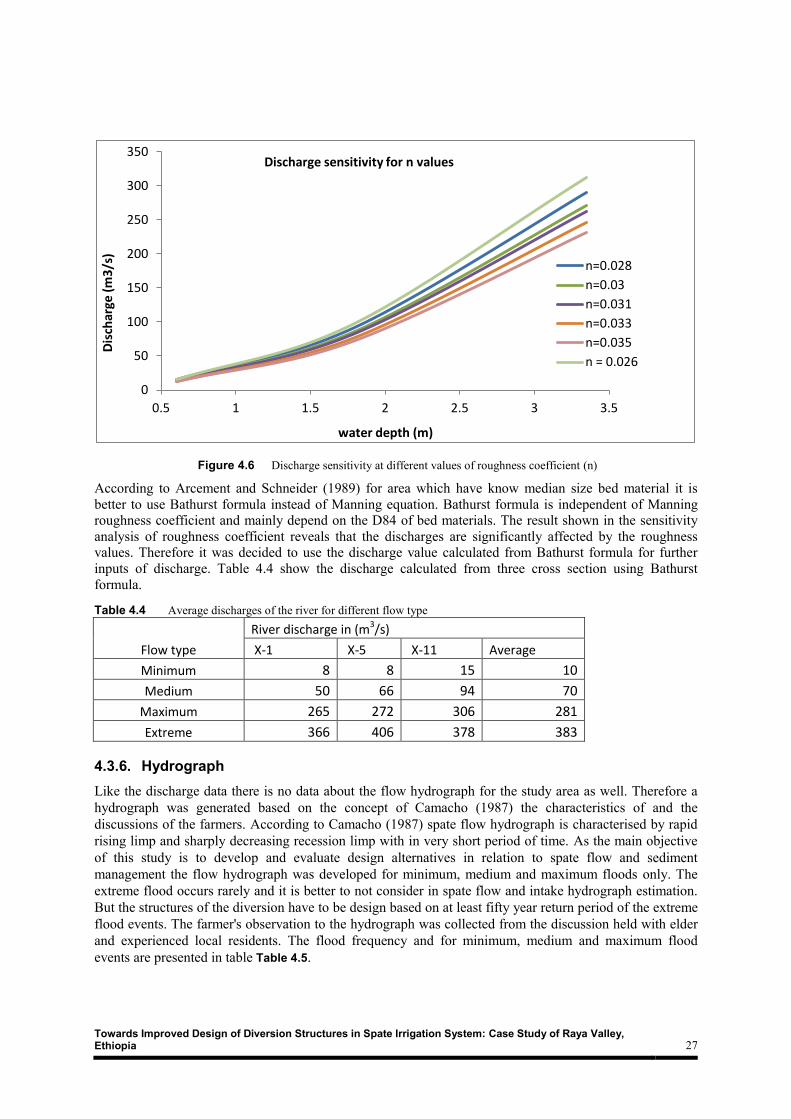
Towards Improved Design of Diversion Structures in Spate Irrigation System: Case Study of Raya Valley, Ethiopia 27
Figure 4.6 Discharge sensitivity at different values of roughness coefficient (n)
According to Arcement and Schneider (1989) for area which have know median size bed material it is
better to use Bathurst formula instead of Manning equation. Bathurst formula is independent of Manning
roughness coefficient and mainly depend on the D84 of bed materials. The result shown in the sensitivity
analysis of roughness coefficient reveals that the discharges are significantly affected by the roughness
values. Therefore it was decided to use the discharge value calculated from Bathurst formula for further
inputs of discharge. Table 4.4 show the discharge calculated from three cross section using Bathurst
formula.
Table 4.4 Average discharges of the river for different flow type
Flow type
River discharge in (m3/s)
X-1 X-5 X-11 Average
Minimum 8 8 15 10
Medium 50 66 94 70
Maximum 265 272 306 281
Extreme 366 406 378 383
4.3.6. Hydrograph
Like the discharge data there is no data about the flow hydrograph for the study area as well. Therefore a
hydrograph was generated based on the concept of Camacho (1987) the characteristics of and the
discussions of the farmers. According to Camacho (1987) spate flow hydrograph is characterised by rapid
rising limp and sharply decreasing recession limp with in very short period of time. As the main objective
of this study is to develop and evaluate design alternatives in relation to spate flow and sediment
management the flow hydrograph was developed for minimum, medium and maximum floods only. The
extreme flood occurs rarely and it is better to not consider in spate flow and intake hydrograph estimation.
But the structures of the diversion have to be design based on at least fifty year return period of the extreme
flood events. The farmer's observation to the hydrograph was collected from the discussion held with elder
and experienced local residents. The flood frequency and for minimum, medium and maximum flood
events are presented in table Table 4.5.
0
50
100
150
200
250
300
350
0.5 1 1.5 2 2.5 3 3.5
Dis
char
ge (
m3
/s)
water depth (m)
Discharge sensitivity for n values
n=0.028
n=0.03
n=0.031
n=0.033
n=0.035
n = 0.026
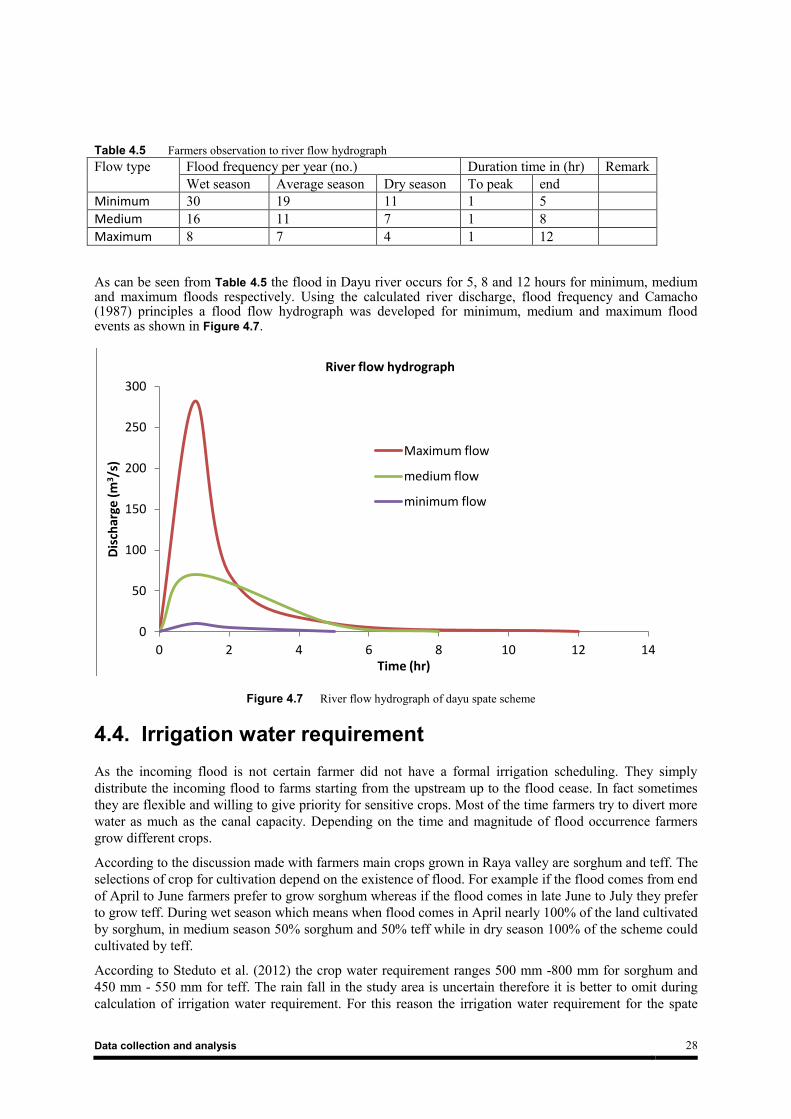
Data collection and analysis 28
Table 4.5 Farmers observation to river flow hydrograph
Flow type Flood frequency per year (no.) Duration time in (hr) Remark
Wet season Average season Dry season To peak end
Minimum 30 19 11 1 5
Medium 16 11 7 1 8
Maximum 8 7 4 1 12
As can be seen from Table 4.5 the flood in Dayu river occurs for 5, 8 and 12 hours for minimum, medium and maximum floods respectively. Using the calculated river discharge, flood frequency and Camacho (1987) principles a flood flow hydrograph was developed for minimum, medium and maximum flood events as shown in Figure 4.7.
Figure 4.7 River flow hydrograph of dayu spate scheme
4.4. Irrigation water requirement
As the incoming flood is not certain farmer did not have a formal irrigation scheduling. They simply
distribute the incoming flood to farms starting from the upstream up to the flood cease. In fact sometimes
they are flexible and willing to give priority for sensitive crops. Most of the time farmers try to divert more
water as much as the canal capacity. Depending on the time and magnitude of flood occurrence farmers
grow different crops.
According to the discussion made with farmers main crops grown in Raya valley are sorghum and teff. The
selections of crop for cultivation depend on the existence of flood. For example if the flood comes from end
of April to June farmers prefer to grow sorghum whereas if the flood comes in late June to July they prefer
to grow teff. During wet season which means when flood comes in April nearly 100% of the land cultivated
by sorghum, in medium season 50% sorghum and 50% teff while in dry season 100% of the scheme could
cultivated by teff.
According to Steduto et al. (2012) the crop water requirement ranges 500 mm -800 mm for sorghum and
450 mm - 550 mm for teff. The rain fall in the study area is uncertain therefore it is better to omit during
calculation of irrigation water requirement. For this reason the irrigation water requirement for the spate
0
50
100
150
200
250
300
0 2 4 6 8 10 12 14
Dis
char
ge (
m3 /
s)
Time (hr)
River flow hydrograph
Maximum flow
medium flow
minimum flow
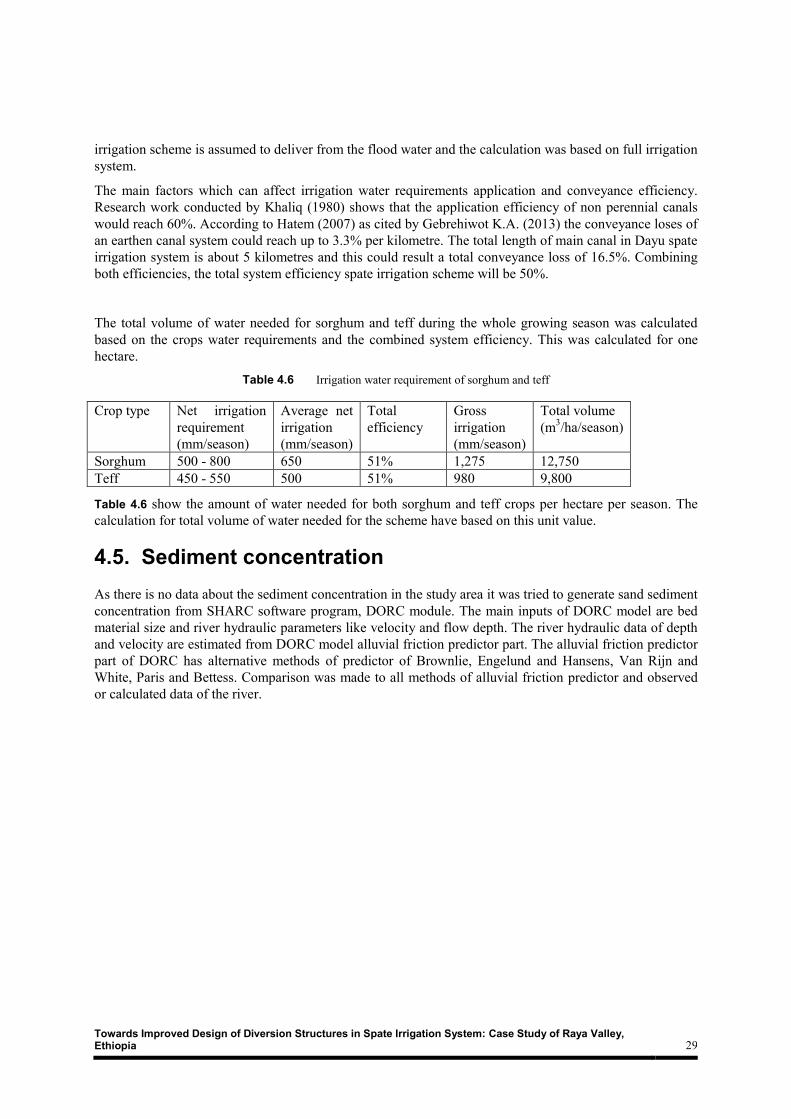
Towards Improved Design of Diversion Structures in Spate Irrigation System: Case Study of Raya Valley, Ethiopia 29
irrigation scheme is assumed to deliver from the flood water and the calculation was based on full irrigation
system.
The main factors which can affect irrigation water requirements application and conveyance efficiency.
Research work conducted by Khaliq (1980) shows that the application efficiency of non perennial canals
would reach 60%. According to Hatem (2007) as cited by Gebrehiwot K.A. (2013) the conveyance loses of
an earthen canal system could reach up to 3.3% per kilometre. The total length of main canal in Dayu spate
irrigation system is about 5 kilometres and this could result a total conveyance loss of 16.5%. Combining
both efficiencies, the total system efficiency spate irrigation scheme will be 50%.
The total volume of water needed for sorghum and teff during the whole growing season was calculated
based on the crops water requirements and the combined system efficiency. This was calculated for one
hectare.
Table 4.6 Irrigation water requirement of sorghum and teff
Crop type Net irrigation
requirement
(mm/season)
Average net
irrigation
(mm/season)
Total
efficiency
Gross
irrigation
(mm/season)
Total volume
(m3/ha/season)
Sorghum 500 - 800 650 51% 1,275 12,750
Teff 450 - 550 500 51% 980 9,800
Table 4.6 show the amount of water needed for both sorghum and teff crops per hectare per season. The
calculation for total volume of water needed for the scheme have based on this unit value.
4.5. Sediment concentration
As there is no data about the sediment concentration in the study area it was tried to generate sand sediment
concentration from SHARC software program, DORC module. The main inputs of DORC model are bed
material size and river hydraulic parameters like velocity and flow depth. The river hydraulic data of depth
and velocity are estimated from DORC model alluvial friction predictor part. The alluvial friction predictor
part of DORC has alternative methods of predictor of Brownlie, Engelund and Hansens, Van Rijn and
White, Paris and Bettess. Comparison was made to all methods of alluvial friction predictor and observed
or calculated data of the river.
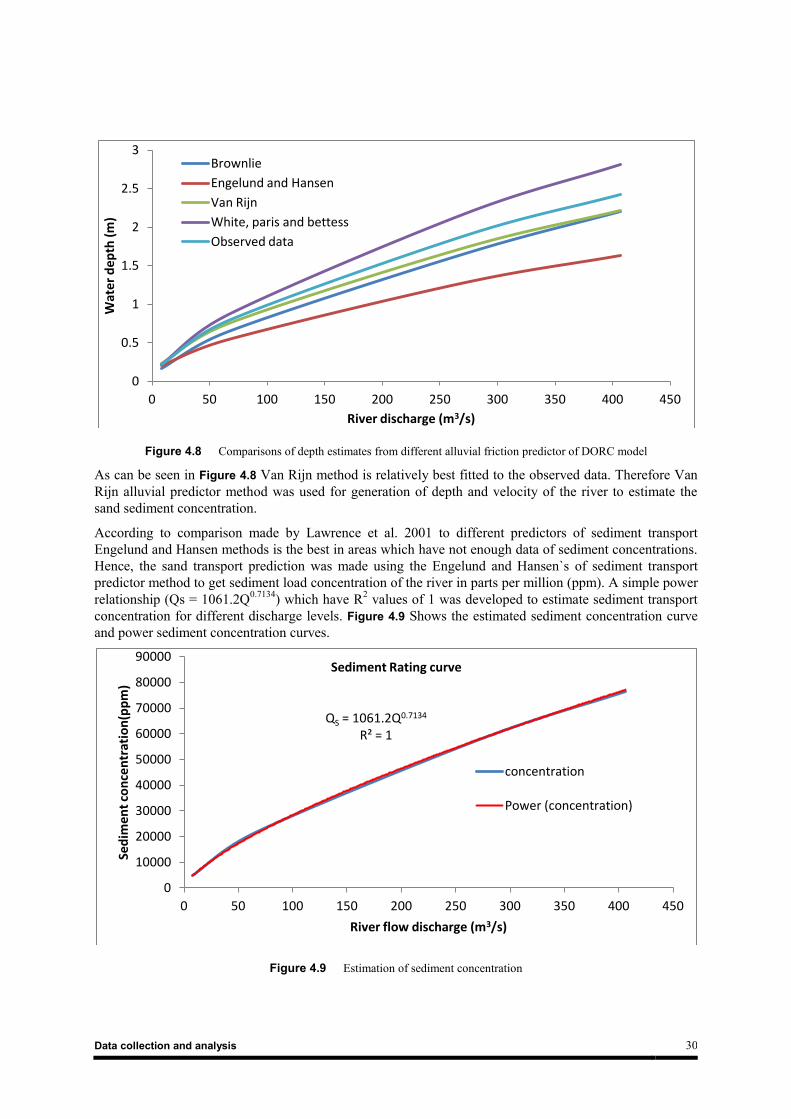
Data collection and analysis 30
Figure 4.8 Comparisons of depth estimates from different alluvial friction predictor of DORC model
As can be seen in Figure 4.8 Van Rijn method is relatively best fitted to the observed data. Therefore Van
Rijn alluvial predictor method was used for generation of depth and velocity of the river to estimate the
sand sediment concentration.
According to comparison made by Lawrence et al. 2001 to different predictors of sediment transport
Engelund and Hansen methods is the best in areas which have not enough data of sediment concentrations.
Hence, the sand transport prediction was made using the Engelund and Hansen`s of sediment transport
predictor method to get sediment load concentration of the river in parts per million (ppm). A simple power
relationship (Qs = 1061.2Q0.7134
) which have R2 values of 1 was developed to estimate sediment transport
concentration for different discharge levels. Figure 4.9 Shows the estimated sediment concentration curve
and power sediment concentration curves.
Figure 4.9 Estimation of sediment concentration
0
0.5
1
1.5
2
2.5
3
0 50 100 150 200 250 300 350 400 450
Wat
er
dep
th (
m)
River discharge (m3/s)
Brownlie
Engelund and Hansen
Van Rijn
White, paris and bettess
Observed data
QS = 1061.2Q0.7134 R² = 1
0
10000
20000
30000
40000
50000
60000
70000
80000
90000
0 50 100 150 200 250 300 350 400 450
Sed
imen
t co
nce
ntr
atio
n(p
pm
)
River flow discharge (m3/s)
Sediment Rating curve
concentration
Power (concentration)
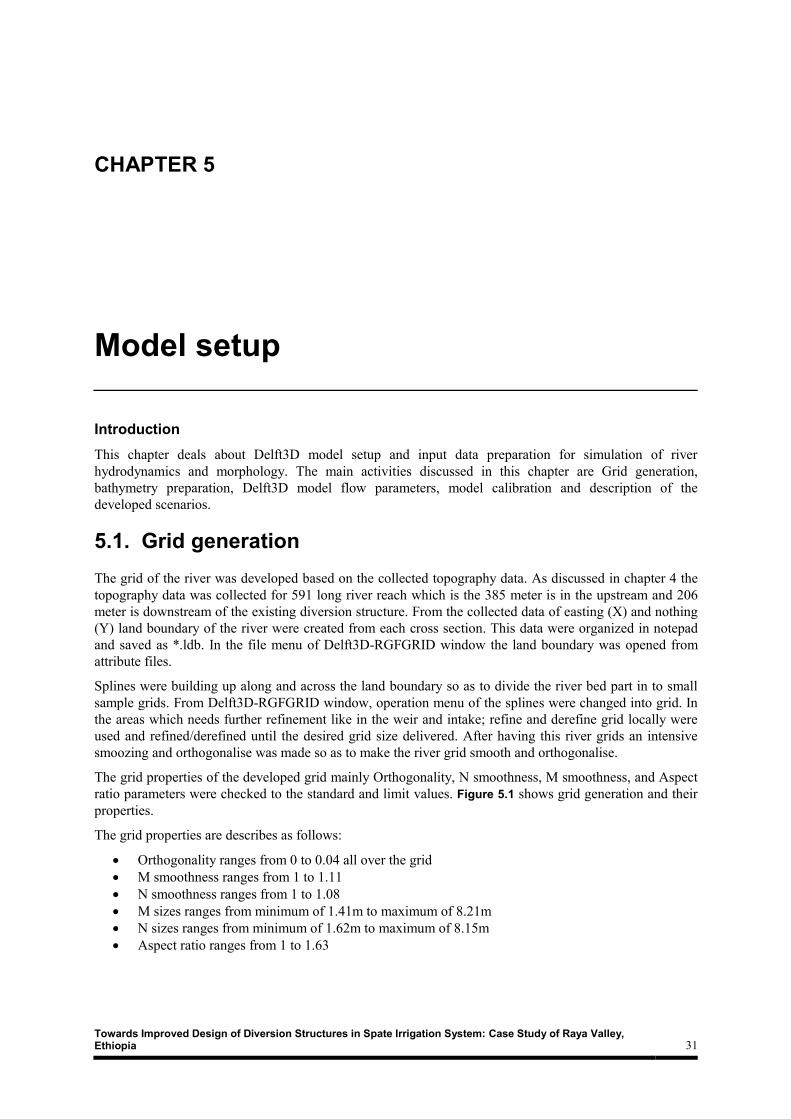
Towards Improved Design of Diversion Structures in Spate Irrigation System: Case Study of Raya Valley, Ethiopia 31
Introduction
This chapter deals about Delft3D model setup and input data preparation for simulation of river
hydrodynamics and morphology. The main activities discussed in this chapter are Grid generation,
bathymetry preparation, Delft3D model flow parameters, model calibration and description of the
developed scenarios.
5.1. Grid generation
The grid of the river was developed based on the collected topography data. As discussed in chapter 4 the
topography data was collected for 591 long river reach which is the 385 meter is in the upstream and 206
meter is downstream of the existing diversion structure. From the collected data of easting (X) and nothing
(Y) land boundary of the river were created from each cross section. This data were organized in notepad
and saved as *.ldb. In the file menu of Delft3D-RGFGRID window the land boundary was opened from
attribute files.
Splines were building up along and across the land boundary so as to divide the river bed part in to small
sample grids. From Delft3D-RGFGRID window, operation menu of the splines were changed into grid. In
the areas which needs further refinement like in the weir and intake; refine and derefine grid locally were
used and refined/derefined until the desired grid size delivered. After having this river grids an intensive
smoozing and orthogonalise was made so as to make the river grid smooth and orthogonalise.
The grid properties of the developed grid mainly Orthogonality, N smoothness, M smoothness, and Aspect
ratio parameters were checked to the standard and limit values. Figure 5.1 shows grid generation and their
properties.
The grid properties are describes as follows:
Orthogonality ranges from 0 to 0.04 all over the grid
M smoothness ranges from 1 to 1.11
N smoothness ranges from 1 to 1.08
M sizes ranges from minimum of 1.41m to maximum of 8.21m
N sizes ranges from minimum of 1.62m to maximum of 8.15m
Aspect ratio ranges from 1 to 1.63
CHAPTER 5
Model setup
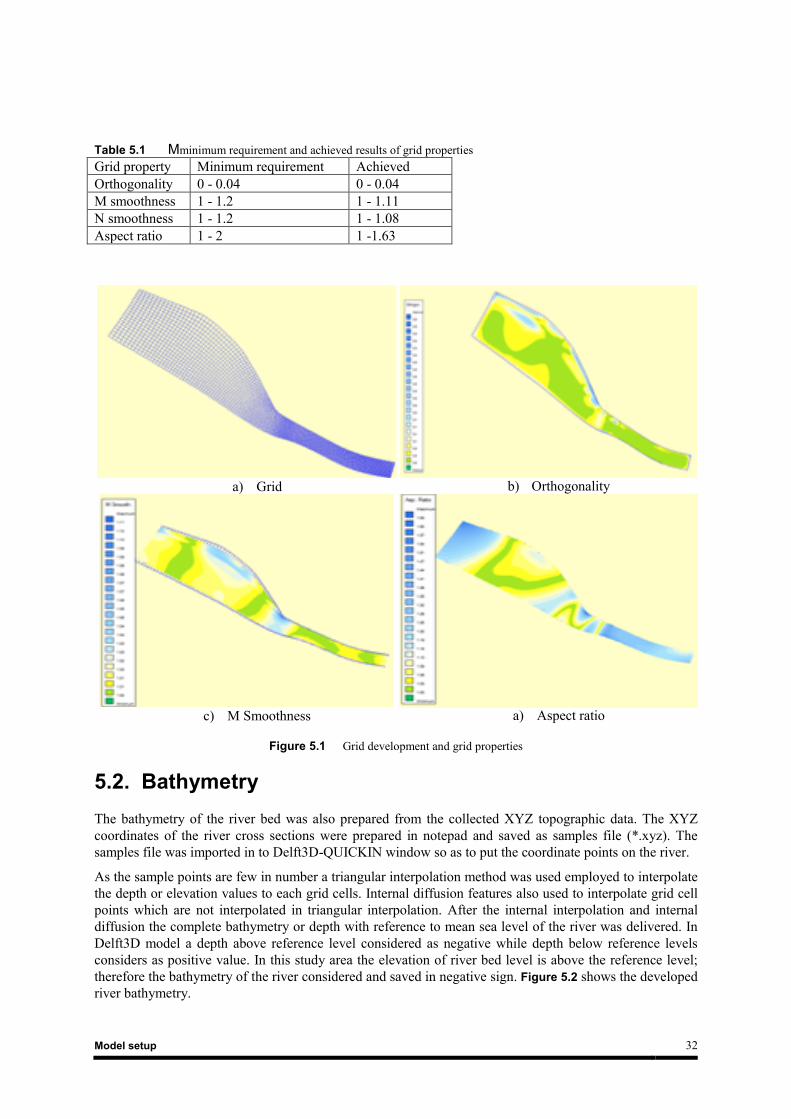
Model setup 32
Table 5.1 Mminimum requirement and achieved results of grid properties
Grid property Minimum requirement Achieved
Orthogonality 0 - 0.04 0 - 0.04
M smoothness 1 - 1.2 1 - 1.11
N smoothness 1 - 1.2 1 - 1.08
Aspect ratio 1 - 2 1 -1.63
a) Grid
b) Orthogonality
c) M Smoothness
a) Aspect ratio
Figure 5.1 Grid development and grid properties
5.2. Bathymetry
The bathymetry of the river bed was also prepared from the collected XYZ topographic data. The XYZ
coordinates of the river cross sections were prepared in notepad and saved as samples file (*.xyz). The
samples file was imported in to Delft3D-QUICKIN window so as to put the coordinate points on the river.
As the sample points are few in number a triangular interpolation method was used employed to interpolate
the depth or elevation values to each grid cells. Internal diffusion features also used to interpolate grid cell
points which are not interpolated in triangular interpolation. After the internal interpolation and internal
diffusion the complete bathymetry or depth with reference to mean sea level of the river was delivered. In
Delft3D model a depth above reference level considered as negative while depth below reference levels
considers as positive value. In this study area the elevation of river bed level is above the reference level;
therefore the bathymetry of the river considered and saved in negative sign. Figure 5.2 shows the developed
river bathymetry.
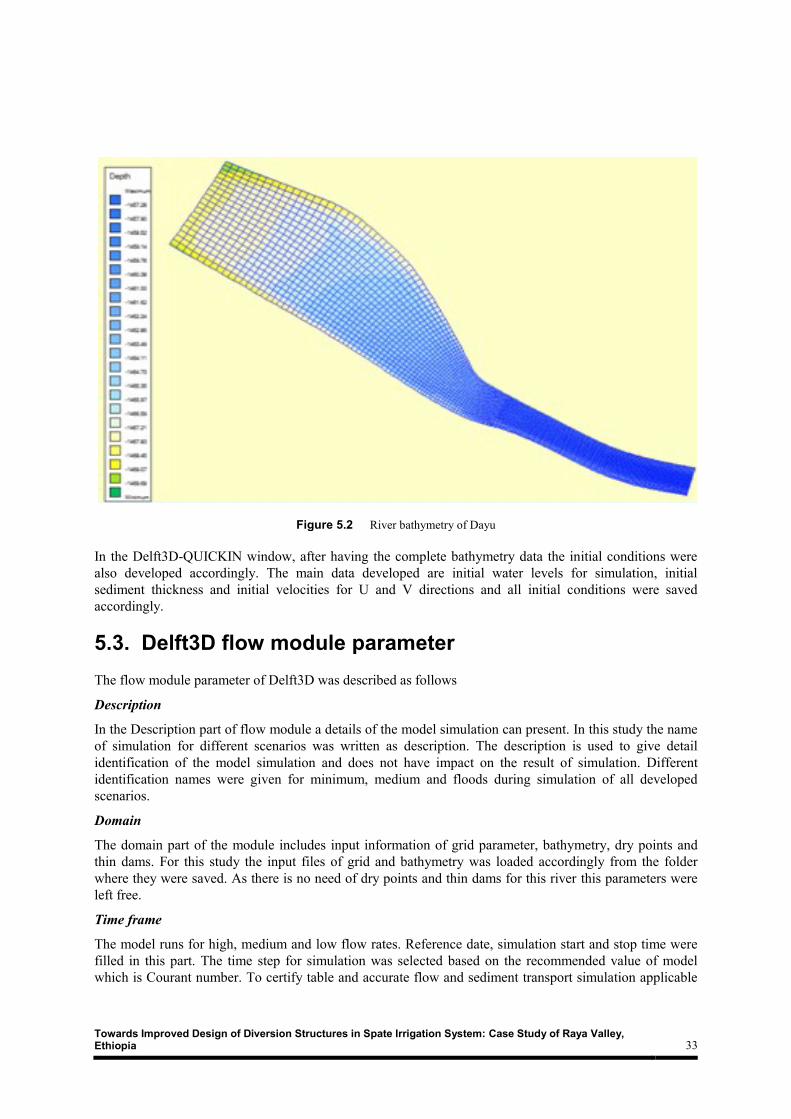
Towards Improved Design of Diversion Structures in Spate Irrigation System: Case Study of Raya Valley, Ethiopia 33
Figure 5.2 River bathymetry of Dayu
In the Delft3D-QUICKIN window, after having the complete bathymetry data the initial conditions were
also developed accordingly. The main data developed are initial water levels for simulation, initial
sediment thickness and initial velocities for U and V directions and all initial conditions were saved
accordingly.
5.3. Delft3D flow module parameter
The flow module parameter of Delft3D was described as follows
Description
In the Description part of flow module a details of the model simulation can present. In this study the name
of simulation for different scenarios was written as description. The description is used to give detail
identification of the model simulation and does not have impact on the result of simulation. Different
identification names were given for minimum, medium and floods during simulation of all developed
scenarios.
Domain
The domain part of the module includes input information of grid parameter, bathymetry, dry points and
thin dams. For this study the input files of grid and bathymetry was loaded accordingly from the folder
where they were saved. As there is no need of dry points and thin dams for this river this parameters were
left free.
Time frame
The model runs for high, medium and low flow rates. Reference date, simulation start and stop time were
filled in this part. The time step for simulation was selected based on the recommended value of model
which is Courant number. To certify table and accurate flow and sediment transport simulation applicable
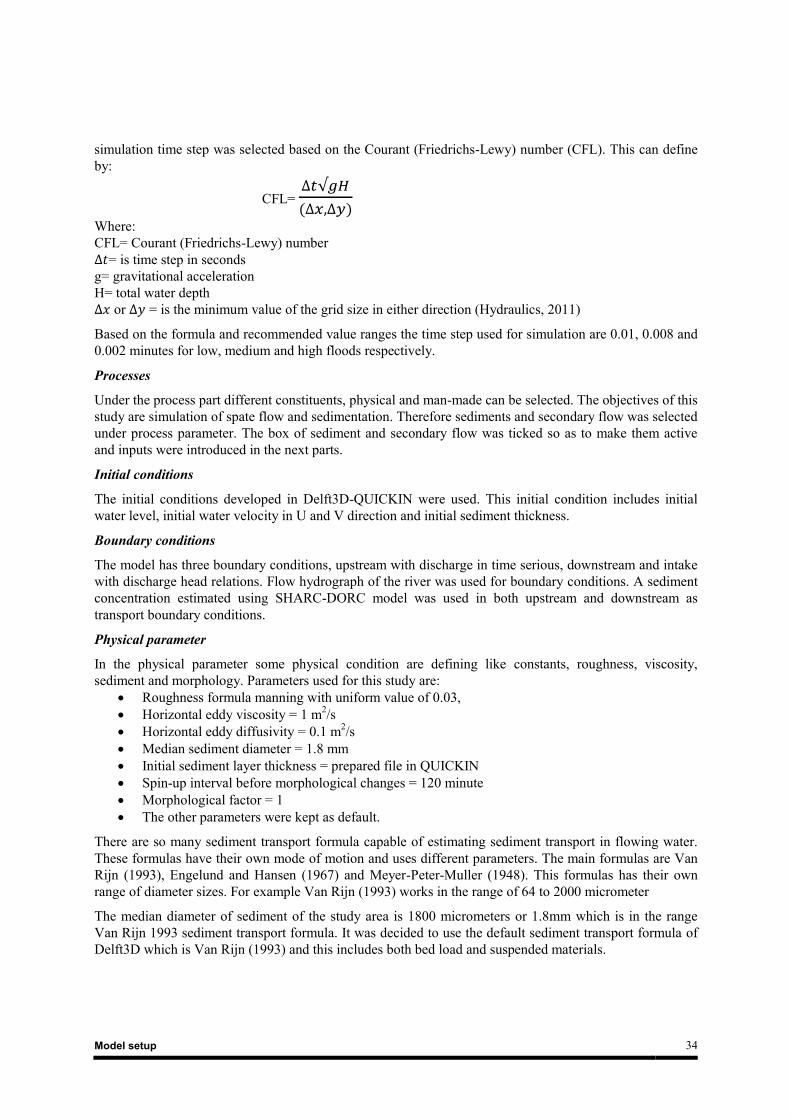
Model setup 34
simulation time step was selected based on the Courant (Friedrichs-Lewy) number (CFL). This can define
by:
CFL=
Where:
CFL= Courant (Friedrichs-Lewy) number
= is time step in seconds
g= gravitational acceleration
H= total water depth
or = is the minimum value of the grid size in either direction (Hydraulics, 2011)
Based on the formula and recommended value ranges the time step used for simulation are 0.01, 0.008 and
0.002 minutes for low, medium and high floods respectively.
Processes
Under the process part different constituents, physical and man-made can be selected. The objectives of this
study are simulation of spate flow and sedimentation. Therefore sediments and secondary flow was selected
under process parameter. The box of sediment and secondary flow was ticked so as to make them active
and inputs were introduced in the next parts.
Initial conditions
The initial conditions developed in Delft3D-QUICKIN were used. This initial condition includes initial
water level, initial water velocity in U and V direction and initial sediment thickness.
Boundary conditions
The model has three boundary conditions, upstream with discharge in time serious, downstream and intake
with discharge head relations. Flow hydrograph of the river was used for boundary conditions. A sediment
concentration estimated using SHARC-DORC model was used in both upstream and downstream as
transport boundary conditions.
Physical parameter
In the physical parameter some physical condition are defining like constants, roughness, viscosity,
sediment and morphology. Parameters used for this study are:
Roughness formula manning with uniform value of 0.03,
Horizontal eddy viscosity = 1 m2/s
Horizontal eddy diffusivity = 0.1 m2/s
Median sediment diameter = 1.8 mm
Initial sediment layer thickness = prepared file in QUICKIN
Spin-up interval before morphological changes = 120 minute
Morphological factor = 1
The other parameters were kept as default.
There are so many sediment transport formula capable of estimating sediment transport in flowing water.
These formulas have their own mode of motion and uses different parameters. The main formulas are Van
Rijn (1993), Engelund and Hansen (1967) and Meyer-Peter-Muller (1948). This formulas has their own
range of diameter sizes. For example Van Rijn (1993) works in the range of 64 to 2000 micrometer
The median diameter of sediment of the study area is 1800 micrometers or 1.8mm which is in the range
Van Rijn 1993 sediment transport formula. It was decided to use the default sediment transport formula of
Delft3D which is Van Rijn (1993) and this includes both bed load and suspended materials.
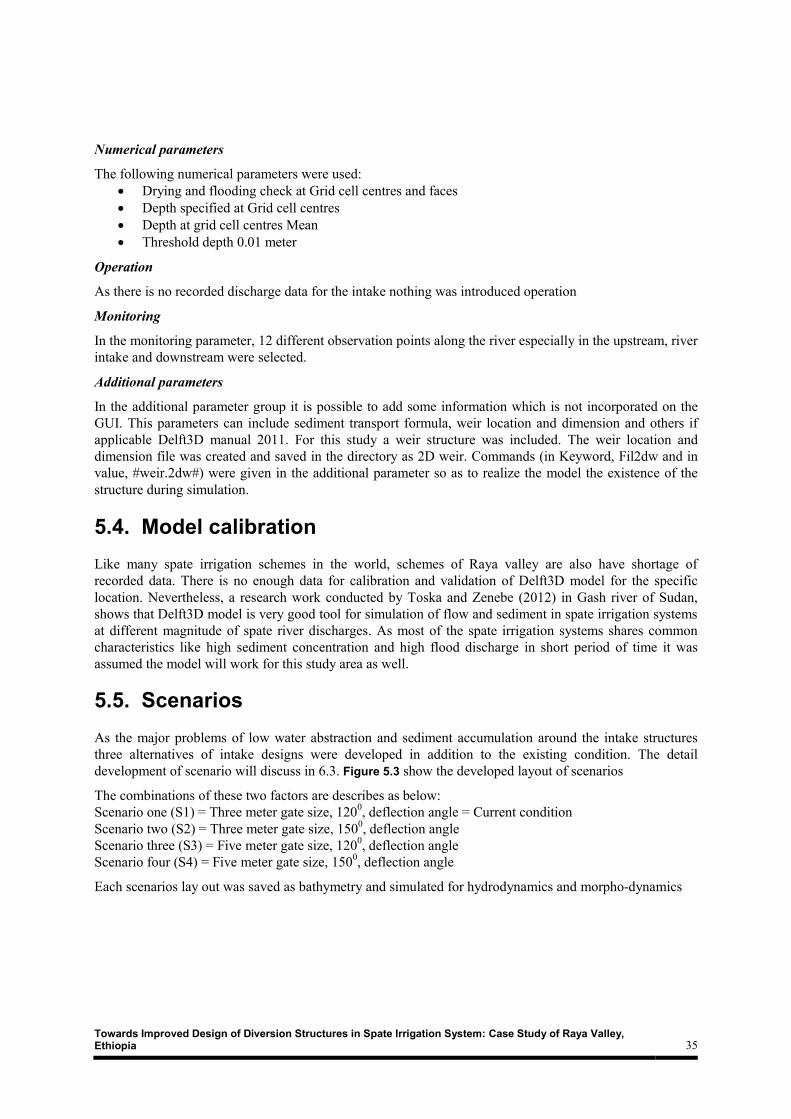
Towards Improved Design of Diversion Structures in Spate Irrigation System: Case Study of Raya Valley, Ethiopia 35
Numerical parameters
The following numerical parameters were used:
Drying and flooding check at Grid cell centres and faces
Depth specified at Grid cell centres
Depth at grid cell centres Mean
Threshold depth 0.01 meter
Operation
As there is no recorded discharge data for the intake nothing was introduced operation
Monitoring
In the monitoring parameter, 12 different observation points along the river especially in the upstream, river
intake and downstream were selected.
Additional parameters
In the additional parameter group it is possible to add some information which is not incorporated on the
GUI. This parameters can include sediment transport formula, weir location and dimension and others if
applicable Delft3D manual 2011. For this study a weir structure was included. The weir location and
dimension file was created and saved in the directory as 2D weir. Commands (in Keyword, Fil2dw and in
value, #weir.2dw#) were given in the additional parameter so as to realize the model the existence of the
structure during simulation.
5.4. Model calibration
Like many spate irrigation schemes in the world, schemes of Raya valley are also have shortage of
recorded data. There is no enough data for calibration and validation of Delft3D model for the specific
location. Nevertheless, a research work conducted by Toska and Zenebe (2012) in Gash river of Sudan,
shows that Delft3D model is very good tool for simulation of flow and sediment in spate irrigation systems
at different magnitude of spate river discharges. As most of the spate irrigation systems shares common
characteristics like high sediment concentration and high flood discharge in short period of time it was
assumed the model will work for this study area as well.
5.5. Scenarios
As the major problems of low water abstraction and sediment accumulation around the intake structures
three alternatives of intake designs were developed in addition to the existing condition. The detail
development of scenario will discuss in 6.3. Figure 5.3 show the developed layout of scenarios
The combinations of these two factors are describes as below:
Scenario one (S1) = Three meter gate size, 1200, deflection angle = Current condition
Scenario two (S2) = Three meter gate size, 1500, deflection angle
Scenario three (S3) = Five meter gate size, 1200, deflection angle
Scenario four (S4) = Five meter gate size, 1500, deflection angle
Each scenarios lay out was saved as bathymetry and simulated for hydrodynamics and morpho-dynamics
Model setup 36
a) Scenario one
b) Scenario two
c) Scenario three
d) Scenario four
Figure 5.3 Layout of the developed scenarios
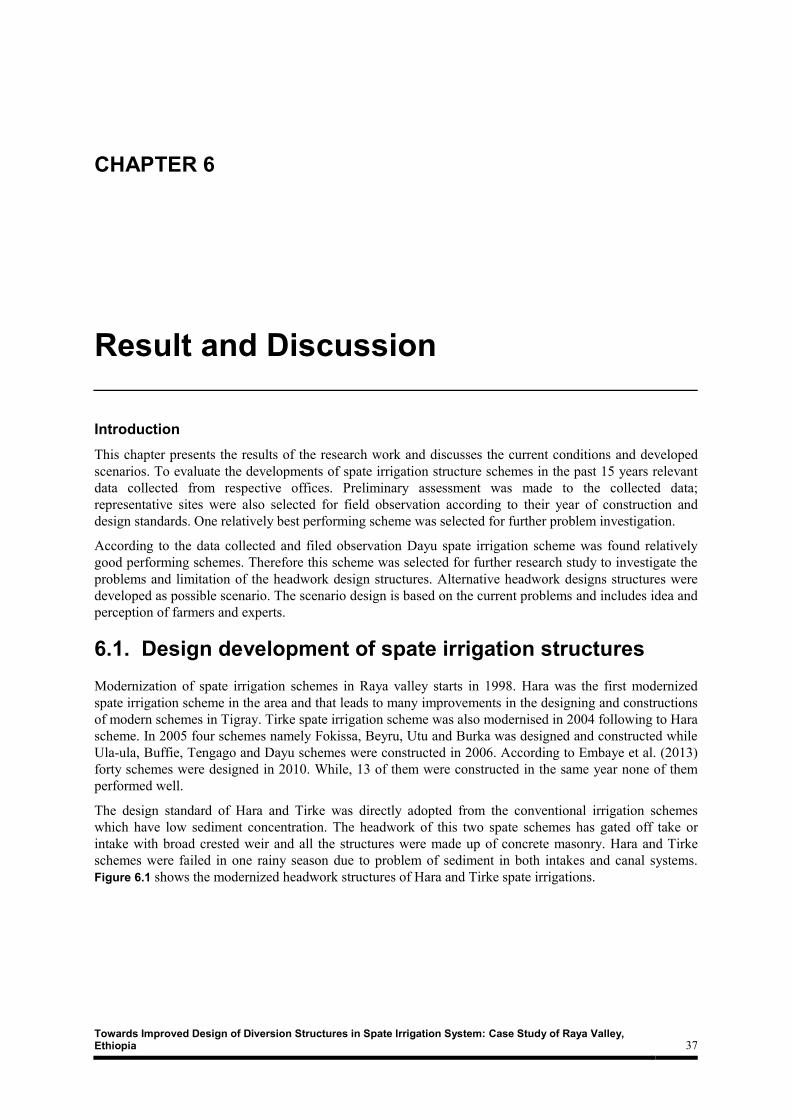
Towards Improved Design of Diversion Structures in Spate Irrigation System: Case Study of Raya Valley, Ethiopia 37
Introduction
This chapter presents the results of the research work and discusses the current conditions and developed
scenarios. To evaluate the developments of spate irrigation structure schemes in the past 15 years relevant
data collected from respective offices. Preliminary assessment was made to the collected data;
representative sites were also selected for field observation according to their year of construction and
design standards. One relatively best performing scheme was selected for further problem investigation.
According to the data collected and filed observation Dayu spate irrigation scheme was found relatively
good performing schemes. Therefore this scheme was selected for further research study to investigate the
problems and limitation of the headwork design structures. Alternative headwork designs structures were
developed as possible scenario. The scenario design is based on the current problems and includes idea and
perception of farmers and experts.
6.1. Design development of spate irrigation structures
Modernization of spate irrigation schemes in Raya valley starts in 1998. Hara was the first modernized
spate irrigation scheme in the area and that leads to many improvements in the designing and constructions
of modern schemes in Tigray. Tirke spate irrigation scheme was also modernised in 2004 following to Hara
scheme. In 2005 four schemes namely Fokissa, Beyru, Utu and Burka was designed and constructed while
Ula-ula, Buffie, Tengago and Dayu schemes were constructed in 2006. According to Embaye et al. (2013)
forty schemes were designed in 2010. While, 13 of them were constructed in the same year none of them
performed well.
The design standard of Hara and Tirke was directly adopted from the conventional irrigation schemes
which have low sediment concentration. The headwork of this two spate schemes has gated off take or
intake with broad crested weir and all the structures were made up of concrete masonry. Hara and Tirke
schemes were failed in one rainy season due to problem of sediment in both intakes and canal systems.
Figure 6.1 shows the modernized headwork structures of Hara and Tirke spate irrigations.
CHAPTER 6
Result and Discussion
Result and Discussion 38
Intake structure of Hara scheme
Under sluice gate in Hara scheme
Crossing structure, Hara spate scheme
Orifice intake, Tirke (adopted from Embaye, 2013)
Figure 6.1 Headwork structures of Hara and Tirke
According to the farmers perception the main reason for failure of these schemes was the inappropriate
design structure of intakes. During construction the farmers were complaining about the size, shape and
deflation angle of the gate. According to field observation and a report made by Embaye et al. (2013) the
intakes of Hara and Tirke has 900 deflection angles from the river flow direction and less than one meter
diameter of gate.
In 2005 when Fokissa, Beyru, Utu and Burka was designed and constructed the design engineers took key
lesson from the failure of Hara and Tirke. They came to realize that the incoming sediment or bed material
load was too high. Hence, they decided that gated intake, narrow canal and siphons cannot work as
structures of spate scheme. At that time the designers tried to know the indigenous knowledge of farmers
for sediment managements and they observed some traditional irrigation schemes in the valley.
The major findings of farmer's knowledge were wide open gate intake with an angle of deflection greater
than 900 and wide size of canals. To some extent experts tried to understand and incorporate farmers
traditional knowledge during design and construction. They took good lesson on size and deflection angle
of intake and they tried to give attention for sediment problems.
The major changes of the design include;
To change the gated intakes to open gate
To increase the width of the intakes and canals
Improving of diversion angle from 900 to 120
0
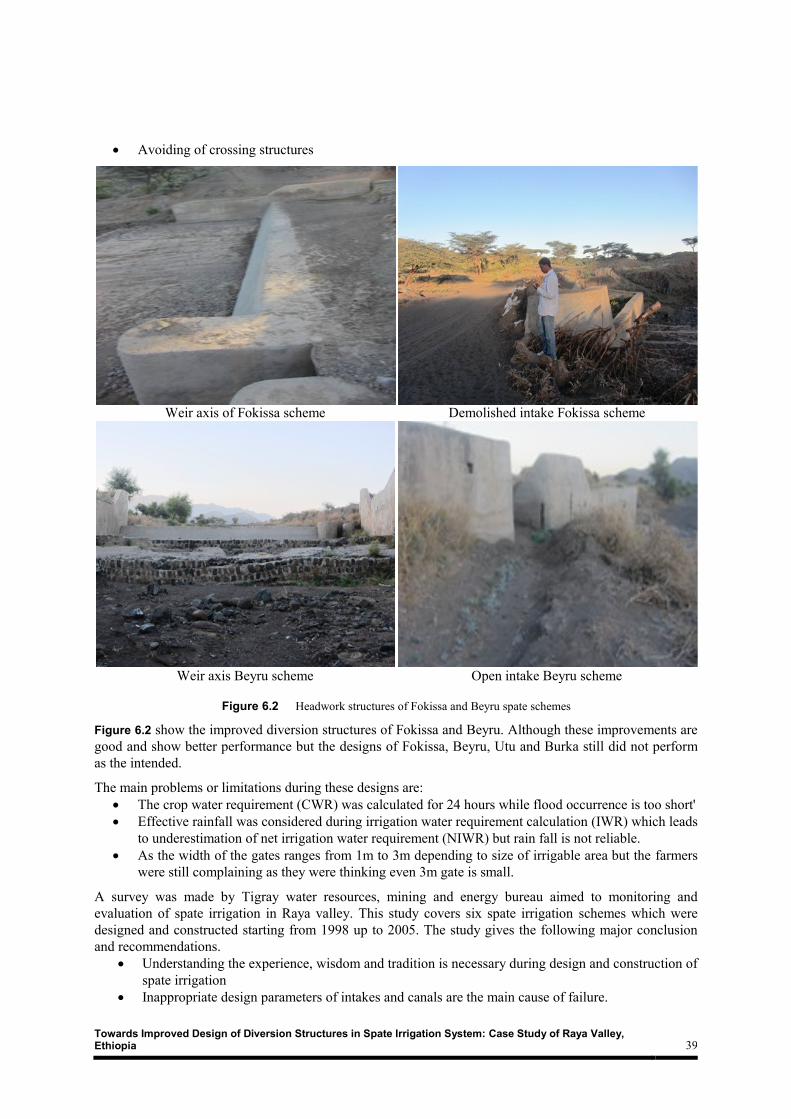
Towards Improved Design of Diversion Structures in Spate Irrigation System: Case Study of Raya Valley, Ethiopia 39
Avoiding of crossing structures
Weir axis of Fokissa scheme
Demolished intake Fokissa scheme
Weir axis Beyru scheme
Open intake Beyru scheme
Figure 6.2 Headwork structures of Fokissa and Beyru spate schemes
Figure 6.2 show the improved diversion structures of Fokissa and Beyru. Although these improvements are
good and show better performance but the designs of Fokissa, Beyru, Utu and Burka still did not perform
as the intended.
The main problems or limitations during these designs are:
The crop water requirement (CWR) was calculated for 24 hours while flood occurrence is too short'
Effective rainfall was considered during irrigation water requirement calculation (IWR) which leads
to underestimation of net irrigation water requirement (NIWR) but rain fall is not reliable.
As the width of the gates ranges from 1m to 3m depending to size of irrigable area but the farmers
were still complaining as they were thinking even 3m gate is small.
A survey was made by Tigray water resources, mining and energy bureau aimed to monitoring and
evaluation of spate irrigation in Raya valley. This study covers six spate irrigation schemes which were
designed and constructed starting from 1998 up to 2005. The study gives the following major conclusion
and recommendations.
Understanding the experience, wisdom and tradition is necessary during design and construction of
spate irrigation
Inappropriate design parameters of intakes and canals are the main cause of failure.
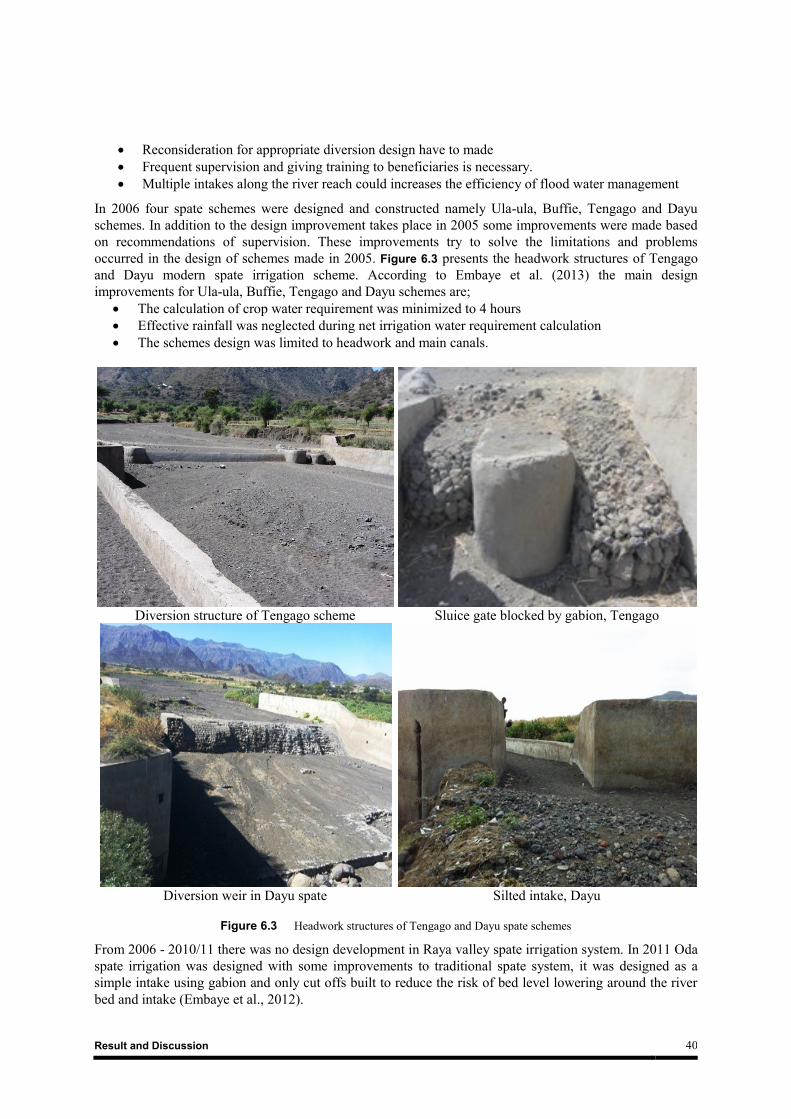
Result and Discussion 40
Reconsideration for appropriate diversion design have to made
Frequent supervision and giving training to beneficiaries is necessary.
Multiple intakes along the river reach could increases the efficiency of flood water management
In 2006 four spate schemes were designed and constructed namely Ula-ula, Buffie, Tengago and Dayu
schemes. In addition to the design improvement takes place in 2005 some improvements were made based
on recommendations of supervision. These improvements try to solve the limitations and problems
occurred in the design of schemes made in 2005. Figure 6.3 presents the headwork structures of Tengago
and Dayu modern spate irrigation scheme. According to Embaye et al. (2013) the main design
improvements for Ula-ula, Buffie, Tengago and Dayu schemes are;
The calculation of crop water requirement was minimized to 4 hours
Effective rainfall was neglected during net irrigation water requirement calculation
The schemes design was limited to headwork and main canals.
Diversion structure of Tengago scheme
Sluice gate blocked by gabion, Tengago
Diversion weir in Dayu spate
Silted intake, Dayu
Figure 6.3 Headwork structures of Tengago and Dayu spate schemes
From 2006 - 2010/11 there was no design development in Raya valley spate irrigation system. In 2011 Oda
spate irrigation was designed with some improvements to traditional spate system, it was designed as a
simple intake using gabion and only cut offs built to reduce the risk of bed level lowering around the river
bed and intake (Embaye et al., 2012).
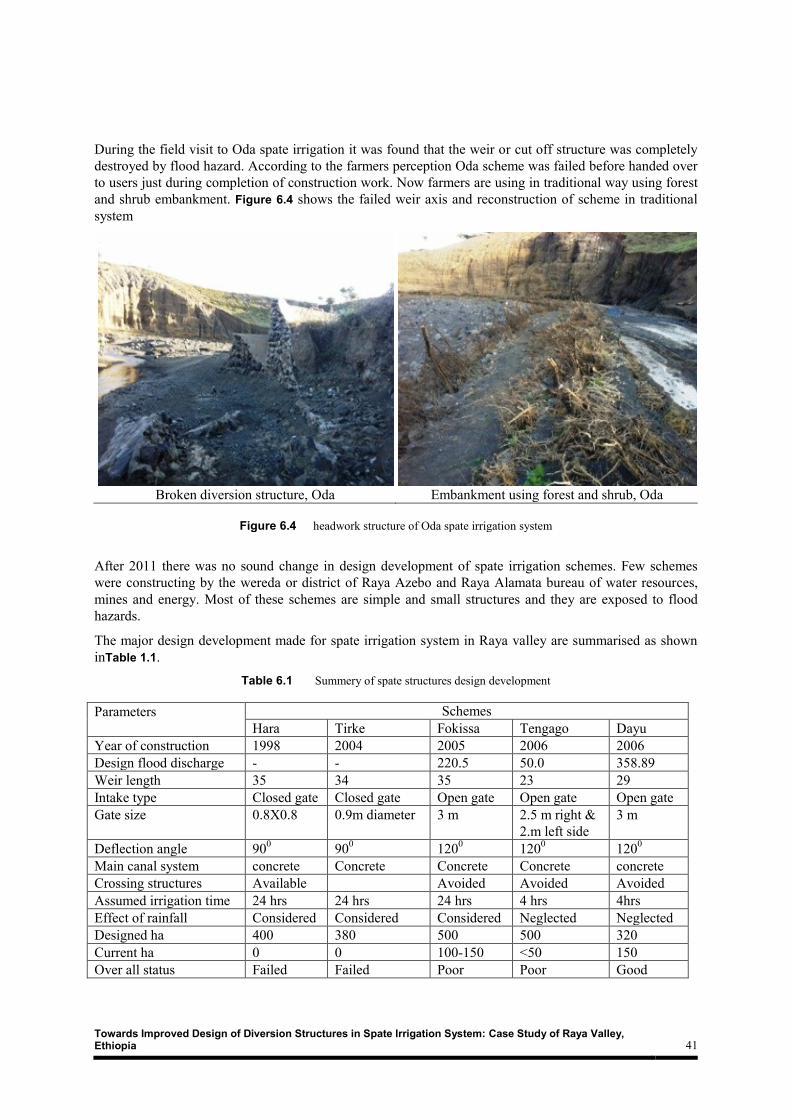
Towards Improved Design of Diversion Structures in Spate Irrigation System: Case Study of Raya Valley, Ethiopia 41
During the field visit to Oda spate irrigation it was found that the weir or cut off structure was completely
destroyed by flood hazard. According to the farmers perception Oda scheme was failed before handed over
to users just during completion of construction work. Now farmers are using in traditional way using forest
and shrub embankment. Figure 6.4 shows the failed weir axis and reconstruction of scheme in traditional
system
Broken diversion structure, Oda
Embankment using forest and shrub, Oda
Figure 6.4 headwork structure of Oda spate irrigation system
After 2011 there was no sound change in design development of spate irrigation schemes. Few schemes
were constructing by the wereda or district of Raya Azebo and Raya Alamata bureau of water resources,
mines and energy. Most of these schemes are simple and small structures and they are exposed to flood
hazards.
The major design development made for spate irrigation system in Raya valley are summarised as shown
inTable 1.1.
Table 6.1 Summery of spate structures design development
Parameters Schemes
Hara Tirke Fokissa Tengago Dayu
Year of construction 1998 2004 2005 2006 2006
Design flood discharge - - 220.5 50.0 358.89
Weir length 35 34 35 23 29
Intake type Closed gate Closed gate Open gate Open gate Open gate
Gate size 0.8X0.8 0.9m diameter 3 m 2.5 m right &
2.m left side
3 m
Deflection angle 900 90
0 120
0 120
0 120
0
Main canal system concrete Concrete Concrete Concrete concrete
Crossing structures Available Avoided Avoided Avoided
Assumed irrigation time 24 hrs 24 hrs 24 hrs 4 hrs 4hrs
Effect of rainfall Considered Considered Considered Neglected Neglected
Designed ha 400 380 500 500 320
Current ha 0 0 100-150 <50 150
Over all status Failed Failed Poor Poor Good
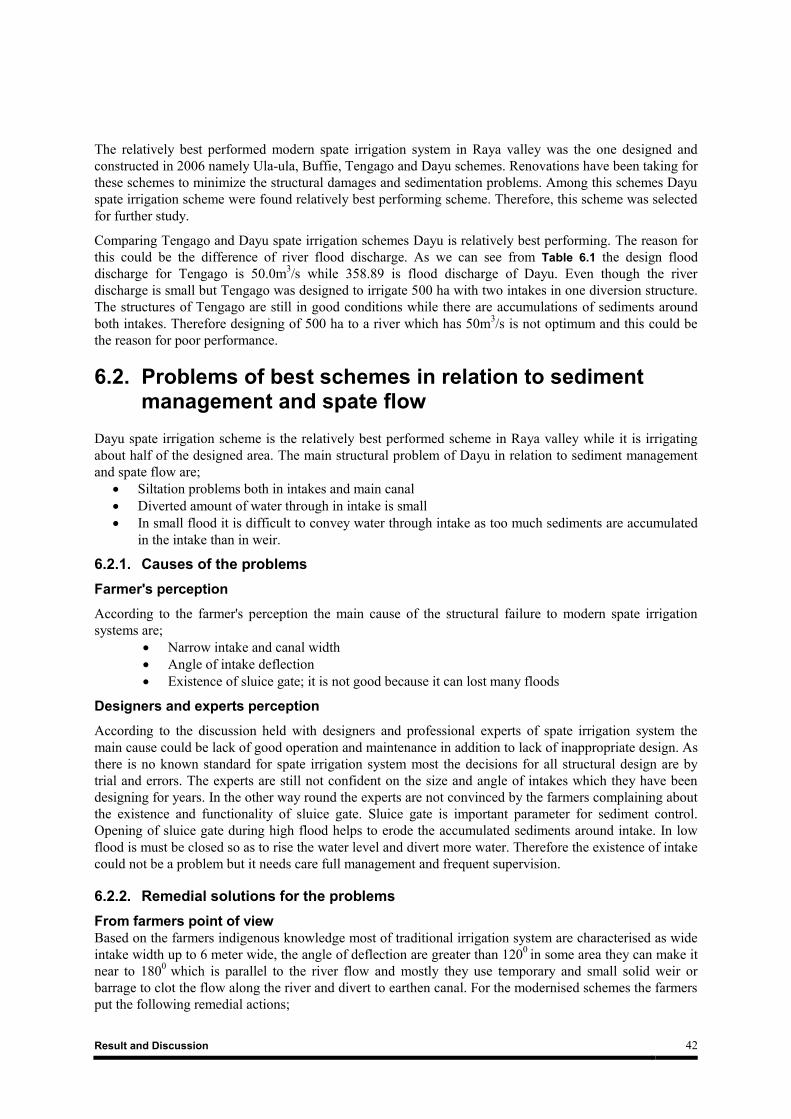
Result and Discussion 42
The relatively best performed modern spate irrigation system in Raya valley was the one designed and
constructed in 2006 namely Ula-ula, Buffie, Tengago and Dayu schemes. Renovations have been taking for
these schemes to minimize the structural damages and sedimentation problems. Among this schemes Dayu
spate irrigation scheme were found relatively best performing scheme. Therefore, this scheme was selected
for further study.
Comparing Tengago and Dayu spate irrigation schemes Dayu is relatively best performing. The reason for
this could be the difference of river flood discharge. As we can see from Table 6.1 the design flood
discharge for Tengago is 50.0m3/s while 358.89 is flood discharge of Dayu. Even though the river
discharge is small but Tengago was designed to irrigate 500 ha with two intakes in one diversion structure.
The structures of Tengago are still in good conditions while there are accumulations of sediments around
both intakes. Therefore designing of 500 ha to a river which has 50m3/s is not optimum and this could be
the reason for poor performance.
6.2. Problems of best schemes in relation to sediment management and spate flow
Dayu spate irrigation scheme is the relatively best performed scheme in Raya valley while it is irrigating
about half of the designed area. The main structural problem of Dayu in relation to sediment management
and spate flow are;
Siltation problems both in intakes and main canal
Diverted amount of water through in intake is small
In small flood it is difficult to convey water through intake as too much sediments are accumulated
in the intake than in weir.
6.2.1. Causes of the problems
Farmer's perception
According to the farmer's perception the main cause of the structural failure to modern spate irrigation
systems are;
Narrow intake and canal width
Angle of intake deflection
Existence of sluice gate; it is not good because it can lost many floods
Designers and experts perception
According to the discussion held with designers and professional experts of spate irrigation system the
main cause could be lack of good operation and maintenance in addition to lack of inappropriate design. As
there is no known standard for spate irrigation system most the decisions for all structural design are by
trial and errors. The experts are still not confident on the size and angle of intakes which they have been
designing for years. In the other way round the experts are not convinced by the farmers complaining about
the existence and functionality of sluice gate. Sluice gate is important parameter for sediment control.
Opening of sluice gate during high flood helps to erode the accumulated sediments around intake. In low
flood is must be closed so as to rise the water level and divert more water. Therefore the existence of intake
could not be a problem but it needs care full management and frequent supervision.
6.2.2. Remedial solutions for the problems
From farmers point of view
Based on the farmers indigenous knowledge most of traditional irrigation system are characterised as wide
intake width up to 6 meter wide, the angle of deflection are greater than 1200
in some area they can make it
near to 1800
which is parallel to the river flow and mostly they use temporary and small solid weir or
barrage to clot the flow along the river and divert to earthen canal. For the modernised schemes the farmers
put the following remedial actions;
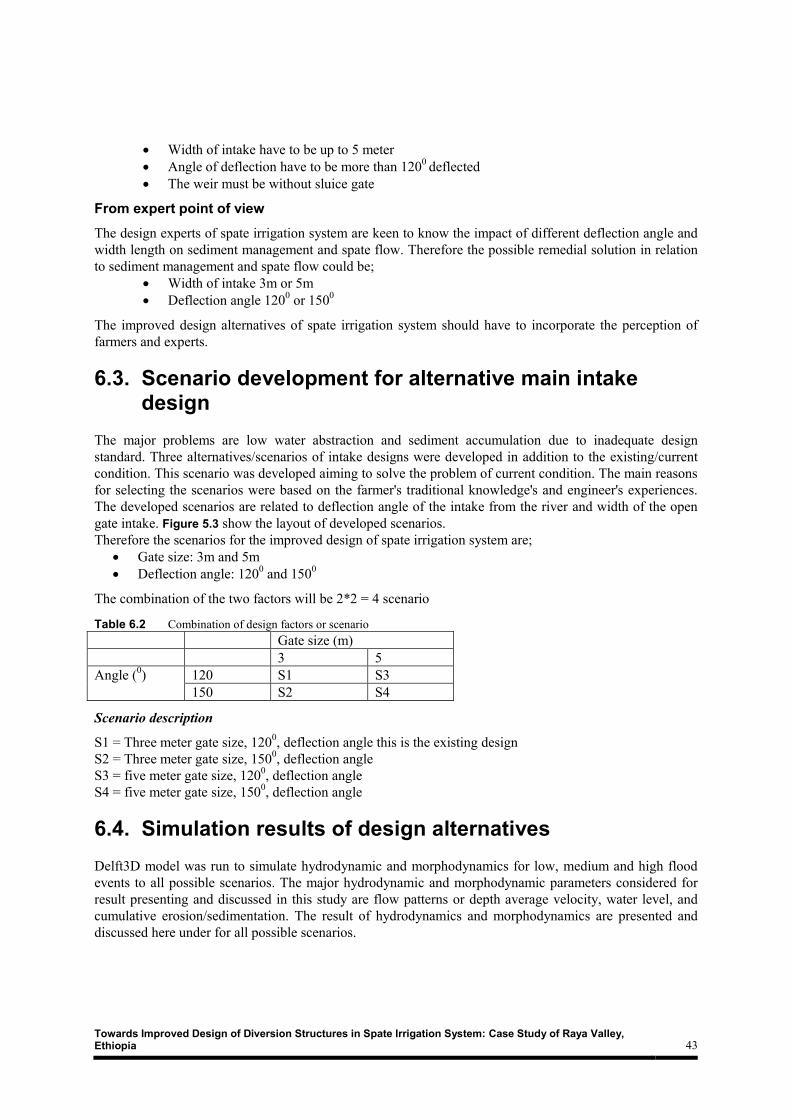
Towards Improved Design of Diversion Structures in Spate Irrigation System: Case Study of Raya Valley, Ethiopia 43
Width of intake have to be up to 5 meter
Angle of deflection have to be more than 1200
deflected
The weir must be without sluice gate
From expert point of view
The design experts of spate irrigation system are keen to know the impact of different deflection angle and
width length on sediment management and spate flow. Therefore the possible remedial solution in relation
to sediment management and spate flow could be;
Width of intake 3m or 5m
Deflection angle 1200 or 150
0
The improved design alternatives of spate irrigation system should have to incorporate the perception of
farmers and experts.
6.3. Scenario development for alternative main intake design
The major problems are low water abstraction and sediment accumulation due to inadequate design
standard. Three alternatives/scenarios of intake designs were developed in addition to the existing/current
condition. This scenario was developed aiming to solve the problem of current condition. The main reasons
for selecting the scenarios were based on the farmer's traditional knowledge's and engineer's experiences.
The developed scenarios are related to deflection angle of the intake from the river and width of the open
gate intake. Figure 5.3 show the layout of developed scenarios.
Therefore the scenarios for the improved design of spate irrigation system are;
Gate size: 3m and 5m
Deflection angle: 1200 and 150
0
The combination of the two factors will be 2*2 = 4 scenario
Table 6.2 Combination of design factors or scenario
Gate size (m)
3 5
Angle (0) 120 S1 S3
150 S2 S4
Scenario description
S1 = Three meter gate size, 1200, deflection angle this is the existing design
S2 = Three meter gate size, 1500, deflection angle
S3 = five meter gate size, 1200, deflection angle
S4 = five meter gate size, 1500, deflection angle
6.4. Simulation results of design alternatives
Delft3D model was run to simulate hydrodynamic and morphodynamics for low, medium and high flood
events to all possible scenarios. The major hydrodynamic and morphodynamic parameters considered for
result presenting and discussed in this study are flow patterns or depth average velocity, water level, and
cumulative erosion/sedimentation. The result of hydrodynamics and morphodynamics are presented and
discussed here under for all possible scenarios.
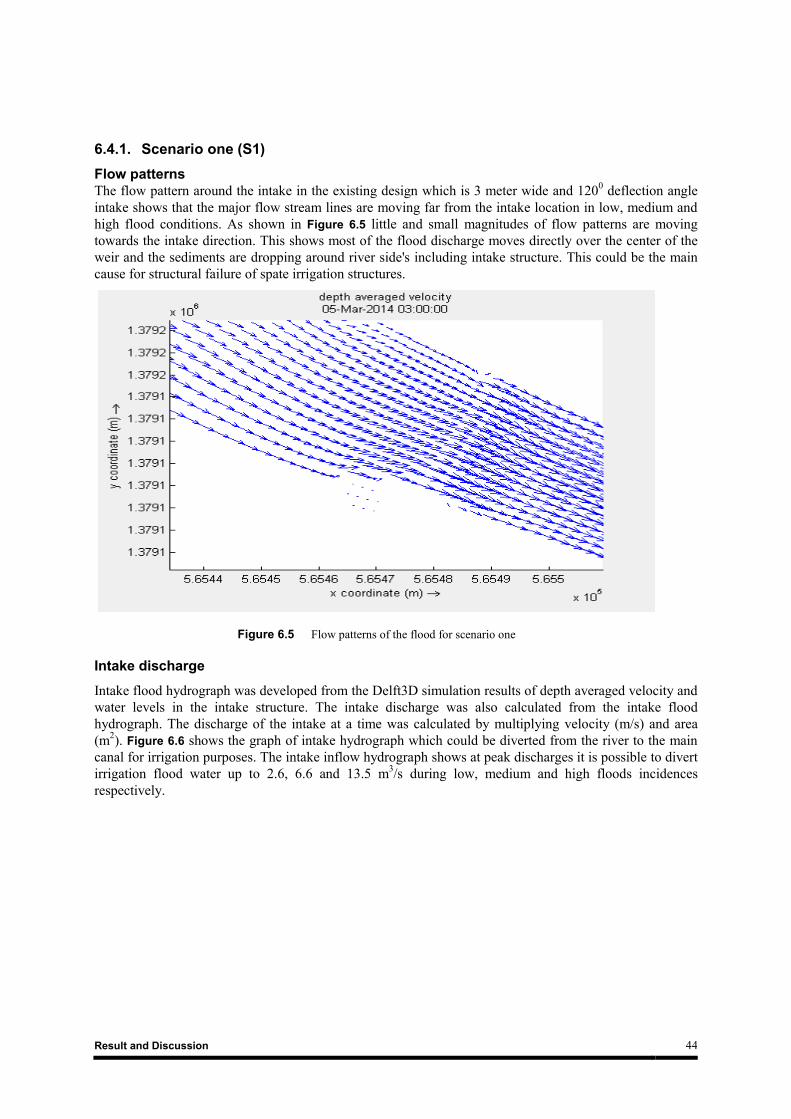
Result and Discussion 44
6.4.1. Scenario one (S1)
Flow patterns The flow pattern around the intake in the existing design which is 3 meter wide and 120
0 deflection angle
intake shows that the major flow stream lines are moving far from the intake location in low, medium and
high flood conditions. As shown in Figure 6.5 little and small magnitudes of flow patterns are moving
towards the intake direction. This shows most of the flood discharge moves directly over the center of the
weir and the sediments are dropping around river side's including intake structure. This could be the main
cause for structural failure of spate irrigation structures.
Figure 6.5 Flow patterns of the flood for scenario one
Intake discharge
Intake flood hydrograph was developed from the Delft3D simulation results of depth averaged velocity and
water levels in the intake structure. The intake discharge was also calculated from the intake flood
hydrograph. The discharge of the intake at a time was calculated by multiplying velocity (m/s) and area
(m2). Figure 6.6 shows the graph of intake hydrograph which could be diverted from the river to the main
canal for irrigation purposes. The intake inflow hydrograph shows at peak discharges it is possible to divert
irrigation flood water up to 2.6, 6.6 and 13.5 m3/s during low, medium and high floods incidences
respectively.

Towards Improved Design of Diversion Structures in Spate Irrigation System: Case Study of Raya Valley, Ethiopia 45
Figure 6.6 Intake hydrograph
Erosion and Sedimentation
The simulation result shows the cumulative sedimentation around the intake is 0, 26 and 41 centimeter (cm)
depth for low, medium and high flood events respectively. In this condition, as the magnitudes of flow
patterns towards the intake are small the incoming sediments cannot move and deposited around the intake.
Gradually the main spate flow channel starts to move far from intake and more sediment is accumulated.
The reality in most of the modernized spate irrigation headwork shows that after two and or three floods
events the flood water didn't flow towards intake and the main channel starts moving far. a lot of sediments
are also accumulated around the intake structures and blocks flow. Figure 6.7 shows the cumulative
erosion/sediment around the intake at high flood.
Figure 6.7 Cumulative erosion/sedimentation scenario one
0
2
4
6
8
10
12
14
16
0 2 4 6 8 10 12 14
Dis
char
ge (
m3/s
)
Time (hr)
Intake hydrograph, scenario one
Low flood
Medium flood
High flood
Intake
Location
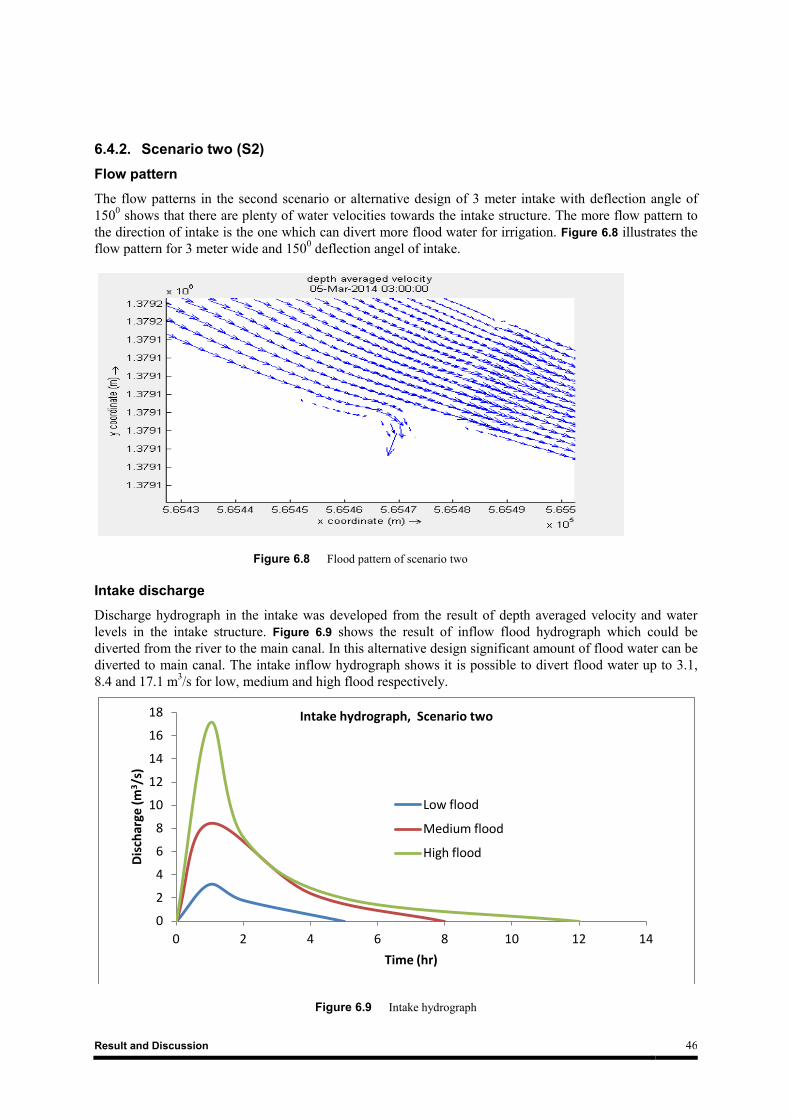
Result and Discussion 46
6.4.2. Scenario two (S2)
Flow pattern
The flow patterns in the second scenario or alternative design of 3 meter intake with deflection angle of
1500 shows that there are plenty of water velocities towards the intake structure. The more flow pattern to
the direction of intake is the one which can divert more flood water for irrigation. Figure 6.8 illustrates the
flow pattern for 3 meter wide and 1500 deflection angel of intake.
Figure 6.8 Flood pattern of scenario two
Intake discharge
Discharge hydrograph in the intake was developed from the result of depth averaged velocity and water
levels in the intake structure. Figure 6.9 shows the result of inflow flood hydrograph which could be
diverted from the river to the main canal. In this alternative design significant amount of flood water can be
diverted to main canal. The intake inflow hydrograph shows it is possible to divert flood water up to 3.1,
8.4 and 17.1 m3/s for low, medium and high flood respectively.
Figure 6.9 Intake hydrograph
0
2
4
6
8
10
12
14
16
18
0 2 4 6 8 10 12 14
Dis
char
ge (
m3 /
s)
Time (hr)
Intake hydrograph, Scenario two
Low flood
Medium flood
High flood

Towards Improved Design of Diversion Structures in Spate Irrigation System: Case Study of Raya Valley, Ethiopia 47
Erosion and Sedimentation
The simulation result of morphodynamics for the second scenario shows the cumulative sedimentation
around the intake reaches up to 0, 28 and 34 centimeter (cm) depth for low, medium and high flood events
respectively. Figure 6.10 shows the cumulative erosion/sediment around the intake at high flood. As can be
seen from Figure 6.10 the accumulations of sediments are widely spread above the diversion structure.
Figure 6.10 Cumulative erosion/sedimentation scenario two
6.4.3. Scenario three (S3)
Flow pattern
The flow patterns in the third scenario or alternative design thee shows that there are flows of water
velocity water flow towards the intake structure. Figure 6.11 illustrates the flow pattern for 5 meter wide
and 1200 deflection angel of intake. In this condition the velocity towards intake and water levels are high
which could result to divert appreciable amount of flood water. Flow patterns in scenario three are more
concentrated than scenario two but they are little bit deflected.
Figure 6.11 Flood patterns of scenario three
Intake
Location

Result and Discussion 48
Intake discharge
Flood hydrograph in the intake was developed from the result of depth averaged velocity and water levels
in the intake structure. Figure 6.12 shows the result of inflow flood hydrograph which could be diverted
from the river to the main canal. In this alternative design significant amount of flood water can be diverted
to main canal. The intake inflow hydrograph shows it is possible to divert flood water up to 4.7, 12.6 and
22.8 m3/s for low, medium and high flood respectively during the peak events.
Figure 6.12 Intake hydrograph
Erosion and Sedimentation
The simulation result of morphodynamics of scenario three shows the cumulative sedimentation around the
intake reaches up to 3, 24 and 48 centimeter (cm) depth for low, medium and high flood events
respectively. Figure 6.13 shows the cumulative erosion/sediment around the intake at high flood.
0
5
10
15
20
25
0 2 4 6 8 10 12 14
Dis
char
ge (
m3
/s)
Time (hr)
Intake hydrograph, scenario three
Low flood
Medium flood
High flood
Towards Improved Design of Diversion Structures in Spate Irrigation System: Case Study of Raya Valley, Ethiopia 49
Figure 6.13 Cumulative erosion/sedimentation scenario three
6.4.4. Scenario four (S4)
Flow pattern
The flow patterns in the fourth scenario or alternative design four show that there are flows of water
velocity water flow towards the intake structure. Figure 6.14 illustrates the flow pattern for 5 meter wide
and 1200 deflection angel of intake. In this condition the velocity towards intake and water levels are high
which could result to divert appreciable amount of water. Flow patterns in scenario four are directed
forward to the intake with an angle greater than scenario three.
Figure 6.14 Flow patterns of scenario four
Intake discharge
Flood hydrograph in the intake was developed from the result of depth averaged velocity and water levels
in the intake structure. Figure 6.15 shows the result of inflow flood hydrograph which could be diverted
Intake
Location
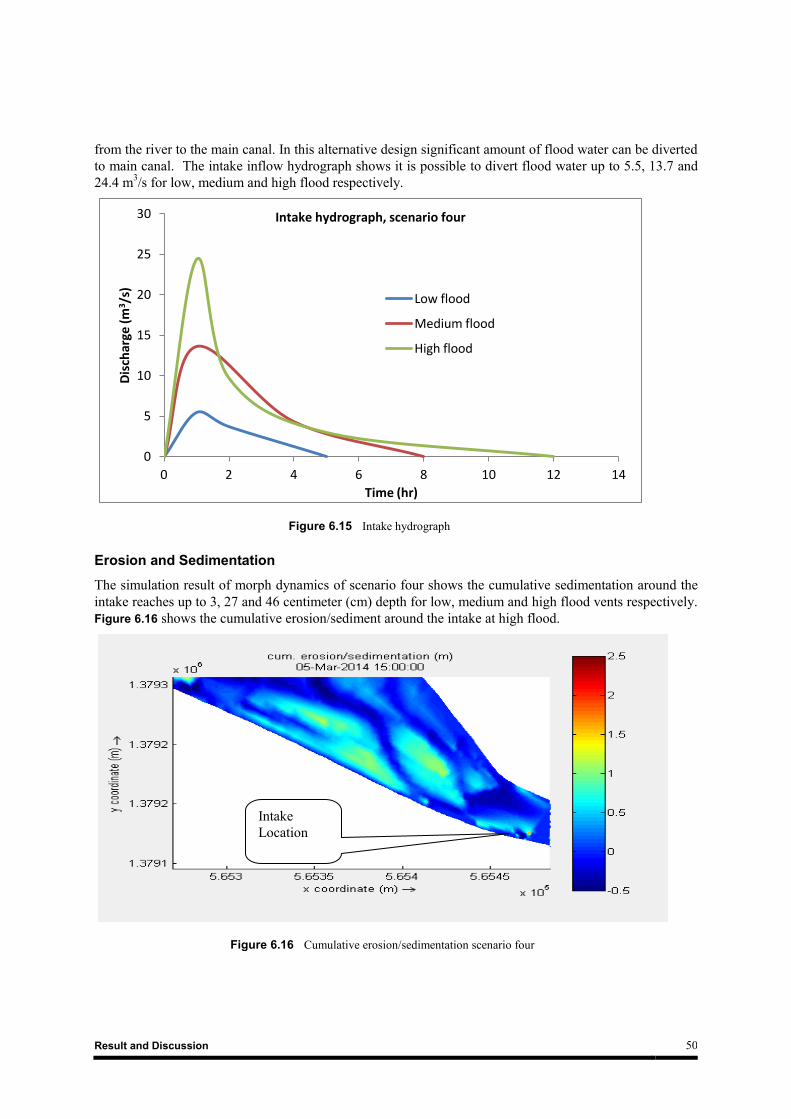
Result and Discussion 50
from the river to the main canal. In this alternative design significant amount of flood water can be diverted
to main canal. The intake inflow hydrograph shows it is possible to divert flood water up to 5.5, 13.7 and
24.4 m3/s for low, medium and high flood respectively.
Figure 6.15 Intake hydrograph
Erosion and Sedimentation
The simulation result of morph dynamics of scenario four shows the cumulative sedimentation around the
intake reaches up to 3, 27 and 46 centimeter (cm) depth for low, medium and high flood vents respectively.
Figure 6.16 shows the cumulative erosion/sediment around the intake at high flood.
Figure 6.16 Cumulative erosion/sedimentation scenario four
0
5
10
15
20
25
30
0 2 4 6 8 10 12 14
Dis
char
ge (
m3/s
)
Time (hr)
Intake hydrograph, scenario four
Low flood
Medium flood
High flood
Intake
Location
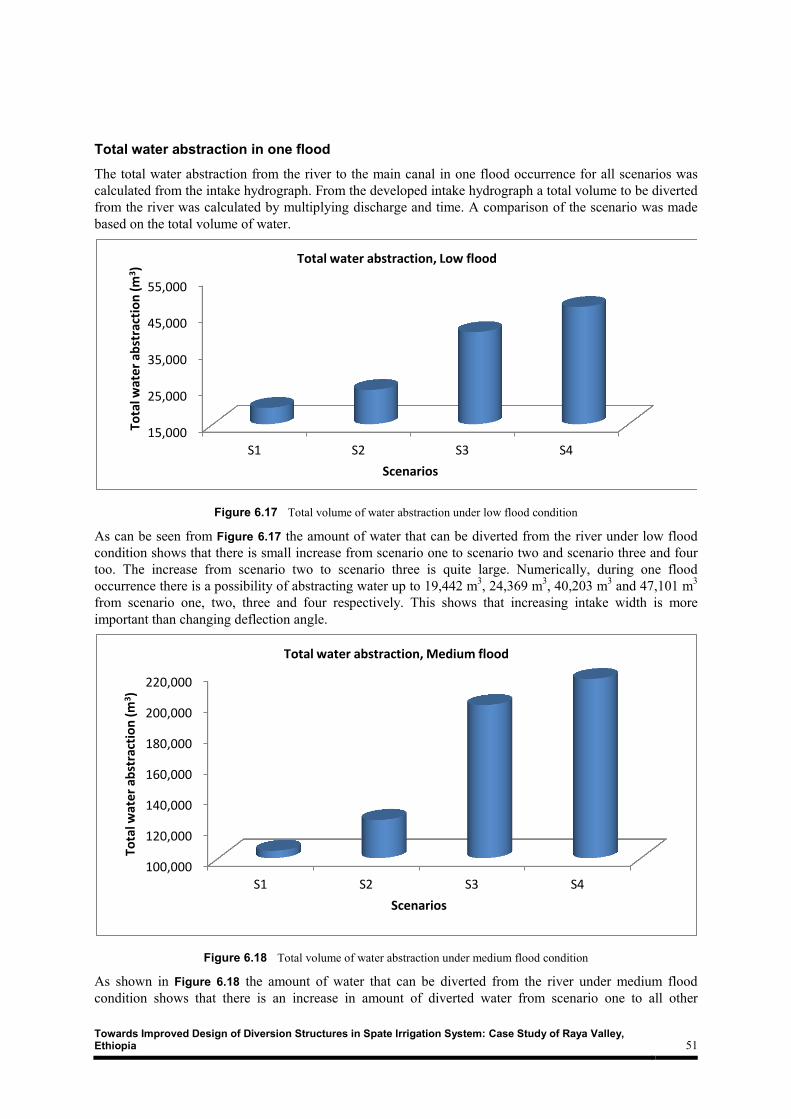
Towards Improved Design of Diversion Structures in Spate Irrigation System: Case Study of Raya Valley, Ethiopia 51
Total water abstraction in one flood
The total water abstraction from the river to the main canal in one flood occurrence for all scenarios was
calculated from the intake hydrograph. From the developed intake hydrograph a total volume to be diverted
from the river was calculated by multiplying discharge and time. A comparison of the scenario was made
based on the total volume of water.
Figure 6.17 Total volume of water abstraction under low flood condition
As can be seen from Figure 6.17 the amount of water that can be diverted from the river under low flood
condition shows that there is small increase from scenario one to scenario two and scenario three and four
too. The increase from scenario two to scenario three is quite large. Numerically, during one flood
occurrence there is a possibility of abstracting water up to 19,442 m3, 24,369 m
3, 40,203 m
3 and 47,101 m
3
from scenario one, two, three and four respectively. This shows that increasing intake width is more
important than changing deflection angle.
Figure 6.18 Total volume of water abstraction under medium flood condition
As shown in Figure 6.18 the amount of water that can be diverted from the river under medium flood
condition shows that there is an increase in amount of diverted water from scenario one to all other
15,000
25,000
35,000
45,000
55,000
S1 S2 S3 S4
Tota
l wat
er
abst
ract
ion
(m
3 )
Scenarios
Total water abstraction, Low flood
100,000
120,000
140,000
160,000
180,000
200,000
220,000
S1 S2 S3 S4
Tota
l wat
er a
bst
ract
ion
(m
3 )
Scenarios
Total water abstraction, Medium flood
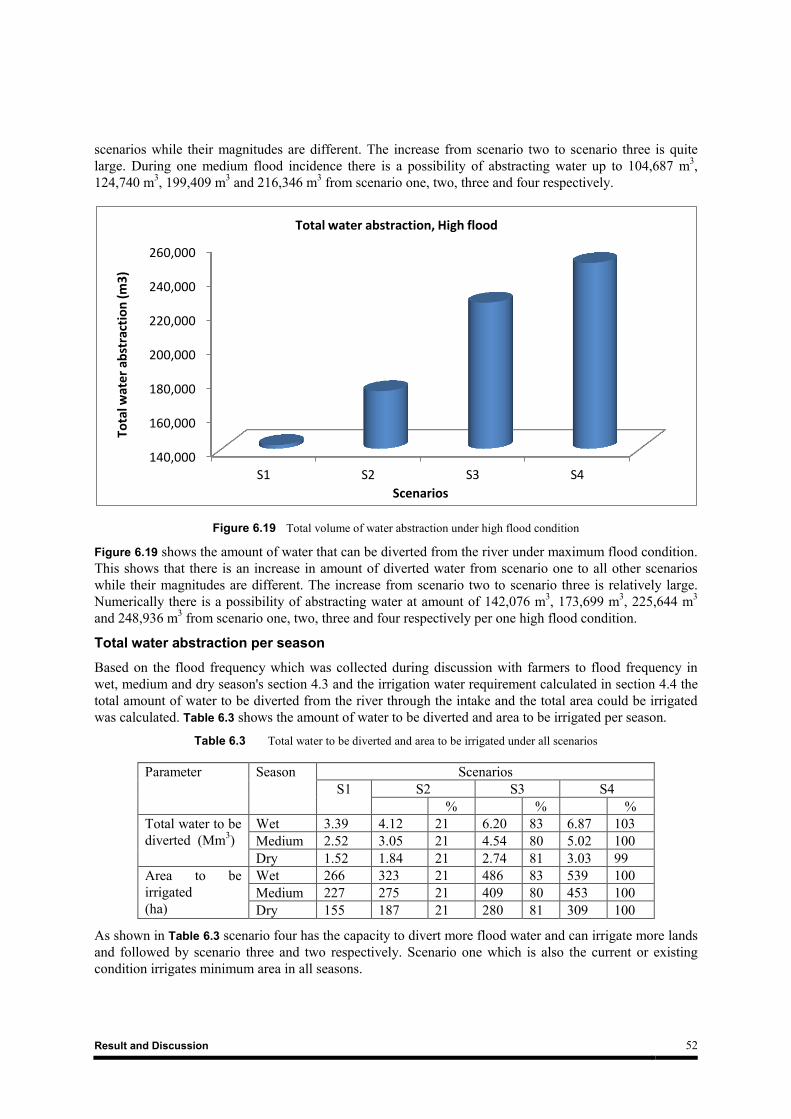
Result and Discussion 52
scenarios while their magnitudes are different. The increase from scenario two to scenario three is quite
large. During one medium flood incidence there is a possibility of abstracting water up to 104,687 m3,
124,740 m3, 199,409 m
3 and 216,346 m
3 from scenario one, two, three and four respectively.
Figure 6.19 Total volume of water abstraction under high flood condition
Figure 6.19 shows the amount of water that can be diverted from the river under maximum flood condition.
This shows that there is an increase in amount of diverted water from scenario one to all other scenarios
while their magnitudes are different. The increase from scenario two to scenario three is relatively large.
Numerically there is a possibility of abstracting water at amount of 142,076 m3, 173,699 m
3, 225,644 m
3
and 248,936 m3 from scenario one, two, three and four respectively per one high flood condition.
Total water abstraction per season
Based on the flood frequency which was collected during discussion with farmers to flood frequency in
wet, medium and dry season's section 4.3 and the irrigation water requirement calculated in section 4.4 the
total amount of water to be diverted from the river through the intake and the total area could be irrigated
was calculated. Table 6.3 shows the amount of water to be diverted and area to be irrigated per season.
Table 6.3 Total water to be diverted and area to be irrigated under all scenarios
Parameter Season Scenarios
S1 S2 S3 S4
% % %
Total water to be
diverted (Mm3)
Wet 3.39 4.12 21 6.20 83 6.87 103
Medium 2.52 3.05 21 4.54 80 5.02 100
Dry 1.52 1.84 21 2.74 81 3.03 99
Area to be
irrigated
(ha)
Wet 266 323 21 486 83 539 100
Medium 227 275 21 409 80 453 100
Dry 155 187 21 280 81 309 100
As shown in Table 6.3 scenario four has the capacity to divert more flood water and can irrigate more lands
and followed by scenario three and two respectively. Scenario one which is also the current or existing
condition irrigates minimum area in all seasons.
140,000
160,000
180,000
200,000
220,000
240,000
260,000
S1 S2 S3 S4
Tota
l wat
er
abst
ract
ion
(m
3)
Scenarios
Total water abstraction, High flood
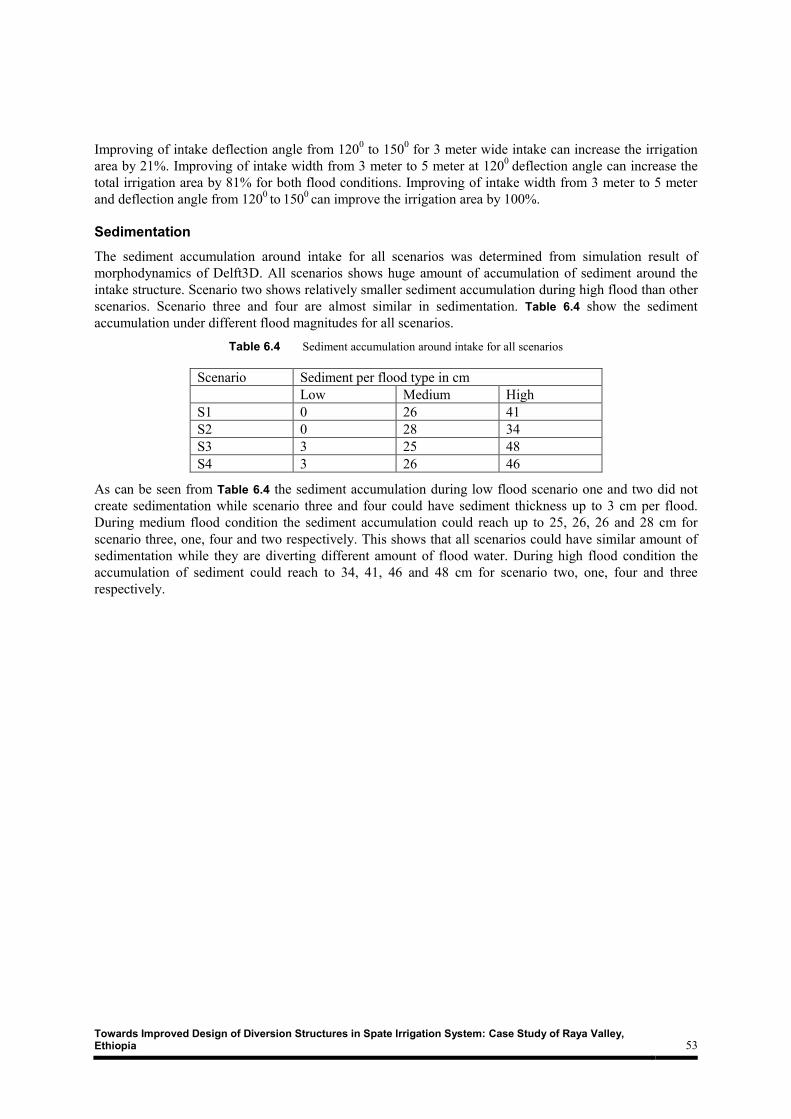
Towards Improved Design of Diversion Structures in Spate Irrigation System: Case Study of Raya Valley, Ethiopia 53
Improving of intake deflection angle from 1200 to 150
0 for 3 meter wide intake can increase the irrigation
area by 21%. Improving of intake width from 3 meter to 5 meter at 1200
deflection angle can increase the
total irrigation area by 81% for both flood conditions. Improving of intake width from 3 meter to 5 meter
and deflection angle from 1200 to
150
0 can improve the irrigation area by 100%.
Sedimentation
The sediment accumulation around intake for all scenarios was determined from simulation result of
morphodynamics of Delft3D. All scenarios shows huge amount of accumulation of sediment around the
intake structure. Scenario two shows relatively smaller sediment accumulation during high flood than other
scenarios. Scenario three and four are almost similar in sedimentation. Table 6.4 show the sediment
accumulation under different flood magnitudes for all scenarios.
Table 6.4 Sediment accumulation around intake for all scenarios
Scenario Sediment per flood type in cm
Low Medium High
S1 0 26 41
S2 0 28 34
S3 3 25 48
S4 3 26 46
As can be seen from Table 6.4 the sediment accumulation during low flood scenario one and two did not
create sedimentation while scenario three and four could have sediment thickness up to 3 cm per flood.
During medium flood condition the sediment accumulation could reach up to 25, 26, 26 and 28 cm for
scenario three, one, four and two respectively. This shows that all scenarios could have similar amount of
sedimentation while they are diverting different amount of flood water. During high flood condition the
accumulation of sediment could reach to 34, 41, 46 and 48 cm for scenario two, one, four and three
respectively.

Conclusion and Recommendation 54
7.1. Conclusion
After analyzing the design developments of spate irrigation systems; evaluation of problems for the current
best or relatively good performing scheme; developments of alternatives designs for better flood and
sediment managements and evaluation of alternative design using Delft3D model simulation for
hydrodynamics and morphology in relation to sediment and spate flow management, the following
conclusions were given.
The design of main intakes has significantly improved over the past years. The intake dimensions
were changed from closed intake, 900 deflection angles and narrow (90 cm wide) gates to 3 meters
wide open intake with 1200 deflection angle and this improvement gives relatively good
performance for modern spate irrigation schemes.
The latest design of diversion structure is however, far below optimum. This design is irrigating
about 50% of the intended area. The main reason for the poor performance could be lack of
optimum intake designs.
An alternative design of 5 meter wide intake with a deflection angle of 1500 to the river flow
diverts the highest amount of water at 0.99, 1.74 and 1.99 Mm3 for wet, medium and dry season's
respectively. This can cover an irrigation area up to 539, 453 and 309 ha for wet, medium and dry
seasons respectively. Using of this scenario can increase the irrigated area by 100% from the
current condition or scenario one.
In case of sedimentation all scenarios are very sensitive but intake dimensions with 1500 degree
shows relatively uniform distribution along the cross sections around intake. Since the bed level
increments' is distributed through the immediate upstream area of the diversion, the amount of
water to be diverted may not minimized significantly.
The accumulations of sediments are not significantly different for all scenarios and this creates
difficulties for making decision. The availability of too much water for scenario four and three can
compensate for the high sedimentation.
CHAPTER 7
Conclusion and Recommendation

Towards Improved Design of Diversion Structures in Spate Irrigation System: Case Study of Raya Valley, Ethiopia 55
7.2. Recommendation
For better use of flood water for spate irrigation the intake structure should be 5 m wide and 1500
deflection angle. This diverts more water and can increase the current irrigated area by 100% while
it has similar sediment accumulation to the current designs.
As the sediment accumulation around intake is too much which can reach up to 46 cm per flood
during high flood incidence frequent dredging should have to perform. The farmers have to be
aware on the importance of dredging and sediment removals from intake and canals.
It is not possible to solve the problem of sedimentation around intake by having only good intake
design. This needs further investigation to introduce appropriate sediment control structures
As this study focus only on the water to be diverted and sediment accumulation further detail study
to the structural and geotechnical stability needs to be done before implementing the recommended
alternative designs.
Increasing the intake width and deflection angle can increase the construction cost and input
materials, therefore it is recommended to make cost analysis before making decision and
implementation of the selected alternative design.
Simulations of the model was performed based on single flood event, therefore it is to perform in
season wise for the future to get clear image of erosion and or sedimentation accumulation and
spate flow
For having better spate irrigation system participation of farmers during design and construction is
necessary and needs to exploit the indigenous knowledge of traditional spate system. Construction
and designs of spate irrigation structures have to incorporate the farmer's interest and traditional
knowledge of spate irrigation designs.

Towards Improved Design of Diversion Structures in Spate Irrigation System: Case Study of Raya Valley, Ethiopia 57
References
Abate, D., & Abrha, A. (2006). Engineering Feasibility Study Report of 'Gereb Tengago' Spate Irrigation
Project. Tigray Water Resource, Mining and Energy Bureau (TWRMEB)
Abate, D., & Mieraf (2006). Engineering Feasibility Study Report of 'Gereb Dayu' Spate Irrigation Project.
Tigray Water Resource, Mining and Energy Bureau (TWRMEB)
Al-Garoo, A.S. (1987). Historic Review of Spate Irrigation and its Effect on Agricultural Development. In:
Spate Irrigation, Proceedings of the Sub-Regional Expert Consultation on Wadi Development for
Agriculture in the Natural Yemen. Aden, December 1987, FAO/UNDP.
Arcement, G.J., & Schneider, V.R. (1989). Guide for selecting Manning's roughness coefficients for natural
channels and flood plains US Government Printing Office
Bathurst, J.C. (1985). Flow Resistance Estimation in Mountain Rivers. Journal of Hydraulic Engineering
111: 625-643
Bathurst, J. C. (2002). At-a-site variation and minimum flow resistance for mountain rivers. Journal of
Hydrology, 269(1), 11-26.
Camacho, R. (1987). Traditional spate irrigation and wadi development schemes. Proceedings of the Sub
regional Expert Consultation on Wadi Development for Agriculture in the Natural Yemen 6-10
December, 1987 Aden, PDR Yemen Rome: FAO/UNDP
CSA (2007). Central Statistical Agency Census Report, Addis Ababa, Ethiopia.
Embaye, T.G., Beevers, L., & Mehari, H.A. (2012). Dealing with Sedimentation Issues in Spate Irrigation
Systems. Irrigation and Drainage 61: 220-230 DOI 10.1002/ird.630
Embaye, T.G., Wubneh, A.M., Hagos, E.Y. (2013). Developments in the Design and Construction of
Modern Spate Systems in Tigray, Ethiopia
FAO/UNDP (1987). Spate irrigation Proceedings of the sub regional expert consultation on wadi
development for agriculture in the Natural Yemen, 6–10 December, 1987. Aden, PDR Yemen.
IFAD (2005). Ethiopia: Enhancing food security through small scale irrigation. Number 35,
http://www.ifad.org/evaluation/public_html/eksyst/doc/profile/pf/ethiopia.htm Accessed October
2013
Gebreezgi, A.H. (2010). Aquifer Characterization of the Raya Valley Based on Pumping Test and
Geophysical Data Analysis Northern Ethiopia. MSc Thesis, Addis Abeba University, Addis Abeba,
Ethiopia.
Gebrehiwot, K.A. (2013). Optimizing Flood and Sediment Management of Spate Irrigation in Aba 'ala
Plains. MSc Thesis, UNESCO-IHE institute for water education, Delft, Netherlands
Gebremedhin, A., Abate, D., & Gebrehiwot, W. (2006). Monitoring and Evaluation of Spates in Raya-
Valley. Tigray Water Resource, Mining and Energy Bureau (TWRMEB)
Hydraulics D (2011). Delft3D-FLOW: Simulation of multi-dimensional hydrodynamic flows and transport
phenomena, including sediments, user manual. Deltares, Delft, Netherlands
Kidane, H. (2009) Community Spate Irrigation in Raya valley: Case study of Three Spate Irrigation
Systems. MSc Thesis, Addis Abeba University, Addis Abeba, Ethiopia.
References> 58
Khaliq, I. (1980). Irrigation system in Pakistan. Measures to improve irrigation efficiency at the farm level
Pakistans Engineering Congress Proceedings of the 57th Annual Session, Paper.
Kleinhans, M.G., & van Rijn, L.C. (2002). Stochastic prediction of sediment transport in sand-gravel bed
rivers. Journal of Hydraulic Engineering 128: 412-425
Lawrence, P. (1987). Sediment control in wadi irrigation systems. Hydraulics Research Wallingford, UK
Lawrence, P., & Van Steenbergen, F. (2005). Improving community spate irrigation. Report OD, 154.
Lawrence, P. (2008). Managing sedimentation in spate irrigation schemes. Spate Irrigation Summer course
Hand Book
Lawrence, P., Atkinson, E., Spark, P., & Counsell, C. (2001). Procedure for the selection and outline design
of canal sediment control, Technical and software manuals HR Wallingford
Mehari, A. (2007). A tradition in transition: water management reforms and indigenous spate irrigation
systems in Eritrea
Mehari, A., van Steenbergen, F., and Schultz, B. (2007). Water Rights and Rules, and Management in
Spate Irrigation Systems in Eritrea, Yemen and Pakistan. Community-Based Water Law and Water
Resource Management Reform in Developing Countries: 114
Mehari, A., Van Steenbergen, F., & Schultz, B. (2011). Modernization of spate irrigated agriculture: A new
approach. Irrigation and drainage, 60(2), 163-173.
Mehari, A., Demisse, A., Embaye, T.G., & Getaneh, A. (2013) Flood Based farming for Livelihoods in
Ethiopian Lowlands. Status, Potential and Investment Guide. Addis Ababa, Ethiopia
Mendez, N.J., and Depeweg, H.W.T. (2012). Sediment Transport for Irrigation Engineering. UNESCOIHE
Institute for Water Education, Delft, Netherlands.
Pirestani, M.R., Vosoghifar, HR., and Jazayeri, P. (2011). Evaluation of Optimum Performance of Lateral
Intakes. World Academy of Science, Engineering and Technology 80: 369-373
Ratsey, J. (2011). Engineering Manual for Spate Irrigation. Technical Assistance for the Support to the
Agricultural Sector / Food Security Programme in Eritrea (EuropeAid/129 -927/D/SER/ER),
Landell Mills Ltd.
REST, (1996). Raya Valley Development Study Project, Phase I (Reconnaissance report). Relief Society of
Tigray, Mekelle, Ethiopia
Steduto, P., Hsiao, T.C., Raes, D., & Fereres, E. (2012). Crop yield response to water: Food and
Agriculture Organization of the United Nations, Rome.
Tadese, D., & Abate, D. (2005). Engineering Feasibility Study Report of 'Gereb Beyru' Spate Irrigation
Project. Tigray Bureau of Water Resource Development (TBWRD)
Tadese, D., & Abate, D. (2005). Engineering Feasibility Study Report of 'Gereb Fokissa' Spate Irrigation
Project. Tigray Bureau of Water Resource Development (TBWRD)
Tsoka, J. (2012). Optimisation of the design of diversion structures in a spate irrigation scheme; Case study
of Gash Agricultural Scheme in Sudan. MSc Thesis, UNESCO-IHE institute for water education,
Delft, Netherlands
Van Steenbergen, F. (1997). Understanding the sociology of spate irrigation: cases from Balochistan.
Journal of Arid Environments, 35(2), 349–365.

Towards Improved Design of Diversion Structures in Spate Irrigation System: Case Study of Raya Valley, Ethiopia 59
Van Steenbergen F, Lawrence P, Mehari Haile A, Salman M, Faures J-M (2010) Guidelines on Spate
Irrigation Food and Agriculture Organization of the United Nations, Rome
Van Steenbergen, F., Haile, A. M., Alemehayu, T., Alamirew, T., & Geleta, Y. (2011). Status and potential
of spate irrigation in Ethiopia. Water resources management, 25(7), 1899-1913.
Xiaoqing, Y. (2003). Manual on sediment management and measurement. World Meteorological
Organization 948
Zenebe, T.F. (2012). Sediment Control and Management in the Diversion and Main Canal of Gash
Agricultural Scheme, Sudan. MSc Thesis, UNESCO-IHE institute for water education, Delft,
Netherlands
Wubneh. A.M. (2007). Analysis of sediment transport in the diversion headwork of Shilanat irrigation
scheme. MSc Thesis, UNESCO-IHE institute for water education, Delft, Netherlands
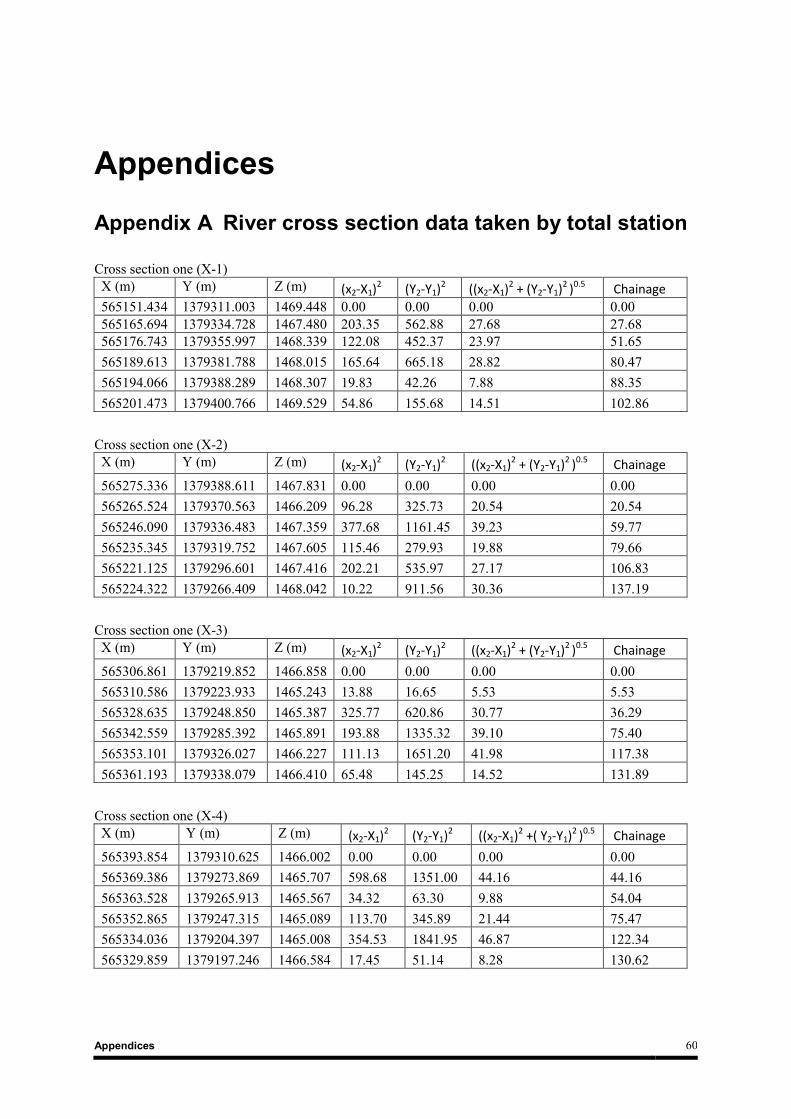
Appendices 60
Appendices
Appendix A River cross section data taken by total station
Cross section one (X-1)
X (m) Y (m) Z (m) (x2-X1)2 (Y2-Y1)2 ((x2-X1)2 + (Y2-Y1)2 )0.5 Chainage
565151.434 1379311.003 1469.448 0.00 0.00 0.00 0.00
565165.694 1379334.728 1467.480 203.35 562.88 27.68 27.68
565176.743 1379355.997 1468.339 122.08 452.37 23.97 51.65
565189.613 1379381.788 1468.015 165.64 665.18 28.82 80.47
565194.066 1379388.289 1468.307 19.83 42.26 7.88 88.35
565201.473 1379400.766 1469.529 54.86 155.68 14.51 102.86
Cross section one (X-2)
X (m) Y (m) Z (m) (x2-X1)2 (Y2-Y1)2 ((x2-X1)2 + (Y2-Y1)2 )0.5 Chainage
565275.336 1379388.611 1467.831 0.00 0.00 0.00 0.00
565265.524 1379370.563 1466.209 96.28 325.73 20.54 20.54
565246.090 1379336.483 1467.359 377.68 1161.45 39.23 59.77
565235.345 1379319.752 1467.605 115.46 279.93 19.88 79.66
565221.125 1379296.601 1467.416 202.21 535.97 27.17 106.83
565224.322 1379266.409 1468.042 10.22 911.56 30.36 137.19
Cross section one (X-3)
X (m) Y (m) Z (m) (x2-X1)2 (Y2-Y1)2 ((x2-X1)2 + (Y2-Y1)2 )0.5 Chainage
565306.861 1379219.852 1466.858 0.00 0.00 0.00 0.00
565310.586 1379223.933 1465.243 13.88 16.65 5.53 5.53
565328.635 1379248.850 1465.387 325.77 620.86 30.77 36.29
565342.559 1379285.392 1465.891 193.88 1335.32 39.10 75.40
565353.101 1379326.027 1466.227 111.13 1651.20 41.98 117.38
565361.193 1379338.079 1466.410 65.48 145.25 14.52 131.89
Cross section one (X-4)
X (m) Y (m) Z (m) (x2-X1)2 (Y2-Y1)2 ((x2-X1)2 +( Y2-Y1)2 )0.5 Chainage
565393.854 1379310.625 1466.002 0.00 0.00 0.00 0.00
565369.386 1379273.869 1465.707 598.68 1351.00 44.16 44.16
565363.528 1379265.913 1465.567 34.32 63.30 9.88 54.04
565352.865 1379247.315 1465.089 113.70 345.89 21.44 75.47
565334.036 1379204.397 1465.008 354.53 1841.95 46.87 122.34
565329.859 1379197.246 1466.584 17.45 51.14 8.28 130.62
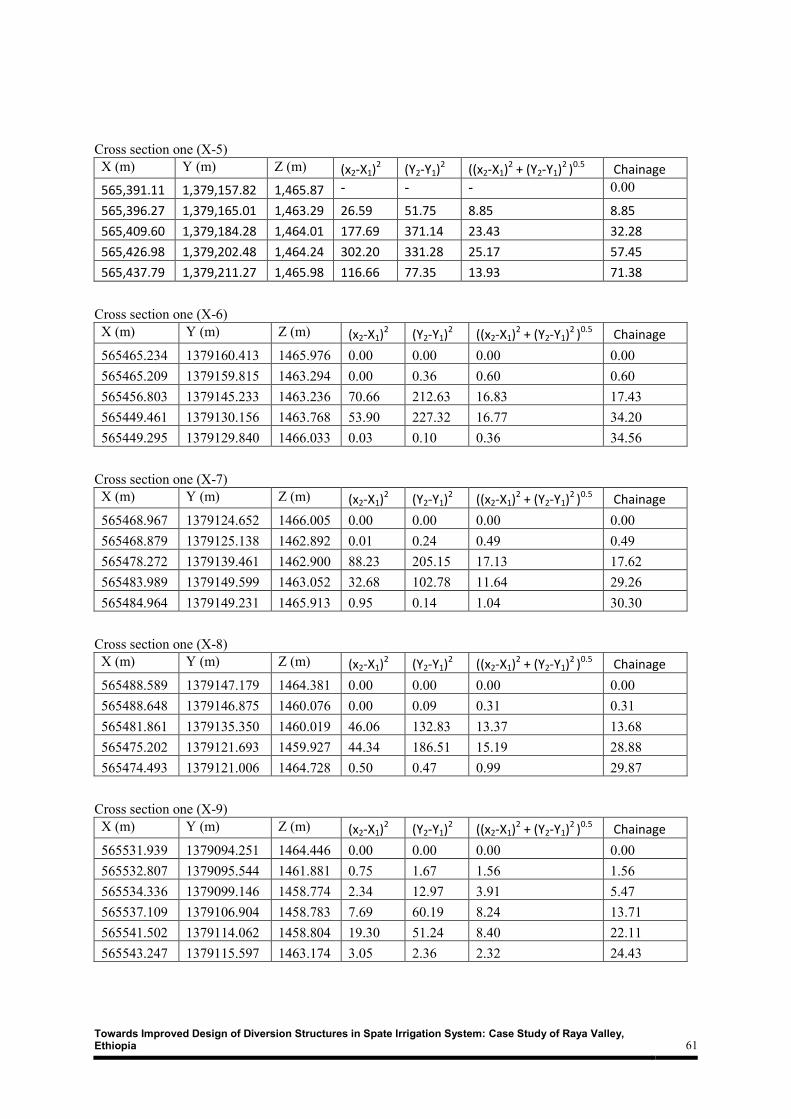
Towards Improved Design of Diversion Structures in Spate Irrigation System: Case Study of Raya Valley, Ethiopia 61
Cross section one (X-5)
X (m) Y (m) Z (m) (x2-X1)2 (Y2-Y1)2 ((x2-X1)2 + (Y2-Y1)2 )0.5 Chainage
565,391.11 1,379,157.82 1,465.87 - - - 0.00
565,396.27 1,379,165.01 1,463.29 26.59 51.75 8.85 8.85
565,409.60 1,379,184.28 1,464.01 177.69 371.14 23.43 32.28
565,426.98 1,379,202.48 1,464.24 302.20 331.28 25.17 57.45
565,437.79 1,379,211.27 1,465.98 116.66 77.35 13.93 71.38
Cross section one (X-6)
X (m) Y (m) Z (m) (x2-X1)2 (Y2-Y1)2 ((x2-X1)2 + (Y2-Y1)2 )0.5 Chainage
565465.234 1379160.413 1465.976 0.00 0.00 0.00 0.00
565465.209 1379159.815 1463.294 0.00 0.36 0.60 0.60
565456.803 1379145.233 1463.236 70.66 212.63 16.83 17.43
565449.461 1379130.156 1463.768 53.90 227.32 16.77 34.20
565449.295 1379129.840 1466.033 0.03 0.10 0.36 34.56
Cross section one (X-7)
X (m) Y (m) Z (m) (x2-X1)2 (Y2-Y1)2 ((x2-X1)2 + (Y2-Y1)2 )0.5 Chainage
565468.967 1379124.652 1466.005 0.00 0.00 0.00 0.00
565468.879 1379125.138 1462.892 0.01 0.24 0.49 0.49
565478.272 1379139.461 1462.900 88.23 205.15 17.13 17.62
565483.989 1379149.599 1463.052 32.68 102.78 11.64 29.26
565484.964 1379149.231 1465.913 0.95 0.14 1.04 30.30
Cross section one (X-8)
X (m) Y (m) Z (m) (x2-X1)2 (Y2-Y1)2 ((x2-X1)2 + (Y2-Y1)2 )0.5 Chainage
565488.589 1379147.179 1464.381 0.00 0.00 0.00 0.00
565488.648 1379146.875 1460.076 0.00 0.09 0.31 0.31
565481.861 1379135.350 1460.019 46.06 132.83 13.37 13.68
565475.202 1379121.693 1459.927 44.34 186.51 15.19 28.88
565474.493 1379121.006 1464.728 0.50 0.47 0.99 29.87
Cross section one (X-9)
X (m) Y (m) Z (m) (x2-X1)2 (Y2-Y1)2 ((x2-X1)2 + (Y2-Y1)2 )0.5 Chainage
565531.939 1379094.251 1464.446 0.00 0.00 0.00 0.00
565532.807 1379095.544 1461.881 0.75 1.67 1.56 1.56
565534.336 1379099.146 1458.774 2.34 12.97 3.91 5.47
565537.109 1379106.904 1458.783 7.69 60.19 8.24 13.71
565541.502 1379114.062 1458.804 19.30 51.24 8.40 22.11
565543.247 1379115.597 1463.174 3.05 2.36 2.32 24.43
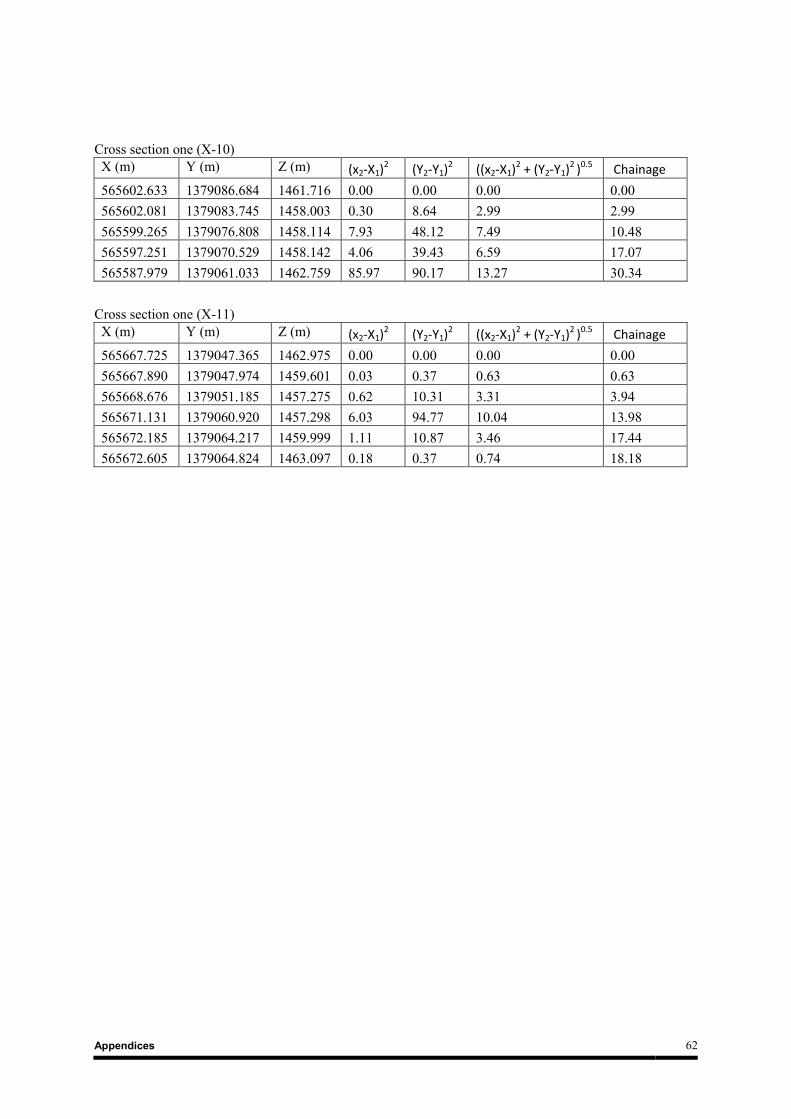
Appendices 62
Cross section one (X-10)
X (m) Y (m) Z (m) (x2-X1)2 (Y2-Y1)2 ((x2-X1)2 + (Y2-Y1)2 )0.5 Chainage
565602.633 1379086.684 1461.716 0.00 0.00 0.00 0.00
565602.081 1379083.745 1458.003 0.30 8.64 2.99 2.99
565599.265 1379076.808 1458.114 7.93 48.12 7.49 10.48
565597.251 1379070.529 1458.142 4.06 39.43 6.59 17.07
565587.979 1379061.033 1462.759 85.97 90.17 13.27 30.34
Cross section one (X-11)
X (m) Y (m) Z (m) (x2-X1)2 (Y2-Y1)2 ((x2-X1)2 + (Y2-Y1)2 )0.5 Chainage
565667.725 1379047.365 1462.975 0.00 0.00 0.00 0.00
565667.890 1379047.974 1459.601 0.03 0.37 0.63 0.63
565668.676 1379051.185 1457.275 0.62 10.31 3.31 3.94
565671.131 1379060.920 1457.298 6.03 94.77 10.04 13.98
565672.185 1379064.217 1459.999 1.11 10.87 3.46 17.44
565672.605 1379064.824 1463.097 0.18 0.37 0.74 18.18
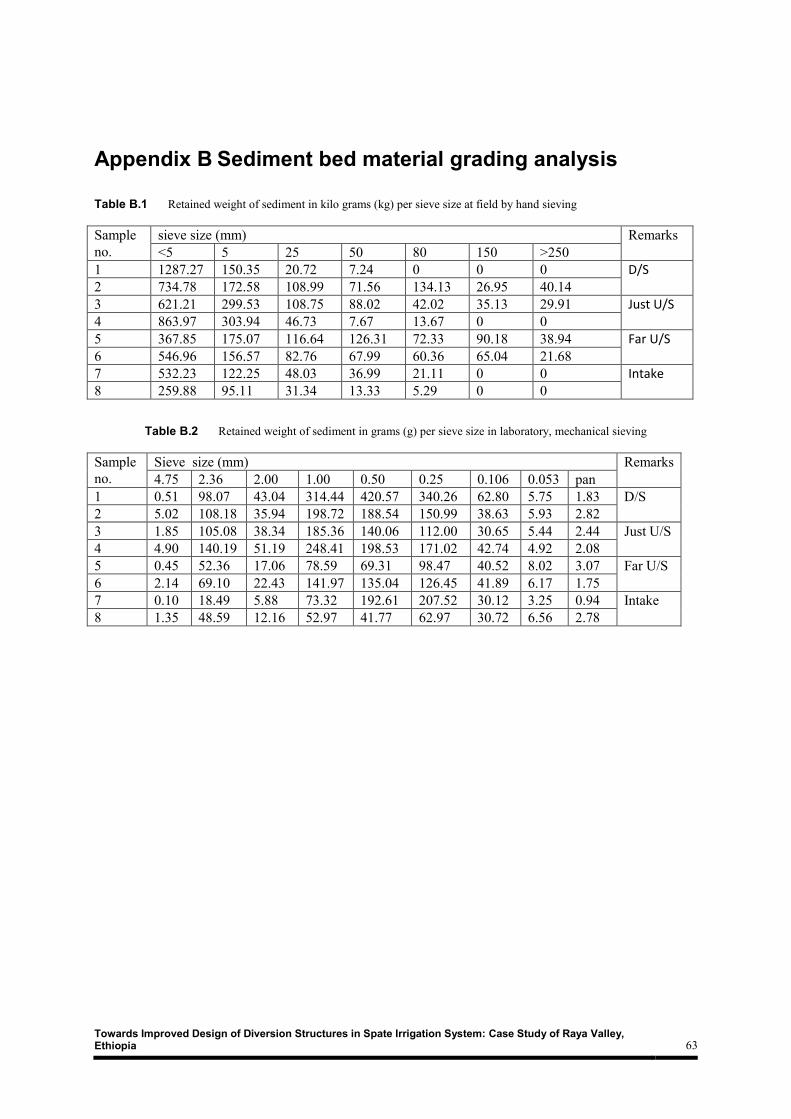
Towards Improved Design of Diversion Structures in Spate Irrigation System: Case Study of Raya Valley, Ethiopia 63
Appendix B Sediment bed material grading analysis
Table B.1 Retained weight of sediment in kilo grams (kg) per sieve size at field by hand sieving
Sample
no.
sieve size (mm) Remarks
<5 5 25 50 80 150 >250
1 1287.27 150.35 20.72 7.24 0 0 0 D/S 2 734.78 172.58 108.99 71.56 134.13 26.95 40.14
3 621.21 299.53 108.75 88.02 42.02 35.13 29.91 Just U/S 4 863.97 303.94 46.73 7.67 13.67 0 0
5 367.85 175.07 116.64 126.31 72.33 90.18 38.94 Far U/S
6 546.96 156.57 82.76 67.99 60.36 65.04 21.68
7 532.23 122.25 48.03 36.99 21.11 0 0 Intake 8 259.88 95.11 31.34 13.33 5.29 0 0
Table B.2 Retained weight of sediment in grams (g) per sieve size in laboratory, mechanical sieving
Sample
no.
Sieve size (mm) Remarks
4.75 2.36 2.00 1.00 0.50 0.25 0.106 0.053 pan
1 0.51 98.07 43.04 314.44 420.57 340.26 62.80 5.75 1.83 D/S
2 5.02 108.18 35.94 198.72 188.54 150.99 38.63 5.93 2.82
3 1.85 105.08 38.34 185.36 140.06 112.00 30.65 5.44 2.44 Just U/S
4 4.90 140.19 51.19 248.41 198.53 171.02 42.74 4.92 2.08
5 0.45 52.36 17.06 78.59 69.31 98.47 40.52 8.02 3.07 Far U/S
6 2.14 69.10 22.43 141.97 135.04 126.45 41.89 6.17 1.75
7 0.10 18.49 5.88 73.32 192.61 207.52 30.12 3.25 0.94 Intake
8 1.35 48.59 12.16 52.97 41.77 62.97 30.72 6.56 2.78
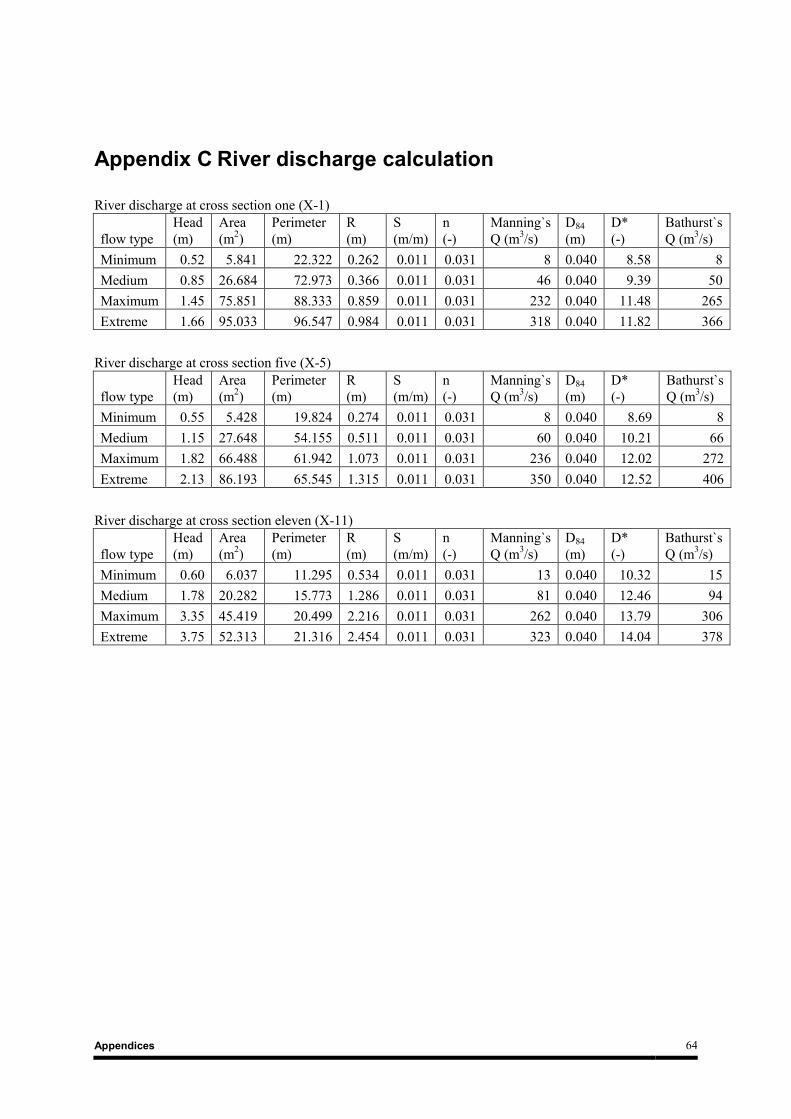
Appendices 64
Appendix C River discharge calculation
River discharge at cross section one (X-1)
flow type
Head
(m)
Area
(m2)
Perimeter
(m)
R
(m)
S
(m/m)
n
(-)
Manning`s
Q (m3/s)
D84
(m)
D*
(-)
Bathurst`s
Q (m3/s)
Minimum 0.52 5.841 22.322 0.262 0.011 0.031 8 0.040 8.58 8
Medium 0.85 26.684 72.973 0.366 0.011 0.031 46 0.040 9.39 50
Maximum 1.45 75.851 88.333 0.859 0.011 0.031 232 0.040 11.48 265
Extreme 1.66 95.033 96.547 0.984 0.011 0.031 318 0.040 11.82 366
River discharge at cross section five (X-5)
flow type
Head
(m)
Area
(m2)
Perimeter
(m)
R
(m)
S
(m/m)
n
(-)
Manning`s
Q (m3/s)
D84
(m)
D*
(-)
Bathurst`s
Q (m3/s)
Minimum 0.55 5.428 19.824 0.274 0.011 0.031 8 0.040 8.69 8
Medium 1.15 27.648 54.155 0.511 0.011 0.031 60 0.040 10.21 66
Maximum 1.82 66.488 61.942 1.073 0.011 0.031 236 0.040 12.02 272
Extreme 2.13 86.193 65.545 1.315 0.011 0.031 350 0.040 12.52 406
River discharge at cross section eleven (X-11)
flow type
Head
(m)
Area
(m2)
Perimeter
(m)
R
(m)
S
(m/m)
n
(-)
Manning`s
Q (m3/s)
D84
(m)
D*
(-)
Bathurst`s
Q (m3/s)
Minimum 0.60 6.037 11.295 0.534 0.011 0.031 13 0.040 10.32 15
Medium 1.78 20.282 15.773 1.286 0.011 0.031 81 0.040 12.46 94
Maximum 3.35 45.419 20.499 2.216 0.011 0.031 262 0.040 13.79 306
Extreme 3.75 52.313 21.316 2.454 0.011 0.031 323 0.040 14.04 378