towards efficient mobile iot with heterogeneous networks ... · faculdade de engenharia da...
TRANSCRIPT
Towards Efficient Mobile IoT withHeterogeneous Networks
Carlos Miguel Silva Couto Pereira
Supervisor: Prof. Dr. Ana Cristina Costa Aguiar
Programa Doutoral em Engenharia Electrotécnica e de Computadores
October, 2017

c© Carlos Miguel Silva Couto Pereira: October, 2017

Faculdade de Engenharia da Universidade do Porto
Towards Efficient Mobile IoT withHeterogeneous Networks
Carlos Miguel Silva Couto Pereira
Dissertation submitted to Faculdade de Engenharia da Universidade do Portoto obtain the degree of
Doctor Philosophiae in Electrical and Computer Engineering
October, 2017


To Raquel and my family.

Abstract
The Internet of Things (IoT) emerges as a myriad of devices and services that interactto build complex distributed applications. Interoperability and standardization are im-perative for the realization of this vision. Machine-to-Machine (M2M) communicationsstandards provided by the European Telecommunications Standards Institute (ETSI) canbe the middleware that glues together the IoT. However, standards are highly complexand require a large amount of interpretation, deployments are currently scarce, and per-formance evaluations are simplistic or speculative, though the envisioned interoperabilitycan greatly reduce the development and deployment costs. IoT applications are currentlyexploiting the growing number of smartphone users as well as the smartphone’s enhancedconnectivity powered by the ubiquity of mobile networks and sensing capabilities. Inmobile M2M communications, smartphones are the natural choice to act as M2M gate-ways (GWs), working as proxy for nearby devices with constrained resources and limitedconnectivity, and used as sensors themselves. However, the use of smartphones as M2MGWs can have an impact on the smartphone usability and introduce undesirable batterydepletion due to network accesses. From a usability perspective, any additional batterydepletion caused by the GW functionality should remain unnoticed, or nearly so. Thismeans that transmission of sensor information should be the most energy efficient aspossible. Nevertheless, each transmission can be performed with several different tech-nologies, each with different power consumption profiles as well as quality of serviceguarantees. The work presented throughout this dissertation seeks to characterize, evalu-ate, and improve the performance of mobile GWs in M2M communications, investigatingthe benefits of the interoperability introduced by standards, of the concurrent use of dif-ferent networks in heterogeneous networks scenarios as well as of the exploitation ofopportunistic transmissions and the use of network coding techniques.
First, as a motivating exploratory experiment, we deploy and evaluate an IoT servicecomposition with mobile GWs to understand how do current IoT applications performusing M2M middleware. We design and implement a mobile e-health application on topof rising standards of the Information and Communication Technology (ICT) infrastruc-ture: ETSI M2M for interconnecting devices and services, and open Electronic HealthRecord (EHR) for data semantics, storing, and making data available. As it plays a keyrole in the system, we also report the design, development, and performance evaluationof an ETSI M2M GW, consisting of an M2M GW Service Capability Layer (GSCL) andan M2M GW Application (GA), instantiated in a smartphone. We use nearly 480 hoursof data from a pilot in which 10 people were remotely monitored for 3 weeks. We mea-
iii

iv
sure latency between system components and quantify application protocol overheads toassess the capabilities and limitations of a standard M2M middleware. Our results showthat, while the latency added by a broker lies around 25 ms, the device-to-final servicelatency can exceed 1 second when using cellular networks, becoming a problem for in-teractive applications. Moreover, we observe that the largest part of the end-to-end (E2E)latency lies between the GW and the broker, even for different networks, mainly due tothe interface state transition delay.
Second, we present a packet transmission scheduling model that exploits the concur-rent use of multiple technologies in heterogeneous networks scenarios while guarantee-ing time requirements. We model the system, including detailed network interface powerconsumption and latency, using linear programming (LP), thus building a useful tool foranalyzing and comparing network performance under different configurations. The modelallows to understand the factors that might cause a network to become more competitive,or to assess the impact of modifications in the network interface performance. For a givenset of packets to be transmitted and a given set of networks available, the model decidesthe best scheduling according to a cost function and ensuring that no deadline is missed.Additionally, this model can be used to inform packet scheduling heuristics that improvethe usability of smartphone GWs. We use a set of relevant features to characterize theoptimal scheduling decisions when the objective is to minimize the energy consumptionin order to devise a packet transmission heuristic. This heuristic has far less complexitythan the model, generating solutions in polynomial time. Schedules obtained from theheuristic show similarities to the energy-optimal schedules obtained from the model withrespect to the packet allocation and the network interfaces state behavior. For a wide setof different scenarios, on average, schedules obtained from the energy minimization prob-lem can reduce the energy consumption in 7% when compared to Earliest Deadline First(EDF) schedules, and reduce nearly 3% when compared to schedules from an energy-aware heuristic based on EDF, thus allowing smartphones to achieve longer battery life.The trade-off is an increase of the packet waiting time. Our heuristic that takes into con-sideration the knowledge obtained from the model is outperformed by only 0.03% by theenergy-optimal decisions, but it runs considerably faster.
Lastly, mechanisms that can cope with unreliable wireless channels in an efficientmanner can be crucial for resource constrained GWs. Concurrent use of technologies isinstrumental towards improving services to mobile devices in heterogeneous networks.We develop an optimization framework to generate channel-aware transmission policiesfor multi-homed devices under different cost criteria. Our formulation considers networkcoding as a key technique that simplifies load allocation across multiple channels and pro-vides high resiliency under time-varying channel conditions. We explore the parameterspace and identify the operating regions where dynamic coded policies offer most im-provement over static ones in terms of energy consumption and channel utilization. Weleverage meta-heuristics to find different local optima, while also tracking the intermedi-ate solutions to map operating regions with gains above 3 dB and 5 dB. Our results show alarge set of relevant configurations where high resource usage efficiency can be obtainedwith the proposed transmission mechanisms.

v
Keywords: Internet of Things (IoT), Machine-to-Machine (M2M) communications,Mobile gateways (GWs), Heterogeneous Networks, Multi-homing, Wireless networks,Resource usage efficiency, Smartphones, Network Coding, E-health, Heuristics, Trans-mission scheduling, System modeling, System performance.

Resumo
A Internet das Coisas (IoT) emerge como um grande número de dispositivos e serviçosque interagem de forma a construir complexas aplicações distribuídas. Interoperabili-dade e standardização são imperativas para a realização desta visão. Standards de co-municações Máquina-a-Máquina (M2M) fornecidos pelo European TelecommunicationsStandards Institute (ETSI) podem ser a camada que liga a IoT. No entanto, standards sãoextremamente complexos e requerem uma grande quantidade de interpretação, implemen-tações são escassas, e avaliações de desempenho são simples ou especulativas, apesar dainteroperabilidade prevista poder reduzir enormemente os custos de desenvolvimento eimplementação. Aplicações IoT estão atualmente a explorar o número crescente de uti-lizadores de telemóvel, assim como a conectividade aumentada dos telemóveis potenciadapela ubiquidade das redes móveis, e as capacidades sensoriais. Nas comunicações M2Mmóveis, smartphones são a escolha natural para atuarem como gateways (GWs) M2M,funcionando como representante (proxy) para dispositivos nas imediações que tenhamrecursos restritos, e usados eles próprios como sensores. No entanto, o uso de smart-phones como GWs M2M pode ter um impacto na usabilidade do smartphone e introduzirconsumo de bateria indesejável devido aos acessos de rede. Numa perspetiva de usabili-dade, qualquer consumo de bateria adicional causado pela funcionalidade de GW deveriapassar despercebido. Isto significa que a transmissão de informação de sensores deve-ria ser o mais energeticamente eficiente possível. De qualquer forma, cada transmissãopode ser feita usando várias tecnologias diferentes, cada uma com diferentes perfis depotência usada assim como diferentes garantias de qualidade de serviço. O trabalho apre-sentado ao longo desta dissertação procura caracterizar, avaliar e melhorar o desempenhode GWs móveis em comunicações M2M, investigando os benefícios da interoperabilidadeintroduzida pelos standards, o uso concorrente de diferentes redes em cenários de redesheterogéneas, assim como a exploração de transmissões oportunísticas e o uso de técnicasde codificação em rede.
Primeiro, implementamos e avaliamos experimentalmente uma composição de servi-ços IoT com GWs móveis para compreender qual o desempenho das atuais aplicaçõesIoT usando a camada M2M. Projetamos e implementamos uma aplicação móvel de saúdeeletrónica no topo de standards em ascensão da infraestrutura de Tecnologias de Infor-mação e Comunicação (ICT): ETSI M2M para interconectar dispositivos e serviços e oregisto eletrónico de saúde (EHR) aberto para a semântica, armazenamento e exposiçãodos dados disponíveis. Como é uma parte fundamental do sistema, também descreve-mos o desenho, desenvolvimento e avaliação do desempenho duma GW ETSI M2M,
vii
viii
consistindo numa camada de capacidade de serviço GW (GSCL) e numa aplicação GWM2M (GA), instanciada num smartphone. Usamos aproximadamente 480 horas de dadosdum piloto no qual monitorizámos 10 pessoas durante 3 semanas. Medimos a latênciaentre componentes do sistema e quantificamos os overheads do protocolo de aplicaçãopara avaliar as capacidade e limitações duma camada standard M2M. Os nossos resul-tados mostram que, enquanto a latência adicionada por um broker ronda os 25 ms, alatência entre dispositivo e serviço final pode exceder 1 segundo quando redes celularessão usadas, o que se torna um problema para aplicações interativas. Para além disso, ob-servamos que a maior parte da latência ponta-a-ponta (E2E) reside entre a GW e o broker,mesmo para diferentes redes, devido principalmente ao atraso da transição de estado dainterface.
Em segundo lugar, apresentamos um modelo de escalonamento de transmissão depacotes que explora o uso concorrente de múltiplas tecnologias em cenários de redes het-erogéneas enquanto garante requisitos de tempo. Modelamos o sistema, incluindo con-sumo de potência e latência detalhados das interfaces de rede, usando programação linear(LP), de forma a construir uma ferramenta útil para a análise e comparação do desem-penho de redes com diferentes configurações. Esta ferramenta permite compreender osfatores que podem levar uma rede a tornar-se mais competitiva, ou verificar o impacto demodificações no desempenho da interface de rede. Para um conjunto de pacotes a seremtransmitidos e um conjunto de redes disponíveis, o modelo decide o melhor escalona-mento de acordo com uma função de custo e assegurando que nenhum prazo de entregaé falhado. Adicionalmente, este modelo pode ser usado para construir heurísticas deescalonamento de pacotes que melhoram a usabilidade de GWs em smartphones. Usamosum conjunto de características relevantes para caracterizar as decisões de escalonamentoótimas quando o objetivo é minimizar o consumo de energia de forma a arquitetar umaheurística de escalonamento de pacotes. Esta heurística tem uma muito menor complex-idade que o modelo, gerando soluções em tempo polinomial. Escalonamentos obtidosda heurística mostram semelhanças aos escalonamentos óptimos obtidos do modelo emrelação à alocação de pacotes e ao comportamento do estado da interface de rede. Paraum largo conjunto de cenários, em média, escalonamentos obtidos do problema de mini-mização de energia podem reduzir o consumo de energia em 7% quando comparados comescalonamentos "primeiro o prazo de entrega mais próximo" (EDF) e reduzir quase 3%quando comparado com escalonamentos duma heurística baseada em EDF mas ciente doconsumo de energia. Por isso, permitindo os smartphones utilizarem a bateria por perío-dos mais longos sem carregamento. Em troca, há um aumento do tempo de espera dospacotes. A nossa heurística que tem em consideração o conhecimento obtido do modeloé superada apenas por 0.03% pelo ótimo, mas corre muito mais rapidamente.
Por último, mecanismos que podem lidar com canais sem-fios instáveis de uma formaeficiente podem ser cruciais para GWs com recursos limitados. O uso concorrente demúltiplas tecnologias de comunicação é instrumental para melhorar serviços em dis-positivos móveis em cenários de redes heterogéneas. Desenvolvemos uma estrutura deotimização para gerar políticas de transmissão, que têm em conta os estados dos canais,para dispositivos sob diferentes critérios de custo. A nossa formulação considera codifi-cação em rede como uma técnica fundamental que simplifica a alocação de carga ao longode múltiplos canais e fornece alta resiliência sob condições de canal variáveis ao longo

ix
do tempo. Exploramos o espaço de parâmetros e identificamos as regiões de operaçãoonde políticas de codificação dinâmicas oferecem o melhor em termos de consumo de en-ergia e utilização de canal em comparação com políticas estáticas. Fomentamos o uso demeta-heurísticas para encontrar diferentes ótimos locais, enquanto procuramos soluçõesintermédias para mapear regiões de operação com ganhos acima de 3 db e 5 db. Os nossosresultados revelam um largo espectro de configurações relevantes onde uma alta eficiênciado uso de recursos pode ser obtida com os mecanismos de transmissão propostos.
Palavras-chave: Internet das Coisas (IoT), Comunicações Máquina-a-Máquina (M2M),Gateways (GWs) móveis, Redes heterogéneas, Multi-homing, Redes sem-fios, Eficiênciado uso de recursos, Smartphones, Codificação em rede, Saúde eletrónica, Heurísticas,Escalonamento de transmissão, Modelação de sistema, Desempenho de sistema.

Agradecimentos
Antes de mais, quero agradecer a todos que contribuíram para o meu doutoramento e estetrabalho.
Agradeço à minha orientadora, Prof. Ana Aguiar, pela oportunidade de ter seguidoeste caminho. Teve um papel fundamental no apoio e na motivação ao longo deste tra-balho e em garantir financiamento ao longo destes anos.
Fico muito agradecido também ao Prof. Daniel Lucani que teve um papel importantena minha atitude como investigador e aluno de doutoramento.
Quero agradecer ao Prof. James Gross no âmbito da colaboração do projecto de RFJamming em VANETs e pela estadia em Aachen.
Agradeço ao António Pinto e Ricardo Morgado pelo trabalho realizado no âmbitodo desenvolvimento do sistema e do piloto M2M, assim como agradeço ao Jorge Sousa,Pedro Rocha e Fernando Santiago, da PT Inovação, pela colaboração e participação nosprojetos associados.
Agradeço a todas as pessoas do IT-Porto, principalmente do grupo NIS e da sala I117,pelas longas horas de brain-storming e de ajuda, sempre com boa disposição e os habituaisintervalos para café.
Gostaria de agradecer também aos Profs. Luis Almeida, Miguel Coimbra, Pedro Bran-dão e Ricardo Morla não só pelas colaborações em projetos e publicações, mas tambémpelos conselhos e discussões de ideias.
Por último, deixo os meus agradecimentos à Raquel, à minha família e aos meusamigos que sempre me apoiaram e ajudaram a ter a força necessária para tudo.
Carlos
xi


Publications
Journal Papers
C. Pereira and A. Aguiar. Energy-aware scheduling for mobile iot gateways onheterogeneous networks. IEEE Internet of Things Journal, Submitted.
C. Pereira, J. Cardoso, A. Aguiar, and R. Morla. Benchmarking iot middlewareplatforms. Journal of Reliable Intelligent Environment, Submitted.
C. Pereira, A. Pinto, D. Ferreira, and A. Aguiar. Experimental characterization of mobileiot application latency. IEEE Internet of Things Journal, 4(4):1082–1094, August 2017.
C. Pereira, A. Aguiar, and D.E. Lucani. When are network coding based dynamicmulti-homing techniques beneficial? Computer Networks, 108(C):55–65, October 2016.
O. Puñal, C. Pereira, A. Aguiar, and J. Gross. Experimental characterization andmodeling of rf jamming attacks on vanets. IEEE Transactions on Vehicular Technology,64(2):524–540, February 2015.
C. Pereira and A. Aguiar. Towards efficient mobile m2m communications: Survey andopen challenges. Sensors 14(10):19582–19608, October 2014.
Conference and Workshop Papers
J. Cardoso, C. Pereira, A. Aguiar, and R. Morla. Benchmarking iot middlewareplatforms. In 2017 IEEE 18th International Symposium on a World of Wireless, Mobileand Multimedia Networks (WoWMoM), pages 1–7, June 2017. Invited for a submissionof an extended version to a special issue published on Journal of Reliable IntelligentEnvironment.
C. Pereira and A. Aguiar. Modelling and optimisation of packet transmission schedulingin m2m communications. In 2017 IEEE International Conference on CommunicationsWorkshops (ICC Workshops), pages 576–582, May 2017.
xiii

xiv
C. Pereira, A. Pinto, P. Rocha, F. Santiago, J. Sousa, and A. Aguiar. Iot interoperabilityfor actuating applications through standardised m2m communications. In 2016 IEEE17th International Symposium on a World of Wireless, Mobile and Multimedia Networks(WoWMoM), pages 1–6, June 2016.
C. Pereira, J. Rodrigues, A. Pinto, P. Rocha, F. Santiago, J. Sousa, and A. Aguiar.Smartphones as m2m gateways in smart cities iot applications. In 2016 23rdInternational Conference on Telecommunications (ICT), pages 184–190, May 2016.
C. Pereira, A. Pinto, and A. Aguiar. Improvement of battery efficiency of smartphones asm2m gws by using buffers. In 1st Doctoral Congress in Engineering, pages 1–2, June2015.
C. Pereira, S. Frade, P. Brandão, R. Correia, and A. Aguiar. Integrating data and networkstandards into an interoperable e-health solution. In 2014 IEEE 16th InternationalConference on e-Health Networking, Applications and Services (Healthcom), pages99–104, October 2014.
C. Pereira and A. Aguiar. A realistic rf jamming model for vehicular networks: Designand validation. In 2013 IEEE 24th Annual International Symposium on Personal, Indoor,and Mobile Radio Communications (PIMRC), pages 1868–1872, September 2013.
C. Pereira, A. Aguiar, and D.E. Lucani. Dynamic load allocation for multi-homing viacoded packets. In 2013 IEEE 77th Vehicular Technology Conference (VTC Spring),pages 1–5, June 2013.
Datasets
O. Puñal, C. Pereira, A. Aguiar, and J. Gross. CRAWDAD datasetuportorwthaachen/vanetjamming2012 (v. 2014-05-12). Available athttp://crawdad.org/uportorwthaachen/vanetjamming2012.
O. Puñal, C. Pereira, A. Aguiar, and J. Gross. CRAWDAD datasetuportorwthaachen/vanetjamming2014 (v. 2014-05-12). Available athttp://crawdad.org/uportorwthaachen/vanetjamming2014.
Oral Communications and Posters
C. Pereira and A. Aguiar. Energy-aware scheduling for mobile IoT gateway onheterogeneous networks. In Ciência 2017, July 2017.

xv
C. Pereira and A. Aguiar. Modelling and optimisation of packet transmission schedulingin m2m communications. In NanoSTIMA 3.5 Meeting, May 2017.
C. Pereira, A. Pinto, and A. Aguiar. Joining m2m and openehr in an e-health framework.In 10th Conference on Telecommunications, Conftele 2015, pages 1–3, September 2015.

xvi

Co-Supervision of M.Sc. theses
António Filipe Carvalho Pinto, M2M Interoperability, Mestrado Integrado emEngenharia de Redes e Sistemas Informáticos, FCUP, 2016.
Ricardo Jorge Travanca Morgado, Mobile Healthcare on a M2M Mobile System,Mestrado Integrado em Engenharia Eletrotécnica e de Computadores, FEUP, 2014.
xvii


“A complex system that works is invariably found tohave evolved from a simple system that worked.”
John Gall
xix


Contents
List of Figures xxiv
List of Tables xxv
List of Abbreviations xxxi
1 Introduction 11.1 Motivation . . . . . . . . . . . . . . . . . . . . . . . . . . . . . . . . . . 11.2 Research Questions . . . . . . . . . . . . . . . . . . . . . . . . . . . . . 41.3 Contributions . . . . . . . . . . . . . . . . . . . . . . . . . . . . . . . . 51.4 Organization . . . . . . . . . . . . . . . . . . . . . . . . . . . . . . . . . 7
2 IoT and M2M communications 92.1 Services in IoT . . . . . . . . . . . . . . . . . . . . . . . . . . . . . . . 92.2 Challenges in mobile M2M communications . . . . . . . . . . . . . . . . 10
2.2.1 M2M Traffic . . . . . . . . . . . . . . . . . . . . . . . . . . . . 112.2.2 M2M Support in Wireless Networks . . . . . . . . . . . . . . . . 122.2.3 M2M Support in Cellular Networks . . . . . . . . . . . . . . . . 132.2.4 Energy Efficiency . . . . . . . . . . . . . . . . . . . . . . . . . . 142.2.5 Device Mobility, Autonomy, and Security . . . . . . . . . . . . . 152.2.6 M2M Application Protocols . . . . . . . . . . . . . . . . . . . . 16
2.3 Interoperable M2M . . . . . . . . . . . . . . . . . . . . . . . . . . . . . 232.3.1 ETSI M2M Architecure . . . . . . . . . . . . . . . . . . . . . . 232.3.2 ETSI M2M Communication Models and Paradigms . . . . . . . . 262.3.3 Interoperability Benefits . . . . . . . . . . . . . . . . . . . . . . 28
3 Design and Evaluation of an interoperable M2M ecosystem 333.1 System Design and Implementation . . . . . . . . . . . . . . . . . . . . 36
3.1.1 Background on EHR . . . . . . . . . . . . . . . . . . . . . . . . 363.1.2 Mapping Storyboard to M2M . . . . . . . . . . . . . . . . . . . 373.1.3 User Data . . . . . . . . . . . . . . . . . . . . . . . . . . . . . . 383.1.4 Designing an M2M GW in an Android Smartphone . . . . . . . . 413.1.5 Designing NAs . . . . . . . . . . . . . . . . . . . . . . . . . . . 463.1.6 Pilot Setup and Implementation . . . . . . . . . . . . . . . . . . 48
3.2 Measuring Latencies . . . . . . . . . . . . . . . . . . . . . . . . . . . . 493.2.1 Synchronization . . . . . . . . . . . . . . . . . . . . . . . . . . 50
xxi
xxii CONTENTS
3.2.2 Timestamping . . . . . . . . . . . . . . . . . . . . . . . . . . . . 513.3 System Evaluation . . . . . . . . . . . . . . . . . . . . . . . . . . . . . 53
3.3.1 Quantification of Application Protocol Overheads . . . . . . . . . 533.3.2 Characterization of the E2E Latency . . . . . . . . . . . . . . . . 543.3.3 Quantification of the Impact of the Broker . . . . . . . . . . . . . 553.3.4 Impact of Mobility . . . . . . . . . . . . . . . . . . . . . . . . . 573.3.5 Quantification of the Impact of the Promotion Delay . . . . . . . 58
3.4 Discussion and Important Observations . . . . . . . . . . . . . . . . . . 613.4.1 Discussion . . . . . . . . . . . . . . . . . . . . . . . . . . . . . 613.4.2 Important Observations . . . . . . . . . . . . . . . . . . . . . . . 63
4 Modeling and Optimization of Packet Transmission Scheduling in M2M 654.1 Modeling Packet Transmissions . . . . . . . . . . . . . . . . . . . . . . 69
4.1.1 Model Assumptions . . . . . . . . . . . . . . . . . . . . . . . . 694.1.2 Model Definition . . . . . . . . . . . . . . . . . . . . . . . . . . 70
4.2 Settings . . . . . . . . . . . . . . . . . . . . . . . . . . . . . . . . . . . 744.3 Packet Transmission Scheduling Heuristic . . . . . . . . . . . . . . . . . 76
4.3.1 Feature Selection . . . . . . . . . . . . . . . . . . . . . . . . . . 774.3.2 Cluster Analysis . . . . . . . . . . . . . . . . . . . . . . . . . . 774.3.3 Transmission Heuristic Algorithm . . . . . . . . . . . . . . . . . 79
4.4 Scheduling Evaluation . . . . . . . . . . . . . . . . . . . . . . . . . . . 844.5 Discussion . . . . . . . . . . . . . . . . . . . . . . . . . . . . . . . . . . 89
5 Enabling Efficient GWs with Network Coding 915.1 Framework . . . . . . . . . . . . . . . . . . . . . . . . . . . . . . . . . 94
5.1.1 Comparison Policies . . . . . . . . . . . . . . . . . . . . . . . . 975.1.2 Metrics . . . . . . . . . . . . . . . . . . . . . . . . . . . . . . . 97
5.2 Simulated Annealing Meta-heuristics . . . . . . . . . . . . . . . . . . . . 985.3 Results . . . . . . . . . . . . . . . . . . . . . . . . . . . . . . . . . . . . 100
5.3.1 Channels with same energy consumption . . . . . . . . . . . . . 1025.3.2 Channels with different energy consumptions . . . . . . . . . . . 104
5.4 Discussion . . . . . . . . . . . . . . . . . . . . . . . . . . . . . . . . . . 108
6 Conclusions and Future Work 1116.1 Conclusions . . . . . . . . . . . . . . . . . . . . . . . . . . . . . . . . . 1116.2 Future Work . . . . . . . . . . . . . . . . . . . . . . . . . . . . . . . . . 113
A Dynamic Load Allocation for Multi-homing via Coded Packets 115
Bibliography 123
List of Figures
2.1 CoAP observer design pattern. . . . . . . . . . . . . . . . . . . . . . . . 182.2 Transparent and aggregating GWs in MQTT. . . . . . . . . . . . . . . . 202.3 ETSI M2M high level system overview. . . . . . . . . . . . . . . . . . . 242.4 ETSI M2M ecosystem. . . . . . . . . . . . . . . . . . . . . . . . . . . . 262.5 ETSI M2M resource structure. . . . . . . . . . . . . . . . . . . . . . . . 292.6 Applications in non-M2M and in M2M scenarios. . . . . . . . . . . . . . 302.7 Comparison between performance of two applications in a non-M2M and
M2M scenarios. . . . . . . . . . . . . . . . . . . . . . . . . . . . . . . . 31
3.1 Overview of the mobile e-health application. . . . . . . . . . . . . . . . . 343.2 M2M system design. . . . . . . . . . . . . . . . . . . . . . . . . . . . . 373.3 Message sequence during the pilot. . . . . . . . . . . . . . . . . . . . . . 393.4 JSON containing two archetypes: heart rate variability and mobility. . . . 403.5 Implementation of an M2M GW. . . . . . . . . . . . . . . . . . . . . . . 423.6 Implementation of an NA. . . . . . . . . . . . . . . . . . . . . . . . . . 473.7 Location of the system entities. . . . . . . . . . . . . . . . . . . . . . . . 493.8 Latency measurement between entities presented. . . . . . . . . . . . . . 523.9 Amount of data received per minute at NSCL during the measurements. . 543.10 Comparison between the time each gateway was running and the actual
active time when it was collecting sensor data and transmitting. . . . . . . 553.11 Amount of HTTP data sent and received at each gateway. . . . . . . . . . 563.12 CDF of the average application-level latency between the entities that
compose the E2E latency. . . . . . . . . . . . . . . . . . . . . . . . . . . 573.13 Average application-level latency between M2M GW publications and
reception at NSCL and the traveled distance per measurement day foreach GW. . . . . . . . . . . . . . . . . . . . . . . . . . . . . . . . . . . 58
3.14 Message sequence to measure the impact of the gateway’s network in-terface state at the average application-level RTT between the M2M GWand NSCL in a static and controlled environment. . . . . . . . . . . . . . 59
3.15 Average application-level RTT between the M2M GW and NSCL for thefirst and the subsequent four publications of each sequence for Wi-Fi,GPRS, UMTS, and LTE, in a static and controlled environment. . . . . . 59
4.1 Application scenario for modeling packet transmission scheduling. . . . . 674.2 Packet transmission scheduling. . . . . . . . . . . . . . . . . . . . . . . 684.3 Network interfaces state machine. . . . . . . . . . . . . . . . . . . . . . 70
xxiii

xxiv LIST OF FIGURES
4.4 Packet allocation and deadline fulfillment. . . . . . . . . . . . . . . . . . 734.5 Network interfaces during packet transmissions. . . . . . . . . . . . . . . 744.6 Hierarchical clustering with dendrogram. . . . . . . . . . . . . . . . . . 794.7 Initial packet allocation near deadline. . . . . . . . . . . . . . . . . . . . 804.8 Optimization and enforcement of the state machine. . . . . . . . . . . . . 804.9 Dedrogram comparison. . . . . . . . . . . . . . . . . . . . . . . . . . . 814.10 Calculation of the waiting and slack times for a packet. . . . . . . . . . . 854.11 Energy consumption for the different scheduling across the different sce-
narios. . . . . . . . . . . . . . . . . . . . . . . . . . . . . . . . . . . . . 854.12 Waiting time for the different scheduling across the different scenarios. . . 864.13 Slack time obtained for the different scheduling across the different sce-
narios. . . . . . . . . . . . . . . . . . . . . . . . . . . . . . . . . . . . . 864.14 Execution time for the different scheduling across the different scenarios. 87
5.1 GW can connect to two different channel interfaces to transmit randomlinear network coded packets in a time-slotted system to a destination. . . 95
5.2 Boxplot of the final best solutions and boxplot of the parameters, for theChannel Utilization Gap of DPOCU (same as Energy Consumption Gapof DPOEC) with respect to the fixed policies. . . . . . . . . . . . . . . . 103
5.3 Spider Chart for all Current Solution that provide a Channel Utilizationgap of DPOCU (same as Energy Consumption Gap of DPOEC) with re-spect to the fixed policies above 3 dB. . . . . . . . . . . . . . . . . . . . 104
5.4 Boxplot of the final best solutions and energy consumption of channel1 and boxplot of the parameters, for the Energy Consumption Gap ofDPOEC with respect both to the fixed policies and DPOCU. . . . . . . . 105
5.5 Spider chart for all Current Solution that provide an Energy ConsumptionGap of DPOEC with respect both to the fixed policies and DPOCU above3 dB. . . . . . . . . . . . . . . . . . . . . . . . . . . . . . . . . . . . . . 106
5.6 Boxplot of the final best solutions and energy consumption of channel1 and boxplot of the parameters, for the Energy Consumption Gap ofDPOEC with respect only to the fixed policies. . . . . . . . . . . . . . . 107
5.7 Relation between the maximum Best Solution of the Energy ConsumptionGap of DPOEC with respect only to the fixed policies and the energyconsumption of channel 1. . . . . . . . . . . . . . . . . . . . . . . . . . 108
A.1 Channel Utilization Gap of DPOCU for different source rates. . . . . . . 119A.2 Energy Consumption Gap of DPOEC for different source rates. . . . . . . 120A.3 Varying ECh1/ECh2. . . . . . . . . . . . . . . . . . . . . . . . . . . . . . 121A.4 Energy Consumption Gap of DPOEC when compared with the other poli-
cies for different source rates and ECh1 ≈ 5×ECh2. . . . . . . . . . . . . 122A.5 Channel Utilization Gap of DPOCU when compared with the other poli-
cies for different source rates and ECh1 ≈ 5×ECh2. . . . . . . . . . . . . 122

List of Tables
2.1 Summary of survey of literature and challenges. . . . . . . . . . . . . . . 112.2 Comparison between main features of CoAP and MQTT. . . . . . . . . . 22
3.1 Performance evaluation of the M2M GW in terms of memory and CPUusage and battery life. . . . . . . . . . . . . . . . . . . . . . . . . . . . . 46
3.2 Points and levels where timestamps were acquired during the exchangingof data packets between the different entities. . . . . . . . . . . . . . . . 50
3.3 Notations and equations of latencies measured between system components. 513.4 Measured promotion delay for Wi-Fi, GPRS, UMTS, and LTE, in a static
and controlled environment. . . . . . . . . . . . . . . . . . . . . . . . . 603.5 Average application-level latency between the M2M GW and NSCL when
the gateway’s interface state is On and Idle for Wi-Fi, GPRS, UMTS, andLTE, in a static and controlled environment. . . . . . . . . . . . . . . . . 61
4.1 Notations used in the model. . . . . . . . . . . . . . . . . . . . . . . . . 714.2 Power consumption profiles of Wi-Fi and LTE. . . . . . . . . . . . . . . 754.3 Parameters used for scenario generation. . . . . . . . . . . . . . . . . . . 764.4 Average energy consumption, waiting time, slack time, and execution
time for the different scheduling for all scenarios. . . . . . . . . . . . . . 88
5.1 Notations used in the framework. . . . . . . . . . . . . . . . . . . . . . . 965.2 Parameters range and counters values. . . . . . . . . . . . . . . . . . . . 1025.3 Maximum, mean, and median gains obtained for the Channel Utilization
Gap of DPOCU with respect to the fixed policies under good, medium,and bad channel conditions. . . . . . . . . . . . . . . . . . . . . . . . . . 109
xxv

List of Algorithms
1 Remote actuation using ETSI M2M. . . . . . . . . . . . . . . . . . . . . . 48
2 Packet transmission heuristic algorithm. . . . . . . . . . . . . . . . . . . . 83
3 Simulated Annealing algorithm. . . . . . . . . . . . . . . . . . . . . . . . 99
xxvii


List of Abbreviations
3GPP 3rd Generation Partnership ProjectACK AcknowledgmentADL Archetype Definition LanguageAMQP Advanced Message Queuing ProtocolAPI Application Programming InterfaceaPoC Application Point of ContactaPoCPaths aPoC PathsARQ Automatic Repeat reQuestAWGN Additive White Gaussian NoiseBAN Body Area NetworkBPSK Binary PSKBT BluetoothCDMA Code Division Multiple AccessCoAP Constrained Application ProtocolCON ConfirmableCPU Central Processing UnitCN Core NetworkCRUD Create, Retrieve, Update, and DeleteDNS Domain Name SystemDPOCU Dynamic Policy Optimizing Channel UtilizationDPOEC Dynamic Policy Optimizing Energy ConsumptionDTLS Datagram TLSEDF Earliest Deadline FirstENB Evolved NodeBEVDO Evolution-Data OptimizedEHR Electronic Health RecordETSI European Telecommunications Standards InstituteE2E End-to-EndFEC Forward Error CorrectionFP Fixed Policy
xxix

xxx List of Abbreviations
FSMC Finite-State Markov ChannelGA GW ApplicationGIP GW Internetworking ProxyGPRS General Packet Radio ServiceGPS Global Positioning SystemGSCL GW SCLGW GatewayH2H Human-to-HumanH2M Human-to-MachineHDR Highest Data RateHRV Heart Rate VariabilityHSDPA High-Speed Downlink Packet AccessHSUPA High-Speed Uplink Packet AccessHTTP Hypertext Transfer ProtocolICT Information and Communication TechnologyIEEE Institute of Electrical and Electronics EngineersI/O Input/OutputIoT Internet of ThingsIP Internet ProtocolIPC Inter Process CommunicationIPsec IP SecurityISO International Organization for StandardizationJSON JavaScript Object NotationLDPC Low-density parity-checkLDR Lowest Data RateLEDF Low-energy EDFLP Linear ProgrammingLT Luby TransformLTE Long Term EvolutionM2M Machine-to-MachineMAC Medium Access ControlMQTT Message Queuing Telemetry TransportMQTT-S MQTT for Sensor NetworksMTC Machine Type CommunicationsNA Network ApplicationNAlib NA libraryNFC Near Field CommunicationNFV Network Function Virtualization

List of Abbreviations xxxi
NON Non-ConfirmableNSCL Network SCLNTP Network Time ProtocolOS Operative SystemOWD One-Way DelayPSK Phase-shift KeyingQPSK Quadrature PSKQoS Quality of ServiceRAM Random Access MemoryRAN Radio Access NetworkREST Representational State TransferRST ResetRTT Round Trip TimeSA Simulated AnnealingSC Service CapabilitySCL SC LayerSDN Software Defined NetworkingSMS Short Message ServiceSNR Signal-to-Noise RatioTC Technical CommitteeTCP Transmission Control ProtocolTLS Transport Layer SecurityTS Technical StandardUE User EquipmentUDP User Datagram ProtocolUMTS Universal Mobile Telecommunication SystemURI Universal Resource IdentifierUTRAN UMTS Terrestrial Radio Access NetworkUWB UltrawidebandVoIP Voice over IPVNF Virtual Network FunctionXMPP Extensible Messaging and Presence ProtocolW-CDMA Wideband CDMAWiMAX Worldwide Interoperability for Microwave AccessWLAN Wireless Local Area NetworkWSN Wireless Sensor Network


Chapter 1
Introduction
1.1 Motivation
Machine-to-Machine (M2M) communications describe mechanisms, algorithms, and tech-nologies that enable networked devices, wireless and/or wired, and services to exchangeinformation or control data seamlessly, with reduced to none explicit human intervention.In this context, a machine is a device or piece of software, as opposed to a human [PA14].
M2M communications are expected to revolutionize telecommunication operators’business due to the emergence of new networked applications, which will attract newclients and increase the data flowing in their networks, creating more billing opportuni-ties. Recently, several Internet of Things (IoT) services are rising using M2M to connectdevices. Perhaps the most known examples for IoT/M2M are e-health, intelligent trans-portation systems, smart grids, smart home, and smart city [ETS13c, ETS13b, ZYX+11,FHK14, CDBN09]. The IoT with its unlimited range of applications that rely on every-day objects becoming intelligent connected devices is a major driver for M2M applica-tions [GIMA10]. The National Intelligence Council foresees that food packages, furni-ture, and even paper documents can be Internet nodes by 2025 [NCI08]. IDC envisions212 billion "things" by the end of 2020, where 30 billion are expected to be connected au-tonomously [IDC13]. Ericsson forecasts say that nearly 29 billion connected things willbe in use worldwide in 2022, of which around 18 billion will be related to IoT [Eri16].
Mobile M2M communications will certainly play a significant role in the M2M ecosys-tem. The Cisco Visual Networking Index Global Mobile Data Traffic Forecast Update es-timates that in 2013 mobile M2M communications represented 1% of all mobile data with4.9% of all connected devices, and by 2018 mobile M2M communications will represent6% of all mobile data with 19.7% of all connected devices [Cis14].
Key challenges in mobile M2M will be the support of a large variety and diversity of
1
2 Introduction
devices, most of them with resource constraints (energy, bandwidth, memory, processing,etc.), and the traffic volume and traffic pattern they generate. M2M traffic differs fromHuman-to-Machine (H2M) or Human-to-Human (H2H) by the large number of shortpayload transactions [DHVV12]. The uplink traffic will be dominant in the first sinceM2M devices will rather be data generators, data resulted from monitoring or sensingapplication, than data consumers. Furthermore, downlink traffic in M2M is expected tobe mainly actuation commands, typically few and short when compared to sensing data.The communication model in H2H is predominately request-response, while for M2M itis expected a partition between request-response and publish-subscribe.
The current demand for standardization, where products have their integration withcurrent technologies or infrastructures guaranteed, allows hardware and software man-ufacturers to concentrate in developing new products and improve their performance.Furthermore, standardization can foster the acceptance and deployment of IoT applica-tions, attaining the interoperability among devices and services outside application silos,while avoiding market fragmentation. By using common building blocks and network re-sources, mobile systems can reduce costs and data redundancy using standardized M2Mcommunications. The European Telecommunications Standards Institute (ETSI) M2Marchitecture [ETS13e] was the leading vision for global, end-to-end (E2E), standardizedM2M communications, and has been adopted by oneM2M for evolving into a worldwidestandard [oned]. However, interpretation, implementation, and evaluation of standards isa cumbersome task.
A promising use case for mobile M2M communications is its application in healthcarefor remote monitoring of patient vital signs, e.g., activity level, blood pressure, heart rate,temperature, either for ambulatory monitoring of chronic conditions, or for prophylac-tic reasons, in order to minimize the number of visits to the doctor [ETS13b, MPZ+13].In the latter scenario, there are wearable sensors that continuously collect physiologicinformation and send it to a remote service to be processed and acted upon. Mobilee-health is a perfect use case for analysis because available solutions tend to be propri-etary. This leads to closed and inefficient vertical silos that have difficulty in scalingand cause dispersion due to the impossibility to share resources [WTJ+11, UAH+12].Interoperability and standardization are key for general recognition and acceptance ofe-health [SEM13, KN10, CCVMF+07].
On the other hand, the sensing and connectivity capabilities of smartphones and theirpervasiveness in people’s lives make them critical pieces of this IoT and future applica-tions. Besides that, smartphones are less resource constrained than specialized sensors.Although M2M communications have been thoroughly addressed for healthcare applica-tions [Che12, DHJT+10, MPZ+13, FHK14, JMC13], most of the literature for healthcare

1.1 Motivation 3
still focus on Body Area Networks (BANs) of sensors, and do not explore scenarios en-hanced by the use of smartphones. In mobile M2M communications, smartphones arethe natural choice to act as M2M gateways (GWs) [PA14]. They are equipped with wideenvironment and context sensors, as well as with multiple personal, local, and wide areacommunication capabilities, namely Near Field Communication (NFC), Bluetooth (BT),Zigbee is expected in the near future, Wi-Fi, and several cellular technologies. They willlikely be used as sensors themselves and as data relays or proxies for other nearby deviceswith more limited connectivity like health sensors in a personal area network [Che12] ordomotic sensors and actuators in a home automation environment [ZYX+11]. The useof smartphones for transmission of sensing data, their own or relayed, can lead to fasterbattery depletion, undesirable for the users as they use their smartphones mainly for otherpurposes such as phone calls, Short Message Service (SMS), Web browsing, or socialnetworking. Therefore, an assessment of the impact of using smartphones as M2M GWsis called for.
Transmission frequency and data time-requirements can play a key role in the smart-phone’s battery consumption and the number of battery recharges necessary. For the user,it might be desirable to recharge the smartphone only during the night when the smart-phone is no longer needed, which means that the collection, processing and forwarding ofdata should not exceed a certain amount of energy consumption during the day, in orderfor the battery to last at least 12 h, e.g., from 08:00 to 20:00. Several studies have beenconducted on recharge patterns [FDK11, BRC+07, TSLX14, RQZ07]. Battery rechargesare triggered either by the current battery level, or by the context, which includes locationand time of day. Users that recharge battery based on battery levels notice differencesin the recharging cycle of the phones, and tend to be irritated by the increase of energyconsumption [TSLX14]. In [PA14], we observed that different transmissions frequenciescould lead to considerable differences in the battery life. We showed that frequent trans-missions of small size data can have an undesired effect in the expected depletion time ofa smartphone’s battery in mobile M2M communications. Maximizing the collection ofdata necessary to be forwarded from nearby sensors and maximizing the intervals betweentransmissions should be imperative for the use of smartphones as M2M GWs. However,IoT applications have time-requirements that need to be met, and certain transmission fre-quencies might be required. More research is required to devise energy efficient transmis-sion mechanisms that enable the use of smartphones as mobile GWs. Techniques such astransmission scheduling or the concurrent use of technologies leveraging heterogeneousnetworks can enhance smartphones’ capabilities acting as GWs while easing their energyconsumption problems.

4 Introduction
1.2 Research Questions
The paradigm shift introduced by standardized M2M communications and IoT applica-tions as well as the use of smartphones as M2M GWs lead to new research questions.Overall, this work seeks to study and improve the feasibility and the resource usage ef-ficiency in multi-homed smartphones as mobile M2M GWs. The research questions thatwe seek to answer in this work can be formulated as follows:
1. What is the performance of current IoT applications settled in state-of-the-art stan-dards with mobile GWs?
2. What improvements can packet transmission scheduling bring to multi-homed GWsin IoT applications?
3. When are network coding based dynamic techniques beneficial for multi-homedGWs in IoT applications?
First, we focus on the experimental evaluation of an IoT service composition withmobile GWs to analyze the system performance, capabilities, and limitations, speciallyunder volatile environments as experienced when using mobile networks. We need todesign and implement the system and understand what impact does M2M traffic introducein common smartphones as M2M GWs and what Quality of Service (QoS) requirementscan be fulfilled.
To answer the second research question, we first seek to model packet transmissionscheduling in current wireless network interfaces. This includes detailed network in-terface power consumption and latency. We evaluate the performance and the possibleimprovements that different transmission scheduling can bring to multi-homed GWs inIoT applications.
Our last research question seeks to understand if, and under which conditions, networkcoding based dynamic techniques can be a useful technique to provide further efficiencyin multi-homed GWs. For that, we seek to devise an optimization framework that canfully exploit the use of network coding, and we compare the performance of dynamicpolicies with the performance of static ones. We also seek to find efficient ways to explorethe parameter space of the framework and search regions of the highest resource usageefficiency gains.

1.3 Contributions 5
1.3 Contributions
This dissertation focus on resource usage efficiency in IoT applications with mobile GWsexploiting heterogeneous networks or simultaneous communication routes. Our initalresults, presented in Section 2.3.3 and in [PRP+16], show that, although M2M com-munications can increase efficiency when using several IoT applications thanks to theinteroperability of the standardization efforts, smartphones as M2M GW can introduceundesirable battery depletion under certain conditions, becoming unfeasible in terms ofa normal depletion time, and thus additional improvements or techniques are necessaryto achieve longer battery life. On the other hand, as IoT applications provide QoS toguarantee that data meets specific service requirements like deadline, there is a trade-offbetween energy consumption and time.
Real performance of M2M standards with respect to a QoS evaluation in a contextof IoT applications, to the best of our knowledge, is not present in literature. We startby designing and implementing an e-health mobile IoT application, which consists ofseveral M2M entities. We deploy the system and evaluate its performance using a mobilepilot with 10 people during 3 weeks. We quantify overheads introduced by M2M andperform a comprehensive characterization of the E2E latency in wireless environmentsunder mobility. This work have been peer-reviewed and published at:
• [PA14] C. Pereira and A. Aguiar. Towards efficient mobile m2m communications:Survey and open challenges. Sensors 14(10):19582–19608, October 2014;
• [PFB+14] C. Pereira, S. Frade, P. Brandão, R. Correia, and A. Aguiar. Integratingdata and network standards into an interoperable e-health solution. In 2014 IEEE
16th International Conference on e-Health Networking, Applications and Services
(Healthcom), pages 99–104, October 2014;
• [PRP+16] C. Pereira, J. Rodrigues, A. Pinto, P. Rocha, F. Santiago, J. Sousa, andA. Aguiar. Smartphones as m2m gateways in smart cities iot applications. In 2016
23rd International Conference on Telecommunications (ICT), pages 184–190, May2016;
• [PPR+16] C. Pereira, A. Pinto, P. Rocha, F. Santiago, J. Sousa, and A. Aguiar. Iotinteroperability for actuating applications through standardised m2m communica-tions. In 2016 IEEE 17th International Symposium on a World of Wireless, Mobile
and Multimedia Networks (WoWMoM), pages 1–6, June 2016;
6 Introduction
• [PPFA17] C. Pereira, A. Pinto, D. Ferreira, and A. Aguiar. Experimental char-acterization of mobile iot application latency. IEEE Internet of Things Journal,4(4):1082–1094, August 2017.
We model packet transmissions in Linear Programming (LP) to assess what improve-ments could packet transmission scheduling contribute to M2M GWs. We explore themulti-homing capability of current mobile devices and leverage the concurrent use of dif-ferent network interfaces in heterogeneous networks scenarios. This model also allowsto understand the factors that might cause a wireless network to become more competi-tive, or to analyze the impact of modifications in the network interface performance. Bytaking into consideration the knowledge obtained from the model, we design a energy-aware heuristic that simplifies the decision process of packet scheduling and we compareits performance and behavior to the optimal scheduling. We evaluate the performanceand trade-offs of different scheduling schemes with respect to energy consumption andtime-related metrics, namely, packet waiting time, packet slack time, and execution time.A part of this work have been peer-reviewed and published at:
• [PA17b] C. Pereira and A. Aguiar. Modelling and optimisation of packet transmis-sion scheduling in m2m communications. In 2017 IEEE International Conference
on Communications Workshops (ICC Workshops), pages 576–582, May 2017;
and an extended version is currently under revision at:
• [PA17a] C. Pereira and A. Aguiar. Energy-aware scheduling for mobile iot gate-ways on heterogeneous networks. IEEE Internet of Things Journal.
Finally, we research other techniques and mechanisms that can add efficiency. Wedevise a framework that considers network coding as a key technique that simplifies loadallocation across multiple channels and provides high resiliency under time-varying chan-nel conditions. We assess the advantages of resource allocation policies that dynamicallyadapt the fraction of offered load to be transmitted on each interface, and we explorethe parameter space using meta-heuristics to search the operation regions of resource us-age efficiency gains. Thus, finding when network coding based dynamic techniques arebeneficial for multi-homed mobile IoT GWs. This work have been peer-reviewed andpublished at:
• [PAL13] C. Pereira, A. Aguiar, and D.E. Lucani. Dynamic load allocation for multi-homing via coded packets. In 2013 IEEE 77th Vehicular Technology Conference
(VTC Spring), pages 1–5, June 2013;
1.4 Organization 7
• [PAL16] C. Pereira, A. Aguiar, and D. E. Lucani. When are network coding baseddynamic multi-homing techniques beneficial? Computer Networks, 108(C):55–65,October 2016.
In summary, the main contributions of this dissertation are the following:
• C1: Design, implementation and evaluation of an e-health mobile IoT applicationsettled on M2M communications;
• C2: Model, optimization, and evaluation of packet transmissions scheduling in LPto improve smartphone usability as M2M GWs. Design of a heuristic that approxi-mates optimal packet scheduling. Evaluation of the performance of different trans-mission scheduling;
• C3: Devisal of a framework that considers network coding in order to simplify loadallocation across multiple channels. Assessment of the advantages of dynamic re-source allocation policies. Exploration of the parameter space using meta-heuristicsto search the regions of highest resource usage efficiency gains.
1.4 Organization
The remaining of this dissertation is organized as follows. Chapter 2 presents an overviewof IoT and M2M communications. We focus our literature review on wireless and cel-lular networks, ETSI M2M standards, as well as the resource usage efficiency problem,to address the main concerns of this work. The design and evaluation of the mobileIoT application settled on ETSI M2M is presented in Chapter 3. Chapter 4 contains themodeling and heuristic design of packet transmission scheduling. Chapter 5 presents theframework using network coding. Finally, Chapter 6 presents the main conclusions ofthis dissertation, and discusses several research lines that can be pursued in the future.


Chapter 2
IoT and M2M communications
2.1 Services in IoT
Services are a main building block of IoT. Recently, several IoT applications appearedusing M2M as a key enabler to connect devices. Some examples are e-health [FHK14,Che12, ETS13b, KLA+14], intelligent transportation systems [GLPL14, YDWX12], smartgrids [YQST13], smart home [ARA12, KPP14], and smart city [CDBN09]. E-health aimsto monitor and track patients/users by means of sensors, where personal data is collectedand remotely analyzed by medical or processing centers. Intelligent transportation sys-tems, or vehicular telematics, aim for efficiency and safety of the transportation systems.They rely on devices in the vehicle, and the monitoring and security systems. The aimof smart grids is to leverage telemetry and increase the energy efficiency of house andbuildings, while connecting billions of metering devices that collect and monitor the en-ergy consumption, allowing its management. Smart home appliances can be monitoredand actuated upon using smart home services. Heating devices, televisions, etc., can beshut on or off according to the users will. Finally, smart city is a concept from the serviceubiquity to improve the quality of life in the city.
E-health services include, among others, ambient assisted living for aging and in-capacitated individuals [SBMAVJ13, PUt+14], detection of allergies and fatal adversedrug reaction [JBA+10], or children’s health awareness by tracking their daily activi-ties [VBNCNH+12]. Other e-health concept frameworks for collection and interoperationexist [XXC+14, AFBC14, MS10]. In [JZS12, DBN14, MLC14, CdDM+15, YXM+14],GWs are used to interact with personal clinical devices, collecting and transmitting sig-nals. For example, in [YXM+14] an intelligent medicine box (iMedBox) acts as a GW,with several connection possibilities and capable of connecting to various wearable sen-sors. It sends data to a cloud, enabling clinical diagnosis, while the GW itself can analyze
9
10 IoT and M2M communications
and display all collected data.
The combination of smartphones and the ubiquity and availability of cellular networksare driving IoT applications. Mobile phones have acquired powerful capabilities, in termsof connectivity, battery, memory, and processing, and they are becoming an importantplatform for the proliferation of health-related applications [BWTJ11]. Several applica-tions have been proposed for tracking health-related information, e.g., heart rate, bloodpressure, blood oxygen saturation, stress levels, detection of asthma, chronic obstructivepulmonary disease, cystic fibrosis, coughing, allergic rhinitis, nose-related symptoms ofthe respiratory tract, melanoma, and the analysis of wounds in advanced diabetes pa-tients [RIKHK+15], or for encouraging physical activity [CKM+08]. For example, theeCAALYX mobile application [BWTJ11] aims at building remote monitoring for seniorcitizens with multiple chronic diseases. The mobile application acts as intermediary be-tween the wearable health sensors and the healthcare facility’s Internet site by transmittingthe health-related measurements and position, or potential alerts.
Those applications keep using proprietary and closed solutions, neglecting the pos-sible positive effects that standardization could bring to the commercialization of suchapplications. Current services and applications abstract standards, either M2M or health-related. Although some provide E2E interoperation, the lack of using known standardsreduce the possibilities for integration with other systems.
2.2 Challenges in mobile M2M communications
Mobile M2M communications face many technical challenges despite the promising ben-efits in terms of revenue opportunities and cost reductions in maintenance and resources[Hat]. Many challenges are introduced by M2M devices, which are usually constrainedin, among others, energy, bandwidth, or processing and memory capabilities [ZYX+11].The potential booming of M2M applications can exponentially increase the number anddiversity of devices and traffic in the next years, which shall introduce further challengesto communications as it will be necessary to support both legacy and new services anddevices. Traffic volume and pattern envisioned for M2M demands for capacity planning.The superposition of Human-based traffic with M2M traffic can expose network limita-tions in terms of the maximum capacity of network.
Current mobile M2M communications research focuses on performance evaluationand improvement, either in terms of latency or resource usage efficiency. In this section,we survey relevant literature and structure current research areas. Table 2.1 summarizesthe main contributions of the literature presented here.

2.2 Challenges in mobile M2M communications 11
Table 2.1: Summary of survey of literature and challenges.
Contributions Reference
Human-based vs. M2M Communications Lien et al. [LCL11], Laya et al. [LAAZ14]
Technical Challenges Wu et al. [WTJ+11], Zhang et al. [ZYX+11], Chen [Che12], Lien et al. [LCL11]
Requirements Lu et al. [LLL+11], Zhang et al. [ZYX+11], Lien et al. [LCL11]
Applications
HealthcareChen [Che12], Dawson-Haggerty [DHJT+10], Marwat et al. [MPZ+13],
Fan et al. [FHK14], Jung et al. [JMC13], Kartsakli et al. [KLA+14]
Smart city Caragliu et al. [CDBN09]
Smart grids Yan et al. [YQST13]
Smart home Alam et al. [ARA12], Komninos et al. [KPP14]
TelematicsBooysen et al. [BGZR12], Plass et al. [PBH12],
Gerla et al. [GLPL14], Yongfu et al. [YDWX12]
Mobility Booysen et al. [BGZR12], Lee et al. [LCG12], Kellokoski et al. [KKNH12]
Performance Evaluation
Interference Costantino et al. [CBCM12]
QoS provision Marwat et al. [MPZ+13]
Throughput Marwat et al. [MPZ+13]
Channel Access
Access Delay Lien et al. [LLKC12], Gallego et al. [VGAZA13]
Energy Efficiency Gallego et al. [VGAZA13]
Latency Zhou et al. [ZNKB12]
QoS provision Zhang et al. [ZYX+11]
Transmission SchedulingLatency Yunoki et al. [YTL12]
Schemes Power Consumption Paulset et al. [PKN+13]
Data Aggregation
Delay Lo et al. [LLJ13]
Packet Collisions Matamoros et al. [MAH12]
Throughput Lo et al. [LLJ13]
Mobile M2M GW Wu et al. [WTJ+11], Zhang et al.[ZYX+11]
2.2.1 M2M Traffic
It is important to distinguish mobile M2M communications from mobile Human-based(H2H or H2M) communications. Small and infrequent data transmissions will be morecommon in M2M [LCL11, LAAZ14], and thus the knowledge developed for Human-based traffic, which is mostly bursty (web browsing), bulky (file transfer), or constant orvariable bit rate streams (Voice over Internet Protocol (VoIP) or video) can be difficultto apply directly to M2M. Laya et al. [LAAZ14] mention that M2M and Human-basedtraffic differ further in traffic direction, since M2M traffic direction will be mainly uplink,while Human-based traffic is either balanced or mainly downlink. M2M applications willbe duty-cycled and should have very short connection delay to guarantee fast access tothe network when waken up, while Human-based applications tolerate longer connec-tion delays but are very demanding once connections are established [LAAZ14]. M2Mapplications might require very high priority with a detailed level of granularity due to

12 IoT and M2M communications
the transmission of critical information, whereas priority for Human-based applications ismainly among applications for each user and not between different users [LAAZ14]. Fi-nally, M2M will have higher number of devices and may be required to operate for yearsor decades without maintenance, but users can recharge/replace batteries [LAAZ14].
2.2.2 M2M Support in Wireless Networks
M2M devices using radio technologies will face well-known problems from wireless andcellular networks. Potential issues on the air interface including channel interference,channel quality fluctuation, and noise will be very common due to the multitude of de-vices and the characteristics of M2M traffic [ZYX+11, LCL11], and they can introducecoordination problems in the medium access. According to Lu et al. [LLL+11], relia-bility is critical for general acceptance of M2M, since unreliable processing, sensing, ortransmission leads to false or lost data, and ultimately to M2M communications’ fail-ure from the user’s perspective. Although E2E service reliability is being addressed bystandardization efforts, it is still a challenge.
As the number of devices competing for the same channel increases, the number ofsimultaneous accesses will increase, and packet collisions, and signal interference in gen-eral, will be more common and result in more packet/data loss. Optimizing the uplinkchannel access and radio resource allocation is a way to achieve further improvementin performance and resource usage efficiency, avoiding constant transmission deferralsoriginated from the packet collision avoidance mechanisms and data loss originated frompacket collisions, or providing general QoS guarantees. Gallego et al. [VGAZA13] in-troduce contention-based Medium Access Control (MAC) protocols for sensor-to-GWcommunications in wireless M2M, and analyze them in terms of latency and energy ef-ficiency. The authors consider an M2M wireless network composed of a large numberof devices that periodically wake up their radio interfaces to transmit data to a coordina-tor, that is, to a GW. Zhang et al. [ZYX+11] propose a joint rate and admission controlscheme for QoS provision in M2M communications, using an Institute of Electrical andElectronics Engineers (IEEE) 802.11 network, by exploiting heterogeneous networks andaccurate predictions of QoS. Wireless networks usually use solely collision avoidancemechanisms, which introduce well-known problems, such as the hidden node problemor the exposed node problem, that other networks do not face, such as cellular networks.Further work needs to be carried using wireless networks in order to take advantage ofthe high data rate and low latency common in those networks.
Techniques that efficiently aggregate the data to be transmitted can be explored to fur-ther optimize bandwidth utilization and energy consumption in M2M communications.

2.2 Challenges in mobile M2M communications 13
Two data aggregation schemes based on the Karhunen-Loève transform for M2M in awireless network are proposed by Matamoros et al. [MAH12]. Their system includesseveral sensors, one GW, and one application server. The sensors transmit the data tothe GW, which transmits all the data to the application server. While GW-to-applicationserver communications use a reservation-based MAC protocol, the sensor-to-GW com-munications use a contention-based MAC scheme and, thus, packet collisions may occur.They determine the optimal duration of the sensor-to-GW and GW-to-server transmissionphases, in such a way that the best trade-off between the number of packet collisions andcompression level from data aggregation is attained.
2.2.3 M2M Support in Cellular Networks
Nowadays, cellular networks offer wide coverage areas, high data rate, and decreasinglatency. Therefore, they are a key enabler of M2M communications. The challengesassociated with mass-scale M2M networks can be resumed to the multitude and diversityof devices, the scalable connectivity, and supporting of both legacy and new services anddevices [WTJ+11]. Marwat et al. [MPZ+13] argue that, even in the presence of regularLong Term Evolution (LTE) traffic, mobile M2M traffic cannot be considered negligible,and it can have a dramatic impact on the LTE network performance in terms of QoS andthroughput.
Costantino et al. [CBCM12] evaluate the performance of an LTE GW using the Con-strained Application Protocol (CoAP) and representative M2M traffic patterns and net-work configurations through simulations. The authors argue that traffic patterns dependvery much on the single application considered, and, therefore, do not describe or jus-tify their choices. The scenario consists of a single LTE cell where the evolved NodeB(eNB), the only mandatory node in the radio access network (RAN), serves one LTEM2M GW and a variable number of terminals with traditional Internet traffic, called H2HUser Equipments (UEs). The LTE M2M GW, in turn, serves a variable number of smartobjects. The results showed that LTE is sensitive to both intra-UE and inter-UE signal in-terference, which results in a high latency or packet loss when the number of smart objectsserved is greater than a few tens or the cell throughput approaches its limits. Tesanovicet al. [TBCO12] describe algorithms for device management to mitigate interference anddevice co-existence in LTE.
Similar to wireless networks, M2M communications for cellular networks can benefitfrom improvements on channel access or by introducing data aggregation techniques. Acontention based uplink channel access for M2M in an LTE network is proposed by Zhouet al. [ZNKB12]. With contention based access, UEs select resources randomly without
14 IoT and M2M communications
indications from eNB, which saves signaling overhead and, hence, latency is reduced.Simulation results showed that a network coordinated random access stabilization schemeused to control the expected number of simultaneous access to a common random accesschannel (RACH) can effectively improve the access delay in LTE-Advanced [LLKC12].
Lo et al. [LLJ13] study the impact of data aggregation in M2M on throughput andpacket waiting delay in a cellular network. They motivate the use of an M2M relay asan M2M data aggregator to improve uplink transmission efficiency in LTE-Advanced dueits overheads. They propose a tunnel-based aggregation scheme in which only M2M dataunits destined to the same tunnel exit point are aggregated at the tunnel’s entry point, ac-cording to priority classes. The results show a significant reduction in protocol overheads.Furthermore, the results show that aggregation, as expected, increases the delay per unit inthe delivery, but the global delay can rapidly decrease with the increase of M2M devices.
Transmission scheduling schemes can be introduced in mobile M2M communica-tions to reduce latency or to achieve higher energy consumption efficiency. Yunoki et
al. [YTL12] achieves a latency reduction in a remote monitoring system by using a trans-mission scheduling scheme used in an Evolution-Data Optimized (EVDO) and in a Wide-band Code Division Multiple Access (W-CDMA) networks. They achieve a probabilityof sensor status not reaching a monitoring center within a latency of 6 s lower than 10−6
compared to the probability of 10−4 for a best-effort effort scheme. This transmissionscheduling scheme achieved more than 85% of average throughput compared to the best-effort scheme for the W-CDMA network, while having a similar performance for theEVDO network.
Pauls et al. [PKN+13] study the viability of using the General Packet Radio Service(GPRS) for a low data rate long-lasting battery powered operation of M2M devices. Theauthors evaluate optimization of data transmission procedures to reduce the power con-sumption of GPRS connections, for transmitting small size and latency tolerant user data.For applications that require frequent transmissions, it is better that the devices are alwaysturned on, but, for applications that do not require frequent transmissions, dramatic sav-ings in power consumption (93%) can be obtained if the devices are turned off during theperiods that do not transmit.
2.2.4 Energy Efficiency
Resource usage efficiency is one of the most important requirements for mobile M2Mcommunications when using radio technologies, due to lower available bandwidth, higherlink failure, and higher energy consumption. The amount of devices and the requisitethat they might have to operate for many years with the same battery, or consuming the

2.2 Challenges in mobile M2M communications 15
least possible energy, demands for energy efficiency in M2M communications [LLL+11,ZYX+11]. Lu et al. [LLL+11] argue that M2M communications cannot be widely ac-cepted as a promising communication technology, if energy efficiency is not met.
The concept of using a mobile M2M GW device as an intermediary node to collectand process data from neighbouring sensors is approached by Wu et al. [WTJ+11], whoname it a smart M2M device, and Zhang et al. [ZYX+11], who name it a cognitive GW.Both works argue that connecting devices through a GW should be preferred when theyare sensitive to cost or power. The use of M2M GWs shall have a direct impact in thereduction of devices accessing and using the channels for communications, reducing in-terference and contention, and increasing the efficiency. Reducing the number of devicesin networks also translates into easier to deploy and less complex transmission schedulingschemes, and eases the problem of the depletion of the pool of unallocated IP addresses.
New applications and business opportunities will come along with mobile M2M com-munications. For example, the innovative idea of using the already existing scheduledairliners as relays between ground devices and satellites, providing a new and comple-mentary M2M infrastructure, is presented in [PBH12]. Mobile M2M devices in airplanescan act as M2M GWs by forwarding data received from M2M ground terminals to satel-lites, and vice versa. With this approach, there is no need for M2M terminals in satellitesto have a very powerful amplifier or large dish antennas to send or receive messages, and,thus, the operational costs should be lower. Furthermore, this solution addresses the chal-lenge of connectivity, eventually relieving traffic from cellular networks. However, oneshould expect important challenges originated from transmission scheduling and mobility.
2.2.5 Device Mobility, Autonomy, and Security
Devices that are able to connect to multiple different networks will have, nevertheless,significant signaling traffic overheads for vertical handovers. Furthermore, devices invehicles might face constant vertical handovers originated from the vehicles’ mobility.Discussion on the necessity of improving vertical handovers in M2M communicationsare presented in [LCG12]. Kellokoski et al. [KKNH12] propose an energy efficient algo-rithm for vertical handovers between an IEEE 802.11 and a 3rd Generation PartnershipProject (3GPP) network for M2M communications. The connectivity and cross-platformnetworking originated from the vehicles’ mobility and positional distribution should alsobe a concern.
M2M communications should operate seamlessly without human intervention, andtherefore self-configuration, self-management, and self-healing are important challenges[ZYX+11]. Envisioned applications for mobile M2M communications require autono-

16 IoT and M2M communications
mous data collection and aggregation, transmission and distribution of aggregated data,and storing and reporting of information [BGZR12]. Further, the total absence of, orlimited, human intervention in many M2M applications can occasion physical attacksfrom malicious attackers, disrupting communications. Security for M2M communica-tions is discussed in [BGZR12, LLL+11, WTJ+11]. Security is a major aspect for, as anexample, vehicular collision-avoidance applications [BGZR12] or for healthcare applica-tions [Che12].
2.2.6 M2M Application Protocols
M2M application protocols take a fundamental role in communication efficiency: proto-col overheads, necessary number of management/control and information messages, reli-ability, security, etc., all impact the number and size of transmissions and, consequently,the energy consumption and bandwidth utilization in a mobile device.
The technical plenaries of the oneM2M Partnership Project [onea, onec] came to anagreement to take into account CoAP, Hypertext Transfer Protocol (HTTP), and MessageQueuing Telemetry Transport (MQTT) for communications, strengthening the idea thatthese protocols are the de facto protocols for mobile M2M communications. In the fol-lowing sub-sections, we describe CoAP [SHB] and MQTT [MQTa]. We do not reviewHTTP due to the vast literature already available [TGS+02, Won00, Tho01]. Althoughthere are other application protocols that can be used for M2M, such as the AdvancedMessage Queuing Protocol (AMQP) [AMQ], or the Extensible Messaging and PresenceProtocol (XMPP) [Fou], CoAP and MQTT specifically target constrained networks anddevices, relying in an effective reduction of protocol overheads.
2.2.6.1 HTTP and CoAP
CoAP is a lightweight protocol that complies with the Representational State Transfer(REST) paradigm [SHB], and is designed for the use in constrained networks and nodesin M2M applications. REST is described with more detail in Section 2.3. In RESTarchitectures, as in HTTP, clients perform operations on resources stored at a server bymeans of request and responses exchanges. There are four types of requests for the clients:
• GET - gets/retrieves the content of an existing resource;• POST - creates a new resource;• PUT - changes/updates the content of an existing resource;• DELETE - deletes/removes an existing resource.
2.2 Challenges in mobile M2M communications 17
An Uniform Resource Identifier (URI) is used to identify resources, as in HTTP. CoAPeasily translates to HTTP for integration with the Web, while accomplishing specializedrequirements such as multicast support, built-in resource discovery, block-wise transfer,observation, and simplicity for constrained environments. CoAP also supports asyn-chronous transaction support. Like in HTTP, the clients do not need to maintain state,i.e., clients can be stateless [SHB].
CoAP is conceptually separated into two sub layers: a messaging layer that providesasynchronous messaging services over datagram transport, and a request-response layerthat provides handling and tracking of requests and responses exchanged between a clientand service side application endpoints. The request-response layer provides direct sup-port for web services. The CoAP request-response semantics are carried in CoAP mes-sages, and a token is used to match responses to requests independently of the underlyingmessages. Every response message can be returned within an ACK message, that is,piggybacked.
CoAP also supports asynchronous responses, for the cases when the service sideknows that it will take long to answer a request. If a client knows at start that an asyn-chronous response is expected or tolerated, then it includes a Token Option in the message.If the service side knows it might need a longer time to fulfill a request from a client, thenit might ask for the client to add a Token option again to that message.
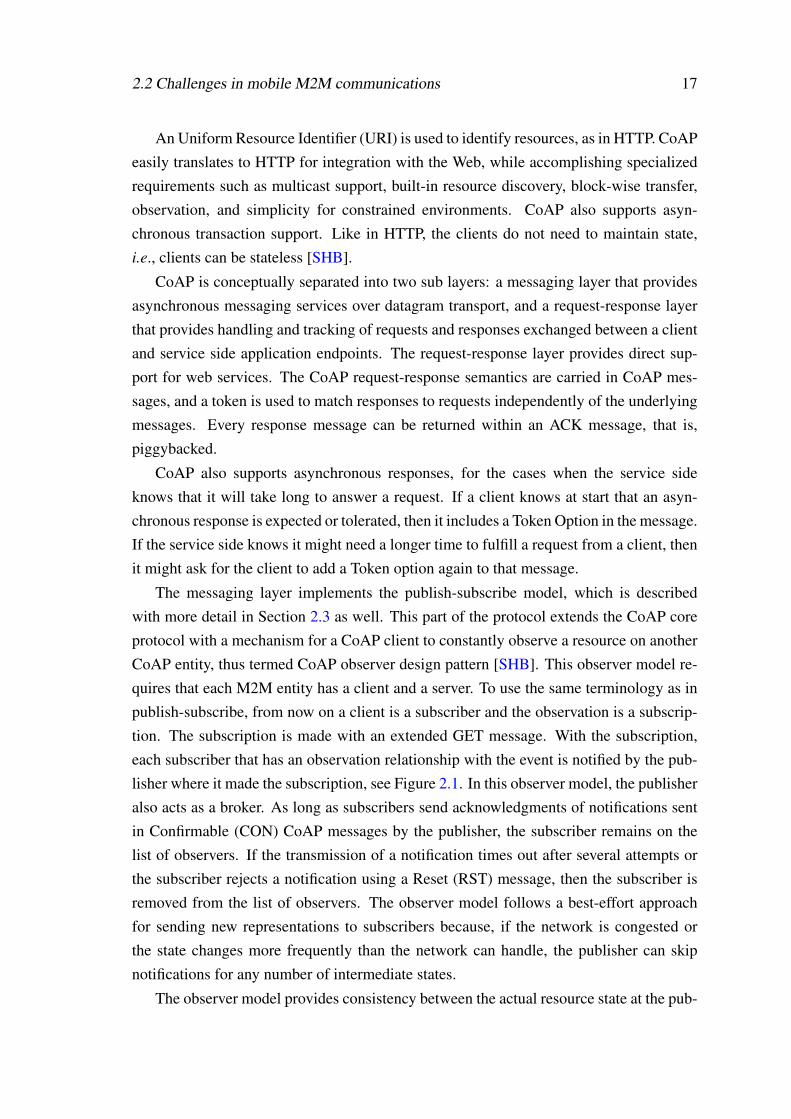
The messaging layer implements the publish-subscribe model, which is describedwith more detail in Section 2.3 as well. This part of the protocol extends the CoAP coreprotocol with a mechanism for a CoAP client to constantly observe a resource on anotherCoAP entity, thus termed CoAP observer design pattern [SHB]. This observer model re-quires that each M2M entity has a client and a server. To use the same terminology as inpublish-subscribe, from now on a client is a subscriber and the observation is a subscrip-tion. The subscription is made with an extended GET message. With the subscription,each subscriber that has an observation relationship with the event is notified by the pub-lisher where it made the subscription, see Figure 2.1. In this observer model, the publisheralso acts as a broker. As long as subscribers send acknowledgments of notifications sentin Confirmable (CON) CoAP messages by the publisher, the subscriber remains on thelist of observers. If the transmission of a notification times out after several attempts orthe subscriber rejects a notification using a Reset (RST) message, then the subscriber isremoved from the list of observers. The observer model follows a best-effort approachfor sending new representations to subscribers because, if the network is congested orthe state changes more frequently than the network can handle, the publisher can skipnotifications for any number of intermediate states.
The observer model provides consistency between the actual resource state at the pub-
18 IoT and M2M communications
Publisher
Subscription
Notification
Subscriber
Notification
Notification
Notification
Figure 2.1: CoAP observer design pattern.
lisher and the state observed by each subscriber, thus keeping the architectural propertiesof REST. Resource discovery is performed by sending a Confirmable GET request to theresource "well-known/core" at the server.
In order to make CoAP suitable for constrained devices (energy consumption, band-width, memory, and processing restrictions), the User Datagram Protocol (UDP) is thepreferred transport protocol due to less protocol overheads than the Transmission ControlProtocol (TCP), and CoAP’s header can be reduced to 4 Byte. CoAP provides two typesof application reliability to the delivery of publish messages: a CON message, where themessage is retransmitted if no delivery acknowledgement was received, using a simplestop-and-wait retransmission reliability with exponential back-off for congestion control;and a Non-Confirmable (NON) message, where there is no need to acknowledge the mes-sage. There is also a duplicate detection for both Confirmable and Non-Confirmablemessages. There are two additional types of messages: Acknowledgment (ACK) or RSTmessages. The ACK message is used to acknowledge CON messages, and the RST mes-sage either notifies the other endpoint that a CON message was received but some contextis missing, or it is used to cancel subscriptions.
Since UDP is used, the use of multicast IP destination addresses is supported, and canbe useful in case of notifications. Security can be implemented by the Internet ProtocolSecurity (IPsec) or Datagram Transport Layer Security (DTLS), although the last optionshall be preferred. According to [SHB], DTLS will introduce at most 13 Byte overheadper packet, not including initialization procedures. Recent work identified this as a poten-tial problem and there is a proposal for reducing the packet size overheads of DTLS bymeans of 6LoWPAN header compression saving at least 14% [RSH+13].
According to Davis et al. [DCD13], CoAP enables high scalability and efficiencythrough a more complex architecture which supports the use of caches and intermediaries(proxies), similarly to HTTP. The protocol supports the caching of responses in order to

2.2 Challenges in mobile M2M communications 19
efficiently fulfill requests. This caching can be provided by a node in an endpoint or anintermediary. Another important mechanism in the protocol is the proxy functionality.Proxying is useful in constrained networks to improve performance or network trafficlimiting, since, for example, proxies are not as limited, in bandwidth or battery, as othernodes. A GW is considered to be a form of proxy or intermediary.
2.2.6.2 MQTT
MQTT, developed by IBM, is a lightweight broker-based publish-subscribe messagingprotocol designed to be open, simple, lightweight, and easy to implement [MQTa]. Theauthors claim that MQTT’s characteristics make it ideal for use in constrained environ-ments, where, for example, the network is expensive, has low bandwidth or is unreli-able, or when it runs on embedded devices with limited processing or memory capacities.MQTT does not comply with REST.
MQTT is an asynchronous protocol. Some MQTT messages contain a variable header,present after the fixed header and before the payload, that contains, for instance, the pro-tocol name, the protocol version, and flags. There are 14 different message types definedin MQTT, including CONNECT, PUBLISH, SUBSCRIBE, UNSUBSCRIBE, DISCON-NECT, and PINGREQ and PINGRESP. Several of these messages have dedicated ac-knowledgement messages. For example, if an MQTT subscriber wants to subscribe toa topic, the subscriber sends a SUBSCRIBE message, and waits for the correspondentSUBACK response from the broker (server).
Even though the use of MQTT implies the use of a reliable connection oriented trans-port protocol, like TCP, MQTT supports three types of application reliability to the deliv-ery of publish messages:
• Level 2 - deliver message exactly once, which guarantees that messages arrive ex-actly once;• Level 1 - deliver message at least once, which guarantees that messages arrive, but
duplicates may occur;• Level 0 - deliver message at most once, where messages arrive according to the
best efforts of the underlying TCP/IP network, which means that message loss orduplication, introduced by software or other causes, can occur.
These options are selected in the QoS flag present in the header of each MQTT mes-sage.
The protocol has a small header whose fixed-length is just 2 Byte, and protocol ex-changes are minimized to reduce network traffic. The standard does not specify securitymechanisms and, therefore, IPsec or TLS can be used.
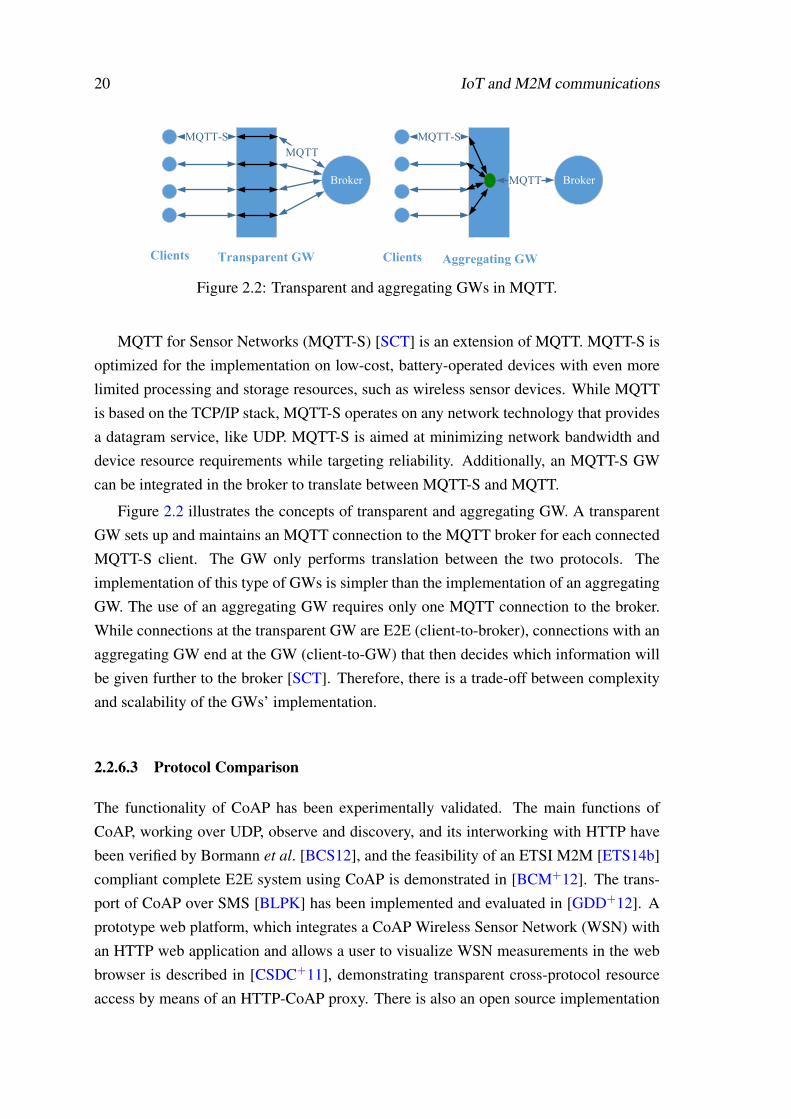
20 IoT and M2M communications
Broker
MQTT-SMQTT
Broker
MQTT-S
MQTT
Clients Transparent GW Aggregating GWClients
Figure 2.2: Transparent and aggregating GWs in MQTT.
MQTT for Sensor Networks (MQTT-S) [SCT] is an extension of MQTT. MQTT-S isoptimized for the implementation on low-cost, battery-operated devices with even morelimited processing and storage resources, such as wireless sensor devices. While MQTTis based on the TCP/IP stack, MQTT-S operates on any network technology that providesa datagram service, like UDP. MQTT-S is aimed at minimizing network bandwidth anddevice resource requirements while targeting reliability. Additionally, an MQTT-S GWcan be integrated in the broker to translate between MQTT-S and MQTT.
Figure 2.2 illustrates the concepts of transparent and aggregating GW. A transparentGW sets up and maintains an MQTT connection to the MQTT broker for each connectedMQTT-S client. The GW only performs translation between the two protocols. Theimplementation of this type of GWs is simpler than the implementation of an aggregatingGW. The use of an aggregating GW requires only one MQTT connection to the broker.While connections at the transparent GW are E2E (client-to-broker), connections with anaggregating GW end at the GW (client-to-GW) that then decides which information willbe given further to the broker [SCT]. Therefore, there is a trade-off between complexityand scalability of the GWs’ implementation.
2.2.6.3 Protocol Comparison
The functionality of CoAP has been experimentally validated. The main functions ofCoAP, working over UDP, observe and discovery, and its interworking with HTTP havebeen verified by Bormann et al. [BCS12], and the feasibility of an ETSI M2M [ETS14b]compliant complete E2E system using CoAP is demonstrated in [BCM+12]. The trans-port of CoAP over SMS [BLPK] has been implemented and evaluated in [GDD+12]. Aprototype web platform, which integrates a CoAP Wireless Sensor Network (WSN) withan HTTP web application and allows a user to visualize WSN measurements in the webbrowser is described in [CSDC+11], demonstrating transparent cross-protocol resourceaccess by means of an HTTP-CoAP proxy. There is also an open source implementation

2.2 Challenges in mobile M2M communications 21
of CoAP written in C often used in the literature [BB13, KBP+11] named Libcoap [Ber],and one written in Java named Californium [Ecl].
There are two open source MQTT implementations commonly used in experimentalvalidations, Mosquitto [Mos] and Paho [MQTb]. The original developers of MQTT-S im-plemented an MQTT-S client and GW and validated them experimentally, having severaldevices forward packets received from a wireless network to a GW [HTSC08]. Apartfrom small limitations referred in the paper, the GW was considered to be fully func-tional. However, further testing with larger number of devices is necessary to evaluate theprotocol performance.
Table 2.2 provides a comparison of the main features of CoAP and MQTT. AlthoughCoAP’s header is twice as large as MQTT’s header, both can be considered very smallwhen compared to application protocols not specific to constrained devices, such as HTTP.The transport layer protocol is a decisive feature in the performance of each protocol. Anexperimental comparison between CoAP running over UDP and MQTT running overTCP, using libcoap and mosquitto implementations, respectively, is provided in [BB13].As expected, due to inherent transport layer overheads, they concluded that MQTT con-sumes higher bandwidth than CoAP for transferring the same payload under same net-work conditions. From these results, we expect MQTT-S to provide a similar performanceto CoAP since it also uses UDP, but this comparison has not been performed so far.
CoAP over UDP has also been compared with HTTP over TCP and UDP. The resultsshowed that UDP based protocols perform better for constrained networks (both CoAPand HTTP) than TCP based protocols, due to using lower number of messages when re-trieving resources [KBP+11]. However, it is preferred to use CoAP over UDP rather thanHTTP over UDP, since the first provides reliability mechanisms. For a fair comparison ofapplication protocols, they should use the same transport protocol, same communicationmodel (in this case, publish-subscribe), and similar parameter values whenever possible.Such performance evaluations have not been made available so far in M2M contexts.
A further difference between CoAP and MQTT is their application reliability: CoAPprovides two levels of application reliability, correspondent to Level 0 and Level 1 inMQTT/MQTT-S, which have yet another one, Level 2. The reliability mechanisms ofboth protocols employ a fixed re-transmission time-out. This parameter has a direct im-pact on protocol performance, namely packet delivery ratio and duplicated publicationswhen using Level 0 or Level 1 of both protocols. The increase of re-transmission time-out leads to higher packet delivery ratio, and the effect is more visible as the number ofpublisher nodes increase. Still, overall and for similar configurations, CoAP achievedbetter packet delivery ratio than MQTT-S in Omnet++ simulations, mainly due to dif-ferences in the publication discipline [DCD13]. CoAP’s non-persistent publication disci-
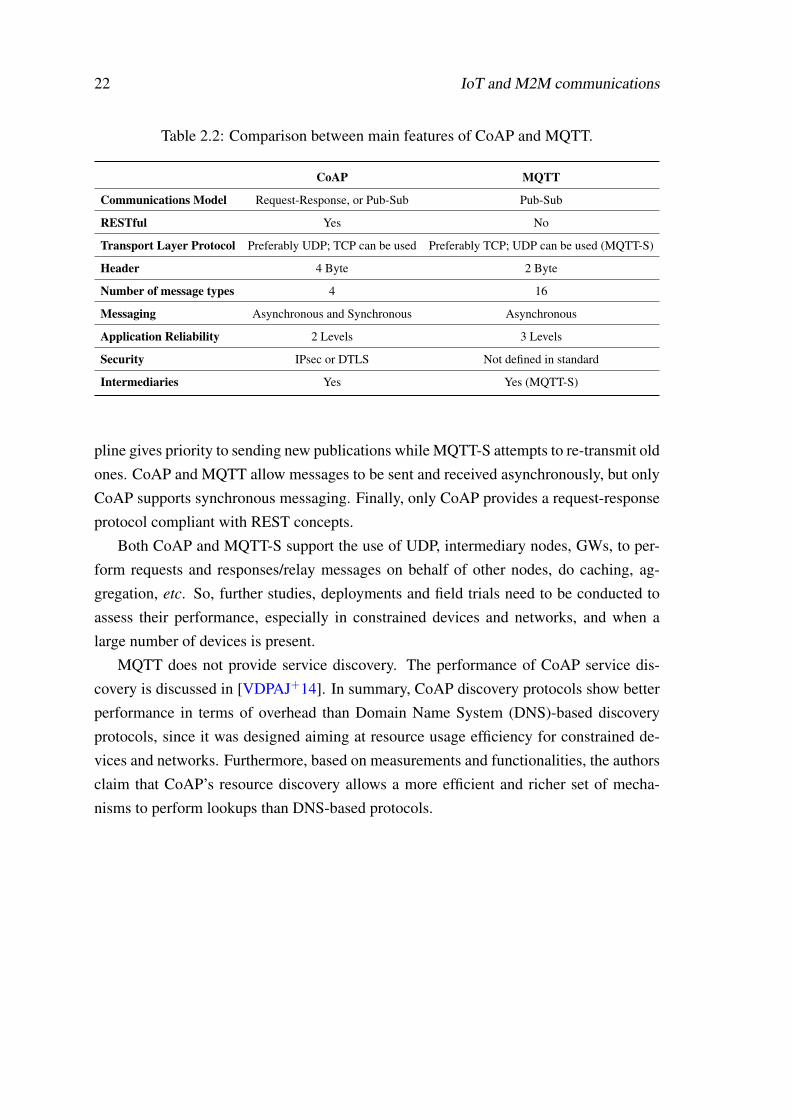
22 IoT and M2M communications
Table 2.2: Comparison between main features of CoAP and MQTT.
CoAP MQTT
Communications Model Request-Response, or Pub-Sub Pub-Sub
RESTful Yes No
Transport Layer Protocol Preferably UDP; TCP can be used Preferably TCP; UDP can be used (MQTT-S)
Header 4 Byte 2 Byte
Number of message types 4 16
Messaging Asynchronous and Synchronous Asynchronous
Application Reliability 2 Levels 3 Levels
Security IPsec or DTLS Not defined in standard
Intermediaries Yes Yes (MQTT-S)
pline gives priority to sending new publications while MQTT-S attempts to re-transmit oldones. CoAP and MQTT allow messages to be sent and received asynchronously, but onlyCoAP supports synchronous messaging. Finally, only CoAP provides a request-responseprotocol compliant with REST concepts.
Both CoAP and MQTT-S support the use of UDP, intermediary nodes, GWs, to per-form requests and responses/relay messages on behalf of other nodes, do caching, ag-gregation, etc. So, further studies, deployments and field trials need to be conducted toassess their performance, especially in constrained devices and networks, and when alarge number of devices is present.
MQTT does not provide service discovery. The performance of CoAP service dis-covery is discussed in [VDPAJ+14]. In summary, CoAP discovery protocols show betterperformance in terms of overhead than Domain Name System (DNS)-based discoveryprotocols, since it was designed aiming at resource usage efficiency for constrained de-vices and networks. Furthermore, based on measurements and functionalities, the authorsclaim that CoAP’s resource discovery allows a more efficient and richer set of mecha-nisms to perform lookups than DNS-based protocols.

2.3 Interoperable M2M 23
2.3 Interoperable M2M
Several M2M solutions have been developed to serve a specific business application,which resulted in a dispersion of the technical solutions [oT13, ETS10]. As a conse-quence, current M2M markets are highly segmented and often rely on proprietary solu-tions. But for M2M communications meet the expectations of new business and revenueopportunities while reducing maintenance and resource costs [Hat], future M2M marketsneed to be based on industry standards to achieve explosive growth [WTJ+11]. Additionaldeployment obstacles include lack of market awareness, technology complexity, initialdeployment cost, operator complexity, and operator return on investment concerns [Hat].
To enable interoperability between M2M services and networks, ETSI established in2009 a Technical Committee (TC) focusing on M2M Service level. There are two otherreference architectures for M2M: the 3GPP - Machine Type Communications (MTC) andIEEE 802.16p M2M, focus in enhancing access and core networks, respectively. Thesetwo architectures are complementary to ETSI M2M, and therefore it is possible to com-bine ETSI M2M architecture with either, resulting in a cellular-centric M2M service ar-chitecture [LLJ13]. To avoid worldwide market fragmentation and reduce standardizationoverlap, the oneM2M Partnership Project [oned] was created in July 2012 to develop oneglobally agreed upon M2M specification, initially focusing on consolidating M2M Ser-vice Layer standard activities into oneM2M [oneb]. Most of its current specifications arebased on the ETSI M2M Service Layer, therefore we focus on ETSI M2M.
At the end of this section, we show how ETSI M2M envisioned interoperability canfavor smartphones’ battery depletion in a context of IoT.
2.3.1 ETSI M2M Architecure
The ETSI M2M architecture is currently the reference architecture for global, E2E, M2Mservice level communications, and is being adopted by main European telcos. ETSI de-veloped and defined a set of standards for M2M communication middleware where itdefines entities and functions to enable the deployment of interoperable IoT applications,agnostic of the underlying networks and technologies and provide efficient E2E deliveryof M2M services [ETS13e]. Transparency and interoperability are attained by sharingcommon network resources and building blocks, claiming at the same time to simplifydevelopment and deployment. The system architecture is based on current network andapplication domain standards, and it is extended with M2M Applications and genericService Capabilities Layers (SCLs). SCLs are Service Capabilities (SCs) on the Networkdomain, M2M Device, or M2M GW. SCs are functions shared by all entities in the M2M

24 IoT and M2M communications
Figure 2.3: ETSI M2M high level system overview. There are two domains: Device andGateway Domain and Network Domain.
ecosystem, and communications are made using defined reference points (interfaces). Thefunctions include: communication management, application management, service and de-vice discovery and registration, device management, data processing, security, etc.
Figure 2.3 shows the high level ETSI M2M system architecture as defined in ETSITechnical Standard (TS) 689 [ETS13d]. The key entities in M2M are [ETS13a]:
• M2M Device: a device that runs application(s) using M2M capabilities and networkdomain functions;• M2M GW: guarantees M2M devices interconnection to the network and their inter-
operability;• M2M Applications: applications that run the service logic and use Service Capa-
bilities accessible via reference points;• M2M Area Network: provides connectivity between M2M devices, compliant and
non-compliant with ETSI M2M, and ETSI M2M GWs;• M2M Network and Application Domain: provides connectivity between the M2M
GWs and M2M applications;• M2M Network Applications: applications, in the Network and Applications do-
main, that run the service logic and use Service Capabilities accessible via openinterfaces.
The Network and Application Domain is formed by the Access Network, the Trans-port Network, and the M2M Core. The Access Network provides connectivity between
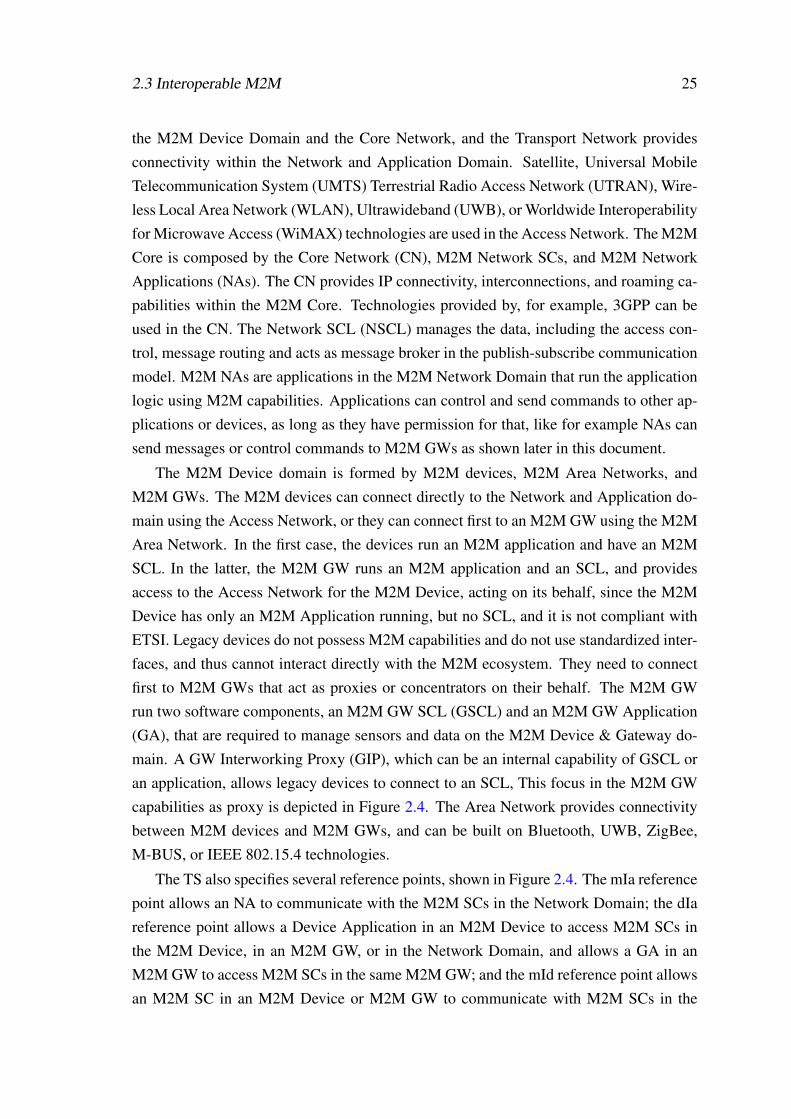
2.3 Interoperable M2M 25
the M2M Device Domain and the Core Network, and the Transport Network providesconnectivity within the Network and Application Domain. Satellite, Universal MobileTelecommunication System (UMTS) Terrestrial Radio Access Network (UTRAN), Wire-less Local Area Network (WLAN), Ultrawideband (UWB), or Worldwide Interoperabilityfor Microwave Access (WiMAX) technologies are used in the Access Network. The M2MCore is composed by the Core Network (CN), M2M Network SCs, and M2M NetworkApplications (NAs). The CN provides IP connectivity, interconnections, and roaming ca-pabilities within the M2M Core. Technologies provided by, for example, 3GPP can beused in the CN. The Network SCL (NSCL) manages the data, including the access con-trol, message routing and acts as message broker in the publish-subscribe communicationmodel. M2M NAs are applications in the M2M Network Domain that run the applicationlogic using M2M capabilities. Applications can control and send commands to other ap-plications or devices, as long as they have permission for that, like for example NAs cansend messages or control commands to M2M GWs as shown later in this document.
The M2M Device domain is formed by M2M devices, M2M Area Networks, andM2M GWs. The M2M devices can connect directly to the Network and Application do-main using the Access Network, or they can connect first to an M2M GW using the M2MArea Network. In the first case, the devices run an M2M application and have an M2MSCL. In the latter, the M2M GW runs an M2M application and an SCL, and providesaccess to the Access Network for the M2M Device, acting on its behalf, since the M2MDevice has only an M2M Application running, but no SCL, and it is not compliant withETSI. Legacy devices do not possess M2M capabilities and do not use standardized inter-faces, and thus cannot interact directly with the M2M ecosystem. They need to connectfirst to M2M GWs that act as proxies or concentrators on their behalf. The M2M GWrun two software components, an M2M GW SCL (GSCL) and an M2M GW Application(GA), that are required to manage sensors and data on the M2M Device & Gateway do-main. A GW Interworking Proxy (GIP), which can be an internal capability of GSCL oran application, allows legacy devices to connect to an SCL, This focus in the M2M GWcapabilities as proxy is depicted in Figure 2.4. The Area Network provides connectivitybetween M2M devices and M2M GWs, and can be built on Bluetooth, UWB, ZigBee,M-BUS, or IEEE 802.15.4 technologies.
The TS also specifies several reference points, shown in Figure 2.4. The mIa referencepoint allows an NA to communicate with the M2M SCs in the Network Domain; the dIareference point allows a Device Application in an M2M Device to access M2M SCs inthe M2M Device, in an M2M GW, or in the Network Domain, and allows a GA in anM2M GW to access M2M SCs in the same M2M GW; and the mId reference point allowsan M2M SC in an M2M Device or M2M GW to communicate with M2M SCs in the

26 IoT and M2M communications
Figure 2.4: ETSI M2M ecosystem with focus on reference points and on M2M GW asproxy/concentrator for legacy devices. Reference points (mIa, dIa, mId) are used forcommunication between M2M compliant devices. Legacy devices and any other devicesthat are not compliant are exposed to the system by Internetworking Proxies.
Network Domain.
The M2M Management functions are all the functions required to manage M2M Ap-plications and M2M SCs in the Network and Applications Domain, and the NetworkManagement functions are all the functions required to manage the access, core, and trans-port networks [BCM+12]. The management functions include performance management,configuration management, fault management and software and firmware upgrading man-agement. M2M Application life cycle management includes installing, removing, andupgrading applications in an M2M Device or GW. M2M service management includesconfiguration management for the M2M SCs in the M2M Device or GW. M2M AreaNetwork management includes configuration management for the M2M Area Networks.M2M Device management includes the configuration management of the M2M Deviceor GW.
2.3.2 ETSI M2M Communication Models and Paradigms
We discuss here the underlying communication models envisioned for M2M applicationsand the RESTful and publish-subscribe paradigms.
Communication among M2M entities can be categorized in two patterns: event- andpolling-based [oTAIA13]. Polling-based M2M communications follow a request-responsecommunication model. M2M Devices or Applications send requests for specific data, e.g.,to actively sample measurements values. Event-based communications are triggered bythe occurrence of a particular event, like, for example, the change in value of a variable.

2.3 Interoperable M2M 27
M2M Devices or Applications send data to other entities spontaneously, i.e., not in re-sponse to a specific request. This pattern is more adequate to M2M application scenariosthat require timeliness of reaction upon the occurrence of an event of interest, but can alsobe used in other scenarios.
Event-based communication causes fewer message transmissions, as there are no ex-plicit requests of information. This message reduction can be of extreme importancewhen networks and devices are constrained. For example, a service constantly polling amobile device, like a smartphone and nearby sensors (M2M Devices), about the activitylevel of an individual can cause unnecessary energy (and bandwidth) consumption for allthe unnecessary requests while there is no new value to be reported. A better approach interms of resource usage efficiency is to use event-based communications, in which onlynew activity level values originate message exchange.
ETSI adopts a RESTful architecture style to organize how M2M entities communi-cate with each other [ETS13e]. REST is a client-server based architectural style createdby Roy T. Fielding in 2000 [Fie00]. REST allows contents changing over time. The mainconcepts in REST are the stateless interactions between clients and servers to manipulatedata, and the notion that a distributed application is composed of resources, that each hasa particular state, and that each is uniquely addressable using a URI. Stateless interactionsprecludes that every request from a client to a server must contain all of the informationnecessary for the server to understand the request, and the server cannot use any previ-ously stored context [Fie00]. Stateless communications induce properties of reliabilityand scalability, since every request can be treated independently. However, statelessnessrequirement for client-server interactions of REST can be intolerable for constrained wire-less devices and networks in mobile M2M communications, either in network bandwidthor energy consumption, due to the required amount of information to be transmitted inevery request and response. REST uses CRUD (Create, Read, Update, Delete) methodsto manipulate resources. ETSI M2M defines two more additional methods: EXECUTEfor executing a management command and NOTIFY for reporting a notification about achange of a resource to the subscribers of that resource. These operations can manipulateany resource and, therefore, the same architecture can be used by several applications,avoiding the use of dedicated infrastructures. REST foresees the use of intermediaries,or proxies, that perform caching of information to deliver greater scalability. In ETSIM2M, each SCL hosts resources in a hierarchical tree structure, where information ismaintained.
ETSI M2M supports two communication models: the request-response and the publish-subscribe models. REST is inherently a request-response based architecture. But, forevent-based communications, publish-subscribe is a more reasonable choice, as sensing
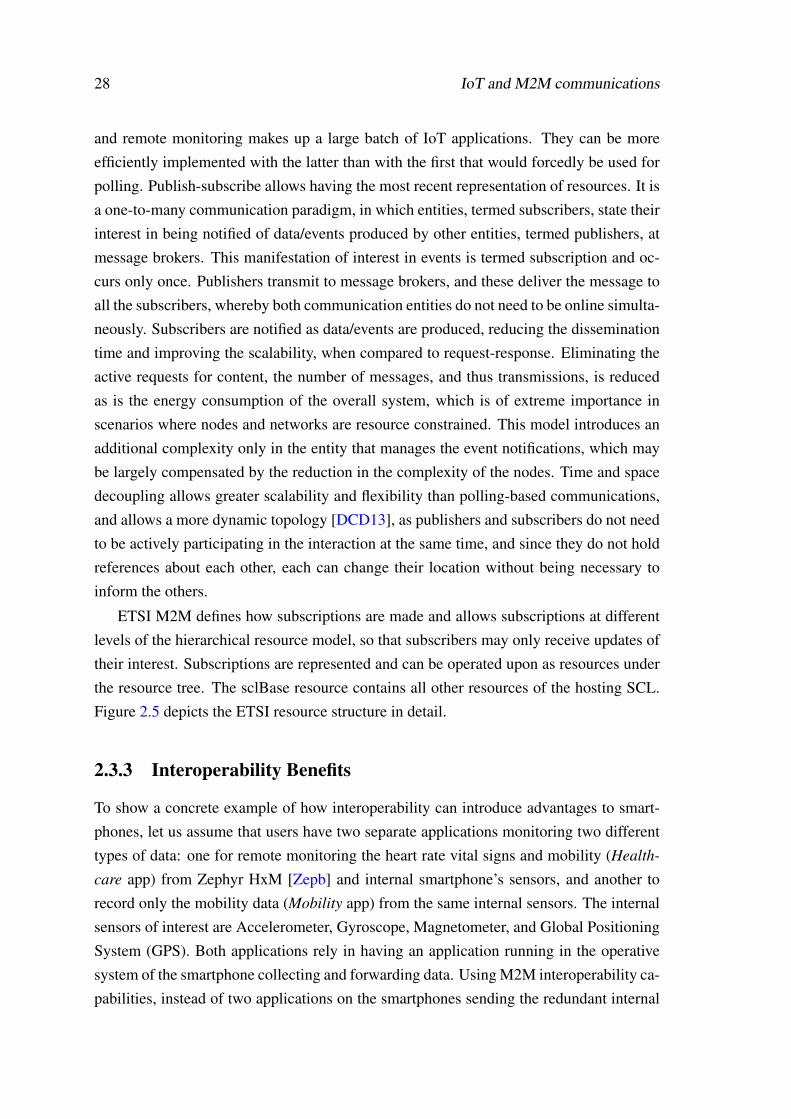
28 IoT and M2M communications
and remote monitoring makes up a large batch of IoT applications. They can be moreefficiently implemented with the latter than with the first that would forcedly be used forpolling. Publish-subscribe allows having the most recent representation of resources. It isa one-to-many communication paradigm, in which entities, termed subscribers, state theirinterest in being notified of data/events produced by other entities, termed publishers, atmessage brokers. This manifestation of interest in events is termed subscription and oc-curs only once. Publishers transmit to message brokers, and these deliver the message toall the subscribers, whereby both communication entities do not need to be online simulta-neously. Subscribers are notified as data/events are produced, reducing the disseminationtime and improving the scalability, when compared to request-response. Eliminating theactive requests for content, the number of messages, and thus transmissions, is reducedas is the energy consumption of the overall system, which is of extreme importance inscenarios where nodes and networks are resource constrained. This model introduces anadditional complexity only in the entity that manages the event notifications, which maybe largely compensated by the reduction in the complexity of the nodes. Time and spacedecoupling allows greater scalability and flexibility than polling-based communications,and allows a more dynamic topology [DCD13], as publishers and subscribers do not needto be actively participating in the interaction at the same time, and since they do not holdreferences about each other, each can change their location without being necessary toinform the others.
ETSI M2M defines how subscriptions are made and allows subscriptions at differentlevels of the hierarchical resource model, so that subscribers may only receive updates oftheir interest. Subscriptions are represented and can be operated upon as resources underthe resource tree. The sclBase resource contains all other resources of the hosting SCL.Figure 2.5 depicts the ETSI resource structure in detail.
2.3.3 Interoperability Benefits
To show a concrete example of how interoperability can introduce advantages to smart-phones, let us assume that users have two separate applications monitoring two differenttypes of data: one for remote monitoring the heart rate vital signs and mobility (Health-
care app) from Zephyr HxM [Zepb] and internal smartphone’s sensors, and another torecord only the mobility data (Mobility app) from the same internal sensors. The internalsensors of interest are Accelerometer, Gyroscope, Magnetometer, and Global PositioningSystem (GPS). Both applications rely in having an application running in the operativesystem of the smartphone collecting and forwarding data. Using M2M interoperability ca-pabilities, instead of two applications on the smartphones sending the redundant internal
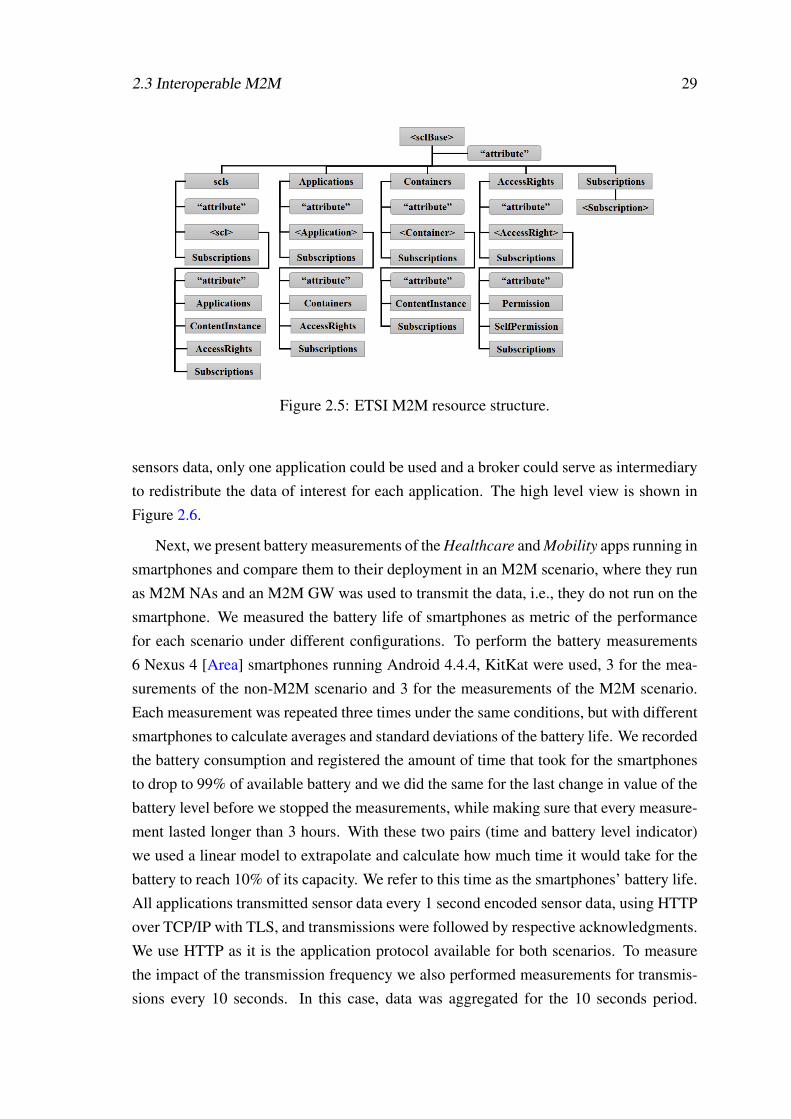
2.3 Interoperable M2M 29
Figure 2.5: ETSI M2M resource structure.
sensors data, only one application could be used and a broker could serve as intermediaryto redistribute the data of interest for each application. The high level view is shown inFigure 2.6.
Next, we present battery measurements of the Healthcare and Mobility apps running insmartphones and compare them to their deployment in an M2M scenario, where they runas M2M NAs and an M2M GW was used to transmit the data, i.e., they do not run on thesmartphone. We measured the battery life of smartphones as metric of the performancefor each scenario under different configurations. To perform the battery measurements6 Nexus 4 [Area] smartphones running Android 4.4.4, KitKat were used, 3 for the mea-surements of the non-M2M scenario and 3 for the measurements of the M2M scenario.Each measurement was repeated three times under the same conditions, but with differentsmartphones to calculate averages and standard deviations of the battery life. We recordedthe battery consumption and registered the amount of time that took for the smartphonesto drop to 99% of available battery and we did the same for the last change in value of thebattery level before we stopped the measurements, while making sure that every measure-ment lasted longer than 3 hours. With these two pairs (time and battery level indicator)we used a linear model to extrapolate and calculate how much time it would take for thebattery to reach 10% of its capacity. We refer to this time as the smartphones’ battery life.All applications transmitted sensor data every 1 second encoded sensor data, using HTTPover TCP/IP with TLS, and transmissions were followed by respective acknowledgments.We use HTTP as it is the application protocol available for both scenarios. To measurethe impact of the transmission frequency we also performed measurements for transmis-sions every 10 seconds. In this case, data was aggregated for the 10 seconds period.

30 IoT and M2M communications
Figure 2.6: Applications in non-M2M and in M2M scenarios. On top, users have twoapplications running in his smartphone: a personal healthcare monitoring and a mobilitydata applications. On bottom, the use case scenarios are mapped into the M2M architec-ture where only one application is necessary.
We also measured both scenarios for two types of networks: a Wi-Fi network compli-ant with IEEE 802.11g, which has a maximum physical layer bit rate of 54 Mbps, and a3G network with High-Speed Uplink Packet Access (HSUPA) and High-Speed DownlinkPacket Access (HSDPA) protocols allowing a maximum uplink bit rate of 5.76 Mbps anda maximum downlink bit rate of 42.2 Mbps, respectively. More details of this setup canbe found in [PRP+16].
For a matter of simplicity, we present the results regarding the impact of sendingonly one type of data on the performance of the smartphones’ battery life. We measuredboth scenarios where only the mobility data was transmitted (Accelerometer, Gyroscope,Magnetometer, and GPS data). Therefore, for the non-M2M scenario the only applicationrunning was the Mobility application. Figure 2.7 shows that battery life for the non-M2M measurements is very similar to the one obtained by the M2M GW in the M2Mmeasurements, both for Wi-Fi and 3G, taking into consideration the standard deviation(Crowd 1s and Crowd 10s scenarios). The M2M system (REST and M2M verbosity)did not translate to an increase of battery consumption of M2M due to the large size ofthe payload data as both scenarios have similar battery life values. The aggregation ofdata (Mob 10s scenario), and the consequent decrease in the number of transmissions, ledto the increase of the battery life when compared to the higher transmission frequency

2.3 Interoperable M2M 31
Figure 2.7: Comparison between performance of Mobility and Healthcare applicationsin a non-M2M and M2M scenarios. The higher the bars are the higher the battery lifeis. There is an increase of the measured battery life of the smartphones when M2M isused and two or more applications use the same data. The use of 3G severely depletes thebattery when compared to the use of Wi-Fi.
scenarios (Crowd 1s scenario) of 28% when using Wi-Fi and 51% when using 3G forthe M2M scenarios, and increase of 29% when using Wi-Fi and 70% when using 3G forthe non-M2M scenarios. The results show that the use of 3G for smart city applications,either using M2M or not, can hold undesirable battery depletions.
Now, we consider the scenario where both types of data are collected. For the non-M2M scenario, Mobility and Healthcare were both running simultaneously, but sepa-rately, collecting and transmitting individually their data. Adding an application led tothe decrease of the average battery life since an additional application is transmitting re-dundant data. Using Wi-Fi the Mob+Health 10s M2M scenario exhibited an increaseof the average battery life when compared to the Mob 10s M2M scenario; however, ifwe consider the standard deviation the battery life is similar. Although all measurementslasted longer than 3 hours, since the use of 3G depletes more battery than Wi-Fi, the mea-sured battery life values when using 3G reached closer to the threshold assumed as batterylife (10%) than Wi-Fi, and thus can explain the lower deviation observed for 3G.
We can observe that now there are relevant differences between the non-M2M andthe M2M scenarios, especially for Wi-Fi. The M2M scenario transmitted less sensor datathan the non-M2M scenario, derived from the avoidance of transmitting duplicated dataof the first, which led to an increase of battery life of the smartphones. The impact ofadding even more applications running at the same smartphone, transmitting the samedata, should introduce even further differences in the battery life between the two scenar-

32 IoT and M2M communications
ios, and M2M should bring even more efficiency.The use of aggregation led to the increase of the battery life (Mob+Health 1s vs
Mob+Health 10s) of 46% when using Wi-Fi and 53% when using 3G for the M2M sce-narios, and increase of 25% when using Wi-Fi and 42% when using 3G for the non-M2Mscenarios. Data aggregation can be an important factor to take in consideration whenusing smartphones, or any resource-constrained devices in general, as GWs.
Please note that here we were not considering the depletion that would naturally oc-cur when collecting from internal or external sensors. Therefore, in such scenarios, thebattery life would be even smaller for both Wi-Fi and 3G networks. Exploiting the in-teroperability introduced by standardized ETSI M2M communications can, nevertheless,improve the battery life of smartphones acting as M2M GWs by avoiding transmittingduplicated data. However, a comprehensive performance evaluation of the capabilitiesand limitations of the system must be performed, specially in terms of the offered QoS.We will address this in the next chapter.

Chapter 3
Design and Evaluation of aninteroperable M2M ecosystem
M2M communications’ standards foster the emergence of IoT applications by providinginteroperability among devices and services outside application silos. Currently, many ofthese applications exploit the massive use of smartphones as well as their connectivityand sensing capabilities, e.g., for monitoring health-related information or intelligent mo-bility [PRP+16]. Interoperability could guarantee that devices can be integrated with in-frastructures and services, and that services can be composed into complex applications inwhich each stakeholder focuses on his specific know-how. Mobile e-health is a perfect usecase because available solutions tend to be proprietary. This leads to closed and inefficientvertical silos that have difficulty in scaling and cause dispersion due to the impossibilityto share resources [WTJ+11, UAH+12]. Interoperability and standardization are funda-mental for recognition and acceptance of e-health [SEM13, KN10, CCVMF+07]. Thepromise to improve the quality and efficiency of health services is driving the emergenceof e-health as IoT applications, surpassing what was initially expected [vGPWCO12].E-health is being adopted for self and home-monitoring, hospital systems, and many oth-ers [KN10], either for ambulatory monitoring of chronic conditions, or for prophylacticreasons, in order to minimize the number of visits to the doctor [ETS13b, MPZ+13].
To further motivate this work, let us consider the following storyboard, also used in thecontext of the Future Health project which was part of the I-CITY Integrated ResearchProgram and "ICT for Future Cities" Research Line [iP]. We envision that individualsare advised by a primary healthcare unit to have their lifestyle remotely monitored usinga wearable system that collects their heart rate and mobility [PFB+14, PRP+16]. Thisstoryboard is implemented as an interoperable mobile e-health application, and the appli-cation overview is presented in Figure 3.1. Users follow a daily routine: every morn-
33

34 Design and Evaluation of an interoperable M2M ecosystem
Figure 3.1: Overview of the mobile e-health application. Arrows represent user data flow.
ing, before leaving home for school or work, they put on a BT wearable device andstart an application on their smartphone, which they stop at the end of the day. Thesmartphone continuously uploads the sensor data using wireless or cellular networks toa service, the Data Processor, which extracts several heart rate and mobility indicatorsand verifies whether daily and weekly physical recommendations are met. This servicealso formats data according to the semantics required for the correct interpretation by anopenEHR interface service that runs in the healthcare unit. The processed data is sentto the openEHR interface service, which is responsible for storing and making the dataavailable to care takers. Medical personnel can analyze the users’ lifestyle informationthrough their EHR. Communications between services and devices are made via M2Mmiddleware in a publish-subscribe communication model using a message broker.
Latency, defined as the time for data to travel from one given point to another, is a crit-ical metric of service composition performance [LL11], and, thus, M2M middleware per-formance. Critical applications respond to event alarms and emergency situations, whichdepend on timely data transfer, and many other envisioned applications are of interactivenature. Interactivity might not only be user-related, where users need to acknowledge orvalidate data, but also service/machine-related in the form of alarm, prevention, or advi-sory systems related to physiological data in a remote actuation scenario. Furthermore,future micro- or even nano-size wearable devices can bring additional use case scenar-ios (and, thus, applications) where sub-second time requirements might also need to beguaranteed.
Because data usefulness decays after a deadline, M2M middleware must guarantee

Design and Evaluation of an interoperable M2M ecosystem 35
not only interoperability, but also predictable and measurable E2E QoS. However, thisaspect has received little attention so far, likely due to lack of available implementationsof such platforms and applications on top of them. We aim to understand if standardizedM2M communications are able to provide time-requirement guarantees in a context of anIoT service composition using mobile networks.
In this chapter, we report the design and implementation of a mobile e-health appli-cation on a standard M2M middleware, and experimentally evaluate its latency perfor-mance for service composition in a 3 week mobile pilot with 10 participants. Our frame-work relies on top of rising standards of the Information and Communication Technology(ICT) infrastructure: ETSI M2M communications [ETS13e] as scalable and reliable in-frastructure for interconnecting devices and services, and openEHR [Opeb] for storingand exposing health records. To the best of our knowledge, providing this use case onstandard interoperable systems is also novel, thus we dedicate some space to describe ourimplementation and to characterize application data. We quantitatively evaluate the E2Elatency as well as latency between system components and response times of the systemwhich acquire a special flavor under dynamic and volatile environments characterized bymobile networks. Performance evaluation of latency in e-health applications using cel-lular networks exist in terms of simulations [VMK07, KWH+15], but the systems arelimited and use very simplistic models. On the other side, real testbeds implementationalso exist, but performance is left out [MKSL10, JMC13]. To the best of our knowledge,performance of M2M in a context of IoT is not present in literature. Works involvinglatency performance in M2M middleware only include estimations for a specific set ofexamples [NK11] or methodologies for measurement between two hosts [FZ15], and failto capture realism of measurements.
We summarize the contributions of this chapter as follows:
1. We detail the design and implementation of an IoT e-health application (remotemonitoring) as an IoT service composition on top of standard technologies ETSIM2M and openEHR;
2. We report the design, development, and performance evaluation of an ETSI M2MGW instantiated in a smartphone. We also present libraries to ease the deploymentof IoT applications using the ETSI M2M ecosystem with reduced developmentcosts;
3. We quantify application protocol overheads;
4. We measure latency between system components using nearly 480 hours of datacollected from a 3 week mobile pilot with 10 users. We show that the latency be-
36 Design and Evaluation of an interoperable M2M ecosystem
tween a smartphone gateway and the openEHR interface service can exceed 1 sec-ond when using cellular networks, and we quantify the impact of the middleware.Among other findings, we show that there is a correlation between the distancetraveled by each user and the latency measured between its gateway and the broker;
5. We find that the largest part of the E2E latency lies between the gateway and thebroker, even for different wireless networks. Its magnitude is greatly dependent ofthe gateway’s network interface state at the moment when the application schedulestransmissions due to the promotion delay. An Idle state requires time for allocationof network resources to the interface.
The rest of the chapter is structured as follows. Next, we present the system archi-tecture, system setup and implementation. We discuss the challenges concerning latencymeasurements and how we address them in Section 3.2. Section 3.3 presents the per-formance evaluation and results. We discuss the results in Section 3.4, and we compileimportant observations for researchers in Section 3.4.2.
3.1 System Design and Implementation
In this section, we describe the design and implementation of the system for providingthe mobile e-health application. Next, we review a few important concepts of openEHR.We model our storyboard as a service choreography and map it into standard M2M mid-dleware in Section 3.1.2. Section 3.1.3 summarizes the information that is collected andprocessed from participants for exhibition on users’ EHR. In Sections 3.1.4 and 3.1.5 wedescribe the design of M2M GWs and NAs, respectively. Implementation details and thepilot deployment are presented in Section 3.1.6.
3.1.1 Background on EHR
OpenEHR [Opeb] is a non-proprietary standard architecture in health informatics aimingat interoperability in e-health. OpenEHR allows the standardization of EHR architecturefollowing a multi-level modelling approach, which separates information from know-ledge [BH08]. For that, openEHR Foundation published a set of specifications [opec]that define a health information reference model, archetypes, and a query language. InopenEHR, an archetype is the model for the capture of health information [Les12]. Ex-ample archetypes can be found in [opea]. OpenEHR mandates openness in terms of data,models, and Application Programming Interfaces (APIs) for systems and components.Being independent of software applications and technology changes [Hov10], it provides

3.1 System Design and Implementation 37
Figure 3.2: M2M System design. Arrows represent user data flow.
interoperability between health information systems, avoiding dispersion and limitationsof proprietary technical solutions, and allowing flows between distributed systems.
3.1.2 Mapping Storyboard to M2M
The storyboard was mapped and deployed into an ETSI M2M ecosystem, as depictedin Figure 3.2. Wearable devices, like the chest band heart rate monitor (Zephyr HxMBT [Zepb]) used in this work, usually do not possess M2M capabilities and do not usestandardized interfaces. Thus, they cannot "play" directly in the M2M ecosystem. Thesedevices are termed legacy devices. They need to connect first to M2M GWs that actas proxies or concentrators on their behalf. Users’ smartphones can act as M2M GWs,collecting data from sensors, embedded or connected via BT, or another BAN technology.The M2M GW run two software components, an M2M GA and an M2M GSCL, that arerequired to manage sensors and data on the M2M Device & Gateway domain. A GIP,

38 Design and Evaluation of an interoperable M2M ecosystem
which can be an internal capability of GSCL or an application, allows sensors from legacydevices to connect to a SCL. The M2M GWs periodically send/publish data to the NSCL,whose main function is to act as a broker.
M2M NAs are services in the M2M Network Domain that run the application logicusing M2M capabilities. Every NA that is interested in receiving data exposed throughthe M2M middleware must subscribe to the respective resource in the NSCL1. As DataProcessor and openEHR services do not possess M2M capabilities, we enable them withM2M capabilities with the use of NA libraries (NAlib). M2M GWs communicate with theNSCL using the mId interface, while the Data Processor and the openEHR communicatewith the NSCL using the mIa interface [ETS13e]. Access control is verified on resourceaccess by the NSCL, and TLS is used to ensure privacy and security.
The Data Processor subscribes the raw sensor data at the NSCL, and is notified of alldata published by GWs. Once per day, the Data Processor processes the data from eachuser, formats it as required by the openEHR, and publishes it at the NSCL. The NSCLthen notifies the openEHR. Figure 3.3 shows the normal message sequence between theentities during the pilot.
Initially, every entity registers itself at the NSCL. Each M2M GW registers itself un-der its own SCL using its smartphone’s serial number for unique identification, /scls/<SerialNumber>/, below the SCL base at the NSCL at https://193.136.29.19/m2m. M2MGWs publish data to /scls/<SerialNumber>/applications/BT-ZEPHYR/containers/DATA/contentInstances/. Data Processor and openEHR register themselves directly at the Ap-plications resource collection below the SCL base at /applications/DataProcessor/ and/applications/openEHR/, respectively. The Data Processor publishes each user data at/applications/DataProcessor/containers/<user>/contentInstances/, where <user> corre-sponds to an integer value between 0 and 9.
3.1.3 User Data
After pairing to a smartphone, the chest band heart rate monitor transmits periodicallyat 1Hz (1 packet per second), where each packet is 60 Byte and contains among otherinformation [Zepa]: heart rate, speed, and distance data. The device sends the averageheart rate in beats per minute (a range from 30 to 240 beats per minute, or 0 if no validaverage heart beat per minute is detected during the sampling period), a counter for eachtime a heartbeat event is detected (rolling over 255), and the last 15 heartbeat timestamps
1If necessary, M2M NAs are also able to send commands to M2M GWs, e.g., alerts or behavior com-mands, following the approach presented in [ETS14a], but we do not use this functionality in our use case.For efficiency reasons M2M GWs can be set to transmit only after receiving subscriptions.
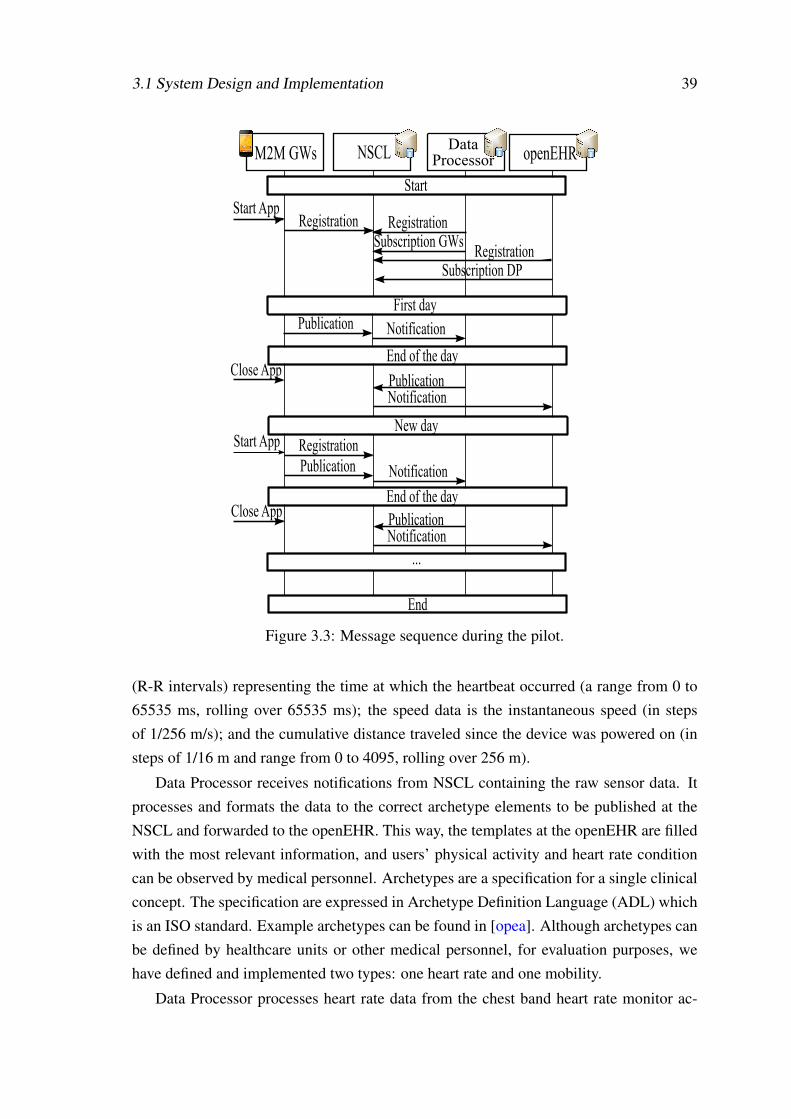
3.1 System Design and Implementation 39
M2M GWs Data ProcessorNSCL openEHR
Start
Registration RegistrationSubscription GWs
First dayPublication Notification
End of the day
Publication
RegistrationSubscription DP
Notification
New day
Publication Notification
End of the dayPublicationNotification
...
End
Start App
Close App
Start App Registration
Close App
Figure 3.3: Message sequence during the pilot.
(R-R intervals) representing the time at which the heartbeat occurred (a range from 0 to65535 ms, rolling over 65535 ms); the speed data is the instantaneous speed (in stepsof 1/256 m/s); and the cumulative distance traveled since the device was powered on (insteps of 1/16 m and range from 0 to 4095, rolling over 256 m).
Data Processor receives notifications from NSCL containing the raw sensor data. Itprocesses and formats the data to the correct archetype elements to be published at theNSCL and forwarded to the openEHR. This way, the templates at the openEHR are filledwith the most relevant information, and users’ physical activity and heart rate conditioncan be observed by medical personnel. Archetypes are a specification for a single clinicalconcept. The specification are expressed in Archetype Definition Language (ADL) whichis an ISO standard. Example archetypes can be found in [opea]. Although archetypes canbe defined by healthcare units or other medical personnel, for evaluation purposes, wehave defined and implemented two types: one heart rate and one mobility.
Data Processor processes heart rate data from the chest band heart rate monitor ac-

40 Design and Evaluation of an interoperable M2M ecosystem
/Rootctx/language : "en"ctx/territory : "PT"ctx/composer_name : "IT Porto"ctx/time : "2015-06-15T13:52:25.494Z"ctx/id_namespace : "Future-Health"ctx/id_scheme : "Future-Health"ctx/participation : [Array][0] : [Object]ctx/participation_name : "Carlos Pereira"ctx/participation_function : "requester"ctx/participation_id : "99999999"
ctx/participation_mode : "Machine-to-Machine communications"ctx/health_care_facility|name : "Future Health"ctx/health_care_facility|id : "9091"fhm2m : [Object]heart_rate_variability : [Object]width :"P3DT3H48M"heart_rate_frequency_histogram : [Object]nn : [Object]avnn : [Object]sdnn : [Object]rmssd : [Object]pnn20 : [Object]pnn50 : [Object]tot_pwr : [Object]vlf_pwr : [Object]vlf : [Object]lf_pwr : [Object]hf_pwr : [Object]lf_hf : [Object]heart_rate_frequency_histogram : [Array]nn_histogram : [Array]avnn_histogram : [Array]sdnn_histogram : [Array]rmssd_histogram : [Array]pnn20_histogram : [Array]pnn50_histogram : [Array]
mobility : [Object]width :"P3DT3H48M"distance : [Object]speed : [Object]accumulated_movement_time : [Object]max_period_of_continued_movement : [Object]max_period_of_continued_stoppage : [Object]max_distance_of_continued_movement : [Object]activity_histogram : [Array]meets_recommendations : false
Figure 3.4: JSON containing two archetypes: heart rate variability and mobility. JSONcontains additional information in order for openEHR to correctly interpret them.
cording to the PhysioNet’s Heart Rate Variability (HRV) toolkit [Phy14]. PhysioNet’sHRV toolkit is a validated package for HRV analysis. The heart rate archetype includesdaily averages of several heart rate information, such as the average and standard devia-tion of normal sinus to normal sinus interbeat intervals, and also several histograms withhourly values.
The mobility archetype includes several single average daily values, such as: Distance,Average Speed, Accumulated Movement Time, Maximum Period of Continued Move-

3.1 System Design and Implementation 41
ment, Maximum Period of Continued Stoppage, or Maximum Distance of ContinuedMovement. The archetype also includes a daily histogram of travelled distance per eachhour of the day, and a Boolean value to check if the user has a healthy lifestyle by met-ing the recommended weekly/daily activities obtained from the guidelines in [TDC+07,HLP+07]. User mobility also allows us to take conclusions about its impact on the E2Elatency in Section 3.3.4.
Every parameter of the archetypes must include the units, the type of the data (e.g.,float, integer, etc.), limits, and expected normal limits for detection of critical situations.Besides the two archetypes, Data Processor includes some additional data necessary forthe correct interpretation of openEHR. The complete JavaScript Object Notation (JSON)data is shown in Figure 3.4. With these two archetypes, clinical personnel, or any otherservice provider, can obtain a detail information of the user’s heart rate information, mo-bility, and general lifestyle.
3.1.4 Designing an M2M GW in an Android Smartphone
M2M GWs run M2M Applications, GAs, that use SCL accessible via reference points.M2M GWs are distinct from common M2M Devices due to their capabilities of inter-connecting devices to the M2M system and exposing M2M capabilities to them. Wedeveloped a GW service that enables a smartphone to act as M2M GW, but also runningseveral GAs. The GW service was developed for Android Operative System (OS) devicesand runs as an Android service. The GA Library was implemented to allow developers tocreate, with reduced development costs, their own Android Applications as M2M GAs,extending the M2M capabilities across all smartphone’s applications by implementing thedIa reference point. The GA Library requires that the GW service is running to access theGSCL.
The M2M GW service and GA Library are depicted in Figure 3.5, and have the fol-lowing key modules:
• Service Manager - Module that creates and manages the Android service. It isresponsible for the setup, initiation and termination of all other modules;
• GSCL - The service’s local SCL. Provides and processes the M2M functions andmaintenance (e.g., cleaning expired resources). It stores and manages the localM2M resources. It can fulfill requests to create and retrieve local and remote re-sources;
• Protocol Manager - Module that manages the client and server communication pro-tocols. It is used by the GSCL to translate M2M operations in communication pro-
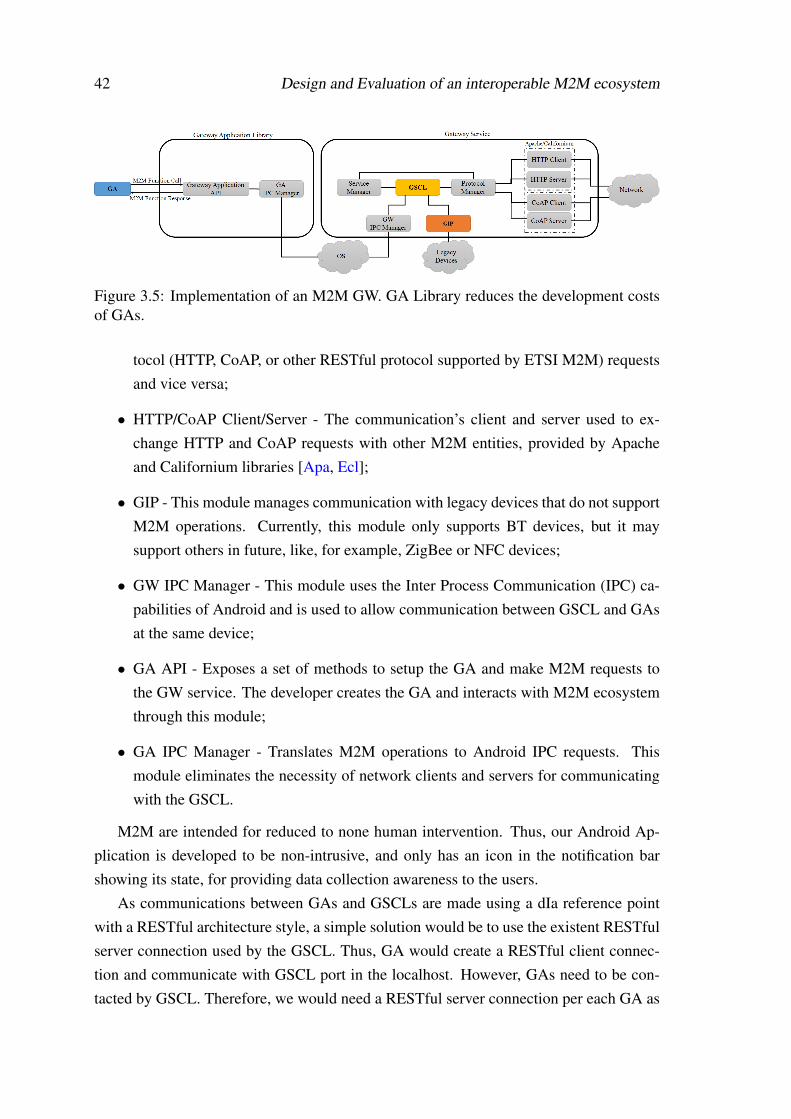
42 Design and Evaluation of an interoperable M2M ecosystem
Figure 3.5: Implementation of an M2M GW. GA Library reduces the development costsof GAs.
tocol (HTTP, CoAP, or other RESTful protocol supported by ETSI M2M) requestsand vice versa;
• HTTP/CoAP Client/Server - The communication’s client and server used to ex-change HTTP and CoAP requests with other M2M entities, provided by Apacheand Californium libraries [Apa, Ecl];
• GIP - This module manages communication with legacy devices that do not supportM2M operations. Currently, this module only supports BT devices, but it maysupport others in future, like, for example, ZigBee or NFC devices;
• GW IPC Manager - This module uses the Inter Process Communication (IPC) ca-pabilities of Android and is used to allow communication between GSCL and GAsat the same device;
• GA API - Exposes a set of methods to setup the GA and make M2M requests tothe GW service. The developer creates the GA and interacts with M2M ecosystemthrough this module;
• GA IPC Manager - Translates M2M operations to Android IPC requests. Thismodule eliminates the necessity of network clients and servers for communicatingwith the GSCL.
M2M are intended for reduced to none human intervention. Thus, our Android Ap-plication is developed to be non-intrusive, and only has an icon in the notification barshowing its state, for providing data collection awareness to the users.
As communications between GAs and GSCLs are made using a dIa reference pointwith a RESTful architecture style, a simple solution would be to use the existent RESTfulserver connection used by the GSCL. Thus, GA would create a RESTful client connec-tion and communicate with GSCL port in the localhost. However, GAs need to be con-tacted by GSCL. Therefore, we would need a RESTful server connection per each GA as
3.1 System Design and Implementation 43
well, which does not scale. Exploiting Android IPC capabilities, the GW IPC managerallows the communication between GAs and GSCL in the same device without settingup network clients and servers. The Android OS provide two methods for IPC: Bindersand Intents. Although having a similar performance for small exchanged data in termsof latency, and memory and Central Processing Unit (CPU) usage, the performance ofIntents degrade with the increase of the data size [HFR+13]. We implemented the Mes-senger method, which is a form of the Binder method. The Messenger method is alsorecommended by the Android API guides over the AIDL binder method. The Messengermethod allows the dIa to remain simple and functional.
3.1.4.1 Resource Structure Mapping
We performed the following SCL resource mapping to implement the GSCL. Each SCLrepresents the smartphone physical device. We use the serial identification of each smart-phone to guarantee its uniqueness. Under the resource tree, applications represent externalor internal sensors available. Under the Containers we set only two different types of con-tainers: DATA and DESCRIPTOR. The DATA container is used for common data, whileDESCRIPTOR container is used for information with respect to the application (its parentin the resource tree), following the strategy presented in [ETS14a]. During the registra-tion process, the M2M GW exposes the smartphone’s capabilities publishing a ContentInstance with the supported actuation commands (see Section 3.1.5) under the DESCRIP-TOR container. Other M2M entities can retrieve or subscribe to the latest Content Instanceunder the DESCRIPTOR container to learn the information about the available actuationcommands. Content Instances are used to transport data.
3.1.4.2 Data
Currently, the M2M GW has the ability to process and encapsulate data in JSON, or senddata as it was collected (raw bytes) and delegate the data processing to the subscribers(applications). Although depending on the complexity and efficiency of the processing,leaving this task to the subscribers can reduce the overhead in outgoing traffic introducedby JSON, reduce the CPU and Memory usage, and add more flexibility of connection toany nearby (or internal) device as it is not required the interpretation of the data.
44 Design and Evaluation of an interoperable M2M ecosystem
3.1.4.3 Accessibility
The Protocol Manager is also responsible for guaranteeing that the M2M GW is con-tactable/addressable. As applications usually do not require to be globally addressable,devices operate behind NAT or firewalls and do not possess global IP addresses. The Pro-tocol Manager has three capabilities: UPnP [BPW], NAT-PMP [CK], and long-polling[ETS13e]. UPnP and NAT-PMP are two protocols that allow the remote configurationof port mapping and port forwarding in a routing device, while long-polling sustains acommunication session between servers and clients for a period of time. If the UPnP isnot available, the GW service proceeds to setup the NAT-PMP, and if both port mappingprotocols fail, the M2M GW uses long-polling.
3.1.4.4 GW State machine
We can divide the M2M GW normal operation in 3 states: the bootstrap or initializationthat includes an initial registration, the standby, and the sending.
Initially, the M2M GW is in the bootstrap state. This state is characterized by a setof tasks executed by the GW service when the Android Application is turned on. Thefirst task is to start all components, described before in the GW service, by triggeringthe Service Manager. The Protocol Manager initiates the GSCL and a client and serverconnection. The GSCL loads the M2M resources data stored locally. When initiated,the GIP sets up a BT communication manager, GPS services, and buffers to be usedin data captures. The client authenticates itself to the NSCL and retrieves a symmetrickey to be used later in the TLS protocol, to ensure privacy and security. As soon asthe client is ready, the second phase of the Bootstrap sets the GSCL to register itselfon NSCL, to create the smartphone’s application, including the containers DATA andDESCRIPTOR, and to publish the smartphone’s characteristics and capabilities in theDESCRIPTOR Container.
The Standby is a state in which the M2M GW is not connected to any sensor orcollecting any data. In this state, it only performs maintenance tasks, like maintainingthe communication server and client and managing the GSCL resources. The M2M GWenters a Sending state as soon as a new sensor is found. For external BT sensors, thisstate involves starting a BT connection and, possibly, executing a handshake procedure tostart receiving data. If the connection to a sensor is successful, the M2M GW registersthe sensor in the NSCL (as an Application resource). The M2M GW starts transmittingthe new sensor data if it has a subscription from any other M2M entity for the data. TheM2M GW can publish data from sensors according to defined policies, which can be a

3.1 System Design and Implementation 45
time period (e.g., 1 second or 10 seconds) or size (e.g., 1KB or 5KB of sensor data). Thisstate is terminated and the M2M GW returns to standby when all sensors are disconnected.
3.1.4.5 GW benchmarking
We measured memory and CPU usage on smartphone as well as battery life for differentsensor configurations to analyze the M2M GW performance.
We used three Nexus 4 [Area] smartphones, running Android 4.4.4, KitKat, to per-form the measurements. Each measurement was repeated three times under the sameconditions, but with different smartphones to calculate averages. We analyze the M2MGW performance for six scenarios: GW standby, GW sending data from an external sen-sor, GW sending data from an external sensor using a buffer, GW sending data from aninternal sensor, and GW sending data from an internal sensor using a buffer. The useof buffers allows us to study the impact of data aggregation on the M2M GW perfor-mance. The smartphones transmit every 10 seconds when buffer is used, and transmitevery 1 second when buffer is not used. We used a chest band heart rate BT device(Zephyr HxM [Zepb]) as external sensor, and Accelerometer as internal sensor. Thus,the measurements of the battery include also the energy used to run the internal sensorand to collect the data from the external sensor. All communications use HTTP overTCP/IP with TLS, and sensor data is encoded in base64 and marshalled in JSON. Everydata transmission is followed by the respective acknowledgement with the data sent. Wemeasured all configurations for a Wi-Fi network compliant with IEEE 802.11g.
We minimized any other possible source of battery consumption by disconnectingall network connectivity, except Wi-Fi, setting the screen off, and stopping any serviceor background data. The initial bootstrapping and registration were ignored from themeasurements, and we only disconnected the smartphone from the charger after theseinitial phases. For the measurements with the external BT device, we also excluded thepairing phase from the measurements.
The memory and CPU indicators were obtained from the /proc runtime system infor-mation. We registered the smartphones’ battery life as the amount of time it took for thebatteries to reach 10% of their capacity.
Table 3.1 shows the average memory and CPU usage and the battery life measuredfor the different configurations. The use of the M2M GW has impact on the memory andCPU usage, and battery life, as expected. The total memory usage column represents thephysical and virtual memory reserved. The resident memory usage column representsthe actual physical memory occupied. The memory usage obtained for our M2M GWimplementation is considered normal if we take in consideration that Google Calendar

46 Design and Evaluation of an interoperable M2M ecosystem
Table 3.1: Performance evaluation of the M2M GW in terms of memory and CPU usageand battery life. Battery measurements include the energy consumed for running theinternal sensor and to collect the data from the external sensor.
Memory Usage (Kb)CPU Time Battery Life
Total Resident (%) (h)
GW Off - - - 113.4GW Standby 884069 41722 0.026 46.5GW Send Ext Sensor 887036 42219 0.161 5.3GW Send Ext Sensor Buffer 886285 41945 0.047 9.0GW Send Int Sensor 885473 42425 0.256 6.2GW Send Int Sensor Buffer 884786 42012 0.056 12.4
uses 880 Mb of total memory and 36 Mb of resident memory in the same smartphones.Results also show that CPU usage is rather small for all measurements, below 1%, whichmeans that reading, parsing, or marshaling of data have small impact on the CPU overtime. The use of buffers can result in a slight decrease of memory and CPU usage.
We can observe that the external sensor scenarios led to shorter battery life than theinternal sensor scenarios, mainly due to the BT usage, as it is the only significant dif-ference between the two scenarios. Even the M2M GW in standby introduces a signifi-cant battery depletion, as the M2M GW periodically performs maintenance tasks and BTsearches. The periodic device search can be eliminated and set to be triggered by actu-ation (see next section). We can observe that using smartphones as M2M GW can havean undesirable effect on the battery life of the smartphone; however, the use of buffers,exploring data aggregation, can guarantee at least 9 hours of operation.
3.1.5 Designing NAs
We developed a NA Library, a Java library, to allow the easy deployment of NAs inmulti-platforms, by exposing a set of methods, i.e., the mIa interface, for interaction withthe M2M Ecosystem. The NA developed is very similar to the GA, though the formerconnects to the NSCL that is not at the same place. The architecture, as depicted inFigure 3.6, can be divided in the following key modules:
• NA API - Exposes a set of methods to setup the NA and make M2M requests toNSCL. The developer creates the NA and interacts with M2M ecosystem throughthis module;
• Protocol Manager - Module that manages the client and server communication pro-tocols. It is used by the NA to translate M2M operations in communication protocol

3.1 System Design and Implementation 47
Figure 3.6: Implementation of an NA. NA can actuate in M2M GWs via NSCL and thenetwork. NA Library was developed to ease the development of NAs.
(HTTP, CoAP, or other RESTful protocol supported by ETSI M2M) requests andvice versa;
• HTTP/CoAP Client/Server - The communication’s client and server used to ex-change HTTP and CoAP requests with other M2M entities, provided by Apacheand Californium libraries.
NAs can, depending on proper authorization, control the behavior of M2M GWs viaNSCL, like, for example, changing the transmission period or the frequency that data iscollected from the devices, the start, stop, or search of sensors. Device discovery (BTsearches) and sensor captures can be remotely optimized or reduced with actuation. Thiscontrol is performed using the same M2M system, i.e., the control is not performed di-rectly between NAs and M2M GWs using a separate type of communication. It wasnecessary to implement an actuation procedure that was able to target a single M2M GWand that used few messages, since M2M is envisioned to large scale.
There are two main options, depicted in Algorithm 1, one for actuation on SCLs andother for actuation on Applications: (1) Remote SCL resource’s access based approach,and (2) Retargeting based approach. The first option consists of exploiting the mechanismdefined in [ETS13e] to access resources on different SCLs, as long it is in the limit of 3SCL hops of distance. Thus, if an NA requests a GSCL resource not present at NSCL, thelatter forwards the request to the GSCL (destination SCL). This mechanism requires thatGSCL extends the standardized request interpretation.
On the other hand, the second option exploits the Retargeting mechanism [ETS13e],which is defined as a mechanism to enable an SCL to route messages to an Application.This mechanism settles in two attributes of the Application resource: the ApplicationPoint of Contact (aPoC) and the Application Point of Contact Paths (aPoCPaths). TheaPoC attribute contains a URI that can be used to contact the registered application, andthe aPoCPaths contains a list of paths allowed for use in retargeting. A retargeting proce-

48 Design and Evaluation of an interoperable M2M ecosystem
Algorithm 1: Remote actuation./* Remote SCL resource’s access */
1 SCL receives a request targeted to an App Resource:2 if local SCL is the destination then3 if targeted resource exists then4 SCL responds with resource;5 else6 SCL responds with an error;
7 else8 forwards request to the remote SCL;
/* Retargeting */9 SCL receives a request targeting a resource that matches an APoCPath:
10 if Application APoC is the localhost then11 Use IPC;12 else13 Use HTTP Client;
dure is triggered if the target resource, in a received request, is not present in the receivingSCL and the target URI matches or is prefixed by the combination of the registered Appli-cation resource path and one of the aPoCPaths. At this moment, the Application resourcepath, in the targeted URI, is substituted by the Application’s aPoC and the request is for-warded. Available actions can be listed as retargeting paths in the aPoCPaths attribute.When the M2M GW receives the request, it executes the desired action. The supportedactuation commands are in the DESCRIPTOR container belonging to the M2M GW.
3.1.6 Pilot Setup and Implementation
Along three weeks 10 volunteers used a Moto 2g [Areb] smartphones running Android4.4.4 KitKat [Goo] and a chest band heart rate monitor, Zephyr HxM BT, followingthe procedure presented in the storyboard. The users were willing to follow the proce-dure during the week days, i.e., from Monday to Friday, preferably during 8 hours. Theusers signed an informed consent for the collection of personal data. Mapping betweenusers and smartphones were not disclosed and, therefore, we can consider it as pseudo-anonymous collection.
All communications use HTTP over TCP/IP. Subscriptions, publications, and notifica-tions are made with a POST method which is followed by an acknowledgement messagefrom the receiver. We estimate that using CoAP [SHB] instead would lead to a decreaseof 28% of transmitted application protocol headers, without considering re-transmissions.
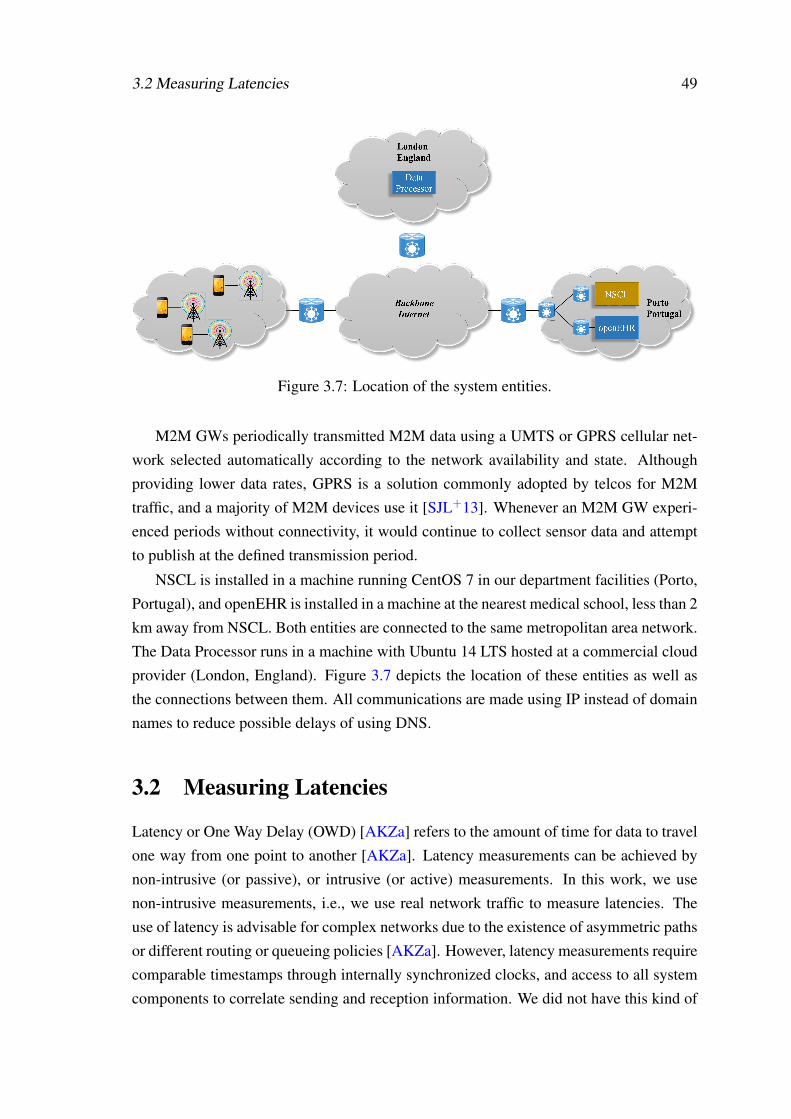
3.2 Measuring Latencies 49
Figure 3.7: Location of the system entities.
M2M GWs periodically transmitted M2M data using a UMTS or GPRS cellular net-work selected automatically according to the network availability and state. Althoughproviding lower data rates, GPRS is a solution commonly adopted by telcos for M2Mtraffic, and a majority of M2M devices use it [SJL+13]. Whenever an M2M GW experi-enced periods without connectivity, it would continue to collect sensor data and attemptto publish at the defined transmission period.
NSCL is installed in a machine running CentOS 7 in our department facilities (Porto,Portugal), and openEHR is installed in a machine at the nearest medical school, less than 2km away from NSCL. Both entities are connected to the same metropolitan area network.The Data Processor runs in a machine with Ubuntu 14 LTS hosted at a commercial cloudprovider (London, England). Figure 3.7 depicts the location of these entities as well asthe connections between them. All communications are made using IP instead of domainnames to reduce possible delays of using DNS.
3.2 Measuring Latencies
Latency or One Way Delay (OWD) [AKZa] refers to the amount of time for data to travelone way from one point to another [AKZa]. Latency measurements can be achieved bynon-intrusive (or passive), or intrusive (or active) measurements. In this work, we usenon-intrusive measurements, i.e., we use real network traffic to measure latencies. Theuse of latency is advisable for complex networks due to the existence of asymmetric pathsor different routing or queueing policies [AKZa]. However, latency measurements requirecomparable timestamps through internally synchronized clocks, and access to all systemcomponents to correlate sending and reception information. We did not have this kind of

50 Design and Evaluation of an interoperable M2M ecosystem
Table 3.2: Points and levels where timestamps were acquired during the exchanging ofdata packets between the different entities.
M2M GWs NSCL Data Processor openEHR
Application tGWA tNSCL
A tDPA tEHR
A
Kernel - tNSCLK tDP
K -
synchronization at the gateways, and we did not have access to the openEHR machine.So, comparing all timestamps to estimate one-way delays was a challenge. In the rest ofthis section, we describe how we measured latency for the different segments given thedifferent possibilities and accesses.
3.2.1 Synchronization
The most common method for clock synchronization over a distributed network is Net-work Time Protocol (NTP) [Mil]. NTP is a well-known protocol used to synchronizethe clock of a client to a reference time source, and it allows up to sub-millisecond syn-chronization [Smo03, Mil91, DVRT08]. We use timestamps with millisecond precision,so an NTP precision near 1 millisecond suffices. Data Processor, NSCL, and openEHRwere synchronized using NTP. However, the M2M GWs were not, so we had to find analternative way to estimate the latency between them and the NSCL.
An option to estimate latency between points that are not synchronized is using thehalf of the Round-Trip Time (RTT) [AKZb] measurements, assuming that paths are sym-metric. RTT is measured as the time interval between sending a packet and receiving itsacknowledgement at the same point, and, thus, it includes processing times at the remotelocation. Recent measurements show that halving RTT can introduce tens of millisec-onds of delay asymmetry (larger than our precision), and that asymmetries are higher forcommercial networks than education and research networks [PPZ+08]. Echo request andreply mechanisms (Ping) of the Internet Control Message Protocol (ICMP) [Pos] are analternative commonly used to estimate RTT network latencies. Another possible solutionis to use TCP Ping that uses the SYN/ACK or SYN/RST mechanisms in the TCP hand-shake. These techniques provide an estimate of network distance and latency, but useonly very short control packets being intrusive (though with negligible impact). Thus, wehalve the RTT to estimate the latency between GW and NSCL during the pilot.

3.2 Measuring Latencies 51
Table 3.3: Notations and equations of latencies measured between system components.
Notation Equation Measured Value
OWDGW,NSCLA
12 ×
1n
n∑
i=1
(tGWA (Acki)− tGW
A (Pubi))
0.9671 sec ±0.0186
OWDNSCL,DPA
1n
n∑
i=1
(tDPA (Noti)− tNSCL
A (Noti))
0.0138 sec ±1.802×10⁻⁴
OWDDP,EHRA
1m
m∑
k=1
(tEHRA (Notk)− tDP
A (Pubk))
0.3130 sec ±0.0470
OWDNSCLmIdK,A
1n
n∑
i=1
(tNSCLA (Pubi)− tNSCL
K (Pubi))
0.0106 sec ±5.312×10⁻⁴
OWDNSCLmIaK,A
1m
m∑
k=1
(tNSCLA (Pubk)− tNSCL
K (Pubk))
0.1399 sec ±0.0404
OWDDPA,K
1m
m∑
k=1
(tDPK (Pubk)− tDP
A (Pubk))
0.1076 sec ±0.0306
OWDDPK,A
1n
n∑
i=1
(tDPA (Noti)− tDP
K (Noti))
0.0035 sec ±1.162×10⁻⁴
OWDNSCLmIaA,K
1n+m
n+m∑j=1
(tNSCLK (Not j)− tNSCL
A (Not j))
0.0074 sec ±7.535×10⁻⁵
PingDP,NSCL 0.0057 sec
PingNSCL,EHR 0.0020 sec
3.2.2 Timestamping
Table 3.2 shows the timestamping points for our measurements. We acquired timestampsat kernel- and application-levels at NSCL and Data Processor since we had full access tothem. Due to limited access, we could not acquire kernel-level timestamps at openEHR,and we did not acquire timestamps at kernel-level at M2M GWs either due to the need forroot.
Timestamps measured at the kernel-level are the closest time we can acquire beforethe packet is passed to (or after the packet is received from) the network device. Times-tamp measurements at the kernel-level were acquired using TCPDUMP [MLJ] that useslibpcap [MLJ]. We acquired timestamps at application-level in all entities before datawas passed to (or received from) the M2M libraries. These libraries lay between theapplication and the kernel. Timestamp measurements at the application-level were ac-quired using the currentTimeMillis Java method [Ora]. While E2E latency measurementstend to choose application-level timestamp-based measurements, pure network laten-cy/delay measurements tend to choose kernel-based measurements [FZ15]. Performingapplication-level measurements allows us to include the inherent delay of the applicationprotocol libraries, e.g., accessing or using libraries, queuing processes, etc. Interactionsbetween the application-level and the kernel-level are performed on a per-packet basis
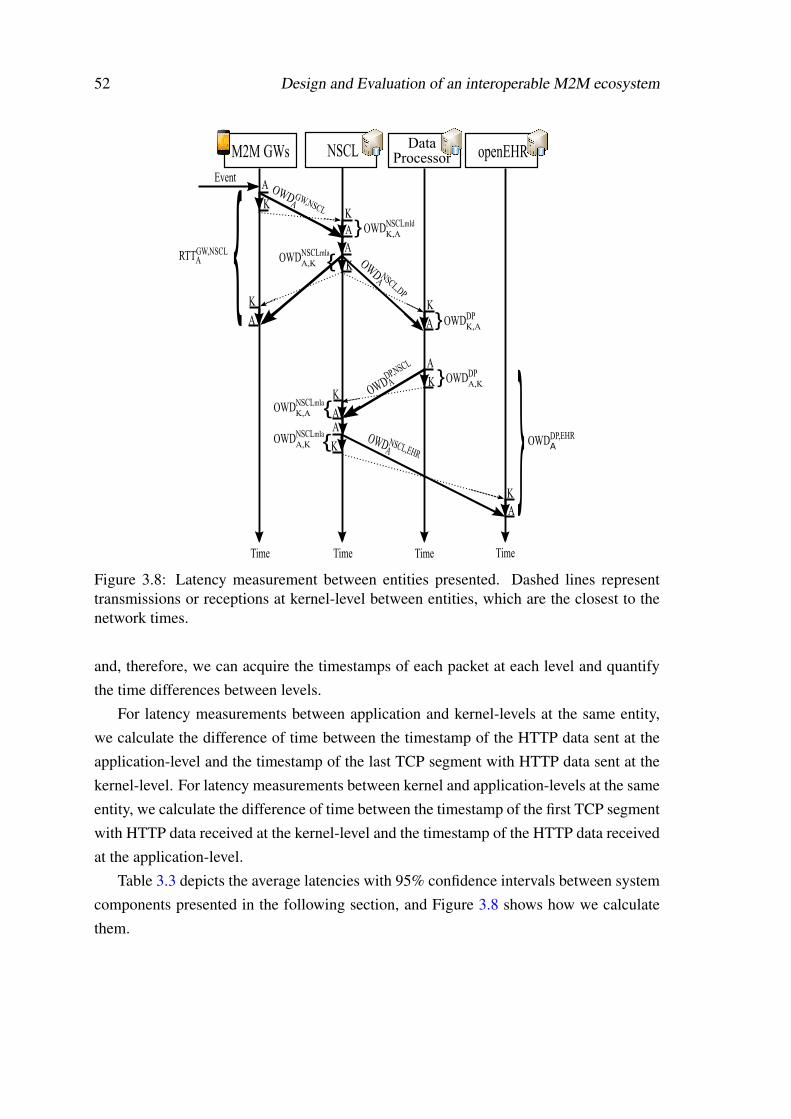
52 Design and Evaluation of an interoperable M2M ecosystem
M2M GWs Data ProcessorNSCL openEHR
Event
A
A
Time Time Time Time
A
KK
AK
K
AK
A
KK
AA
K
KA
OWDNSCLmIdK,A
OWDDPA,K
RTTGW,NSCLA
OWD GW,NSCLA
OWDDPK,A
OWDDP,EHRA
OWD NSCL,EHRA
OWDDP,NSCL
A
A
OWD NSCL,DP
OWDNSCLmIaK,A
OWDNSCLmIaA,K
OWDNSCLmIaA,K
Figure 3.8: Latency measurement between entities presented. Dashed lines representtransmissions or receptions at kernel-level between entities, which are the closest to thenetwork times.
and, therefore, we can acquire the timestamps of each packet at each level and quantifythe time differences between levels.
For latency measurements between application and kernel-levels at the same entity,we calculate the difference of time between the timestamp of the HTTP data sent at theapplication-level and the timestamp of the last TCP segment with HTTP data sent at thekernel-level. For latency measurements between kernel and application-levels at the sameentity, we calculate the difference of time between the timestamp of the first TCP segmentwith HTTP data received at the kernel-level and the timestamp of the HTTP data receivedat the application-level.
Table 3.3 depicts the average latencies with 95% confidence intervals between systemcomponents presented in the following section, and Figure 3.8 shows how we calculatethem.

3.3 System Evaluation 53
3.3 System Evaluation
In this section, we present a characterization and quantification of the data and latencytimes, as the most relevant results obtained from the pilot measurements. We did notobserve significant changes on the memory or CPU usage during the pilot on any device,and, thus, we do not present those results.
3.3.1 Quantification of Application Protocol Overheads
Figure 3.9 presents an overview of the amount of information that flowed through theNSCL. It shows the received data per minute during the measurement days. The shapeof the figure allows us to have a visual perception of the measurement periods. There areperiods with data flowing, which are the periods where M2M GWs were transmitting, andperiods with almost no traffic, which are night periods.
M2M GWs produced 22759 publications. Figure 3.10 shows the amount of hoursmonitored by each gateway. We monitored users for a total of 1146 hours, from which479 hours were actual data collection and transmission (i.e. active time), correspondingto 42% of the total. During measurements, users experienced some sensor device mal-functioning which caused the time differences between operation and actual collectionand transmission. In some cases, the chest band heart rate monitor indicated full batterywhen it was not the case, leading to short or even null periods of operation. The very lowactive time for M2M GW7 is explained due to the user leaving its application runningwithout the BT device being connected. Figure 3.10 and Figure 3.11 show that M2MGWs with larger active times transmit more information, as expected.
In total, M2M GWs received approximately 6.3 MByte of HTTP data and transmit-ted approximately 65.6 MByte of HTTP data, as shown in Figure 3.11. From the latter,43.3 MByte were the actual compressed sensor data, corresponding to 430 MByte of un-compressed data. The total HTTP protocol headers transmitted during the measurementscorresponded to 3.2 MByte of the total transmitted data. The M2M resource structurepaths transmitted were 19.1 MByte, which corresponded to 29% of the total transmitteddata. This shows that protocol headers are only a small part of the total overhead. On theother hand, resources are a large part. If we had used CoAP we estimate approximately1 MByte savings of application protocol headers and a saving of 1.5% of the total trans-mitted data which is not as relevant as one would expect. However, as the resource pathswere large and the HTTP protocol headers were relatively small, the use of CoAP wouldnot provide significative advantages.

54 Design and Evaluation of an interoperable M2M ecosystem
Figure 3.9: Amount of data received per minute at NSCL during the measurements. Theoutline makes the measurement days observable.
3.3.2 Characterization of the E2E Latency
We start by looking into the E2E latency experienced by data produced at a GW thatwould be processed at the Data Processor and then delivered to the openEHR using theM2M middleware. E2E latency can be split into the latencies between neighbor systemcomponents. Figure 3.12 shows the latency splits between the entities that compose theE2E latency. We decomposed the E2E in three parts: the latency between M2M GWand NSCL, the latency between NSCL and Data Processor, and the latency between DataProcessor and openEHR:
OWDE2EA = OWDGW,NSCL
A +OWDNSCL,DPA +OWDDP,EHR
A
The average application-level latency between an M2M GW i publication and therespective acknowledgement from NSCL is 0.9671 sec.
The average application-level latency of a notification from NSCL to Data Processor is0.01382 sec. The average application-level latency of a publication from Data Processorto openEHR is 0.3130 sec. The last value is obtained by the averaging the time differencesbetween the application layer timestamps of the reception of the k notification at openEHRand of the transmission of the k publication at Data Processor. This latency shows thatmessage passing between services can be a large component in the user-perceived latency.
In our system, a Ping probing between Data Processor and NSCL had an RTT averageof 5.7 milliseconds, and a Ping probing between NSCL and openEHR had an RTT av-erage of 2.0 milliseconds. We see that the latency between services OWDDP,EHR
A , which

3.3 System Evaluation 55
Figure 3.10: Comparison between the time each gateway was running and the actualactive time when it was collecting sensor data and transmitting.
includes the latency impact of the broker and the applications, extends the latency esti-mated by Ping by 8000%. This shows that, although Ping is an invaluable tool for havinga first impression of network latencies, it is not representative of actual application-levellatencies.
The latencies that compose the E2E latency follow a normal distribution, verifiedusing One-sample Kolmogorov-Smirnov [Kol33, Smi48] and Lilliefors [Lil67] normalitytests. Thus, the average application layer E2E latency is the sum of the average of theselatencies:
OWDE2EA = 0.9671+0.0138+0.3130 = 1.2939 sec
Latency between M2M GWs and NSCL makes up for 75% of the total E2E latency.
3.3.3 Quantification of the Impact of the Broker
The sum of the average latencies between kernel- and application-levels and betweenapplication- and kernel-levels of NSCL, plus the time for processing the subscriptions,gives us an estimate of the NSCL forwarding latency, i.e., the latency introduced by NSCLreceiving and forwarding data:
OWDNSCLForward = OWDNSCL
K,A +OWDNSCLProc +OWDNSCL
A,K

56 Design and Evaluation of an interoperable M2M ecosystem
Figure 3.11: Amount of HTTP data sent and received at each gateway.
where OWDNSCLProc is the average latency of the NSCL application for processing subscrip-
tions (publications and notifications). We observe that the average latency between kernel-and application-levels of NSCL when receiving publications on the mId interface is oneorder of magnitude smaller than when receiving publications on the mIa interface. There-fore, we quantify the impact of the broker taking into consideration the two situations inseparate. If we consider publications received only on the mId interface:
OWDNSCLmIdForward =
OWDNSCLmIdK,A +OWDNSCL
Proc +OWDNSCLmIaA,K =
0.0106+0.0068+0.0074 = 0.0248 sec
while for publications received only on the mIa interface:
OWDNSCLmIaForward =
OWDNSCLmIaK,A +OWDNSCL
Proc +OWDNSCLmIaA,K =
0.1399+0.0068+0.0074 = 0.1541 sec
Application-level processing and forwarding at the NSCL alone introduces on average atleast 25 milliseconds of latency for publications received on the mId interface, but can be≈ 520% larger for publications received on the mIa interface. Considerable differencesbetween forwarding latencies in different interfaces can occur, and they depend of spe-cific broker implementations. Thus, the impact of the broker forwarding latency should

3.3 System Evaluation 57
Figure 3.12: CDF of the average application-level latency between the entities that com-pose the E2E latency.
be always measured separately in different interfaces to provide realistic performanceguarantees. Additionally, we see that service composition via broker may add significantlatency to the application response time, even if the broker is not overloaded.
3.3.4 Impact of Mobility
Mobility is inherent to any mobile communication system. Mobility introduces han-dovers, increase of packet loss, and link failure. Figure 3.13 shows the average application-level latency between M2M GW publications and reception at NSCL and the traveleddistance per measurement day for each GW. Average latency varied between close to halfsecond and one and half seconds. We observe a similar trend between the magnitude ofthe traveled distance and the average latency experienced for each GW. We obtain 0.67(n = 10, p < 0.04, 95% CI: 0.068− 0.914) for Pearson’s correlation coefficient [Pea95]between traveled distance and latency values. On the other hand, M2M GW4 and M2MGW7 were located 300 km apart from the rest of the gateways during measurements. Buttheir average experienced latency does not differ from the global average, though theyfollow the same trend of mobility.
These results indicate that the average latency values between M2M GWs and NSCL1) depend on the M2M GW mobility; and 2) are independent of the physical distancebetween gateway j and the NSCL for the considered distances. We assume that this ob-servation is mainly due to the selection of GPRS and/or vertical handovers introduced bythe increase of mobility; however, we do not have enough data to confirm this assumption.

58 Design and Evaluation of an interoperable M2M ecosystem
Figure 3.13: Average application-level latency between M2M GW publications and re-ception at NSCL and the traveled distance per measurement day for each GW.
3.3.5 Quantification of the Impact of the Promotion Delay
We study the impact on the E2E latency of the gateway’s network interface state at themoment when the application schedules transmission by quantifying the impact of thepromotion delay of the access network, under controlled measurements. The promotiondelay is the time needed for the network to allocate network resources to the gateway’snetwork interface. Although other works [QWG+10, HQG+12] have characterized pro-motion delay, we cannot apply it to our measurements as different networks carriers adoptdifferent state machine models with varied parameters. To complement our results, wealso quantify latencies between M2M GW and NSCL as well as expectable E2E latenciesfor different access networks. Thus, we performed additional measurements for differentaccess networks using a single gateway and following a different procedure for transmis-sions, depicted in Figure 3.14. Now, the M2M GW is completely static and it is not usedfor any personal use which eliminates any background traffic. The stationariness reducespossible random delays originated from mobility. The M2M GW transmits periodicallya set of 5 publications, each one transmitted only after the reception of the acknowledge-ment of the previous publication, followed by a period of time without any transmissionsto guarantee the NIC returns to the Idle state.
We measured using a Wi-Fi connection to a high-speed fixed backbone, a 2G GSM/G-PRS cellular network, a 3G UMTS cellular network, and a 4G LTE cellular network, allof the same Internet provider, for almost two hours, and we acquired the application-levelRTT between the M2M GW and NSCL. All cellular networks had 2 gateways betweenthe base station and the Portuguese Internet eXchange (GigaPIX), the location where dif-

3.3 System Evaluation 59
Ack
M2M GW
NSCL
Wait
Time
Ack
Ack
Ack
Ack
Ack
Ack
Ack
Ack
Publi
catio
nAc
k
Time
...
Publi
catio
n
Publi
catio
n
Publi
catio
n
Publi
catio
n
Publi
catio
n
Publi
catio
n
Publi
catio
n
Publi
catio
n
Publi
catio
nFigure 3.14: Message sequence to measure the impact of the gateway’s network interfacestate at the average application-level RTT between the M2M GW and NSCL in a staticand controlled environment.
Figure 3.15: Average application-level RTT between the M2M GW and NSCL for thefirst and the subsequent four publications of each sequence for Wi-Fi, GPRS, UMTS, andLTE, in a static and controlled environment.
ferent IP networks exchange traffic.
The first publication of each set is affected by the promotion delay. The remainingpublications (2-5) of each set are not affected by the promotion delay. The results areshown in Figure 3.15. Overall, we can observe there is a significant difference betweenthe average RTT of the publications affected by the promotion delay and the average RTTof the publications not affected by the promotion delay for all technologies. The averageRTT using GPRS was the highest for the publications affected by the promotion delay,followed by UMTS, and finally LTE and Wi-Fi. Wi-Fi and LTE offer much lower averageRTT (almost 1 second less) than 2G and 3G cellular networks. We can observe that theTCP three-way handshake, as expected [SCGM14], is not responsible for the high averageRTT, since it would affect all technologies in a similar way. In any case, alternatives tothe TCP three-way handshake could be the use of UDP and CoAP. These findings are inconformity with [HQG+13], [Gri13], and [XHW+11] that argue that network access in2G and 3G dominates overall E2E latency.
Keeping the interface state on and eliminating the promotion delay allows to reduce

60 Design and Evaluation of an interoperable M2M ecosystem
Table 3.4: Measured promotion delay for Wi-Fi, GPRS, UMTS, and LTE, in a static andcontrolled environment.
Wi-Fi GPRS UMTS LTE
0.1066 sec 0.6812 sec 0.9952 sec 0.3249 sec
latency for all technologies. Table 3.4 shows the measured promotion delay. These valuesare in conformity with previous works which obtained promotion delay values of approxi-mately 0.080 seconds for Wi-Fi, 1 second for GPRS, 2 seconds for UMTS, and 0.260 sec-onds for LTE [QWG+10, HQG+12], respectively. While our results differ in magnitudefor GPRS and UMTS, the ratio between them is similar to previous work. Nevertheless,this confirms that it is not advisable to reuse network time parameters across differentnetworks.
The average latency between M2M GW and NSCL, when the gateway’s interfacestate is On and Idle at the moment when the application schedules transmission, for thedifferent technologies is presented in Table 3.5. Overall, E2E latencies using Wi-Fi staybelow 0.5 seconds for both scenarios, and E2E latencies using UMTS and LTE are below0.5 seconds only for an On state. E2E latencies using GPRS and UMTS are clearly above1 second for an Idle state. Furthermore, the access network does not dominate the E2Elatency in any case when using Wi-Fi.
Applications with large transmission periods or aperiodic transmissions, like moni-toring/sensing or event-based applications, do not drive the network interface to be con-stantly on and suffer promotion delay at every network access. Therefore, they will ex-perience latency values between the M2M GW and NSCL similar to the average latencymeasured for the publications affected by promotion delay. For these type of applications,the access network will dominate the E2E latency. On the other hand, applications withsmall transmission periods can drive the network interface to be constantly on and donot suffer promotion delay. Thus, they will experience latency values between the M2MGW and NSCL similar to the average latency measured for the publications not affectedby promotion delay. In this case, the dominant part of the E2E latency is the latencybetween NSCL, Data Processor, and openEHR, i.e., the latency between services, whenconsidering low latency technologies as LTE, Wi-Fi, or even UMTS.
The network access plays an important role even for applications with small transmis-sion periods when considering high latency technologies, such as GPRS. Nevertheless,the average latency values measured for the publications without promotion delay usingGPRS approximate the ones measured for the publications with promotion delay using

3.4 Discussion and Important Observations 61
Table 3.5: Average application-level latency between the M2M GW and NSCL when thegateway’s interface state is On and Idle for Wi-Fi, GPRS, UMTS, and LTE, in a static andcontrolled environment. Right column shows the expectable E2E latency for the samescenarios by including the latency between the rest of the entities that compose the fullapplication.
Wi-FiOWDGW,NSCL
A,ON = 0.0617 sec OWDE2EA,ON = 0.3885 sec
OWDGW,NSCLA,IDLE = 0.1683 sec OWDE2E
A,IDLE = 0.4951 sec
GPRSOWDGW,NSCL
A,ON = 0.3551 sec OWDE2EA,ON = 0.6819 sec
OWDGW,NSCLA,IDLE = 1.0363 sec OWDE2E
A,IDLE = 1.3631 sec
UMTSOWDGW,NSCL
A,ON = 0.1344 sec OWDE2EA,ON = 0.4612 sec
OWDGW,NSCLA,IDLE = 1.1296 sec OWDE2E
A,IDLE = 1.4564 sec
LTEOWDGW,NSCL
A,ON = 0.1032 sec OWDE2EA,ON = 0.4300 sec
OWDGW,NSCLA,IDLE = 0.4281 sec OWDE2E
A,IDLE = 0.7549 sec
LTE. Furthermore, they are considerably smaller than the average latency values for pub-lications with promotion delay measured using UMTS.
3.4 Discussion and Important Observations
3.4.1 Discussion
As M2M standards are usually a one-size-fits-all and telcos need to guarantee averageservice, latency serves as a performance indicator. We showed that it is possible to providean IoT service composition on top of standards in a context of mobility; however, the highE2E latency observed can disrupt user experience. We observed average E2E latency forthe IoT service composition during the mobile pilot of roughly 1.3 seconds. This valuefalls near estimations obtained in [NK11], where E2E latency between a M2M GW anda single M2M application using an LTE network could reach up to 1.5 seconds. Thus,for interactive applications that involve a response from a service on the network domainto a mobile device, the expected response time could be twice this much, with impacton the user experience. High average application-level RTT between M2M GWs andNSCL additionally means that devices will have their network interface powered on moretime, as it does not return to an Idle state between transmission and reception of data.

62 Design and Evaluation of an interoperable M2M ecosystem
Ultimately, this leads to higher battery consumption [HQG+12, SJL+13]. We also showedthat Ping is not an admissible tool for estimating latency between services.
We identified the access network of the gateway as the main bottleneck. According toour results, E2E latencies between a smartphone gateway and cloud hosted services varylargely and can exceed 1 second. Also, they depend on the gateway’s network interfacestate due to promotion delay and mobility. Nevertheless, further research with a largernumber of users should be conducted to better characterize the impact of mobility on theapplication latency. Critical applications are latency sensitive and demand low latency.If we consider that certain e-health applications may tolerate up to 1 second of E2E la-tency, such as for ECG data [GHSC+05, SKM10, IT02], then, according to Table 3.5, wejust cannot use GPRS or UMTS for infrequent transmissions that may lead to idle states.However, e-health applications with stricter E2E latency requirements, such as 500 mil-liseconds [SLD+15], can face latency problems if any type of cellular networks is to beused.
IoT applications should carefully coordinate the network access for latency perfor-mance. In every transmission, when radio devices have the network interface idle, theymust synchronize and negotiate radio resources with the nearby radio tower. Even thoughlarge transmission periods are associated with a lower battery consumption, time require-ments can be compromised due to latency in the access network introduced by the promo-tion delay. Moreover, the extent of the promotion delay depends on the technology used.In case time requirements need to be guaranteed to, for example, detect or react to alarmsituations, the solution can be to maintain the interface on by using TCP SYN.
Further latency occurs at the core network as packets must flow from the radio towerto the packet gateway, enhanced by the restricted routing topology of cellular networksobserved in [XHW+11]. This advises locating content servers inside cellular networks oras close as possible to the packet gateway. However, in an open ecosystem, there is nodesire to guarantee that services to be composed will be located inside a single cellularoperator’s network. An alternative may be the availability of multiple peering points inthe cellular backbone, with the inherent costs and challenges.
LTE replaces the two-layered radio access network architecture of 3G into a single-layered architecture reducing overall latency [HQG+12]. Future IoT applications formobile scenarios should adopt lower latency cellular networks, such as LTE, to provideservices with real-time requirements. However, recent LTE measurements showed thatit is less energy efficient during the Idle state and for transferring smaller amounts ofdata [HQG+12]. Nevertheless, in scenarios of heterogeneous networks, the exploitationof low latency and power efficiency trade-offs offered by most wireless networks will bemandatory. Thus, it is advisable to enhance the networking API of mobile devices with

3.4 Discussion and Important Observations 63
the possibility to choose among available connectivity opportunities, and/or to requestspecific service guarantees, exploring service level awareness that are based on differenttraffic modes [Gro16].
Advances in 5G cellular networks [ABC+14], namely a combination of NetworkFunction Virtualization (NFV) with Software Defined Networking (SDN) and offloadingto Wi-Fi, are certainly going to be part of the solution to reduce E2E latency. While NFValone introduces additional sources of latency through the virtualization layer [ALT14,ETS14b, BKH+14], the use of network slicing as a form of network virtualization [FRZ14]can make the deployment of virtual network functions (VNFs) in separate networks pos-sible, with separate configurations and network topologies, optimized for different typescommunications, such as M2M [Eri14]. Different latencies can be achieved with the samephysical infrastructure by placing network functions accordingly [Eri15, HNXC15], asVNFs can be placed near data centers or close to base stations. Nonetheless, VNFs can beenhanced by the use of small scale data centres deployed in selected places along the net-work operator infrastructure achieving higher efficiency [Eri15]. In this context, deviceand application-dependent provisioning could be enabled through a mobile networkingAPI that enables more expressiveness than sockets, and middleware APIs that also allowQoS differentiation, which current standards do not.
Finally, the paradigm shift envisioned by the Tactile Internet, providing ultra-reliableand ultra-responsive connectivity, will force a transition from LTE to 5G communicationsto achieve the desired RTT in the order of 1 millisecond [Fet14, MCRV16, SAD+16,ADA+17]. This paradigm shift may become a key enabler of real-time interactive systemsand allow the development of new and innovative IoT applications with smaller timerequirements.
3.4.2 Important Observations
In this section, we present important observations from designing and implementing thisservice composition that we believe to be useful for other researchers and practitionerswhen developing IoT applications.
• Standardization: M2M standardization foster the emergence of IoT applications byproviding interoperability, as discussed previously. Standardization and interoper-ability allowed us to create M2M libraries for use in different machines, while sav-ing development and deployment time. In this concrete case, the NAlib at openEHRwas deployed by a developer which had no familiarity with M2M standards; how-ever, the NAlib and its functionalities allowed a fast deployment and integration ofthis NA;

64 Design and Evaluation of an interoperable M2M ecosystem
• Access Limitations: We faced several access limitations to different parts of thesystem, e.g., having access for enabling services, such as NTP or TCPDUMP, oropening TCP ports for receiving notifications. In IoT systems, it is unlikely thatanyone will have full access to all systems. So, performance evaluation of IoTsystems must design experiments to deal with the limitations of each system;
• Application Design: Developers must be aware that data collection from a smart-phone’s BT or internal sensors can have a significant impact on battery life. Eventhe choice between using Random Access Memory (RAM) and hard drive to storesensor data can have impact on battery consumption [PRP+16]. Therefore, applica-tion developers need to pay close attention to resource usage optimization. The con-strained nature of devices and networks introduces trade-offs, such as transmissionfrequency and battery consumption and the specific application time-requirements;
• Pilot study design: During measurements, users experienced some sensor devicemalfunctioning which caused the time differences between operation and actualcollection and transmission, which ultimately led to short or even null periods ofoperation. A previous study that assessed the feasibility of continuous stress mea-surement using wireless physiological sensors [RBA+14] observed a significantlearning effect after the first week of use. However, two differences to our study areevident. In that study, users had to sporadically interact with the smartphone, andwere monetarily compensated. Our application is designed to be non-intrusive andthe M2M middleware intended for reduced or no human intervention. Therefore, itwas easy to "forget" the application. Moreover, all participants were volunteers anddid not receive any form of compensation. For future implementations we adviseresearchers to add control mechanisms to assure data quality locally and providefeedback/notification of possible malfunctioning for users. Finally, some form ofuser interaction or incentives for participation increases the engagement of partici-pants or users.

Chapter 4
Modeling and Optimization of PacketTransmission Scheduling in M2M
Currently, smartphones are mainly used for other purposes such as Web browsing, so-cial networking, phone calls, etc. Battery capacity is quite moderate compared to theincrease of the complexity due to new hardware and services [PFW11]. This has ledto numerous studies on energy estimations and measurements of mobile devices to un-derstand energy consumption of mobile applications as well as of wireless network in-terfaces [PHZ+11, PHZ12, DWC+13, BBV09, HQG+12, SSM09a]. The use of smart-phones as M2M GWs can have a considerable impact on the smartphones’ usability andintroduce undesirable battery depletion due to network accesses, as shown previously inthis document. From a usability perspective, any additional battery depletion caused bythe gateway functionality should remain unnoticed, or nearly so. Several studies havebeen conducted on battery recharge patterns [FDK11, BRC+07, TSLX14, RQZ07], and,for example, users that recharge battery based on battery levels notice differences in therecharging cycle of the phones and tend to be irritated by the increase of energy consump-tion [TSLX14].
This means that transmission of sensor information should be the most energy efficientas possible. Nevertheless, each transmission can be performed with several different tech-nologies, each with different power consumption profiles. Furthermore, latency betweenM2M GWs and broker plays an important role in the fulfillment of time requirements,and it depends on the technologies used for transmission. Transitions between differentnetwork interface states have delay and power consumption costs associated with them.Therefore, IoT applications in which data has deadlines need to carefully coordinate thenetwork access so that network interface state transitions do not compromise the timelydelivery of data, taking into consideration that different types of data might have different
65
66 Modeling and Optimization of Packet Transmission Scheduling in M2M
deadlines [SLD+15, SMK+17]. For instance, in interactive applications, a mere one-second delay when downloading or uploading content has a significant negative impacton the user experience [Eri17]. Figure 4.1 depicts the application scenario.
The problem of energy consumption of network interfaces in mobile phones has beenaddressed in recent works, mostly by adjusting the tail time, that is, the time to switchfrom the On state to the Idle state [BBV09, XZH+15, ZZCA13], and by exploring statetransitions for the specificities of Web browsing in [ZHZC15]. To maximize the batterylife of smartphones in an IoT context, transmission scheduling should be employed tominimize the energy consumption, while providing QoS to guarantee that data meets spe-cific service requirements like deadline. In [HC14a], the authors proposed the reduction ofthe energy consumed during the Tail state in cellular networks by aggregating data trafficof multiple nodes using their peer to peer interfaces (BT or Wi-Fi direct), and the prob-lem was formulated as finding the best task schedule to minimize energy consumption. Inanother study, the same authors have shown that there can be considerable throughput dif-ferences between cellular networks at the same locations, and use the same interfaces fornode collaboration in order to save energy consumption [HC14b]. In [GHY+15], the au-thors proposed energy efficient computation offloading algorithms for cellular networks,while analyzing the effect of the tail problem in the offloading decision and aiming tominimize the energy consumption of mobile devices.
Many studies regarding energy-aware task scheduling have been conducted for real-time systems, specially research related to processors [BMAB16, AMMMA04, RMM03a,RMM03b]. In [SC01], the authors proposed a scheduling for minimizing the energy con-sumption in processors for periodic tasks while guaranteeing the fulfillment of the tasksdeadlines. They also introduced a low-energy earliest deadline first (LEDF) schedulingalgorithm, a heuristic based on EDF, that schedules tasks in the option that consumes lesspower. We use this heuristic for comparing scheduling performances in this work. Theproblem of energy-aware task scheduling has also been studied in heterogeneous proces-sor systems [WLC+14, ZBHC15]. In [SC05], the authors introduced a pruning-basedoffline Input/Output (I/O) device scheduling algorithm which determines for a given setof jobs the start time such that the energy consumption of the I/O devices is minimized,ensuring that no real-time constraint is violated.
These and other works in, or applicable to, the area of transmission scheduling in mo-bile heterogeneous networks tackle the problem of energy consumption. However, to thebest of our knowledge none combines a model of network interfaces state transitions, theconcurrent use of wireless networks, and detailed models of latency and power consump-tion in order to model and evaluate packet transmission scheduling. In addition, onlysuch model can allow us to use data mining techniques to develop a packet transmission

Modeling and Optimization of Packet Transmission Scheduling in M2M 67
Network Applications
M2M GW Broker
Sensors
Figure 4.1: Application scenario. Sensor information is collected by M2M GWs andforwarded to a broker that notifies all Network Applications interested in receiving thedata.
heuristic that minimizes energy consumption with near optimal performance.
Here, we model packet transmission scheduling in LP. The model answers the ques-tion: given a set of available networks and a number of packets to be transmitted without
missing any deadlines, what packet transmission scheduling should the M2M GW do to
optimize a given objective? The model delivers a packet schedule of when and on whichwireless network to transmit each packet in order to optimize, for example, the total en-ergy consumption or the total packet waiting time. It decides likewise the state at whicheach network interface is along the scheduling period. The model exploits the data char-acteristics, the network characteristics, the application deadlines, and the heterogeneousscenario, as depicted in Figure 4.2. We can thus understand what improvements canenergy- and latency-aware packet transmission scheduling introduce to M2M communi-cations. Additionally, the model also allows to understand the factors that might cause awireless network to become more competitive, or to assess the impact of modifications inthe network interface performance.
This model can be used to inform packet scheduling heuristics that improve the us-ability of smartphone M2M GWs. Furthermore, as the decision version of integer LP isNP-complete, its implementation in M2M GWs can be unfeasible. In this work, we de-sign a transmission heuristic by taking into consideration the knowledge obtained from theenergy-optimal scheduling obtained from the model in a wide set of different scenarios.We evaluate the performance of the scheduling minimizing the total energy consumptionagainst the EDF scheduling algorithm, the LEDF heuristic, and our own heuristic, for awide range of scenarios. We quantify the average energy consumption, average packetwaiting time, average packet slack time, and average execution time, that can be obtainedfollowing each scheduling.
We summarize the contributions of this chapter as follows:

68 Modeling and Optimization of Packet Transmission Scheduling in M2M
Sensor 1
Sensor ...
Sensor Z
Sche
duler
Network 1
Time
P11P12
P13
P31
P32P33
P32P31
P13
P12P11
P33
SizePeriodDeadline
Sensor
Heterogeneous Networks
ThroughputLatencyInterface delay and cost
Network
Network 2
...
Network K
Figure 4.2: Packet transmission scheduling. M2M GWs schedule packet transmissionsto, for example, minimize the energy consumption or packet waiting times while guaran-teeing the timely delivery of data. M2M GWs are multi-homed.
• We present the packet transmission scheduling model in LP. This model is a usefultool for analyzing and comparing network performance under different configura-tions, and for devising schedules that can minimize smartphones’ battery depletion;
• We use data mining techniques to devise a packet transmission scheduling heuristicthat minimizes the energy consumption. This heuristic performs several degreesof magnitude faster than the energy-optimal scheduling, for the considered set ofscenarios. We show that the packet schedules obtained from the model and theheuristic are similar, as well as the resulting network interface state behavior;
• We evaluate the performance of different scheduling algorithms, optimal and heuristic-based, for different scenarios. We show that minimizing the energy consumptioncan reduce the energy consumption in 7% when compared to the EDF scheduling,and nearly 3% when compared to the energy-aware LEDF heuristic. On the otherhand, it increases the packet waiting time and decreases the packet slack time. Itperforms only 0.03% better than our heuristic, but it takes larger times for exe-cution, showing that the heuristic can be a good alternative for implementation inM2M GWs.
The rest of the chapter is structured as follows. We present the assumptions of ourmodel in Section 4.1.1, and we present the model itself in Section 4.1.2. In Section 4.2,we present the scenarios and settings that we consider for this work. We design our trans-mission heuristic that seeks to minimize the energy consumption in Section 4.3, and weshow the performance evaluation between different scheduling objectives in Section 4.4.We discuss results in Section 4.5.
4.1 Modeling Packet Transmissions 69
4.1 Modeling Packet Transmissions
4.1.1 Model Assumptions
We make the following assumptions to build the model:
• We consider a discrete notion of time, i.e., time is slotted equally;
• No preemption is allowed. If a network starts transmitting a packet, then the net-work must complete its transmission;
• Each packet must be transmitted only once on a single network;
• Each network can only transmit one packet at a time;
• Packets arrive at the start of each slot, and thus they can be transmitted immediatelyin that slot;
• We assume the M2M GW allows concurrent packet transmissions on heterogeneoustechnologies. In case the M2M GW does not possess such capabilities, an additionalconstraint limiting the transmission to only one network would be necessary;
• The network and data characteristics are known a priori for the entire schedulingperiod. They can vary over the scheduling epoch, but they must be defined andcharacterized a priori, e.g., the latency between M2M GW and broker can varyaccording to a time distribution. This allows guarantees and optimal scheduling. Wealso assume throughput and latency between M2M GW and broker accommodatepossible packet re-transmissions;
• Network interfaces must be in one of four different states (Idle, Promotion, On, andTail) at a given time slot. The Promotion and Tail states occur after the Idle and On(at the end of a packet transmission or a set of consecutive packet transmissions)states, respectively. Figure 4.3 shows the possible transitions between states. Morestates can be introduced into the model as long as the state machine is updated;
• In the Idle state, the network interfaces go to a complete idle mode in which thepower consumption is static (can be 0 or different) and there is no periodic wakeup;
• The network interfaces can be at different states at the start and they do not have toreturn to the Idle state at the end of the scheduling period;

70 Modeling and Optimization of Packet Transmission Scheduling in M2M
On
Idle
TailPro
ttail
tpro
Figure 4.3: Network interfaces state machine. The transitions from Idle and On states toPromotion and Tail states, respectively, occur instantaneously. For example, if in a giventime slot the interface is at Idle state, it can be at Promotion state in the next slot, as long asthere is a packet to be transmitted after the promotion time. The Promotion state (duringthe promotion time) as well as packet transmissions cannot be interrupted. Transitionsfrom the Tail state back to the On state are possible if there is a packet to be transmitted.
• All networks have the same transmission time slots, i.e., all networks can schedulepackets at the start of each (smallest unit) time slot considered. If different trans-mission time slots are to be used in different networks, an easy solution is to restrictpacket allocation only to those slots for each network;
• We consider the data buffer size to be large enough to hold all data until transmis-sion. If necessary, further model improvements can include a limitation of the totalamount of data that can be maintained at a given time.
Additionally, the schedule must be feasible. Therefore, there cannot be more sensor loadthan what the available networks can carry. We assume thus the existence of an admissionpolicy to ensure this.
4.1.2 Model Definition
Let us consider a finite set of tasks W = {w1,w2, . . . ,wz} of z sensors. We assume adiscrete notion of time t = kε,k≥ 0, and ε the time unit and the smallest slot size possible.The scheduling is made for a time period of T (e.g., fixed time or the lcm of all periodictasks). Each task is associated with a packet set P = {p1, p2, . . . , pl} which consistsof all l packets of each sensor w ∈ W during T . We consider the total packet set to beJ = { j1, j2, . . . , jm} which consists of all l packets from all z sensors. Each j packetis characterized by the arrival time A j at the M2M GW, deadline d j at the destination(broker), and size L j. Each packet can be transmitted in a set N = {n1,n2, . . . ,nk} of k
networks. Each network n has the following parameters: the uplink throughput T hrn, thelatency Latt,n between M2M GW and broker using that network at a given time t, and thepower consumption profile Ps,n for each s state where s ∈ S = {0,1,2,3}. The power
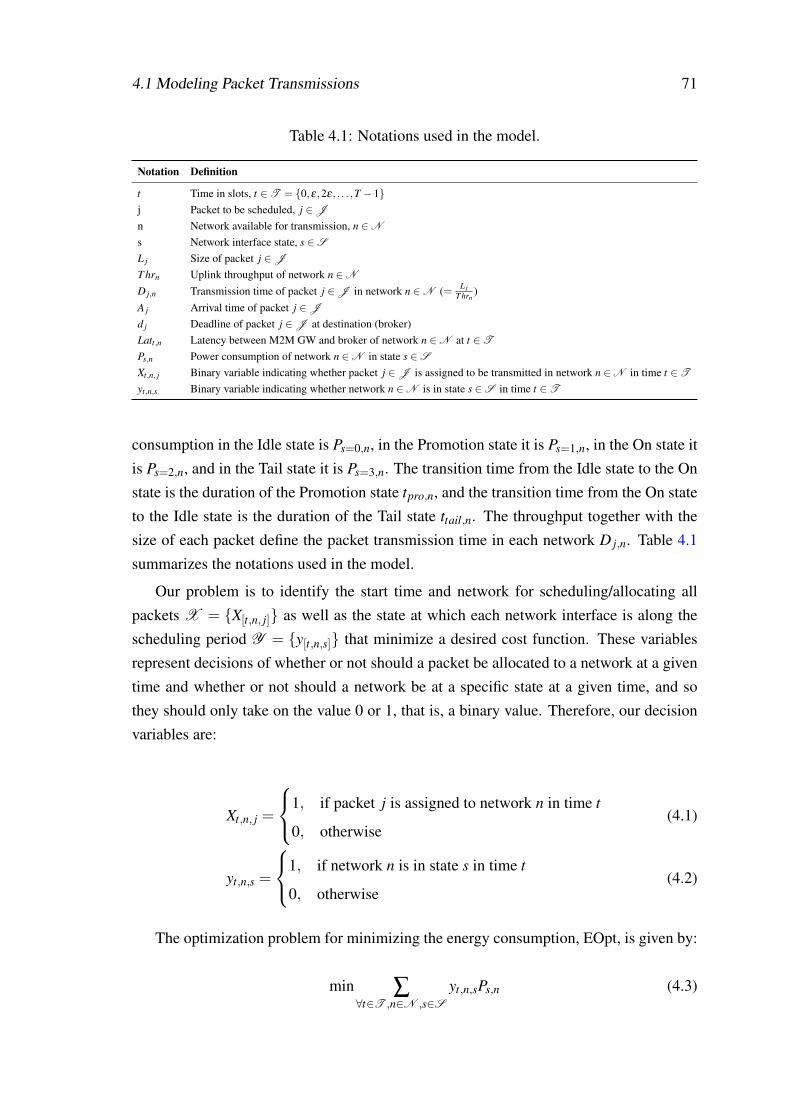
4.1 Modeling Packet Transmissions 71
Table 4.1: Notations used in the model.
Notation Definition
t Time in slots, t ∈T = {0,ε,2ε, . . . ,T −1}j Packet to be scheduled, j ∈J
n Network available for transmission, n ∈N
s Network interface state, s ∈S
L j Size of packet j ∈J
T hrn Uplink throughput of network n ∈N
D j,n Transmission time of packet j ∈J in network n ∈N (= L jT hrn
)A j Arrival time of packet j ∈J
d j Deadline of packet j ∈J at destination (broker)Latt,n Latency between M2M GW and broker of network n ∈N at t ∈T
Ps,n Power consumption of network n ∈N in state s ∈S
Xt,n, j Binary variable indicating whether packet j ∈J is assigned to be transmitted in network n ∈N in time t ∈T
yt,n,s Binary variable indicating whether network n ∈N is in state s ∈S in time t ∈T
consumption in the Idle state is Ps=0,n, in the Promotion state it is Ps=1,n, in the On state itis Ps=2,n, and in the Tail state it is Ps=3,n. The transition time from the Idle state to the Onstate is the duration of the Promotion state tpro,n, and the transition time from the On stateto the Idle state is the duration of the Tail state ttail,n. The throughput together with thesize of each packet define the packet transmission time in each network D j,n. Table 4.1summarizes the notations used in the model.
Our problem is to identify the start time and network for scheduling/allocating allpackets X = {X[t,n, j]} as well as the state at which each network interface is along thescheduling period Y = {y[t,n,s]} that minimize a desired cost function. These variablesrepresent decisions of whether or not should a packet be allocated to a network at a giventime and whether or not should a network be at a specific state at a given time, and sothey should only take on the value 0 or 1, that is, a binary value. Therefore, our decisionvariables are:
Xt,n, j =
1, if packet j is assigned to network n in time t
0, otherwise(4.1)
yt,n,s =
1, if network n is in state s in time t
0, otherwise(4.2)
The optimization problem for minimizing the energy consumption, EOpt, is given by:
min ∑∀t∈T ,n∈N ,s∈S
yt,n,sPs,n (4.3)

72 Modeling and Optimization of Packet Transmission Scheduling in M2M
subject to:
Xt,n, j ∈ {0,1}, ∀t ∈T ,n ∈N , j ∈J (4.4)
yt,n,s ∈ {0,1}, ∀t ∈T ,n ∈N ,s ∈S (4.5)
Xt,n, j ≤ 0, ∀t ∈T ,n ∈N , j ∈J | t < A j||t > T −1−D j,n (4.6)
Xt,n, j +Xq,n,k ≤ 1, ∀(t,q) ∈T ,n ∈N ,( j,k) ∈J | j 6= k, t ≤ q≤ t +D j,n (4.7)
Xt,n, j(t +D j,n +Latt+D j,n,n)≤ d j, ∀t ∈T ,n ∈N , j ∈J (4.8)
∑t,n
Xt,n, j ≥ 1, ∀t ∈T ,n ∈N , j ∈J (4.9)
∑t,n
Xt,n, j ≤ 1, ∀t ∈T ,n ∈N , j ∈J (4.10)
∑s
yt,n,s ≥ 1, ∀t ∈T ,n ∈N ,s ∈S (4.11)
∑s
yt,n,s ≤ 1, ∀t ∈T ,n ∈N ,s ∈S (4.12)
Xt,n, jD j,n/ε ≤q
∑k=t
yk,n,2,∀(t,q,k) ∈T ,n ∈N , j ∈J | q = t +D j,n−1 (4.13)
yt,n,s=2 ≤∑j,q
Xq,n, j,∀(t,q) ∈T ,n ∈N , j ∈ J | t−D j,n +1≤ q≤ t (4.14)
yt,n,s=1 + yt+1,n,s=2−1≤∑j
Xt+1,n, j, ∀t ∈ {0, . . . ,T −2},n ∈N , j ∈J (4.15)
yt,n,s=0 + yt+1,n,s=1−1≤∑j
X(t+1+tpro,n),n, j,∀t ∈ {0, . . . ,T −1− tpro,n},n ∈N , j ∈J
(4.16)
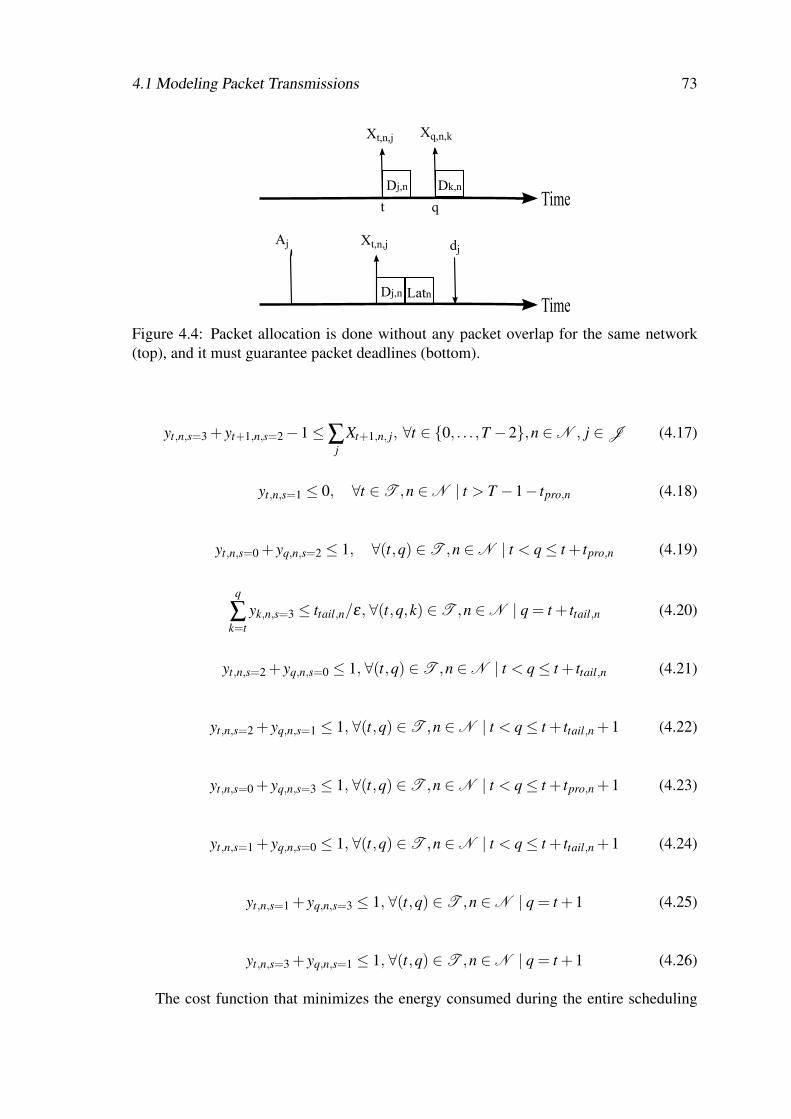
4.1 Modeling Packet Transmissions 73
Time
Xt,n,j
Dj,n
Xq,n,k
t q
Aj
Time
Xt,n,j
Dj,n Latn
dj
Dk,n
Figure 4.4: Packet allocation is done without any packet overlap for the same network(top), and it must guarantee packet deadlines (bottom).
yt,n,s=3 + yt+1,n,s=2−1≤∑j
Xt+1,n, j, ∀t ∈ {0, . . . ,T −2},n ∈N , j ∈J (4.17)
yt,n,s=1 ≤ 0, ∀t ∈T ,n ∈N | t > T −1− tpro,n (4.18)
yt,n,s=0 + yq,n,s=2 ≤ 1, ∀(t,q) ∈T ,n ∈N | t < q≤ t + tpro,n (4.19)
q
∑k=t
yk,n,s=3 ≤ ttail,n/ε, ∀(t,q,k) ∈T ,n ∈N | q = t + ttail,n (4.20)
yt,n,s=2 + yq,n,s=0 ≤ 1, ∀(t,q) ∈T ,n ∈N | t < q≤ t + ttail,n (4.21)
yt,n,s=2 + yq,n,s=1 ≤ 1, ∀(t,q) ∈T ,n ∈N | t < q≤ t + ttail,n +1 (4.22)
yt,n,s=0 + yq,n,s=3 ≤ 1, ∀(t,q) ∈T ,n ∈N | t < q≤ t + tpro,n +1 (4.23)
yt,n,s=1 + yq,n,s=0 ≤ 1, ∀(t,q) ∈T ,n ∈N | t < q≤ t + ttail,n +1 (4.24)
yt,n,s=1 + yq,n,s=3 ≤ 1, ∀(t,q) ∈T ,n ∈N | q = t +1 (4.25)
yt,n,s=3 + yq,n,s=1 ≤ 1, ∀(t,q) ∈T ,n ∈N | q = t +1 (4.26)
The cost function that minimizes the energy consumed during the entire scheduling

74 Modeling and Optimization of Packet Transmission Scheduling in M2M
Xt,n,j
Dj,n
Xq,n,k
t q
Dk,nTime
Xt,n,j
Dj,n
Xq,n,k
t q
Dk,n
Xt,n,j
Dj,n
Xq,n,k
t q TimeDk,n
Time
Figure 4.5: Network interfaces can transmit packets consecutively remaining in the Onstate (center), go to the Idle state between different packet transmissions (left) or remainin the Tail state for a time period shorter than its tail time (right).
period is defined in eq. (4.3). The decision variables are defined as binary in eqs. (4.4)and (4.5), and constraint eq. (4.6) defines that packets cannot be allocated before theirarrival or if there is not enough time to be transmitted near the end of the schedulingperiod in the respective network. Constraint eq. (4.7) forbids overlap between packettransmissions in the same network, and constraint eq. (4.8) guarantees data deadlines, asdepicted in Figure 4.4. Constraints eqs. (4.9) and (4.10) state that packets can only betransmitted once, and constraints eqs. (4.11) and (4.12) limit that each network must be inone and only one state at each time slot. Constraints eqs. (4.13) to (4.17) allow some statetransitions to occur only if there is a packet allocation and define that packet allocationmust occur only in the On state. Constraints eqs. (4.18) and (4.19) limit the Promotionstate, and constraint eq. (4.20) limits the Tail state. Finally, constraints eqs. (4.21) to (4.26)define and limit the remaining transitions between states. Figure 4.5 depicts how networkinterfaces behave for and in between packet allocations.
4.2 Settings
We implemented the LP model in OPL Studio modeling language using the IBM ILOGCPLEX Optimization Studio 12.6.3, running on Windows 10, on an Intel(R) Core (TM)i7-4700HQ [email protected] with 8 GB of RAM and 200 GB of free disk space. Themain changes to the default configuration were: presolve dual setting was set to on, thenode presolve switch was set to perform aggressive node searching, and the MIP variableselection strategy was set to strong branching. We initialized the generator of pseudorandom numbers with a value of 1.
Evaluation of energy- and latency-aware packet transmission scheduling requires know-ledge of the power consumption behavior of actual wireless interfaces as well as latencyassociated to each network. In the following analysis, we consider two networks: Wi-Fiand LTE. In [HQG+12], the authors performed a comprehensive study of Wi-Fi and LTEpower consumptions using a data set of 5-month traces of 20 smartphone users which weuse as reference for the power consumption models, see Table 4.2. They concluded thata linear model fits well transmissions. The power level during transmissions (On state)

4.2 Settings 75
Table 4.2: Power consumption profiles of Wi-Fi and LTE.
Network, State Power Consumption (mW) Duration (ms)
Wi-Fi, Idle 0 -Wi-Fi, Promotion 124 79
Wi-Fi, On 132 + 283 × Thr -Wi-Fi, Tail 119 238LTE, Idle 0 -
LTE, Promotion 1211 260LTE, On 1288 + 438 × Thr -LTE, Tail 1060 11576
depends on the throughput. We use the median uplink throughput of Wi-Fi of 0.95 Mbpsand LTE’s of 5.7 Mbps measured in that work. We assume network interfaces remainwith no power consumption in the Idle state, as previously mentioned.
In the previous chapter, we have characterized latency between smartphones actingas M2M GWs and cloud hosted services in ETSI M2M communications for differentnetworks using controlled and static measurements. We use them as reference for thenetwork latency models. The measured Wi-Fi’s latency between M2M GWs and brokerwas approximately 60 ms, while LTE’s latency was 100 ms. We assume the latencyremains static throughout the entire scheduling period.
We consider the e-health application use case described in Chapter 3. Here we con-sider that the M2M GW collects physiologic and mobility data from three wearable pe-riodic sensors, as illustrated in Figure 4.1. To develop our transmission heuristic as wellas to evaluate the performance of different scheduling algorithms, we proceed to obtainseveral different scenarios.
We consider the minimum time slot size ε to be 10 ms. Smaller time slots, or largerscheduling periods, number of packets, and networks available can be used at the expenseof higher complexity due to the higher number of constraints and variables in the LPmodel. For our analysis, we consider scenarios with an offered load at the M2M GW be-tween 35% and 180% of the available bandwidth of the "slowest" network (Wi-Fi). Thisapproach allows us to explore the effect of the load in the scheduling process as well.To attain the desired load and obtain a wide range of different scenarios, we randomlyand uniformly generate 30 different (unique) configuration scenarios consisting of 1 to 3periodic sensors. We consider the packet size L j to be 7.125 KByte to hold the model asan integer problem without decreasing the time unit. Considering large packet sizes, nev-ertheless, allow the system to be robust against aperiodic or spontaneous packet arrivals,

76 Modeling and Optimization of Packet Transmission Scheduling in M2M
Table 4.3: Parameters used for scenario generation.
Parameter Value/Range
Number of scenarios 60Load (Mbps) 0.333 - 1.710
Sensors 1-3Inter-arrival time (ms) 10-400
Packet Size (KB) 7.125First packet arrival (ms) 1-10
Deadlines (ms) 200 & 400Scheduling Period (sec) 1
ε (ms) 10
even though significant packet sizes can be expected when using HTTPS and REST anddepending of whether or not data compression and aggregation are used. We consider thatthe first packet from each sensor arrives at the M2M GW inside the first 10 ms, and thatthe inter-arrival times (periods) are between 10 and 400 ms.
For a matter of completeness, we also consider two different packet deadlines d j:200 and 400 ms relative to the arrival time A j. Scenarios with packet deadlines muchsmaller than 200 ms would not make sense as the sum of each packet transmission timeand network latency is 110 and 120 ms for LTE and Wi-Fi, respectively. Therefore, weobtain a total of 60 different scenarios. Finally, we consider the scheduling period T tobe 1 second, and, for fairness, we assume the networks were transmitting in the instantbefore the beginning of the scheduling period, i.e., we consider the networks at the firsttime slot are at the Tail state or they can transmit on it immediately. For that, we addedone additional constraint to the model. Table 4.3 resumes the parameters used to generatethe scenarios.
4.3 Packet Transmission Scheduling Heuristic
The minimization of the total energy consumption using the LP model serves as an in-dispensable tool by providing the lower bound on the amount of energy consumed for agiven configuration. However, it is a computationally intensive task to be performed forlarge datasets. Furthermore, as the decision version of integer LP is NP-complete, we seekto understand the packet transmission scheduling decisions and provide a simple heuris-tic that approximates the allocations obtained with EOpt, which minimizes the energyconsumption, but with less complexity and generating close to optimal solutions in poly-

4.3 Packet Transmission Scheduling Heuristic 77
nomial time. Thus, serving as general guidelines that can be followed and implementedin M2M GWs for scheduling packets using current wireless network interfaces.
4.3.1 Feature Selection
Manually designing heuristics for the type of problems this work deals with is imprac-tical, if not impossible, due to the time required for learning the insights of each prob-lem and solution. Nevertheless, one could design a specific heuristic that could outper-form others for a specific configuration. This is known as the "No Free Lunch" theo-rems [WM97, WM05]. There the authors state that any two algorithms are equivalentwhen their performance is averaged across all possible problems. Therefore, the need fora spectra of different configurations as the ones generated in the previous section in orderto assess the performance of a heuristic across all of them.
A good packet transmission heuristic should follow not only the overall energy con-sumption performance of EOpt but also its network interfaces state behavior and packetallocations along the entire scheduling period. First, we need to analyze and characterizethese allocations in order to understand the behavior of the optimal solutions. By findingwhat are the key features that define a specific allocation, we can group them based onsimilarity, i.e., allocations that show the same type of features’ behavior, and comparethem with the ones obtained from EOpt.
The problem of comparing different allocations is to detect time shift variations. Forinstance, even a sequence of network interface states shifted only by one time slot canmake the interfaces behavior of two different scheduling algorithms look very different.Though maintaining the same objective cost, their interface states can differ in severaltime slots along the scheduling period. Therefore, we consider several features that char-acterize the sequences of the network interface states. After some initial analysis, wereached a total of 40 features characterizing the EOpt allocations. These features includethe total and the maximum consecutive time slots where a network interface was at a cer-tain state; the total and the maximum consecutive time slots where both network interfacewere at a certain state; the longest common prefix and suffix sequence of both networks;the number of transitions between each state for each network; and the first and last timeslot when each network transmitted.
4.3.2 Cluster Analysis
Clustering is a unsupervised learning method commonly used for statistical data analysis,and considered as a core task in data mining [HKP12, EC02]. It can be used to discover
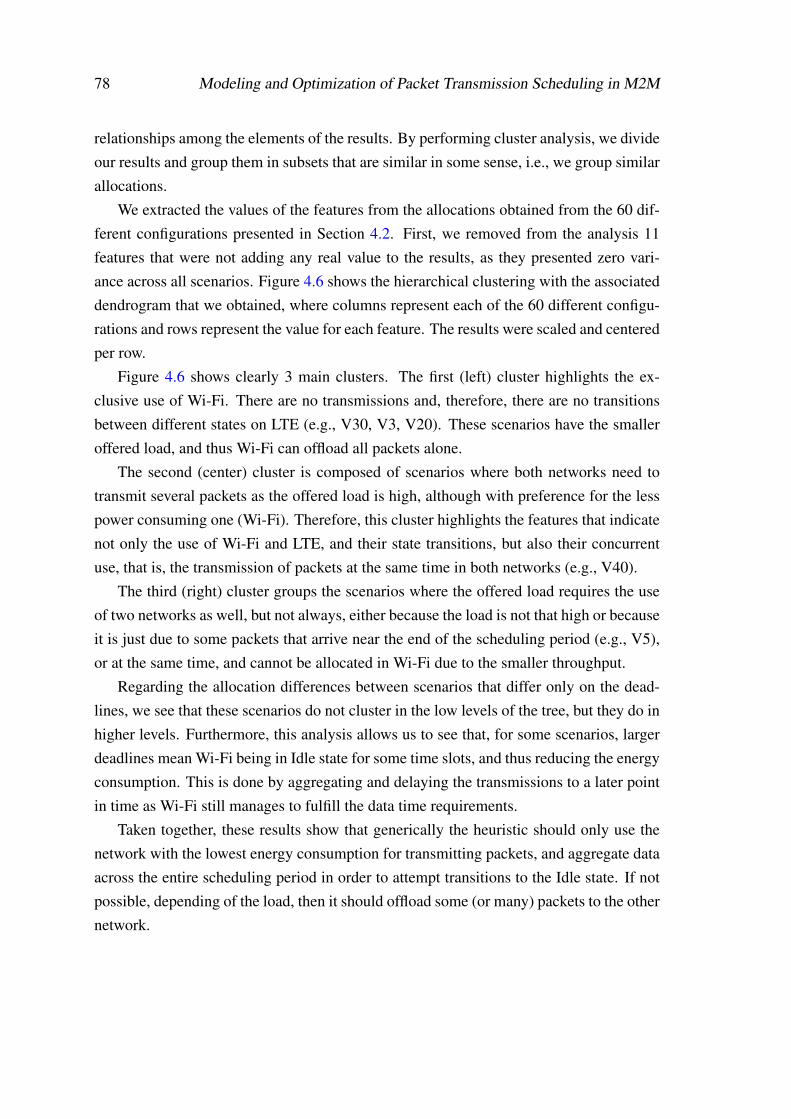
78 Modeling and Optimization of Packet Transmission Scheduling in M2M
relationships among the elements of the results. By performing cluster analysis, we divideour results and group them in subsets that are similar in some sense, i.e., we group similarallocations.
We extracted the values of the features from the allocations obtained from the 60 dif-ferent configurations presented in Section 4.2. First, we removed from the analysis 11features that were not adding any real value to the results, as they presented zero vari-ance across all scenarios. Figure 4.6 shows the hierarchical clustering with the associateddendrogram that we obtained, where columns represent each of the 60 different configu-rations and rows represent the value for each feature. The results were scaled and centeredper row.
Figure 4.6 shows clearly 3 main clusters. The first (left) cluster highlights the ex-clusive use of Wi-Fi. There are no transmissions and, therefore, there are no transitionsbetween different states on LTE (e.g., V30, V3, V20). These scenarios have the smalleroffered load, and thus Wi-Fi can offload all packets alone.
The second (center) cluster is composed of scenarios where both networks need totransmit several packets as the offered load is high, although with preference for the lesspower consuming one (Wi-Fi). Therefore, this cluster highlights the features that indicatenot only the use of Wi-Fi and LTE, and their state transitions, but also their concurrentuse, that is, the transmission of packets at the same time in both networks (e.g., V40).
The third (right) cluster groups the scenarios where the offered load requires the useof two networks as well, but not always, either because the load is not that high or becauseit is just due to some packets that arrive near the end of the scheduling period (e.g., V5),or at the same time, and cannot be allocated in Wi-Fi due to the smaller throughput.
Regarding the allocation differences between scenarios that differ only on the dead-lines, we see that these scenarios do not cluster in the low levels of the tree, but they do inhigher levels. Furthermore, this analysis allows us to see that, for some scenarios, largerdeadlines mean Wi-Fi being in Idle state for some time slots, and thus reducing the energyconsumption. This is done by aggregating and delaying the transmissions to a later pointin time as Wi-Fi still manages to fulfill the data time requirements.
Taken together, these results show that generically the heuristic should only use thenetwork with the lowest energy consumption for transmitting packets, and aggregate dataacross the entire scheduling period in order to attempt transitions to the Idle state. If notpossible, depending of the load, then it should offload some (or many) packets to the othernetwork.

4.3 Packet Transmission Scheduling Heuristic 79
Figure 4.6: Hierarchical clustering with dendrogram showing that the sequences of thenetwork interface states obtained from the 60 different scenarios group together in threemain clusters, considering 29 main features for characterization.
4.3.3 Transmission Heuristic Algorithm
The key to save energy according to the knowledge obtained from the EOpt scheduling isto use only one network if possible and delay transmissions as much as possible in orderto schedule packets consecutively, and thus the heuristic must consider this. However,due to time requirements (deadlines), there will always be a maximum amount of timethat each packet can be delayed. Algorithm 2 presents our heuristic, termed EHeu.
One requirement for the heuristic that is implicit, but is of utmost importance, is thatit should run fast, i.e., it should be less time consuming than EOpt for finding a solution.Therefore, first, our heuristic performs a quick initial packet allocation, where it tries

80 Modeling and Optimization of Packet Transmission Scheduling in M2M
Time
Aj
Aj ≤ t ≤ dj - Dj,n - Latn
Xt,n,j
Dj,n
t
Latn
dj
Figure 4.7: Initial packet allocation near deadline.
t ≤ t pro
Time
ttail ≤ t < tpro + 1+ ttail
Time
Figure 4.8: Optimization (top) and enforcement of the state machine (bottom).
to schedule packets in Wi-Fi as later as possible, as shown in Figure 4.7. If that is notpossible, it will iteratively try one time slot earlier up to the packet’s arrival time. Onlythen, if the allocation to Wi-Fi was not possible, it attempts to allocate the packet inthe other network, LTE. As for the model, packets cannot be scheduled for transmissionbefore they arrive or if there is not enough time for a network to transmit it, and therecannot be packet allocation overlaps. We removed these steps from the algorithm for amatter of simplicity.
The second procedure of the heuristic, depicted in Figure 4.8, enforces the state ma-chine while optimizing the packet allocation. If packets were allocated with a time dif-ference less than the tail time, that is, the time between the end of the first packet andthe start of the second packet is less than the tail time, the heuristic attempts to join thesepackets together, that is, it tries to anticipate the transmission of the latter packet in orderto explore possible Idle states later in time. However, if that time difference is larger thanthe tail time, but less than the amount of time required to move to the Idle state at leastone time slot, it tries to re-schedule that packet, or any other if that one fails, somewhereinside a tail time period after the transmission of the former packet. This same process isapplied to the special case of the first packet.
Finally, the heuristic must allocate the states to each network interface. The heuristicallocates the On state for packet transmissions. For a difference of time between consecu-

4.3 Packet Transmission Scheduling Heuristic 81
Figure 4.9: Left dendrogram contains the hierarchical clustering of the features extractedfrom the EOpt schedules, and right dendrogram contains the hierarchical clustering ofthe features extracted from the EHeu schedules, showing a close resemblance. Baker’sGamma is 0.98 and Fowlkes-Mallows index is 0.767 for k = 7.
tive packet allocations less than tail time, the interface remains at the Tail state; otherwise,the heuristic allocates the Tail, Idle, and Promotion states accordingly.
We compare how similar the clusters of the features obtained from EOpt alloca-tions are from that of EHeu allocations for all 60 scenarios. Figure 4.9 shows this vi-sually [Gal15]. We obtained 0.98 of Baker’s Gamma correlation coefficient. Baker’sGamma, ranging from -1 to 1, is a measure of similarity between two trees of hierarchicalclustering [Bak74]. No statistical similarities are given by values close to 0. It is definedas the rank correlation between the stages at which pairs of objects combine in each ofthe two trees [Gal15]. However, this measure is not affected by the height of a branch,

82 Modeling and Optimization of Packet Transmission Scheduling in M2M
but only of its relative position compared with other branches.For a matter of completeness, we also computed the Fowlkes-Mallows index [FM83].
It is formed by cutting the two hierarchical trees and counting the number of matchingentries in the k clusters in each tree, taking into consideration not only the position butalso the height. This index can range from 0 to 1, where 1 implies greater similaritybetween hierarchical clusterings. We obtained an Fowlkes-Mallows index of 0.767 at acut tree of k=7.
We can conclude that there are similarities between the values of the features extractedfrom EOpt and EHeu schedules, showing resemblances between the two allocations. Theperformance evaluation and comparison between EOpt and EHeu are presented in thenext section.
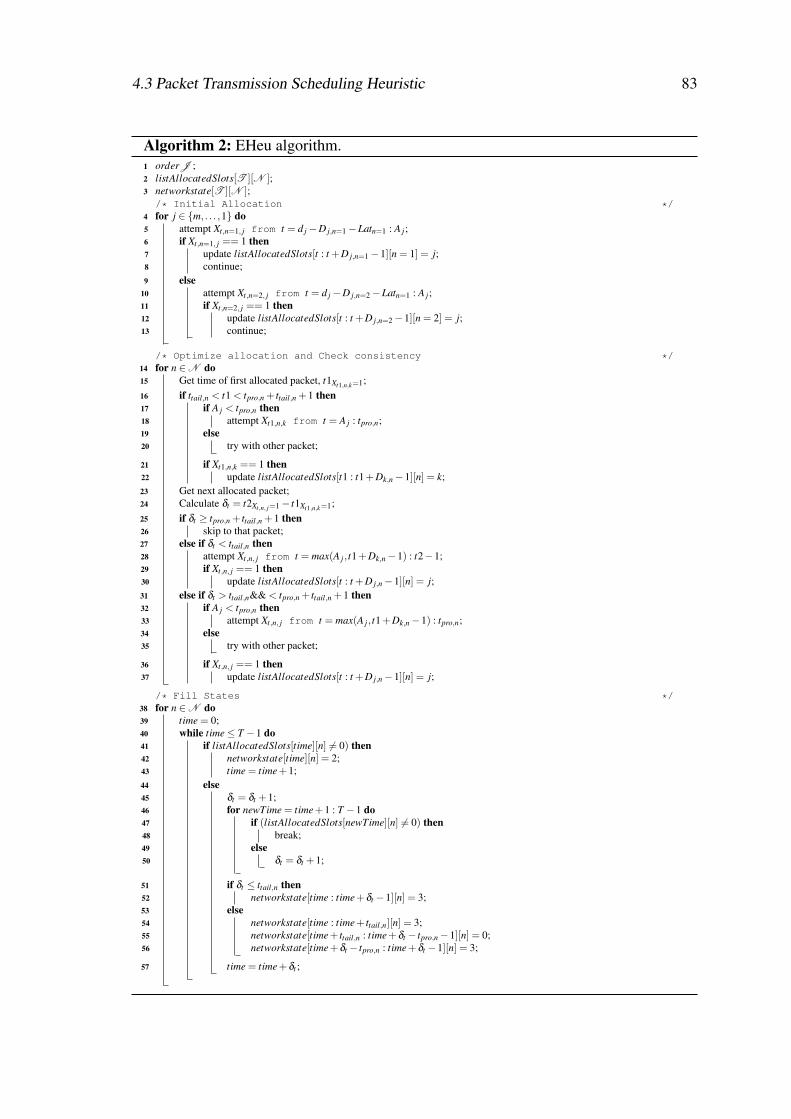
4.3 Packet Transmission Scheduling Heuristic 83
Algorithm 2: EHeu algorithm.1 orderJ ;2 listAllocatedSlots[T ][N ];3 networkstate[T ][N ];/* Initial Allocation */
4 for j ∈ {m, . . . ,1} do5 attempt Xt,n=1, j from t = d j−D j,n=1−Latn=1 : A j;6 if Xt,n=1, j == 1 then7 update listAllocatedSlots[t : t +D j,n=1−1][n = 1] = j;8 continue;9 else
10 attempt Xt,n=2, j from t = d j−D j,n=2−Latn=1 : A j;11 if Xt,n=2, j == 1 then12 update listAllocatedSlots[t : t +D j,n=2−1][n = 2] = j;13 continue;
/* Optimize allocation and Check consistency */14 for n ∈N do15 Get time of first allocated packet, t1Xt1,n,k=1;16 if ttail,n < t1 < tpro,n + ttail,n +1 then17 if A j < tpro,n then18 attempt Xt1,n,k from t = A j : tpro,n;19 else20 try with other packet;
21 if Xt1,n,k == 1 then22 update listAllocatedSlots[t1 : t1+Dk,n−1][n] = k;23 Get next allocated packet;24 Calculate δt = t2Xt,n, j=1− t1Xt1,n,k=1;25 if δt ≥ tpro,n + ttail,n +1 then26 skip to that packet;27 else if δt < ttail,n then28 attempt Xt,n, j from t = max(A j, t1+Dk,n−1) : t2−1;29 if Xt,n, j == 1 then30 update listAllocatedSlots[t : t +D j,n−1][n] = j;31 else if δt > ttail,n&& < tpro,n + ttail,n +1 then32 if A j < tpro,n then33 attempt Xt,n, j from t = max(A j, t1+Dk,n−1) : tpro,n;34 else35 try with other packet;
36 if Xt,n, j == 1 then37 update listAllocatedSlots[t : t +D j,n−1][n] = j;
/* Fill States */38 for n ∈N do39 time = 0;40 while time≤ T −1 do41 if listAllocatedSlots[time][n] 6= 0) then42 networkstate[time][n] = 2;43 time = time+1;44 else45 δt = δt +1;46 for newTime = time+1 : T −1 do47 if (listAllocatedSlots[newTime][n] 6= 0) then48 break;49 else50 δt = δt +1;
51 if δt ≤ ttail,n then52 networkstate[time : time+δt −1][n] = 3;53 else54 networkstate[time : time+ ttail,n][n] = 3;55 networkstate[time+ ttail,n : time+δt − tpro,n−1][n] = 0;56 networkstate[time+δt − tpro,n : time+δt −1][n] = 3;
57 time = time+δt ;
84 Modeling and Optimization of Packet Transmission Scheduling in M2M
4.4 Scheduling Evaluation
In this section, we compare the performance of different scheduling for the scenariosof Section 4.2. The first scheduling considered here is EOpt, and it minimizes the to-tal energy consumption in a given scenario as defined by eq. (4.3). The second one isthe well-known EDF scheduling [LL73], and it is implemented in the LP model as well.In our case, for each slot, if possible, EDF schedules packets to be transmitted in orderof their deadline as soon as they are ready for transmission, that is, as soon as they ar-rive. The earlier the deadline of a packet is the higher the priority for transmission is.Within the same scenario, all packets have the same deadline, and thus the objective ofthis scheduling becomes the minimization of the total packet waiting time:
min ∑∀t∈T ,n∈N , j∈J
Xt,n, j(t−A j) (4.27)
We consider two heuristic-based scheduling algorithms for comparison purposes: ourown heuristic devised in the previous section, and an adaption of the LEDF heuris-tic [SC01] to wireless networks. The latter is an extension of EDF that attempts to sched-ule the tasks first in the least power consuming option. After adapting it to our case, LEDFoperation becomes as follows. It schedules packets in ascending order of their deadlines.For each slot, if there is any packet ready to be transmitted, this heuristic attempts toschedule the packet in Wi-Fi; if that is not possible, it tries to schedule the packet in LTE.If both attempts fail, it shifts to the next time slot and repeats the same process. The im-possibility of a packet allocation to a network is due to allocation overlaps, to insufficienttime for a packet to be transmitted in a network, or due to the consistency of the networkinterface state machine, as discussed earlier.
We define the following four metrics to quantify the performance of each packetscheduling:
• Average energy consumption: the average energy consumption for all scenarios (inJoules);
• Average waiting time: the average amount of time between the arrival (at M2MGW) and the allocation of all packets for all scenarios (in seconds), as depicted inFigure 4.10 for a single packet;
• Average slack time: the average amount of time between the arrival at destination(broker) and the deadline of all packets for all scenarios (in seconds), as depicted inFigure 4.10 for a single packet;

4.4 Scheduling Evaluation 85
Aj
Time
Xt,n,j
Dj,n Latn
dj
Waiting Time
Slack Time
Figure 4.10: Calculation of the waiting and slack times for a packet.
Figure 4.11: Energy consumption for the different scheduling across the different scenar-ios divided by load. EOpt scheduling performs the best, followed by our heuristic, andthen by LEDF and EDF scheduling.
• Average execution time: the average amount of time to find the best/optimal solu-tion for all scenarios (in seconds).
Minimization of the average waiting time does not imply a maximization of the av-erage slack time because packets can be transmitted in different networks, with differentthroughputs and latencies.
Figures 4.11 to 4.14 show the energy consumption, waiting time, slack time, andexecution time, respectively, for the different scheduling across the different scenariosdivided by load. Table 4.4 shows the average performance of each packet transmissionscheduling for 1 sec scheduling periods.
The schedules obtained from EOpt result in the best performance in terms of the aver-age energy consumption. EDF consumes 7.04% and LEDF consumes 2.87% more energyin average than EOpt. Our heuristic has a very close performance, with an increase of just0.03% more than the optimal scheduling.

86 Modeling and Optimization of Packet Transmission Scheduling in M2M
Figure 4.12: Waiting time for the different scheduling across the different scenarios di-vided by load. Time-based objective scheduling perform better than energy-based objec-tive scheduling for the waiting time, as expected.
Figure 4.13: Slack time obtained for the different scheduling across the different scenariosdivided by load. Higher is better. LEDF performs similarly to EDF, and both performbetter than EOpt and EHeu.
The trade-off between energy and time becomes clear when we add the waiting andslack time metrics to the analysis. While generally packet transmissions are delayed tosend packets consecutively using a single network for the objective of minimizing energyconsumption, all packets should be sent as soon as they arrive and two networks shouldbe used if necessary in order to the minimize waiting time.

4.4 Scheduling Evaluation 87
Figure 4.14: Execution time (in log) for the different scheduling across the different sce-narios divided by load. EHeu and LEDF are much faster than EOpt and EDF.
The EOpt schedules lead to an increase of 10520% of the average waiting time and of26% of the average slack time when compared to the EDF schedules that are optimal interms of the waiting time. Our heuristic has the worst average performance with respect tothese two metrics, with an increase of 136000% and 33%, respectively, when compared toEDF. LEDF, as expected, performs very similarly to EDF, showing an increase of 100%of the average waiting time and just 1.7% of the average slack time. As EDF chooseseither Wi-Fi or LTE for transmission, it performs better than LEDF with respect to theslack time, since the latter scheduling preferably selects Wi-Fi, which is the network withthe worst performance in terms of the sum of transmission time and latency. Moreover,by always allocating a first packet to Wi-Fi if possible, LEDF can struggle in terms of thewaiting time when compared to EDF. Specifically, if two packets arrive at the same timewhile there is still an ongoing transmission in Wi-Fi, one packet can be transmitted inLTE but the other will have to be delayed for transmission in the next time slot. Althoughthis situation depends on very specific scenario configurations, namely the packet arrivalperiod of each sensor, it will occur with more frequency with LEDF than with EDF, asEDF would eventually use LTE for the first transmission and, thus, it would have bothnetworks available sooner. This explains the small, but existent, differences between theaverage waiting time of the two scheduling for a few scenarios shown in Figure 4.12.
EHeu shows only a slightly worse performance than EOpt regarding the average en-ergy consumption. From an individual analysis of the packet allocations in the scenarioswhere we observe differences between the energy consumption of these two scheduling,

88 Modeling and Optimization of Packet Transmission Scheduling in M2M
Table 4.4: Average energy consumption, waiting time, slack time, and execution time forthe different scheduling for all scenarios.
Scheduling Average energy consumption (J) Average waiting time (s) Average slack time (s) Average execution time (s)
EOpt 1.3753 0.702 2.239 666.583EHeu 1.3757 0.907 2.033 1.315 ×10⁻³
EDF 1.4722 0.667 ×10⁻³ 3.017 5.475LEDF 1.4148 1.333 ×10⁻³ 2.966 2.233 ×10⁻⁴
we can see that EOpt not only delays transmissions, but, in some specific cases, it alsoanticipates transmissions of some other packets in order to explore Idle states in betweenthe two groups of packets, specially for scenarios with larger deadlines and low offeredload. Furthermore, this action also leads EHeu to have larger waiting times and smallerslack times than EOpt in some scenarios.
The average execution time is an important metric to be considered when comparingdifferent scheduling, specially when analyzing it as a metric of the implementation feasi-bility in smartphones as M2M GWs. Both heuristics perform fast when compared to EOptand EDF. The time required for EOpt and EDF to find the optimal solutions increases withthe load which does not happen for the heuristics. While EDF performs faster than EOpt,it still takes much more time on average than LEDF to find the optimal (best, in the caseof LEDF) solution. Our heuristic is several degrees of magnitude faster than EOpt.

4.5 Discussion 89
4.5 Discussion
As the IoT grows in number of devices and services, the need for energy efficient systemsgrows as well. The access network of the M2M GW is a limiting factor, both in termsof energy consumption and latency, and thus IoT applications have to coordinate networkaccesses carefully. Although large periods of time between consecutive transmissions, inwhich there are more opportunities for network interfaces to shift to the Idle state, areassociated with a lower energy consumption (and hence battery consumption), data timerequirements can be compromised due to latency in the access network, introduced bythe promotion time and the core network, and the extent of this value depends on thetechnology used. Efficient modes of operation to provide an always On state could beused to address this problem [PKN+13].
Devising models to allow schedule packet transmissions in order to minimize en-ergy consumption, while guaranteeing QoS depending of specific application deadlinesand networks characteristics, is important. Furthermore, these models can be crucial forscenarios where IoT devices must operate for very long periods of time (years or evendecades) without replacements or interventions. In heterogeneous networks scenarios,the exploitation of low latency and power efficiency trade-offs offered by wireless andcellular networks will be mandatory to guarantee an efficient resource utilization.
In our results, we observed that we can obtain significant energy savings by mini-mizing the energy consumption (EOpt) when compared to a common scheduling (EDF).Using knowledge obtained from the model, we managed to approximate the energy per-formance of a heuristic (EHeu) to the optimal, still with less complexity in finding thebest solutions. Therefore, increasing the usability of smartphones M2M GWs. The twoheuristics considered in this work can be a good compromise between either energy con-sumption (EHeu) or waiting time (LEDF) and execution time, and thus showing as betteroptions for implementation in M2M GWs.
The model also provides a useful way to analyze the impact of modifications in thenetwork interface performance and understand if different networks can be more com-petitive with minor modifications. For example, in [PA17b], we analyzed for a specificscenario the impact of a throughput degradation of the best network in terms of energyconsumption. With the degradation, the network was not able to offload all packets dur-ing the scheduling period, and we observed the optimal solution avoiding inefficient statetransitions and completely shifting the entire packet schedule to the other network. Evenif different power consumption or latency models are used, or even if other networks areused, this model and type of analysis can be crucial for optimizing the energy consump-tion, or any other objective using for that a different cost/objective function.


Chapter 5
Enabling Efficient GWs with NetworkCoding
Nowadays, smartphones are equipped with a multitude of heterogeneous wireless inter-faces that offer diverse bandwidth, reliability, and latency at different energy and eco-nomic costs. In this scenario of convergence of heterogeneous radio access technologies,multi-homing allows smartphones to be simultaneously connected to and exchange dataon multiple network interfaces, thereby increasing reliability and QoS of content deliv-ery [LJH+08] and allowing mobile IoT applications to have better performance.
Typically, only one interface is used at a time, chosen according to static, pre-definedpriorities: use Wi-Fi if possible, 3G/4G otherwise, and BT for specific applications. Thisapproach is consistent with today’s business model for mobile connectivity, but it is not ef-ficient in terms of managing network resources, or decreasing economic costs [AMSS08].The interface to use should be chosen according to application and user requirements, aswell as device and network context.
Current proposals, recently reviewed in [PKBV11], include network centric [THM04,NH06, BKKR13, YBC05], user centric [SJ05, CAN+11, LCX07, OPM05, LLZ06] andhybrid [HEAA11, WLM05] approaches that trigger vertical handovers in heterogeneouswireless networks using a variety of techniques, e.g., stochastic LP [THM04], game the-ory [NH06], multiple-attribute decision making [HY81, BL07], grey relationship analy-sis [LCX07], as well as concepts borrowed from economic modelling like profit [LLZ06],surplus [OPM05], or utility functions [YBC05]. Context-aware frameworks for verticalhandovers have also been proposed [PNW03, She05, NVACT13, ZS10]; however, theydo not consider simultaneous use of more than one radio technology, which is a commonlimitation present in network selection work [HJLS11, CK04].
91

92 Enabling Efficient GWs with Network Coding
The emergence of multi-homing and the feasibility of unicast communication overmultiple paths [HSH+06] opens up the possibility to use different interfaces simultane-ously. In [XV05], the authors propose a scheme for choosing the access technology to usefor each new flow upon arrival partitioning the flows over multiple radio access techno-logies. A framework for simultaneous use of 3G and WLAN by multi-homed devices isproposed in [LMD+03], considering the specificities of multilayer HTTP and video traf-fic, but the approach separates the traffic into multiple flows and makes a static allocationof those flows. These and similar proposals provide little or no adaptability to the in-herent channel quality variations of wireless systems [CR06, LB13, XLG+13, LDH+14,PNAK11, RFC12].
Adaptive resource allocation algorithms that choose which data to send/request througheach available interface based on network conditions, traffic load, available energy, amongother constraints are thus instrumental to leverage the full potential of converged hetero-geneous wireless communications [IZE13, IZ14, CS14]. We note that none of these worksprovide a framework for exploring the parameter space and evaluating achievable gains,nor do they consider network coding exploring opportunistic transmissions in the con-text of multiple paths in converged heterogeneous wireless networks with time-varyingchannels.
Network coding, initially proposed in [ACLY00], constitutes a disruptive paradigmthat relies on mixing (coding) packets E2E or at intermediate nodes in the network ratherthan storing and forwarding them [FLBW06, SSM+09b]. Random linear combinationsare sufficient to achieve the maximum capacity of a network with probability exponen-tially approaching 1 with the code length [HMK+06] while attaining minimum delay[LYC03, LMKE08]. From a receiver’s perspective, it is no longer crucial to focus ongathering specific packets, but to gather enough linearly independent coded packets torecover the original information. This enables network coding to exploit multiple routesand/or network topologies seamlessly by dynamically shifting traffic between differentpaths, without concerning about coordination or packet scheduling problems. By explor-ing redundant network capacity, network coding reduces the need for complex manage-ment schemes, allows decentralized operation, and increases the robustness and resilienceto topology/network changes and even link failures [HMK+06, CdPCZ+13].
For transmissions in packet erasure channels, network coding provides robustnessagainst packet losses and highly dynamic network conditions [HMK+06, WFyLB05,FLBW06, KRH+08]. These traits make network coding very appealing for the volatileenvironments typical of heterogeneous wireless networks, especially when data may betransmitted simultaneously using different technologies as is enabled by multi-homing.
Network coding is a block-coding operation where each block represents a generation.

Enabling Efficient GWs with Network Coding 93
Other block-based codes used on packet erasure channels such as Automatic Repeat re-Quest (ARQ) error-control codes [LCM84], although achieving optimal throughput, haveincreased delay [FLBW06], and E2E Forward Error Correction (FEC) codes [Ham50] donot achieve the optimal throughput due to the inherent redundancy adaptation to the E2Eloss rate [FLBW06]. Digital fountain codes, such as Luby Transform (LT) codes [Lub02]or Raptor codes [Sho06] which are based on LT codes, low-density parity-check (LDPC)codes [Gal62], turbo codes [BGT93] and even Reed-Solomon codes [RS60] are examplesof FEC codes. Usually, large block sizes are required to maximize capacity which addextra delay; less delay comes with the expense of a less efficient code. As FEC codes areused E2E, since intermediate nodes do not perform coding operations and confine them-selves to relay packets, in [WKR05] the authors propose the use of network-embeddedFEC; however, nodes need to wait until sufficient packets are received for decode and fur-ther re-encode of a new data segment which adds extra delay to the system, while networkcoding would allow the immediate decode and re-encode of each packet.
Recent work on network coding has considered the use of multiple interfaces to im-prove quality of experience [PMOS11] with an economical cost objective and to minimizecompletion time of a file transfer [ML15]. In [PAL13], our goal was to leverage networkcoding techniques optimizing how to share load among the available interfaces betweenmulti-homed devices over heterogeneous, time-varying wireless networks. Thereby wefocused on a user-centric approach, formulating and solving a resource allocation problemfor deciding when and under which conditions the offered traffic load should be transmit-ted on each available path. The numerical results proved that dynamic allocation policiesusing network coding improved resource usage efficiency by reducing energy consump-tion and/or channel utilization in some selected (and specific) scenarios. We present theseresults in Appendix A.
In this work, we show the extension and generalization of that work by evaluatingthe actual potential impact of the proposed optimal policies. The work uses SimulatedAnnealing (SA) meta-heuristics to efficiently explore the parameter space and fully un-derstand the advantages of dynamic allocation policies that adapt to the volatile channelcharacteristics; we compare their performance with the use of static policies, as are com-mon in state-of-the-art devices, identifying under which operating conditions the reduc-tion of energy consumption and channel utilization are most significant, and answeringthe question: "When are network coding based dynamic techniques beneficial for multi-
homed GWs in IoT applications?"

94 Enabling Efficient GWs with Network Coding
5.1 Framework
We consider the problem of transmission of data packets from a source (GW) to a des-tination in a time-slotted system, where two independent channels are available1. Bothsource and destination can be relay nodes in a network. Our framework determines theamount of offered traffic load that should be sent on each channel. At each time slot, thesource can transmit random linear network coded packets [HMK+06] through both chan-nels (sending a different coded packet in each), one channel, or can decide not to transmitin that time slot. Given that packets arrive randomly at the sender, we consider an onlinenetwork coding approach [SSM+09b, SSM08].
We assume an independent Gilbert-Elliott model for the channel [Gil60, Ell63]. Fig-ure 5.1 illustrates the scenario. We consider that each channel i can transmit using acombination of a set of modulation and (physical-layer) coding pairs, M〉. Mi j ∈M〉 rep-resents the j-th available modulation and physical-layer coding pair available to channel i.D(Mi j) represents the fraction of useful information bits in a slot when transmitting withMi j. Packet erasure (loss) probabilities on the i-th channel for the good and bad channelstate for modulation Mi, j are represented by e(i,g,Mi j) and e(i,b,Mi j), respectively. The prob-
ability of channel i to remain in state c ∈ {b,g} is given by p(i)c . We assume that a genieindicates the joint channel state C = (c1,c2) of the two channels, i.e., the probabilities ofpacket loss in each channel, at each time slot. However, the event of a packet loss is notknown a priori to the genie.
We define Pr(i,C,Mi j) and α(i,C,Mi j) as the probability of transmission through channeli during the joint channel state C using Mi j and the fraction of the data to be transmittedthrough channel i during the joint channel state C using Mi j, respectively. πC constitutesthe stationary probability of the joint channel state C, which can be easily determinedthrough standard finite Markov chain techniques using p(i)g and p(i)b for i = 1,2. Thestationary probabilities πg and πb for each channel are obtained by:
π(i)g =
1− p(i)b
2− p(i)g − p(i)b
; π(i)b =
1− p(i)g
2− p(i)g − p(i)b
. (5.1)
The utilization of channel i in our system is given by:
Ui([Pr(i,C,Mi j)]) = ∑Mi j∈M〉,C∈{b,g}2
Pr(i,C,Mi j)πC. (5.2)
We define the total channel utilization of the system as U = ∑iUi, although other
1This framework can easily be generalized to more than 2 channels.
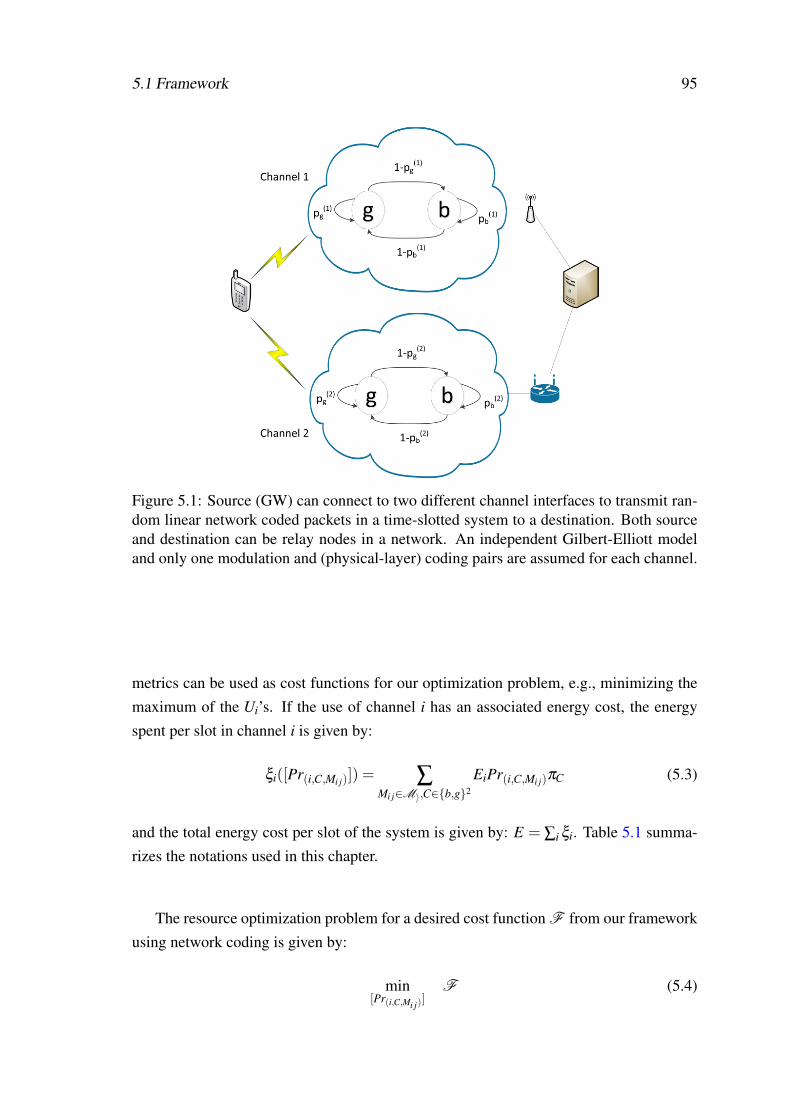
5.1 Framework 95
Figure 5.1: Source (GW) can connect to two different channel interfaces to transmit ran-dom linear network coded packets in a time-slotted system to a destination. Both sourceand destination can be relay nodes in a network. An independent Gilbert-Elliott modeland only one modulation and (physical-layer) coding pairs are assumed for each channel.
metrics can be used as cost functions for our optimization problem, e.g., minimizing themaximum of the Ui’s. If the use of channel i has an associated energy cost, the energyspent per slot in channel i is given by:
ξi([Pr(i,C,Mi j)]) = ∑Mi j∈M〉,C∈{b,g}2
EiPr(i,C,Mi j)πC (5.3)
and the total energy cost per slot of the system is given by: E = ∑i ξi. Table 5.1 summa-rizes the notations used in this chapter.
The resource optimization problem for a desired cost function F from our frameworkusing network coding is given by:
min[Pr(i,C,Mi j)
]F (5.4)

96 Enabling Efficient GWs with Network Coding
Table 5.1: Notations used in the framework.
Notation Definition
λ Source ratePr(i,C,Mi j) Probability of transmission through channel i during the channel state
C using Mi j
α(i,C,Mi j) Fraction of the data to be transmitted through channel i during the chan-nel state C using Mi j
ei,g,Mi j Packet erasure probability for the good state of i-th channel using usingMi j
ei,b,Mi j Packet erasure probability for the bad state of i-th channel using Mi j
π(i)g Stationary probability of the good state of i-th channel
π(i)b Stationary probability of the bad state of i-th channel
Mi j The j-th available modulation and physical-layer coding pair availableto i-th channel
D(Mi j) The fraction of useful information bits in a slot when transmitting withMi j
Ei Energy consumption of i-th channelUi Utilization of i-th channelξi Energy cost per slot of i-th channel
subject to:
∑Mi j∈M
Pr(i,C,Mi j) ∈ [0,1], ∀C ∈ {g,b}2, i ∈ {1,2}
∑Mi j∈M ,i∈{1,2},C∈{g,b}2
α(i,C,Mi j) = 1
((1− e(i,ci,Mi j))D(Mi j))Pr(i,C,Mi j)πC = λα(i,C,Mi j),
∀C = (c1,c2) ∈ {g,b}2, i ∈ {1,2},Mi j ∈M .
The last condition captures the fact that the probability of channel i transmitting in agiven channel state using Mi j is linked to the mean usage of the channel during that state,e.g., λα(1,C,M1 j)/ [D(M1 j)(1− e(1,c1))] for channel 1.
The optimal policy for a given channel state C and source rate λ is given by the vector[Pr(i,C,Mi j)] that results from this optimization. Note that the probability of transmittingthrough channel 1 and channel 2 is independent, thus transmission over two channels orno channels at each time slot is possible. In this work, we make the assumption of trans-mission of data flows, avoiding the granularity of data packets. In addition, we assumethat we transmit the least possible redundancy per original data packet over a long pe-riod of time, which requires infinite queue size [LRM+06]. While there is a performance

5.1 Framework 97
degradation in terms of delay from adding extra information, assuming transmission of afinite number of data packets may not allow us to reach the same performance as trans-mission of data flows. We consider our approach a good approximation as online networkcoding allows the creation of large windows of coded packets, which approximate a flow.Our framework can perform an optimal resource allocation, as the infinite queue sizeallows to store the coded packets while awaiting a good channel.
5.1.1 Comparison Policies
Despite being equipped with multiple interfaces and being multi-home capable, smart-phones conventionally access wireless networks one at a time according to a pre-defineduser configurations, i.e., the user connects to one technology that best fits his/her interestsat the time. We capture this behavior in fixed policies and compare their performanceto optimal dynamic policies that leverage multi-homing to use more than one access net-work simultaneously, following the optimal allocation obtained from solving the problemformulated previously.
We define the following two fixed policies in the transmission of packets:
• Fixed Policy Channel 1 (FP1) - Policy where all available resources (time slots)from channel 1 are used before allocating slots for transmission from channel 2. Ifthe arrival rate is low enough, only channel 1 will be active;
• Fixed Policy Channel 2 (FP2) - Same as FP1 policy except resources (time slots)from channel 2 are used first and resources from channel 1 are used only if neededto support a given data rate.
and the two dynamic policies:
• Dynamic Policy Optimizing Channel Utilization (DPOCU) - Optimal policy interms of reduction of channel utilization, where the channel assignments are de-cided by solving problem (5.4) for the cost function: F = ∑iUi
(Pr(i,C,Mi j)
);
• Dynamic Policy Optimizing Energy Consumption (DPOEC) - Optimal policy interms of reduction of energy consumption, where the channel assignments are de-cided by solving problem (5.4) for the cost function: F = ∑i EiUi
(Pr(i,C,Mi j)
).
5.1.2 Metrics
We define two metrics to quantify the advantages of using dynamic policies rather thanfixed policies.

98 Enabling Efficient GWs with Network Coding
• Channel Utilization Gap of DPOCU: is the difference of channel utilization be-tween a policy Pi and channel utilization optimal policy DPOCU for the samechannel conditions. The value is presented in decibel (dB) and is calculated as10log(UPi/UDPOCU);
• Energy Consumption Gap of DPOEC: is the difference of energy consumptionbetween a policy Pi and the energy consumption optimal policy DPOEC, underthe same channel conditions. The value is expressed in dB and is calculated as10log(ξPi/ξDPOEC).
As an example, consider that the Channel Utilization Gap of DPOCU is 3 dB whencompared to FP1. This means that DPOCU uses the channel 50 % less than FP1. A largervalue of the gap is associated with a larger reduction in channel utilization achievable bythe DPOCU policy. The same logic applies for the energy consumption metric.
5.2 Simulated Annealing Meta-heuristics
The optimization framework and the dynamic network coding policies proved to pro-vide efficient, channel-aware load allocation for multi-homed devices under different costcriteria in our previous work [PAL13]. However, every parameter had to be manually ad-justed in an attempt to find a combination that provided considerable gains. It is impossi-ble to understand which areas of the parameter space can provide better results followingthat methodology. Therefore, it is imperative to explore the parameter space automati-cally.
Traditional problem solving strategies either guarantee to find the global solution, butare too expensive in terms of computation, e.g., memory usage or processing time, or theyget caught in local optima. Recent algorithms are capable of escaping the local optimawhile searching for the global optimum. SA is a probabilistic method for efficiently ex-ploring the search space in order to find near optimal (global) solutions [C85, KGV83].Meta-heuristics, such as SA, generally find good solutions by exploring a large set of thefeasible solutions, which allow us to explore the areas of the parameter space that providebetter results.
This work uses SA meta-heuristics to efficiently explore the parameter space to fullyunderstand the advantages of resource allocation policies that dynamically adapt to thevolatile channel characteristics and identify under which operating conditions, i.e., areasof the parameter space, the reduction of energy consumption and channel utilization aremost significant.

5.2 Simulated Annealing Meta-heuristics 99
Algorithm 3: SA algorithm.1 begin2 t← 0; /* Time */3 initialize T; /* Temperature */4 select a current point vc at random; /* vc is composed by λ, e(i,ci,Mi, j), πC,
Ei, for ∀C = (c1,c2) ∈ {g,b}2, i ∈ {1,2},Mi j ∈M. */5 evaluate vc;
/* Evaluation is performed by obtaining the valuecorresponding to the minimum between a dynamic policyand other policies. */
6 vb← vc;7 repeat8 repeat9 Select a new point vn in the neighborhood of vc;/* Change randomly a
single parameter according to a predefined step.
*/10 if evaluation(vn)> evaluation(vc) then11 vc← vn;12 if evaluation(vc)> evaluation(vb) then13 vb← vc;14 else
15 if random[0,1)< exp(− evaluation(vc)− evaluation(vn)
T
)then
16 vc← vn;17 end18 until termination condition/* termination condition - Max # of
iterations is not reached. */;19 T← f(T,t); /* Cooling Ratio */20 t← t+1;21 until halting condition/* halting condition - Max # of times vc is
not changed. */;22 end
We use SA to select parameter sets and evaluate them using the mathematical frame-work described in the previous section, and thus SA is driven by a theoretical analysis.Algorithm 3 presents our SA formulation for the problem. The SA algorithm starts by ini-tializing and assigning a random value to a parameter set composed of source rate, erasureprobabilities and stationary probabilities to each channel. The stationary probabilities foreach channel must sum up to 1 and, therefore, we just need to randomly assign one valueto one state of each channel. The parameter set is evaluated according to the achievablegains of the dynamic network coding policies, DPOCU or DPOEC, and the result of theevaluation (a solution) is the minimum of the channel utilization gap or energy consump-tion gap. In other words, in the algorithm, a solution corresponds to the minimum of the

100 Enabling Efficient GWs with Network Coding
Channel Utilization Gap of DPOCU or the Energy Consumption Gap of DPOEC with re-spect to any other policy. For example, if a parameter set results in a Channel UtilizationGap of DPOCU with respect to FP1 of 2 dB, in a Channel Utilization Gap of DPOCUwith respect to FP2 of 3 dB, and in Channel Utilization Gap of DPOCU with respect toDPOEC of 4 dB, the solution obtained is 2 dB which corresponds to the minimum be-tween the three values, i.e., our results correspond to the minimum achievable gain foreach explored point of the parameter space.
The initial parameter set us the Current Solution, vc, which corresponds to the currentsolution to which other solutions in its parameters’ neighborhood shall be compared to. Atthe beginning, this solution also corresponds to the Best Solution, vb. The Best Solution isthe best solution obtained so far, and, at the end of the algorithm, desirably it should yieldthe global optimum. In each step of the algorithm, we select a new parameter set to beour Candidate Solution, vn, originated from a change to a single parameter in the Current
Solution, and evaluate it. Therefore, the neighborhoods are composed of solutions aroundthe Current Solution at the distance of one change in one parameter, either decreasingor increasing its value by a predefined step. If the Candidate Solution provides a bettersolution than the Current Solution, we accept it as our new Current Solution. If it is the
same or lower, we accept it if random[0,1)< exp(−evaluation(vc)− evaluation(vn)
Temperature
),
which is adjusted by the parameter temperature. The reason why we record both Current
Solution and Best Solution is because we can accept a Candidate Solution as Current So-
lution even if it provides a worse solution than the previous Current Solution. However, aswe iterate over the outer loop, the value of the temperature will decrease, and the accep-tance of worse solutions will be less frequent. At the beginning, this algorithm resemblesa random search, thus avoiding possible local optima, and, at the end, it resembles a stan-dard hill-climber. To avoid infinite generation of iterations, we set a halting condition asthe maximum number of times that the algorithm does not change the Current Solution,and a termination condition as the maximum number of iterations the algorithm runs withthe same temperature value. Every time the algorithm changes the value of Current Solu-
tion, the counter of halting condition is reset, since the algorithm accepted a new solutionand possibly new better and different solutions are reachable. Please note that differentheuristics could lead to different (higher or lower) results.
5.3 Results
We focus our analysis in two different scenarios: (i) Channels with same energy consump-
tions where we have two different channels with the same energy consumption and fixed

5.3 Results 101
data rate (e.g., same modulation and coding pairs), but with different erasure and station-ary probabilities for each channel state; (ii) Channels with different energy consumptions
where we have two different channels, with the same fixed data rate, but with differenterasure and stationary probabilities for each channel state, and different energy consump-tions. Therefore, the packet erasure probabilities on the i-th channel for the good and badchannel state are from now on represented by the terms e(i,g) and e(i,b), respectively, andboth channels send the same fraction of useful information bits in a slot (D(Mi j)).
Having both channels with the same data rate allows us to simplify the analysis. Ifwe had more configurations for the channels, having the possibility of different data ratesin each channel, we would increase our parameter space, but we would also increasethe areas where the dynamic policies provide better performance. The opportunities totransmit in good channel conditions and good data rates would possibly increase, and,ultimately, the results would stress even further the importance of the framework.
We performed 1000 analyses for each scenario using MATLAB. The analyses wereperformed in parallel in the Avalanche cluster at the High Performance Computing at theFaculdade de Engenharia da Universidade do Porto [FEU]. The cluster has 29 nodes, eachwith 16 cores and between 64 GB and 128 GB of RAM; however, due to quota limitations,no more than 300 analyses could run at the same time. The execution of all analyses lastedfor two and one half days. Although the parameter space explored by Candidate Solution
is larger, during analyses we only recorded the Best Solution and Current Solution valuessince the effort in terms of disk to record all Candidate Solution was unfeasible.
The arrival rate, the parameters of the Gilbert-Elliot model, and energy consumptionfor each channel were allowed to vary according to the values presented in Table 5.2. Theranges of the values were selected to constitute a reasonable representation of possibleconditions. Channels can have an erasure probability between 0.01 and 0.20 for the goodstates, 0.21 and 0.90 for the bad states, and stationary probabilities in each state between0.05 and 0.95. Table 5.2 also presents the values chosen for the counters of the halting andthe termination conditions, and the temperature cooling ratio. The tuning of these valueswas made in a trial and error approach and we selected the values that provided a goodtrade-off between the diversity of parameter space search and the duration of the analyses.Each analysis sets the initial parameters at random within the ranges of Table 5.2. Eachgeneration of a new neighbourhood is accomplished by a change to a single parameteraccording to the step defined in that table.

102 Enabling Efficient GWs with Network Coding
Table 5.2: Parameters range and counters values.
Parameter Range/Value Step
λ 0.1−2 0.1e1,g 0.01−0.20 0.01e1,b 0.21−0.90 0.01e2,g 0.01−0.20 0.01e2,b 0.21−0.90 0.01π(1)g 0.05−0.95 0.01
π(1)b 0.05−0.95 0.01
π(2)g 0.05−0.95 0.01
π(2)b 0.05−0.95 0.01
E1 1−8 0.05E2 1 −Halting 500 −Termination 360 −Temperature 25 0.025
5.3.1 Channels with same energy consumption
When the two channels have the same energy consumption (E1 = E2), the Channel Uti-lization Gap of DPOCU behaves the same as the Energy Consumption Gap of DPOECwith respect to the fixed policies. Figure 5.2 shows the distribution of the final Best Solu-
tion and the corresponding parameters for the Channel Utilization Gap of DPOCU. Theresults show that a large percentage of all Best Solution (83%) are approximately 5.4 dBand a significant percentage of the Best Solution (14%) obtained are approximately 7 dB.The best solutions of both Channel Utilization Gap of DPOCU and Energy ConsumptionGap of DPOEC with respect to the fixed policies are obtained with high and low erasureprobabilities for the good and bad states of the channels, respectively, and with low andhigh stationary probabilities for the good and bad state, respectively. The best results areobtained for small λ (0.2 or 0.3), that is, the best results are obtained when the offeredtraffic load is low and the dynamic policies can take advantage of opportunistic transmis-sions and select the best moment to transmit. The dynamic policies use the good states ofboth channels instead of using the bad states, and it is here where our dynamic policieshave advantage in comparison to the fixed policies. FP1 uses resources (time slots) fromboth good and bad states of channel 1 before using resources of the channel 2, and FP2uses resources from both good and bad states of channel 2 before using resources of chan-nel 1. The higher the stationary probabilities of the bad states and lower the stationaryprobabilities of the good states are, the more gains DPOCU and DPOEC achieve with

5.3 Results 103
●
●●●●●●●●●●●●●●●●●●●●●●●
●
●
●
●●●
●
●●
●
●●●●
●
●●●●●●●●●●●●●●●●●●●●●●●●●●●●●●●●●●●●●●●
●
●●●●●
●
●●●
●
●
●
●●●●●
●
●
●
●
●
●●●●●
●
●
●
●●●
●
●●●●●●●●●
●
●●●●
●
●
●●●●
●
●●●●●●
●
●●●●
●
●●●●●●●●●●●●●●●●●
5.5
6.0
6.5
7.0
Best Solution
Val
ue
●●●●●●●●●●●●●●●●●●●●●●●●●●●●●●●●●●●●●●●●●●●●●●●●●●●●●●●●●●●●●●●●●●●●●●●●●●●●●●●●●●●●●●●●●●●●●●●●●●●●●●●●●●●●●●●●●●●●●●●●●●●●●●●●●●●●●●●●●●●●●●●●●●●●●●●●●●●●●●●●●●●
●
●●●
●●●
●●
●●
●●
●●
●
●
●
●
●
●
●
●●
●
●
●
●
●●
●●
●
●
●
●●●●●●
●●●●●●●●●●●●●●●●●●●●●●●
●
●●●●●●●●●●●●●●●●●●●●●●●●●●●●●●●●●●●●●●●●●●●●●●●●●●●●●●●●●●●●●●●●●●●●●●●●●●●●●●●●●●●●●●●●●●●●●●●●●●●●●●●●●●●●●●●●●●●●●●●●●●●●●●●●●●●●●●●●●●●●●●●●●●●●●●●●●●●●●●●●●●●●●●●●●● ●●●●●●●●●●●●●●●●●●●●●●●●●●●●●●
●●●●●●
●
●●●●●●●●●●●●●●●●●●●●●●●●●●●●●●●●●●●●●●●●●●●●●●●●●●●●●●●●●●●●●●●●●●●●●●●●●●●●●●●●●●●●●●●●●●●●●●●●●●●●●●●●●●●●●●●●●●●●●●●●●●●●●●●●●●●●●●●●●●
●
●●●●●●●●●●●●●●●●●●●●●●●●●●●●●●●●●●●●●●●●●
●●●●●●●●●●●●●●●●●●●●●●●●●●●●●●●●●●●●●●●●●●●●●●●●●●●●●●●●●●●●●●●●●●●●●●●●●●●●●●●●●●●●●●●●●●●●●●●●●●●●●●●●●●●●●●●●●●●●●●●●●●●●●●●●●●●●●●●●●●●●●●●●●●●●●●●●●●●●●●●
●●●●●●●●●●●●●●●●●●●●●●●●●●●●●●●●●●●●●●●●●●●●●●●●●●●●●●●●●●●●●●●●●●●●●●●●●●●●●●●●●●●●●●●●●●●●●●●●●●●●●●●●●●●●●●●●●●●●●●●●●●●●●●●●●●●●●●●●●●●●●●●●●●●●●●●●●●●●●●●
●●●●●●●●●●●●●●●●●●●●●●●●●●●●●●●●●●●●●●●●●●●●●●●●●●●●●●●●●●●●●●●●●●●●●●●●●●●●●●●●●●●●●●●●●●●●●●●●●●●●●●●●●●●●●●●●●●●●●●●●●●●●●●●●●●●●●●●●●●●●●●●●●●●●●●●●●●●●●●●●
●●●●●●●●●●●●●●●●●●●●●●●●●●●●●●●●●●●●●●●●●●●●●●●●●●●●●●●●●●●●●●●●●●●●●●●●●●●●●●●●●●●●●●●●●●●●●●●●●●●●●●●●●●●●●●●●●●●●●●●●●●●●●●●●●●●●●●●●●●●●●●●●●●●●●●●●●●●●●●●●
λ
e 1,g
e 2,g
e 1,b
e 2,b
π g(1)
π b(1)
π g(2)
π b(2)
0.0
0.2
0.4
0.6
0.8
Parameters
Val
ue
Figure 5.2: Boxplot of the final best solutions on top and boxplot of the parameters onbottom, for the Channel Utilization Gap of DPOCU (same as Energy Consumption Gapof DPOEC) with respect to the fixed policies. Maximum Best Solution obtained is≈ 7 dB,minimum Best Solution obtained, and equal to the median, is ≈ 5.43 dB, and the mean ofthe Best Solution is ≈ 5.67 dB.
respect to the other policies and, thus, the higher the Channel Utilization Gap of DPOCUand Energy Consumption Gap of DPOEC are.
To have a visual perspective of the areas of the parameter space explored by all ac-cepted Current Solution during analyses, Figure 5.3 presents a spider chart with the solu-tions that provide a Channel Utilization Gap of DPOCU (same as Energy ConsumptionGap of DPOEC) with respect to the fixed policies above 3 dB, having the figure sampled1:1000 for visualization purposes. In the figure, each individual solution is obtained bya unique combination of parameters. In the analyses, we obtained around 3 million so-lutions above 3 dB of gap (4.67% of all unique Current Solution accepted) and, approx-imately, 384,000 above 5 dB (0.6% of all unique Current Solution accepted). Figure 5.3includes in the edges of each axis the range that each parameter varied in all acceptedCurrent Solution.

104 Enabling Efficient GWs with Network Coding
0.25 0.5 0.75 1
λ
0.20−0.50
0.25
0.5
0.75
1
e1,g
0.01−0.20
0.25
0.5
0.75
1
e2,g
0.01−0.20
0.25
0.5
0.75
1
e1,b
0.60−0.90
0.25
0.5
0.75
1e2,b
0.63−0.90
0.25
0.5
0.75
1
πg
(1)
0.05−0.42
0.25
0.5
0.75
1
πb
(1)
0.58−0.95
0.25
0.5
0.75
1
πg
(2)
0.05−0.43
0.25
0.5
0.75
1 πb
(2)
0.57−0.95
Figure 5.3: Spider Chart for all Current Solution that provide a Channel Utilization gap ofDPOCU (same as Energy Consumption Gap of DPOEC) with respect to the fixed policiesabove 3 dB.
5.3.2 Channels with different energy consumptions
In this scenario, channel 1 and channel 2 can have different energy consumptions. For amatter of efficiency, we fix the energy consumption of channel 2 to 1, i.e., E2 = 1, and letthe energy consumption of channel 1 vary on values higher or equal than 1, i.e., E1 ≥ 1.Next, we present the results obtained for the Energy Consumption Gap of DPOEC withrespect both to the fixed policies and the dynamic DPOCU. Later, we present the resultsobtained for the Energy Consumption Gap of DPOEC when it is compared only to thefixed policies.
5.3.2.1 Energy Consumption Gap of DPOEC with respect both to the fixed policiesand DPOCU
Figure 5.4 shows the distribution of the final Best Solution and the corresponding param-eters for the Energy Consumption Gap of DPOEC as well as the ranges of the energyconsumption of channel 1 in all analyses. Please note that the Energy Consumption Gapof DPOEC here is compared both to the fixed and to the dynamic DPOCU policies. Themean of all obtainable Best Solution is approximately 2.9 dB, while the maximum andminimum Best Solution are 3.16 and 0.65 dB, respectively. The best solutions are ob-

5.3 Results 105
●
●
●●
●●
●●
●
●●
Bes
t S
olut
ion E1
1
2
3
4
5
6
7
Val
ue
●●●●●●●●●●●●●●●●●●●●●●●●●●●●●●●●
●
●●●●●●●●●●●●●●●●●●●●●●●●●●●●●●●●
●
●●
●
●●●●●●●●●●●●●●●●●●●●●●●●●●●●●●●●●●●●●●●●●●●●●●●●●●●●●●●●●●●●●●●●●●●●●●●●●●●●●●●●●●●
●
●●●●●●●●●●●●●
●
●●●●●●●●●●●●●●●●●●●●●●●●●●●●●●●●●●●
●
●●●●●●●●
●
●●●●●●●●●●●●●●●●●●●●●● ●●●●●●●●●●●●●●●●●●●●●●●●●●●●●●●●
●
●●●
●
●●●●●●●●●●●●●●●●●●●●●●●●●●
●
●●●
●
●●
●
●●●●●●●●●●●●●●●●●●●●●●●●●●●●●●●●●●●●●●●●●●●●●●●●
●
●●●●●
●
●●●●●●●●●●●●
●
●●●●●●●●●●●●●●●●●●●
●
●
●
●●●●●●●●●●●●
●
●●●●●●●●●●●●●●●●●●●
●
●●
●
●●●●●
●
●●●●●●●
●
●●●●●●●●
●
●●
●
●●●●●●●●
●
●●●●●●●●●●
●
●
●
●
λ
e 1,g
e 2,g
e 1,b
e 2,b
π g(1)
π b(1)
π g(2)
π b(2)
0.0
0.2
0.4
0.6
0.8
Parameters
Val
ue
Figure 5.4: Boxplot of the final best solutions and energy consumption of channel 1 ontop and boxplot of the parameters on bottom, for the Energy Consumption Gap of DPOECwith respect both to the fixed policies and DPOCU. Maximum Best Solution obtained is≈ 3.16 dB, minimum Best solution obtained is ≈ 0.65 dB, median is ≈ 3.05 dB, and themean of the Best Solution is ≈ 2.91 dB.
tained when the energy consumption of channel 1 is E1 ≈ 3×E2 and with high erasureprobabilities for the good state of both channels and low erasure probabilities for the badstate of channel 2. We now observe a larger and higher distribution for the offered trafficload.
For DPOEC to have advantage with respect to FP1, the fixed policy that transmitsalways first in both states of channel 1, which consumes more energy than channel 2,it suffices for DPOEC to use channel 1 and channel 2 in the good states. In order forDPOEC to have advantage with respect to FP2, the fixed policy that transmits always firstin both states of channel 2, but consumes less energy than channel 1, it is necessary thatthe stationary probability in the good state of channel 2 (π(2)
g ) is lower enough than thehomologous of channel 1 (π(1)
g ). FP2 will always use channel 2 in both states, but willnot benefit from channel 1 good state.

106 Enabling Efficient GWs with Network Coding
0.25 0.5 0.75 1
λ
0.10−0.30
0.25
0.5
0.75
1
e1,g
0.01−0.10
0.25
0.5
0.75
1
e2,g
0.01−0.10
0.25
0.5
0.75
1
e1,b
0.21−0.90
0.25
0.5
0.75
1
e2,b
0.90
0.250.50.751
πg
(1)
0.15−0.95 0.25
0.5
0.75
1
πb
(1)
0.05−0.85
0.25
0.5
0.75
1
πg
(2)
0.07−0.25
0.25
0.5
0.75
1
πb
(2)
0.75−0.93
1
2
3
4 E1
2.55−3.85
Figure 5.5: Spider chart for all Current Solution that provide an Energy Consumption Gapof DPOEC with respect both to the fixed policies and DPOCU above 3 dB.
For DPOEC to have advantage towards DPOCU it is necessary for the erasure proba-bility of channel 1 in the bad state (e(1,b)) to be better (lower) than the erasure probabilityof channel 2 in the bad state (e(2,b)); otherwise, DPOCU would choose channel 2, whichis the channel with the lowest energy consumption, and would match DPOEC. Further-more, DPOCU chooses first a state of channel 1 with the same erasure probabilities aschannel 2 only when channel 1 has higher stationary probabilities in the good state.
To have a visual perspective of the areas of the parameter space explored by all ac-cepted Current Solution during analyses, Figure 5.5 presents a spider chart with the onesthat provide an Energy Consumption Gap of DPOEC with respect only to the fixed poli-cies above 3 dB, having the figure sampled 1:1000 for visualization purposes. In the anal-yses we obtained over 1.4 million solutions above 3 dB of gap. The figure also includesin the edges of each axis the range that each parameter varied in all accepted solutions.
5.3.2.2 Energy Consumption Gap of DPOEC with respect only to the fixed policies
Figure 5.6 shows that the results obtained for the Energy Consumption Gap of DPOECwith respect only to the fixed policies are different from the results obtained in the previ-ous section. In this case, we obtain the maximum Energy Consumption Gap of DPOECin all scenarios with the value of 7.02 dB when the energy consumption of channel 1is E1 = 1.05×E2. Nevertheless, it is clear now that, in the previous section, DPOCU
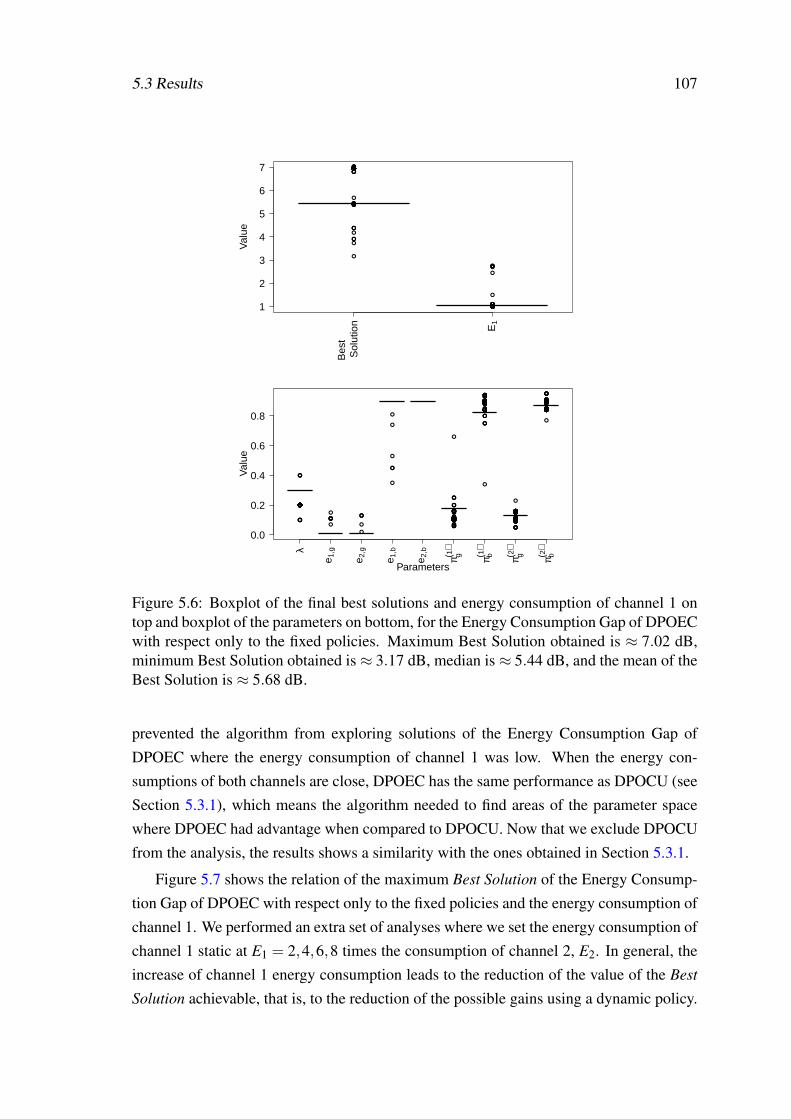
5.3 Results 107
●●●●●●●●●●●●
●
●●●●●●●●●●●●●●
●
●●●●
●
●●●●
●
●●●●●●●●●●●●●●
●
●●●●
●
●●●●
●
●
●
●●●
●
●●
●
●●●●●
●
●●●
●
●●●●●●●●●●●●●●●●●●●●
●
●●
●
●●●
●
●
●
●
●
●●●●●●●●●●●●
●
●
●●●●●●●●●●●●●●●●●●●●
●
●●●●●●●●●
●
●●●●●
●
●●●●●●●●●●●●●●●●
●
●
●
●●●
●
●●
●●
●●●●
●●●●●●●●●●●●●●●●●●●●●●●●●●●●●●●
●
●●●●●●●●●●●●●●●●●●●●●●●●●●●●●●●●●●●●●●●●●●●
●
●●●●●●●●●●●●●●●●●●●●●●●●●●●●●●●
●
●●●●●●●●●●●●●●●●
●
●●●●●●●●●●●●●●●●●●●●●●●●●●●●●●●●●●●●●●●●●●●●●●●●●●●●●
●
●●●
●
●●●●●●●●
Bes
t S
olut
ion E1
1
2
3
4
5
6
7
Val
ue
●●●●●●●●●
●
●●●●●●●●●●●●●●●●●●●●●●●●●●●●●
●
●●●●●●●●●
●
●●●●●●●●
●
●●●●●●●●●●●●●●●●●●●●●●●●●●●●●●●●●●●●●●●●●●
●
●●●●●●●●●●●●●●●●●●●●●●●●●●●●●●●●●●●●●
●
●●●
●
●●●●●●●●●●●●●
●
●●●●●●●●●●●●●●●●●●●
●●
●
●●●
●
●
●
●
●
●
●
●
●
●
●
●
●●●●●●●●●
●
●●
●
●●●●●●●●●●●●●●
●
●●●●●●●●●
●
●●●●
●
●●●●●●●●●
●
●●●●
●
●●●●
●
●
●
●●●
●
●●
●
●●●●●
●
●●●
●
●●●●●●●●●●●●●●●●●●●●
●
●●
●
●●●
●
●
●
●
●
●●●●●●●●●●●●●
●
●●●●●●●●●●●●●●●●●●●●
●
●●●●
●
●●●
●
●
●●●●●
●
●●●●●●●●
●
●●●●●●●
●
●●●●●●●●
●
●
●●●●
●●●●●●●●●
●
●●
●
●●●●●●●●●●●●●●
●
●●●●●●●●●
●
●●●●
●
●●●●●●●●●
●
●●●●
●
●●●●
●
●
●
●●●
●
●●
●
●●●●●
●
●●●
●
●●●●●●●●●●●●●●●●●●●●
●
●●
●
●●●
●
●
●
●
●
●●●●●●●●●●●●●
●
●●●●●●●●●●●●●●●●●●●●
●
●●●●
●
●●●
●
●
●●●●●
●
●●●●●●●●
●
●●●●●●●
●
●●●●●●●●
●
●
●●●●
●●●●●●●●●
●
●●
●
●●●●●●●●●●●●●●
●
●●●●
●
●●●●
●
●●●●
●
●●●●●●●●●
●
●●●●
●
●●●●
●
●
●
●●●
●
●●
●
●●●●●
●
●●●
●
●●●●●●●●●●●●●●●●●●●●
●
●●
●
●●●
●
●
●
●
●
●●●●●●●●●●●●
●●
●●●●●●●●●●●●●●●●●●●●
●
●●●●
●
●●●
●
●●●●●●
●
●●●●●●●●
●
●●●●●●●●●●●●●
●
●●●
●
●●●●
●●●●●●●●●
●
●●
●
●●●●●●●●●●●●●●
●
●●●●
●
●●●●
●
●●●●
●
●●●●●●●●●
●
●●●●
●
●●●●
●
●
●
●●●
●
●●
●
●●●●●
●
●●●
●
●●●●●●●●●●●●●●●●●●●●
●
●●
●
●●●
●
●
●
●
●
●●●●●●●●●●●●
●●
●●●●●●●●●●●●●●●●●●●●
●
●●●●
●
●●●
●
●●●●●●
●
●●●●●●●●
●
●●●●●●●●●●●●●
●
●●●
●
●●●●
λ
e 1,g
e 2,g
e 1,b
e 2,b
π g(1)
π b(1)
π g(2)
π b(2)
0.0
0.2
0.4
0.6
0.8
Parameters
Val
ue
Figure 5.6: Boxplot of the final best solutions and energy consumption of channel 1 ontop and boxplot of the parameters on bottom, for the Energy Consumption Gap of DPOECwith respect only to the fixed policies. Maximum Best Solution obtained is ≈ 7.02 dB,minimum Best Solution obtained is ≈ 3.17 dB, median is ≈ 5.44 dB, and the mean of theBest Solution is ≈ 5.68 dB.
prevented the algorithm from exploring solutions of the Energy Consumption Gap ofDPOEC where the energy consumption of channel 1 was low. When the energy con-sumptions of both channels are close, DPOEC has the same performance as DPOCU (seeSection 5.3.1), which means the algorithm needed to find areas of the parameter spacewhere DPOEC had advantage when compared to DPOCU. Now that we exclude DPOCUfrom the analysis, the results shows a similarity with the ones obtained in Section 5.3.1.
Figure 5.7 shows the relation of the maximum Best Solution of the Energy Consump-tion Gap of DPOEC with respect only to the fixed policies and the energy consumption ofchannel 1. We performed an extra set of analyses where we set the energy consumption ofchannel 1 static at E1 = 2,4,6,8 times the consumption of channel 2, E2. In general, theincrease of channel 1 energy consumption leads to the reduction of the value of the Best
Solution achievable, that is, to the reduction of the possible gains using a dynamic policy.
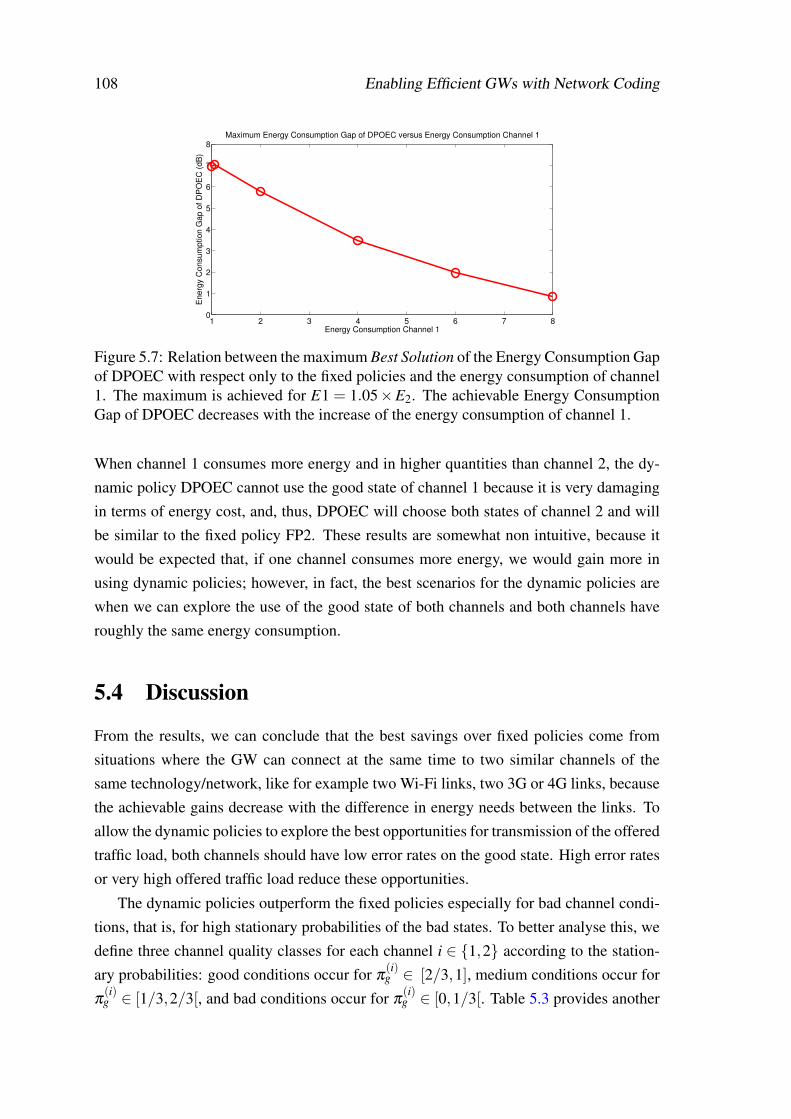
108 Enabling Efficient GWs with Network Coding
1 2 3 4 5 6 7 80
1
2
3
4
5
6
7
8Maximum Energy Consumption Gap of DPOEC versus Energy Consumption Channel 1
Energy Consumption Channel 1
En
erg
y C
on
su
mp
tio
n G
ap
of
DP
OE
C (
dB
)
Figure 5.7: Relation between the maximum Best Solution of the Energy Consumption Gapof DPOEC with respect only to the fixed policies and the energy consumption of channel1. The maximum is achieved for E1 = 1.05×E2. The achievable Energy ConsumptionGap of DPOEC decreases with the increase of the energy consumption of channel 1.
When channel 1 consumes more energy and in higher quantities than channel 2, the dy-namic policy DPOEC cannot use the good state of channel 1 because it is very damagingin terms of energy cost, and, thus, DPOEC will choose both states of channel 2 and willbe similar to the fixed policy FP2. These results are somewhat non intuitive, because itwould be expected that, if one channel consumes more energy, we would gain more inusing dynamic policies; however, in fact, the best scenarios for the dynamic policies arewhen we can explore the use of the good state of both channels and both channels haveroughly the same energy consumption.
5.4 Discussion
From the results, we can conclude that the best savings over fixed policies come fromsituations where the GW can connect at the same time to two similar channels of thesame technology/network, like for example two Wi-Fi links, two 3G or 4G links, becausethe achievable gains decrease with the difference in energy needs between the links. Toallow the dynamic policies to explore the best opportunities for transmission of the offeredtraffic load, both channels should have low error rates on the good state. High error ratesor very high offered traffic load reduce these opportunities.
The dynamic policies outperform the fixed policies especially for bad channel condi-tions, that is, for high stationary probabilities of the bad states. To better analyse this, wedefine three channel quality classes for each channel i ∈ {1,2} according to the station-ary probabilities: good conditions occur for π
(i)g ∈ [2/3,1], medium conditions occur for
π(i)g ∈ [1/3,2/3[, and bad conditions occur for π
(i)g ∈ [0,1/3[. Table 5.3 provides another

5.4 Discussion 109
Table 5.3: Maximum, mean, and median gains (in dB) obtained for the Channel Utiliza-tion Gap of DPOCU (same as Energy Consumption Gap of DPOEC when the two chan-nels have the same energy consumption) with respect to the fixed policies under good,medium, and bad channel conditions.
Channel 1 Channel 2 Either Channel Both Channels
Good
Max 2.0931 2.0396 2.0931 1.4840
Mean 0.0798 0.0795 0.0877 0.0599
Median 0 0 0 0
Medium
Max 3.9482 3.9451 3.9482 3.8340
Mean 0.4726 0.3841 0.3881 0.5806
Median 0.0639 0.0202 0.0163 0.2264
Bad
Max 6.9553 6.9553 6.9553 6.9553
Mean 1.5284 1.2813 1.0934 2.4875
Median 0.6371 0.2399 0.2164 2.9796
view of the results previously shown in Section 5.3.1, showing the maximum, mean, andmedian gains obtained for each class for the Channel Utilization Gap of DPOCU. Theresults are separated according to which channel has the channel conditions identified onthe left, i.e. depending on whether it is channel 1, channel 2, either channel, or bothchannels stationary probabilities that belong to the channel quality class.
We observe that having longer periods of medium or bad channel conditions leads tohigher gains, confirming the results from Figure 5.2. Conversely, when at least one of thechannels is bad the gains are on average above 1 dB, and when both channels are bad theaverage gain is more than 2 dB.
Bad channel conditions occur often in real wireless and cellular networks and oftenthere is more than one possible communication link, e.g., dense Wi-Fi deployments orindoor cellular coverage. Our results show that using network coding for taking advantageof multiple available links enables using less resources, e.g. channel time, to providethe desired service to the user. Better results occur for low offered traffic load sincedynamic policies can take advantage of opportunistic transmissions and decide the bestallocation, while for high offered traffic load it is necessary to transmit even under badchannel conditions.


Chapter 6
Conclusions and Future Work
The main concluding remarks are presented in this chapter. The conclusions of this dis-sertation are presented in Section 6.1, and open challenges and research lines that can bepursued in the future are discussed in Section 6.2.
6.1 Conclusions
Mobile M2M communications are currently receiving attention from the academia dueto its potentiality in ubiquitous applications, like mobile healthcare, telemetry, or in in-telligent transport systems, and also due to the emergence of the IoT paradigm. M2Mmiddleware standards allowed the emergence of several IoT applications by permittinginteroperability and easing the effort of development and deployment; however, M2Mcommunications in cellular and wireless networks face several challenges.
The performance of M2M in a context of IoT applications was not present in lit-erature. Thus, our first research question was: "What is the performance of current IoT
applications settled in state-of-the-art standards with mobile GWs?". To answer this ques-tion, we presented an experimental characterization of latency and application overheadsin an IoT application of service composition with mobile GWs. For that, we designedand implemented a mobile e-health use case, combining ETSI M2M communicationsand openEHR, that monitored 10 people for 3 weeks. We observed that M2M resourcestructure paths contribute a lot to the overhead, but protocol headers only a small part.Furthermore, latency between the smartphone and broker contributes to a large portionof the E2E latency, and depends on the mobility. We also verified that the access net-work makes up most of that latency due to the promotion delay. We conclude that M2Mmiddleware should provide means to support low latency for applications with real-timerequirements and that this may be a trade-off with functionality/complexity. Finally, we
111
112 Conclusions and Future Work
highlighted some lines along which the current developments in networking may con-tribute to address some of the problems identified.
Although smartphones are fitted to serve as M2M GWs, that use can introduce unde-sirable battery depletion which can difficult the user adoption of IoT applications. Carefulselection of transmission technologies should be made in order for their use to the feasiblein terms of a normal depletion time of a smartphone’s battery, and transmission schedul-ing, mechanisms, and techniques should be devised. Thus, improving smartphone’s bat-tery life and usability.
Our second research question was: "What improvements can packet transmission
scheduling bring to multi-homed GWs in IoT applications?". We presented a packet trans-mission scheduling LP model that optimizes a given objective for heterogeneous networkswhile guaranteeing time requirements, and we focused on the minimization of the energyconsumption. To simplify the complexity of solving the model, we devised a packettransmission scheduling heuristic that allows IoT applications to make fast schedulingdecisions, by taking into consideration the knowledge obtained from energy-optimal al-locations. We compared the performance of the optimal scheduling that minimizes theenergy consumption against EDF, an energy-aware heuristic based on EDF, and our ownheuristic, for a wide set of scenarios. We observed that the energy-optimal scheduling andour heuristic perform similarly in terms of the average energy consumption, with signifi-cant energy reductions when compared with the other two, though increasing the averagepacket waiting time. Nevertheless, these energy savings can be crucial to extend smart-phones’ battery life. We observed that scheduling obtained from the LP model requiresignificantly more time for finding solutions than the heuristic-based scheduling, and thusthey may be impractical for use in M2M GWs. Further, as both heuristics show goodperformance, with respect either to energy or time, they can be a fit replacement for them.
Finally, in this work, we sought to identify the operating regions under which dynamiccoded policies bring most benefits in terms of resource usage efficiency to M2M GWs,answering the question: "When are network coding based dynamic techniques beneficial
for multi-homed GWs in IoT applications?". We proposed meta-heuristics to explore theparameter space, not only to find different local optima, but also to map areas whose per-formance is above a certain level. The results demonstrated that opportunistic assignmentof the traffic load over heterogeneous time-varying channels can in fact achieve consid-erable gains. In particular, dynamic network coding policies allow energy consumptionand channel utilization savings over 5 dB with respect to the best static policy in a largenumber of scenarios.

6.2 Future Work 113
6.2 Future Work
M2M communications have the potential to introduce decisive advantages to different IoTfields; however, it is clear they will face several challenges and requirements. The supportof multitude and diversity of devices, and the traffic volume and traffic pattern generatedfrom them will continue to be important challenges in mobile M2M communications,specially if there is not a careful plan of the networks.
The access network of the M2M GW is a limiting factor, both in terms of energy con-sumption and latency, and thus IoT applications need to cautiously coordinate the networkaccess. Devising models to allow schedule packet transmissions in order to minimize en-ergy consumption, while guaranteeing QoS depending of specific application deadlinesand networks characteristics, becomes crucial, specially for scenarios where IoT devicesmust operate for very long periods of time without replacements or interventions. Fu-ture work should include implementation of the different scheduling in an M2M GW toevaluate and compare their real performance in terms of energy consumption and time-related metrics for several scenarios. The design of meta-heuristics to ease the effort offinding the optimal solution from the model can be an efficient way for searching config-urations where a given network is better, for analyzing the impact of modifications, or forexploring trade-offs between energy and time, e.g., by adding weights to the model’s costfunction.
In our vision, further research should continue to focus in exploring the mobile M2MGW concept by seeking ways to improve performance, while attaining the time require-ments of data, and reduce the energy consumption and bandwidth utilization in transmis-sions. Researchers should also seek to combine techniques that effectively reduce theamount of data necessary to be transmitted, such as data compression, data concatena-tion or data aggregation, with transmission scheduling schemes in order to optimize theoverall performance.
In the subject of network coding based-techniques for GWs, work should focus onscheduling algorithms that can implement the policies through single packet decisions,incorporate unreliable estimates of the channel, and explicit trade-offs between latency,energy, and economic cost.


Appendix A
Dynamic Load Allocation forMulti-homing via Coded Packets
115

Dynamic Load Allocation for Multi-homing via Coded Packets 117
Allocation Policies
In [PAL13], we consider two scenarios: a simplified one in which both channels offerthe same data rate but have different quality and energy consumption; and another onein which channels offers multiple different data rates. For the first scenario, the fixedpolicies are the ones presented in Section 5.1.1, named FPC1 and FPC2 in here, while forthe second we define the following fixed policies:
• Highest Data Rate (HDR) - Assigns transmissions first to the channel with the high-est data rate. If additional resources are needed, the modulation and coding pairwith the second highest rate is activated and so on;
• Lowest Data Rate (LDR) - Follows the reverse order from HDR, i.e., the assign-ments are made first to the modulation and coding pairs with the lowest data rate(and highest resiliency).
Mapping Wireless Technologies to Gilbert-Elliot ChannelModels
For the evaluation, we consider two channels, channel 1 and channel 2. The first oneis inspired by a Wi-Fi network, which can transmit at data rates of 1 and 2 Mbps usingBinary Phase-shift Keying (BPSK) and Quadrature PSK, respectively, and no error cor-recting codes. These settings correspond to M11 and M12. The second one is an EnhancedDate Rates For GSM Evolution (EDGE)-inspired channel using 8-PSK for modulationand convolutional codes of 1
3 and 12 , which corresponds to M21 and M22, respectively.
For decoding in the EDGE-inspired channel, we use the Viterbi algorithm with constraintlength of 7 with hard decision decoding [Vit71].
We relate our two-state Gilbert-Elliot model to Rayleigh fading by dividing the rangeof the received Signal-to-Noise Ratio (SNR) into a Finite-State Markov Channel (FSMC),as proposed in [WM95]. Although our system is packet based, the slow-fading assump-tions hold if we consider walking speed and existing cellular and Wi-Fi carrier frequen-cies.
For each channel, we divide the received SNR range in two states, defining the thresh-olds as being 0 = A0 < A1 < A2 = ∞ [WM95]. Thus, the channel is in state g for SNRs∈ [A1,∞[ and in state b for SNRs ∈ [0,A1[. The received SNR has an exponential pdfwith average value ρ = E[SNR], and the stationary state probability for each state can beobtained by integrating it over the corresponding SNR range. Moreover, we assume that

118 Dynamic Load Allocation for Multi-homing via Coded Packets
the channel is affected by Additive White Gaussian Noise (AWGN) with spectral densityequal to N0/2 and there is no interference from other users. The expected symbol errorprobability on channel i for each state and modulation Sei,c,Mi j can be obtained from theexpected symbol error probability in each state and the respective stationary probability.We consider that errors in two different symbols are independent and all symbols in apacket have the same energy. Without error correction codes the packet erasure probabil-ity on channel i is described as ei,c,Mi j = 1−(1−Sei,c,Mi j)
N , c= {g,b}where N representsthe number of symbols per packet.
A convolutional code with a kn rate has a bit error probability upper bounded by Pb <
1k ∑
∞d=d f ree
BdP(d), where d f ree is the free distance of the convolutional code, P(d) is theprobability of the decoder selecting an incorrect path with distance d to the correct path,the weighting coefficient Bd is the total number of information bit ones on all weight d
paths, and k is the number of information bits [Vit71]. P(d) is determined taking intoaccount the type of the modulation used, and, for a coding rate r and 8-PSK, the biterror probability p can be computed as p ≈ 1
3er f c(√
3r EbNo
sin π
8 ). The parameters of
the convolutional code for coding rates 12 and 1
3 can be obtained from [Ha10]. For ourpurposes, we consider the bit error probability Pb to be equal to the upper bound, in orderto consider the worst case scenario. The packet erasure probability for channels that useerror correcting codes is computed as ei,c,Mi j = 1− (1− Pbi,c,Mi j)
k, c = {g,b}, wherePbi,c,Mi j is the bit error probability after correction for channel i on state c and modulationMi j.
To determine the transition probabilities for the Markov chain, we consider the num-ber of times per second the received SNR level crosses threshold A1 downwards Ni =√
2πA1ρ× f mi× exp{−A1
ρ}, where f m is the doppler frequency. If a channel has a trans-
mission rate of R packets per second, then Rc = R×πc packets per second are transmittedwhen the channel is in state c. The Markov transition probabilities for channel i are givenby p(i)g ≈ 1− Ni
R1and p(i)b ≈ 1− Ni
R0.
Numerical Results
We use MATLAB to perform simulations to characterize the gains that can be obtainedby leveraging multi-homing for simultaneous use of multiple wireless networks. Theperformance metrics are the ones presented in Section 5.1.2.

Dynamic Load Allocation for Multi-homing via Coded Packets 119
0 0.5 1 1.5 20
0.5
1
1.5
2
2.5
3
3.5
λ (Packets/slot)
Cha
nnel
Util
izat
ion
Gap
of D
PO
CU
(dB
)
FPC1FPC2DPOEC
Figure A.1: Channel Utilization Gap of DPOCU for different source rates. Parameters:e1,g = 0.05, e2,g = 0.05, e1,b = 0.5, e2,b = 0.8, p(1)g = 0.7, p(2)g = 0.7, p(1)b = 0.85, p(2)b =0.85, and ECh1 = 3×ECh2.
Networks Operating at the Same, Fixed Data Rate
In the following, we present the results obtained for a scenario where the same fixed datarate is available to the user in the two channels, i.e., M11 = M12 = M21 = M22.
Figure A.1 shows the Channel Utilization Gap of DPOCU for different source rates(λ ) along the interval [0,2] with the parameters stated in the figure. Although channel 1has a higher energy cost than channel 2, it has lower erasure probability in the bad state(e(1,b) < e(2,b)). DPOCU reduces the channel utilization for a source rate between 0.3 and1.1 packets/slot with respect to all other assignment schemes, namely a reduction of upto 3 dB (50% reduction) relative to FPC2, and up to 1.5 dB (30% reduction) relative toDPOEC and FPC1. Additionally, the figure shows that, for a source rate between 0.3 and0.65 packets/slot, both dynamic policies perform better than any fixed policy.
Figure A.2 presents the Energy Consumption Gap of DPOEC for the same scenario.When compared to DPOCU and FPC1 policies, DPOEC permits to save almost 5 dB(70% reduction) of energy consumption for small source rate values because channel 2is less energy expensive and DPOEC can use it in the good state with the same erasureprobability as channel 1. Also, DPOEC reduces energy consumption in relation to FPC1due to the higher energy costs of channel 2. DPOEC outperforms FPC2 by up to 1 dB(20% reduction) for a source rate between 0.3 and 0.75.
Figure A.3 shows the variation of the Energy Consumption Gap of DPOEC for asource rate of 0.5 packets/slot while varying ECh1/ECh2, the energy ratio between chan-nels, from 0.5 to 5. The erasure and transition probabilities remain unchanged. ForECh1/ECh2 = 0.5, the fixed policy FPC1 is equal to the dynamic policy DPOEC because
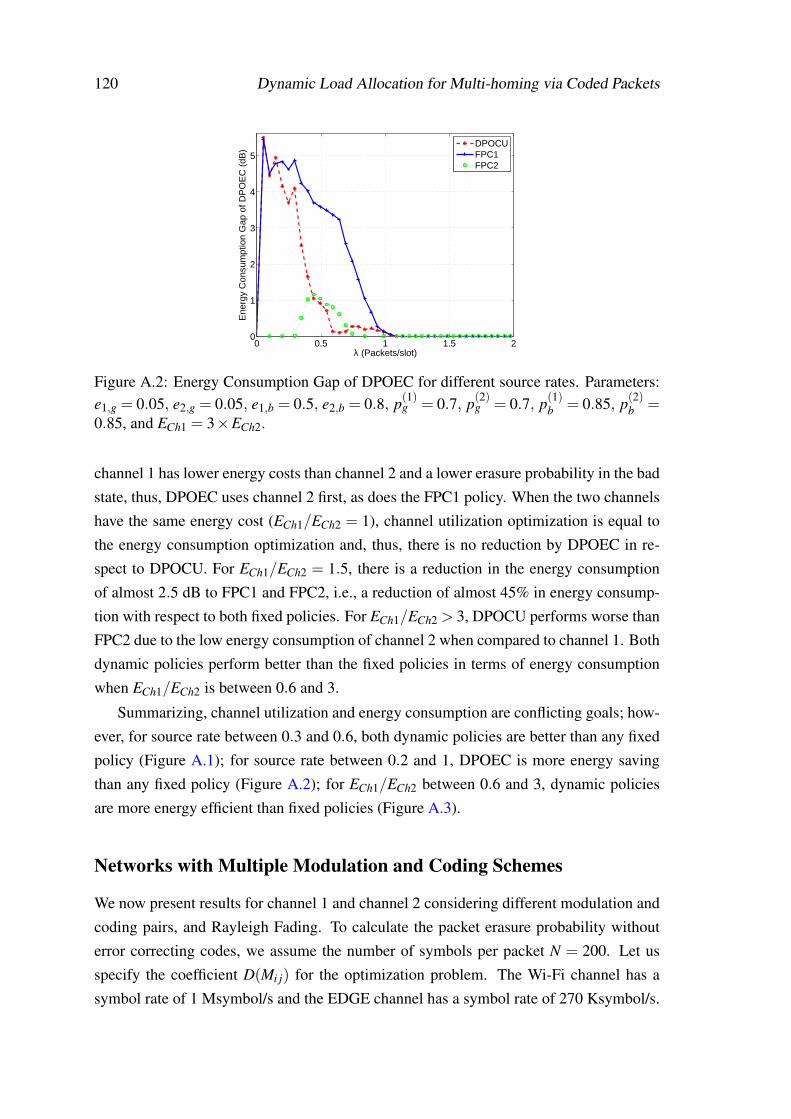
120 Dynamic Load Allocation for Multi-homing via Coded Packets
0 0.5 1 1.5 20
1
2
3
4
5
λ (Packets/slot)
Ene
rgy
Con
sum
ptio
n G
ap o
f DP
OE
C (
dB)
DPOCUFPC1FPC2
Figure A.2: Energy Consumption Gap of DPOEC for different source rates. Parameters:e1,g = 0.05, e2,g = 0.05, e1,b = 0.5, e2,b = 0.8, p(1)g = 0.7, p(2)g = 0.7, p(1)b = 0.85, p(2)b =0.85, and ECh1 = 3×ECh2.
channel 1 has lower energy costs than channel 2 and a lower erasure probability in the badstate, thus, DPOEC uses channel 2 first, as does the FPC1 policy. When the two channelshave the same energy cost (ECh1/ECh2 = 1), channel utilization optimization is equal tothe energy consumption optimization and, thus, there is no reduction by DPOEC in re-spect to DPOCU. For ECh1/ECh2 = 1.5, there is a reduction in the energy consumptionof almost 2.5 dB to FPC1 and FPC2, i.e., a reduction of almost 45% in energy consump-tion with respect to both fixed policies. For ECh1/ECh2 > 3, DPOCU performs worse thanFPC2 due to the low energy consumption of channel 2 when compared to channel 1. Bothdynamic policies perform better than the fixed policies in terms of energy consumptionwhen ECh1/ECh2 is between 0.6 and 3.
Summarizing, channel utilization and energy consumption are conflicting goals; how-ever, for source rate between 0.3 and 0.6, both dynamic policies are better than any fixedpolicy (Figure A.1); for source rate between 0.2 and 1, DPOEC is more energy savingthan any fixed policy (Figure A.2); for ECh1/ECh2 between 0.6 and 3, dynamic policiesare more energy efficient than fixed policies (Figure A.3).
Networks with Multiple Modulation and Coding Schemes
We now present results for channel 1 and channel 2 considering different modulation andcoding pairs, and Rayleigh Fading. To calculate the packet erasure probability withouterror correcting codes, we assume the number of symbols per packet N = 200. Let usspecify the coefficient D(Mi j) for the optimization problem. The Wi-Fi channel has asymbol rate of 1 Msymbol/s and the EDGE channel has a symbol rate of 270 Ksymbol/s.
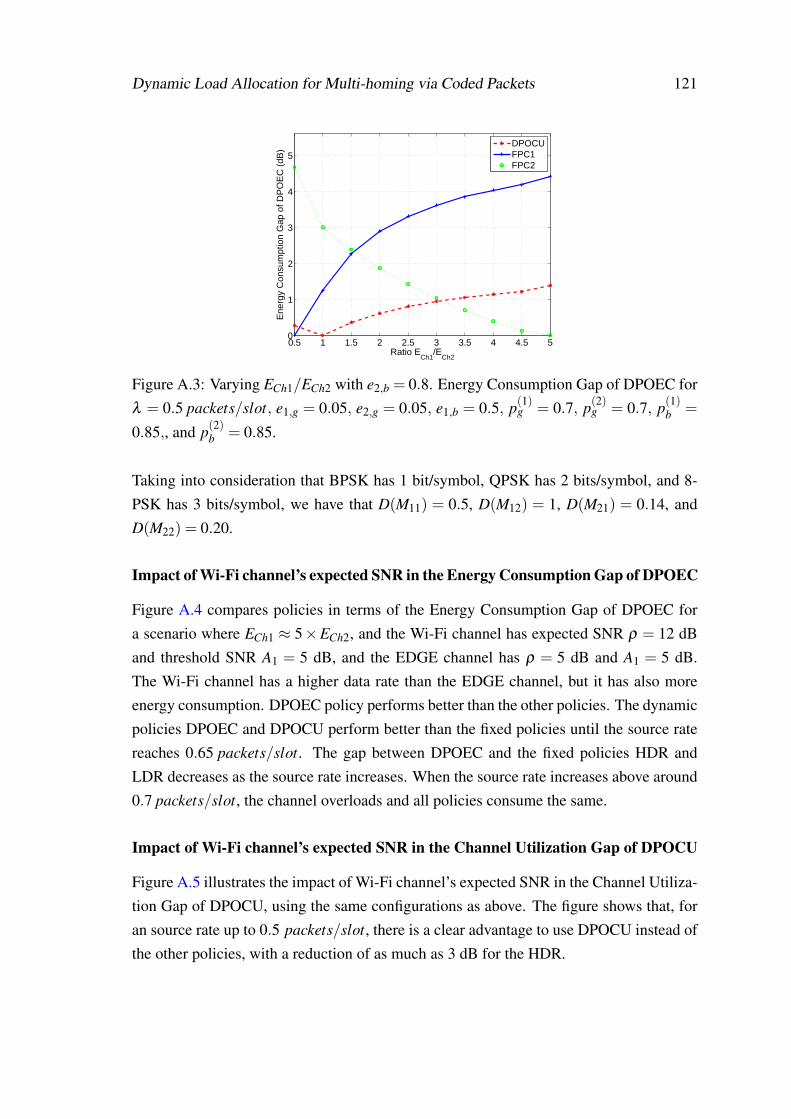
Dynamic Load Allocation for Multi-homing via Coded Packets 121
0.5 1 1.5 2 2.5 3 3.5 4 4.5 50
1
2
3
4
5
Ratio ECh1
/ECh2
Ene
rgy
Con
sum
ptio
n G
ap o
f DP
OE
C (
dB)
DPOCUFPC1FPC2
Figure A.3: Varying ECh1/ECh2 with e2,b = 0.8. Energy Consumption Gap of DPOEC forλ = 0.5 packets/slot, e1,g = 0.05, e2,g = 0.05, e1,b = 0.5, p(1)g = 0.7, p(2)g = 0.7, p(1)b =
0.85,, and p(2)b = 0.85.
Taking into consideration that BPSK has 1 bit/symbol, QPSK has 2 bits/symbol, and 8-PSK has 3 bits/symbol, we have that D(M11) = 0.5, D(M12) = 1, D(M21) = 0.14, andD(M22) = 0.20.
Impact of Wi-Fi channel’s expected SNR in the Energy Consumption Gap of DPOEC
Figure A.4 compares policies in terms of the Energy Consumption Gap of DPOEC fora scenario where ECh1 ≈ 5×ECh2, and the Wi-Fi channel has expected SNR ρ = 12 dBand threshold SNR A1 = 5 dB, and the EDGE channel has ρ = 5 dB and A1 = 5 dB.The Wi-Fi channel has a higher data rate than the EDGE channel, but it has also moreenergy consumption. DPOEC policy performs better than the other policies. The dynamicpolicies DPOEC and DPOCU perform better than the fixed policies until the source ratereaches 0.65 packets/slot. The gap between DPOEC and the fixed policies HDR andLDR decreases as the source rate increases. When the source rate increases above around0.7 packets/slot, the channel overloads and all policies consume the same.
Impact of Wi-Fi channel’s expected SNR in the Channel Utilization Gap of DPOCU
Figure A.5 illustrates the impact of Wi-Fi channel’s expected SNR in the Channel Utiliza-tion Gap of DPOCU, using the same configurations as above. The figure shows that, foran source rate up to 0.5 packets/slot, there is a clear advantage to use DPOCU instead ofthe other policies, with a reduction of as much as 3 dB for the HDR.

0 0.5 1 1.5 20
0.5
1
1.5
2
2.5
3
λ (Packets/slot)
Ene
rgy
Con
sum
ptio
n G
ap o
f DP
OE
C (
dB)
DPOCUHDRLDR
Figure A.4: Energy Consumption Gap of DPOEC when compared with the other policiesfor different source rates and ECh1 ≈ 5×ECh2. Parameters obtained from FSMC withWi-Fi channel’s ρ = 12 dB and A1 = 5 dB, and EDGE channel’s ρ = 5 dB and A1 = 5dB.
0 0.5 1 1.5 20
1
2
3
4
5
6
7
8
9
λ (Packets/slot)
Cha
nnel
Util
izat
ion
Gap
of D
PO
CU
(dB
)
HDRLDRDPOEC
Figure A.5: Channel Utilization Gap of DPOCU when compared with the other policiesfor different source rates and ECh1 ≈ 5×ECh2. Parameters obtained from FSMC withWi-Fi channel’s ρ = 12 dB and A1 = 5 dB, and EDGE channel’s ρ = 5 dB and A1 = 5dB.

Bibliography
[ABC+14] J.G. Andrews, S. Buzzi, Wan Choi, S.V. Hanly, A. Lozano, A.C.K.Soong, and J.C. Zhang. What will 5g be? IEEE Journal on SelectedAreas in Communications, 32(6):1065–1082, June 2014.
[ACLY00] R. Ahlswede, Ning Cai, S.-Y.R. Li, and R.W. Yeung. Network informa-tion flow. IEEE Transactions on Information Theory, 46(4):1204–1216,July 2000.
[ADA+17] A. Aijaz, M. Dohler, A. H. Aghvami, V. Friderikos, and M. Frodigh.Realizing the tactile internet: Haptic communications over next genera-tion 5g cellular networks. IEEE Wireless Communications, PP(99):2–9,Oct. 2017.
[AFBC14] R. Alberts, T. Fogwill, A. Botra, and M. Cretty. An integrative ict plat-form for ehealth. In 2014 IST-Africa Conference Proceedings, pages1–8, May 2014.
[AKZa] Guy Almes, Sunil Kalidindi, and Matthew Zekauskas. A One-wayDelay Metric for IPPM, IETF RFC 2679. [Online]. Available: https://tools.ietf.org/html/rfc2679. [Last access: 15-May-2017].
[AKZb] Guy Almes, Sunil Kalidindi, and Matthew Zekauskas. A Round-tripDelay Metric for IPPM, IETF RFC 2681. [Online]. Available: https://tools.ietf.org/html/rfc2681. [Last access: 15-May-2017].
[ALT14] Alcatel-Lucent and Telefonica. Why distribution matters in nfv. [On-line]. Available: http://www.tmcnet.com/tmc/whitepapers/documents/whitepapers/2014/10462-why-distribution-matters-nfv.pdf, Aug. 2014.[Last access: 15-May-2017].
[AMMMA04] H. Aydin, R. Melhem, D. Mosse, and P. Mejia-Alvarez. Power-awarescheduling for periodic real-time tasks. IEEE Transactions on Comput-ers, 53(5):584–600, May 2004.
[AMQ] OASIS AMQP. Protocol Specification. [Online]. Available: http://docs.oasis-open.org/amqp/core/v1.0/os/amqp-core-complete-v1.0-os.pdf.[Last access: 15-May-2017].
123

124 BIBLIOGRAPHY
[AMSS08] Aditya Akella, Bruce Maggs, Srinivasan Seshan, and Anees Shaikh.On the performance benefits of multihoming route control. IEEE/ACMTransactions on Networking, 16(1):91–104, Feb. 2008.
[Apa] Apache. HttpClient for Android. [Online]. Available: https://hc.apache.org/httpcomponents-client-4.3.x/android-port.html. [Last access: 15-May-2017].
[ARA12] M.R. Alam, M.B.I. Reaz, and M.A.M. Ali. A review of smart homes- past, present, and future. IEEE Transactions on Systems, Man, andCybernetics, Part C: Applications and Reviews, 42(6):1190–1203, Nov.2012.
[Area] GSM Arena. LG Nexus 4 E960 Specifications. [Online]. Available:http://www.gsmarena.com/lg_nexus_4_e960-5048.php. [Last access:15-May-2017].
[Areb] GSM Arena. Motorola Moto G (2nd gen) Specifications. [On-line]. Available: http://www.gsmarena.com/motorola_moto_g_(2nd_gen)-6647.php. [Last access: 15-May-2017].
[Bak74] Frank B. Baker. Stability of two hierarchical grouping techniques case1: Sensitivity to data errors. Journal of the American Statistical Associ-ation, 69(346):440–445, Dec. 1974.
[BB13] A. Bhattacharyya and S. Bandyopadhyay. Lightweight Internet proto-cols for web enablement of sensors using constrained gateway devices.In 2013 International Conference on Computing, Networking and Com-munications (ICNC), pages 334–340, 2013.
[BBV09] Niranjan Balasubramanian, Aruna Balasubramanian, and ArunVenkataramani. Energy consumption in mobile phones: A measurementstudy and implications for network applications. In Proceedings of the9th ACM SIGCOMM Conference on Internet Measurement Conference,IMC ’09, pages 280–293, New York, NY, USA, Nov. 2009. ACM.
[BCM+12] N. Buonaccorsi, C. Cicconetti, R. Mambrini, N. Podias, and P. Rus-sell. ETSI M2M release 1 demonstration. In 2012 IEEE InternationalSymposium on a World of Wireless, Mobile and Multimedia Networks(WoWMoM), pages 1–3, 2012.
[BCS12] C. Bormann, A.P. Castellani, and Z. Shelby. CoAP: An ApplicationProtocol for Billions of Tiny Internet Nodes. IEEE Internet Computing,16(2):62–67, Mar. 2012.
[Ber] O. Bergmann. libcoap: C-Implementation of CoAP. [Online]. Avail-able: http://libcoap.sourceforge.net/. [Last access: 15-May-2017].

BIBLIOGRAPHY 125
[BGT93] C. Berrou, A. Glavieux, and P. Thitimajshima. Near shannon limit error-correcting coding and decoding: Turbo-codes. 1. In Technical Pro-gram, Conference Record IEEE International Conference on Commu-nications, 1993. ICC ’93 Geneva., volume 2, pages 1064–1070 vol.2,May 1993.
[BGZR12] M. Booysen, J. Gilmore, S. Zeadally, and G. Rooyen. Machine-to-Machine (M2M) Communications in Vehicular Networks. In KSIITransactions on Internet and Information Systems (TIIS), volume 6,pages 529–546, 2012.
[BH08] T. Beale and S. Heard. OpenEHR architecture overview. [On-line]. Available: http://www.openehr.org/releases/1.0.2/architecture/overview.pdf, 2008. [Last access: 15-May-2017].
[BKH+14] Arsany Basta, Wolfgang Kellerer, Marco Hoffmann, Hans Jochen Mor-per, and Klaus Hoffmann. Applying nfv and sdn to lte mobile core gate-ways, the functions placement problem. In Proceedings of the 4th Work-shop on All Things Cellular: Operations, Applications, & Challenges,AllThingsCellular ’14, pages 33–38, New York, NY, USA, 2014. ACM.
[BKKR13] K. Balachandran, J.H. Kang, K.M. Karakayali, and K.M. Rege.Network-centric cooperation schemes for uplink interference manage-ment in cellular networks. Bell Labs Technical Journal, 18(2):23–36,Sept. 2013.
[BL07] F. Bari and V.C.M. Leung. Automated network selection in a heteroge-neous wireless network environment. IEEE Network, 21(1):34–40, Jan.2007.
[BLPK] M. Becker, K. Li, T. Poetsch, and K. Kuladinithi. Transport of CoAPover SMS and GPRS. [Online]. Available: http://datatracker.ietf.org/doc/draft-becker-core-coap-sms-gprs/. [Last access: 15-May-2017].
[BMAB16] Mario Bambagini, Mauro Marinoni, Hakan Aydin, and Giorgio But-tazzo. Energy-aware scheduling for real-time systems: A survey. ACMTransactions on Embedded Computing Systems, 15(1):7:1–7:34, Jan.2016.
[BPW] M. Boucadair, R. Penno, and D. Wing. Universal plug and play (upnp).[Online]. Available: https://tools.ietf.org/html/rfc6970. [Last access:15-May-2017].
[BRC+07] Nilanjan Banerjee, Ahmad Rahmati, Mark D. Corner, Sami Rollins, andLin Zhong. Users and batteries: Interactions and adaptive energy man-agement in mobile systems. In John Krumm, Gregory D. Abowd, ArunaSeneviratne, and Thomas Strang, editors, Proceedings UbiComp 2007:Ubiquitous Computing: 9th International Conference, UbiComp 2007,
126 BIBLIOGRAPHY
Innsbruck, Austria, September 16-19, 2007, pages 217–234. SpringerBerlin Heidelberg, Berlin, Heidelberg, Sept. 2007.
[BWTJ11] Maged Boulos, Steve Wheeler, Carlos Tavares, and Ray Jones. HowSmartphones Are Changing the Face of Mobile and ParticipatoryHealthcare: An Overview, With Example From eCAALYX. BioMedicalEngineering OnLine, 10(24), Apr. 2011.
[CAN+11] E.H. Cherkaoui, N. Agoulmine, Thinh Nguyen, L. Toni, and J. Fontaine.Taking advantage of the diversity in wireless access networks: Onthe simulation of a user centric approach. In 2011 IFIP/IEEE Inter-national Symposium on Integrated Network Management (IM), pages1021–1028, May 2011.
[CBCM12] L. Costantino, N. Buonaccorsi, C. Cicconetti, and R. Mambrini. Per-formance analysis of an LTE gateway for the IoT. In 2012 IEEE In-ternational Symposium on a World of Wireless, Mobile and MultimediaNetworks (WoWMoM), pages 1–6, 2012.
[CCVMF+07] Ricardo J Cruz-Correia, Pedro M Vieira-Marques, Ana M Ferreira, Fil-ipa C Almeida, Jeremy C Wyatt, and Altamiro M Costa-Pereira. Re-viewing the integration of patient data: how systems are evolving inpractice to meet patient needs. BMC Medical Informatics and DecisionMaking, 7(1):14, June 2007.
[CDBN09] A. Caragliu, C. Del Bo, and P. Nijkamp. Smart cities in Europe. In Pro-ceeding of the 3rd Central European Conference in Regional Science,2009.
[CdDM+15] L. Catarinucci, D. de Donno, L. Mainetti, L. Palano, L. Patrono, M.L.Stefanizzi, and L. Tarricone. An iot-aware architecture for smart health-care systems. IEEE Internet of Things Journal, 2(6):515–526, Dec.2015.
[CdPCZ+13] J. Cloud, F. du Pin Calmon, Weifei Zeng, G. Pau, L.M. Zeger, andM. Medard. Multi-path tcp with network coding for mobile devicesin heterogeneous networks. In Vehicular Technology Conference (VTCFall), 2013 IEEE 78th, pages 1–5, Sept. 2013.
[Che12] K. Chen. Machine-to-machine communications for healthcare. Journalof Computing Science and Engineering, 6(2):119–126, 2012.
[Cis14] Cisco. Cisco visual networking index: Global mobile data traffic fore-cast update, 2013-2018, 2014.
[CK] S. Cheshire and M. Krochmal. Nat port mapping protocol (nat-pmp).[Online]. Available: https://tools.ietf.org/html/rfc6886. [Last access:15-May-2017].
BIBLIOGRAPHY 127
[CK04] C. Cetinkaya and E.W. Knightly. Opportunistic traffic scheduling overmultiple network paths. In INFOCOM 2004. Twenty-third AnnualJointConference of the IEEE Computer and Communications Societies, vol-ume 3, pages 1928–1937 vol.3, Mar. 2004.
[CKM+08] Sunny Consolvo, Predrag Klasnja, David W. McDonald, Daniel Avra-hami, Jon Froehlich, Louis LeGrand, Ryan Libby, Keith Mosher, andJames A. Landay. Flowers or a robot army? encouraging awareness& activity with personal, mobile displays. In Proceedings of the 10thInternational Conference on Ubiquitous Computing, pages 54–63, NewYork, NY, USA, 2008.
[CR06] K. Chebrolu and R.R. Rao. Bandwidth aggregation for real-time ap-plications in heterogeneous wireless networks. IEEE Transactions onMobile Computing, 5(4):388–403, Apr. 2006.
[CS14] Nelson Capela and Susana Sargento. Multihoming and network cod-ing: A new approach to optimize the network performance. ComputerNetworks, 75, Part A:18 – 36, Dec. 2014.
[CSDC+11] W. Colitti, K. Steenhaut, N. De Caro, B. Buta, and V. Dobrota. RESTEnabled Wireless Sensor Networks for Seamless Integration with WebApplications. In 2011 IEEE 8th International Conference on MobileAdhoc and Sensor Systems (MASS), pages 867–872, 2011.
[DBN14] S.K. Datta, C. Bonnet, and N. Nikaein. An iot gateway centric archi-tecture to provide novel m2m services. In 2014 IEEE World Forum onInternet of Things (WF-IoT), pages 514–519, Mar. 2014.
[DCD13] E. Davis, A. Calveras, and I. Demirkol. Improving Packet Delivery Per-formance of Publish/Subscribe Protocols in Wireless Sensor Networks.Sensors, 13(1):648–680, Jan. 2013.
[DHJT+10] S. Dawson-Haggerty, X. Jiang, G. Tolle, J. Ortiz, and D. Culler. sMAP:a simple measurement and actuation profile for physical information. InProceedings of the 8th ACM Conference on Embedded Networked Sen-sor Systems, SenSys ’10, pages 197–210, New York, NY, USA, 2010.ACM.
[DHVV12] H.S. Dhillon, H.C. Huang, H. Viswanathan, and R.A. Valenzuela. Onresource allocation for machine-to-machine (M2M) communications incellular networks. In 2012 IEEE Globecom Workshops (GC Wkshps),pages 1638–1643, 2012.
[DVRT08] L. De Vito, S. Rapuano, and L. Tomaciello. One-way delay measure-ment: State of the art. IEEE Transactions on Instrumentation and Mea-surement, 57(12):2742–2750, Dec. 2008.

128 BIBLIOGRAPHY
[DWC+13] Ning Ding, Daniel Wagner, Xiaomeng Chen, Abhinav Pathak, Y. Char-lie Hu, and Andrew Rice. Characterizing and modeling the impact ofwireless signal strength on smartphone battery drain. In Proceedings ofthe ACM SIGMETRICS/International Conference on Measurement andModeling of Computer Systems, SIGMETRICS ’13, pages 29–40, NewYork, NY, USA, June 2013. ACM.
[EC02] Vladimir Estivill-Castro. Why so many clustering algorithms: A posi-tion paper. SIGKDD Explorations Newsletter, 4(1):65–75, June 2002.
[Ecl] Eclipse. Eclipse Californium (Cf) CoAP Framework. [Online]. Avail-able: https://eclipse.org/californium/. [Last access: 15-May-2017].
[Ell63] E.O. Elliott. Estimates of error rates for codes on burst-noise channels.Bell System Technical Journal, The, 42(5):1977–1997, Sept. 1963.
[Eri14] Ericsson. Network functions virtualization and software management.[Online]. Available: http://www.ericsson.com/res/docs/whitepapers/network-functions-virtualization-and-software-management.pdf, Dec.2014. [Last access: 15-May-2017].
[Eri15] Ericsson. 5g systems. [Online]. Available: http://www.ericsson.com/res/docs/whitepapers/what-is-a-5g-system.pdf, Jan. 2015. [Last access:15-May-2017].
[Eri16] Ericsson. Ericsson Mobility Report. [Online]. Available: https://www.ericsson.com/mobility-report, 2016. [Last access: 15-May-2017].
[Eri17] Ericsson. Press release: Ericsson and vodafone study userreactions to broadband delays. [Online]. Available: https://www.ericsson.com/en/press-releases/2017/2/2079996-ericsson-and-vodafone-study-user-reactions-to-broadband-delays, 2017. [Accessed:15-May-2017].
[ETS10] ETSI. Machine 2 Machine - When the machines start talking. [On-line]. Available: http://docbox.etsi.org/Seminar/Turk_Telekom_2010/11_M2M_Presentation.ppt, May 2010. [Last access: 15-May-2017].
[ETS13a] ETSI. ETSI TR 102 725 V1.1.1 (2013-06) Machine-to-Machine com-munications (M2M); Definitions, 2013.
[ETS13b] ETSI. ETSI TR 102 732 V1.1.1 (2013-09) Machine-to-Machine Com-munications (M2M); Use Cases of M2M applications for eHealth, 2013.
[ETS13c] ETSI. ETSI TR 102 898 V1.1.1 (2013-04) Machine-to-Machine com-munications (M2M); Use cases of Automotive Applications in M2Mcapable networks, 2013.
[ETS13d] ETSI. ETSI TS 102 689 V2.1.1 (2013-07) Machine-to-Machine com-munications (M2M); M2M Service Requirements, 2013.

BIBLIOGRAPHY 129
[ETS13e] ETSI. ETSI TS 102 690 V2.1.1 (2013-10) Machine-to-Machine com-munications (M2M); Functional Architecture, 2013.
[ETS14a] ETSI. ETSI TR 102 966 V1.1.1 (2014-02) Machine-to-Machine com-munications (M2M); Interworking between the M2M Architecture andM2M Area Network technologies, 2014.
[ETS14b] ETSI. Network functions virtualisation. [Online]. Available: https://portal.etsi.org/NFV/NFV_White_Paper.pdf, Oct. 2014. [Last access:15-May-2017].
[FDK11] Denzil Ferreira, Anind K. Dey, and Vassilis Kostakos. Understandinghuman-smartphone concerns: A study of battery life. In Proceedingsof the 9th International Conference on Pervasive Computing, Perva-sive’11, pages 19–33, Berlin, Heidelberg, 2011. Springer-Verlag.
[Fet14] G. P. Fettweis. The tactile internet: Applications and challenges. IEEEVehicular Technology Magazine, 9(1):64–70, Mar. 2014.
[FEU] FEUP. High Performance Computing (HPC) at the Faculty of Engineer-ing of University of Porto. [Online]. Available: https://www.grid.fe.up.pt/web/guest/clusters. [Last access: 15-May-2017].
[FHK14] Zhong Fan, R. Haines, and P. Kulkarni. M2m communications for e-health and smart grid: an industry and standard perspective. IEEE Wire-less Communications, 21(1):62–69, Feb. 2014.
[Fie00] Roy Thomas Fielding. Architectural Styles and the Design of Network-based Software Architectures. PhD thesis, University of California,Irvine, 2000.
[FLBW06] Christina Fragouli, Jean-Yves Le Boudec, and Jörg Widmer. Networkcoding: An instant primer. SIGCOMM Computer Communication Re-view, 36(1):63–68, Jan. 2006.
[FM83] E. B. Fowlkes and C. L. Mallows. A method for comparing two hi-erarchical clusterings. Journal of the American Statistical Association,78(383):553–569, Sept. 1983.
[Fou] XMPP Standards Foundation. XMPP RFCs. [Online]. Available: http://xmpp.org/xmpp-protocols/rfcs/. [Last access: 15-May-2017].
[FRZ14] Nick Feamster, Jennifer Rexford, and Ellen Zegura. The road to sdn:An intellectual history of programmable networks. ACM SIGCOMMComputer Communication Review, 44(2):87–98, Apr. 2014.
[FZ15] J. Fabini and T. Zseby. M2M communication delay challenges: Applica-tion and measurement perspectives. In 2015 IEEE International Instru-mentation and Measurement Technology Conference (I2MTC), pages1859–1864, May 2015.

130 BIBLIOGRAPHY
[Gal62] R.G. Gallager. Low-density parity-check codes. IRE Transactions onInformation Theory, 8(1):21–28, Jan. 1962.
[Gal15] Tal Galili. dendextend: an r package for visualizing, adjusting and com-paring trees of hierarchical clustering. Bioinformatics, 31(22):3718,July 2015.
[GDD+12] N. Gligoric, T. Dimcic, D. Drajic, S. Krco, I. Dejanovic, Nhon Chu, andA. Obradovic. CoAP over SMS: Performance evaluation for machineto machine communication. In 2012 20th Telecommunications Forum(TELFOR), pages 1–4, 2012.
[GHSC+05] J. R. Gallego, A. Hernandez-Solana, M. Canales, J. Lafuente, A. Val-dovinos, and J. Fernandez-Navajas. Performance analysis of mul-tiplexed medical data transmission for mobile emergency care overthe umts channel. IEEE Transactions on Information Technology inBiomedicine, 9(1):13–22, Mar. 2005.
[GHY+15] Y. Geng, W. Hu, Y. Yang, W. Gao, and G. Cao. Energy-efficient compu-tation offloading in cellular networks. In 2015 IEEE 23rd InternationalConference on Network Protocols (ICNP), pages 145–155, Nov. 2015.
[Gil60] E.N. Gilbert. Capacity of a burst-noise channel. Bell System TechnicalJournal, The, 39(5):1253–1265, Sept. 1960.
[GIMA10] D. Giusto, A. Iera, G. Morabito, and L. Atzori. The Internet of Things.Springer-Verlag, 2010.
[GLPL14] M. Gerla, Eun-Kyu Lee, G. Pau, and Uichin Lee. Internet of vehicles:From intelligent grid to autonomous cars and vehicular clouds. In 2014IEEE World Forum on Internet of Things (WF-IoT), pages 241–246,Mar. 2014.
[Goo] Google. Android KitKat 4.4. [Online]. Available: https://www.android.com/versions/kit-kat-4-4/. [Last access: 15-May-2017].
[Gri13] I. Grigorik. High Performance Browser Networking: What everyweb developer should know about networking and web performance.O’Reilly Media, 2013.
[Gro16] NetWorld2020 Expert Group. Service level awareness andopen multi-service internetworking - principles and poten-tials of an evolved internet ecosystem. [Online]. Available:http://networld2020.eu/wp-content/uploads/2016/03/NetWorld2020_WhPaper_Service-Level-Awareness_Final-Draft_0.9.5.pdf, Aug. 2016.[Last access: 15-May-2017].
[Ha10] TT. Ha. Theory and Design of Digital Communication Systems. Cam-bridge University Press, 2010.
BIBLIOGRAPHY 131
[Ham50] R.W. Hamming. Error detecting and error correcting codes. Bell SystemTechnical Journal, The, 29(2):147–160, Apr. 1950.
[Hat] S. Hattangady. Wireless M2M the Opportunity is Here! (Part 1). [On-line]. Available: http://emblazeworld.com/Attachments-Articles/2009-MayCellularWhitepaperPart1.pdf. [Last access: 15-May-2017].
[HC14a] W. Hu and G. Cao. Energy optimization through traffic aggregation inwireless networks. In IEEE INFOCOM 2014 - IEEE Conference onComputer Communications, pages 916–924, Apr. 2014.
[HC14b] Wenjie Hu and Guohong Cao. Quality-aware traffic offloading in wire-less networks. In Proceedings of the 15th ACM International Sympo-sium on Mobile Ad Hoc Networking and Computing, MobiHoc ’14,pages 277–286, New York, NY, USA, Aug. 2014. ACM.
[HEAA11] M. Haddad, S.E. Elayoubi, E. Altman, and Z. Altman. A hybrid ap-proach for radio resource management in heterogeneous cognitive net-works. IEEE Journal on Selected Areas in Communications, 29(4):831–842, Apr. 2011.
[HFR+13] Cheng-Kang Hsieh, Hossein Falaki, Nithya Ramanathan, HongsudaTangmunarunkit, and Deborah Estrin. Performance evaluation of an-droid ipc for continuous sensing applications. SIGMOBILE MobileComputing and Communications Review, 16(4):6–7, Feb. 2013.
[HJLS11] Sangchun Han, Hyunchul Joo, Dongju Lee, and Hwangjun Song. Anend-to-end virtual path construction system for stable live video stream-ing over heterogeneous wireless networks. IEEE Journal on SelectedAreas in Communications, 29(5):1032–1041, May 2011.
[HKP12] Jiawei Han, Micheline Kamber, and Jian Pei. 10 - cluster analysis: Ba-sic concepts and methods. In Jiawei Han, Micheline Kamber, and JianPei, editors, Data Mining (Third Edition), The Morgan Kaufmann Se-ries in Data Management Systems, pages 443 – 495. Morgan Kaufmann,Boston, third edition edition, 2012.
[HLP+07] William L. Haskell, I. Min Lee, Russell R. Pate, Kenneth E. Powell,Steven N. Blair, Barry a. Franklin, Caroline a. MacEra, Gregory W.Heath, Paul D. Thompson, and Adrian Bauman. Physical activity andpublic health: Updated recommendation for adults from the Ameri-can College of Sports Medicine and the American Heart Association.Medicine and Science in Sports and Exercise, 39(8):1423–1434, Aug.2007.
[HMK+06] Tracey Ho, M. Medard, R. Koetter, D.R. Karger, M. Effros, Jun Shi, andB. Leong. A random linear network coding approach to multicast. IEEETransactions on Information Theory, 52(10):4413–4430, Oct. 2006.
132 BIBLIOGRAPHY
[HNXC15] N. Herbaut, D. Negru, G. Xilouris, and Yiping Chen. Migrating to a nfv-based home gateway: Introducing a surrogate vnf approach. In 2015 6thInternational Conference on the Network of the Future (NOF), pages 1–7, Sept. 2015.
[Hov10] E.J.S. Hovenga. Health Informatics: An Overview. Studies in healthtechnology and informatics. IOS Press, 2010.
[HQG+12] Junxian Huang, Feng Qian, Alexandre Gerber, Z. Morley Mao, Sub-habrata Sen, and Oliver Spatscheck. A close examination of perfor-mance and power characteristics of 4g lte networks. In Proceedingsof the 10th International Conference on Mobile Systems, Applications,and Services, MobiSys ’12, pages 225–238, New York, NY, USA, June2012. ACM.
[HQG+13] Junxian Huang, Feng Qian, Yihua Guo, Yuanyuan Zhou, Qiang Xu,Z. Morley Mao, Subhabrata Sen, and Oliver Spatscheck. An in-depthstudy of lte: Effect of network protocol and application behavior onperformance. ACM SIGCOMM Computer Communication Review,43(4):363–374, Aug. 2013.
[HSH+06] Huaizhong Han, S. Shakkottai, C.V. Hollot, R. Srikant, and D. Towsley.Multi-path tcp: A joint congestion control and routing scheme to exploitpath diversity in the internet. IEEE/ACM Transactions on Networking,14(6):1260–1271, Dec. 2006.
[HTSC08] U. Hunkeler, Hong Linh Truong, and A. Stanford-Clark. MQTT-S: Apublish/subscribe protocol for Wireless Sensor Networks. In 3rd Inter-national Conference on Communication Systems Software and Middle-ware and Workshops, 2008. COMSWARE 2008., pages 791–798, 2008.
[HY81] C.L. Hwang and K. Yoon. Multiple attribute decision making: methodsand applications: a state-of-the-art survey. Lecture notes in economicsand mathematical systems. Springer-Verlag, 1981.
[IDC13] IDC. Press Release: The Internet of Things Is Poised to Change Every-thing, Says IDC. [Online]. Available: http://www.idc.com/getdoc.jsp?containerId=prUS24366813, Oct. 2013. [Last access: 15-May-2017].
[iP] The iCity Project. The Future Health project. [Online]. Available: http://i-city.dcc.fc.up.pt/futureHealth.html. [Last access: 15-May-2017].
[IT02] ITU-T. ITU-T Recommendation Y.1541, Network Performance Objec-tives for IP-Based Services, 2002.
[IZ14] M. Ismail and Weihua Zhuang. Mobile terminal energy managementfor sustainable multi-homing video transmission. IEEE Transactionson Wireless Communications, 13(8):4616–4627, Aug. 2014.

BIBLIOGRAPHY 133
[IZE13] M. Ismail, Weihua Zhuang, and S. Elhedhli. Energy and contentaware multi-homing video transmission in heterogeneous networks.IEEE Transactions on Wireless Communications, 12(7):3600–3610,July 2013.
[JBA+10] A.J. Jara, F.J. Belchi, A.F. Alcolea, J. Santa, M.A. Zamora-Izquierdo,and A.F. Gomez-Skarmeta. A pharmaceutical intelligent informationsystem to detect allergies and adverse drugs reactions based on inter-net of things. In 2010 8th IEEE International Conference on PervasiveComputing and Communications Workshops (PERCOM Workshops),pages 809–812, Mar. 2010.
[JMC13] S.-J. Jung, R. Myllyla, and W.-Y. Chung. Wireless machine-to-machinehealthcare solution using android mobile devices in global networks.IEEE Sensors Journal, 13(5):1419–1424, May 2013.
[JZS12] A.J. Jara, M.A. Zamora, and A.F. Skarmeta. Knowledge acquisition andmanagement architecture for mobile and personal health environmentsbased on the internet of things. In 2012 IEEE 11th International Confer-ence on Trust, Security and Privacy in Computing and Communications(TrustCom), pages 1811–1818, June 2012.
[KBP+11] K. Kuladinithi, O. Bergmann, T. Ptsch, M. Becker, and C. Göorg. Im-plementation of CoAP and its Application in Transport Logistics. InProc. IP+SN, 2011.
[KGV83] S. Kirkpatrick, C. D. Gelatt, and M. P. Vecchi. Optimization by simu-lated annealing. Science, Number 4598, 13 May 1983, 220, 4598:671–680, May 1983.
[KKNH12] J. Kellokoski, J. Koskinen, R. Nyrhinen, and T. Hamalainen. EfficientHandovers for Machine-to-Machine Communications between IEEE802.11 and 3GPP Evolved Packed Core Networks. In 2012 IEEE Inter-national Conference on Green Computing and Communications (Green-Com), pages 722–725, 2012.
[KLA+14] Elli Kartsakli, Aris S. Lalos, Angelos Antonopoulos, Stefano Tennina,Marco Di Renzo, Luis Alonso, and Christos Verikoukis. A surveyon m2m systems for mhealth: A wireless communications perspective.Sensors, 14(10):18009, Sept. 2014.
[KN10] Gary L. Kreps and Linda Neuhauser. New directions in eHealth commu-nication: Opportunities and challenges. Patient Education and Counsel-ing, 78(3):329 – 336, Mar. 2010. Changing Patient Education.
[Kol33] A. N. Kolmogorov. Sulla Determinazione Empirica di una Legge diDistribuzione. Giornale dell’Istituto Italiano degli Attuari, 4:83–91,1933.

134 BIBLIOGRAPHY
[KPP14] N. Komninos, E. Philippou, and A. Pitsillides. Survey in smart grid andsmart home security: Issues, challenges and countermeasures. IEEECommunications Surveys Tutorials, 16(4):1933–1954, Fourthquarter2014.
[KRH+08] S. Katti, H. Rahul, Wenjun Hu, D. Katabi, M. Medard, and J. Crowcroft.Xors in the air: Practical wireless network coding. IEEE/ACM Transac-tions on Networking, 16(3):497–510, June 2008.
[KWH+15] Kyungtae Kang, Qixin Wang, Junbeom Hur, Kyung-Joon Park, and LuiSha. Medical-grade quality of service for real-time mobile healthcare.Computer, 48(2):41–49, Feb. 2015.
[LAAZ14] A. Laya, L. Alonso, and J. Alonso-Zarate. Is the Random Access Chan-nel of LTE and LTE-A Suitable for M2M Communications? A Surveyof Alternatives. IEEE Communications Surveys Tutorials, 16(1):4–16,First 2014.
[LB13] Jongwook Lee and Saewoong Bahk. On the mdp-based cost minimiza-tion for video-on-demand services in a heterogeneous wireless networkwith multihomed terminals. IEEE Transactions on Mobile Computing,12(9):1737–1749, Sept. 2013.
[LCG12] Daeyoung Lee, Jong-Moon Chung, and R.C. Garcia. Machine-to-machine communication standardization trends and end-to-end serviceenhancements through vertical handover technology. In 2012 IEEE 55thInternational Midwest Symposium on Circuits and Systems (MWSCAS),pages 840–844, 2012.
[LCL11] Shao-Yu Lien, Kwang-Cheng Chen, and Yonghua Lin. Toward ubiq-uitous massive accesses in 3GPP machine-to-machine communications.IEEE, Communications Magazine, 49(4):66–74, Apr. 2011.
[LCM84] Shu Lin, Jr. Costello, D.J., and M.J. Miller. Automatic-repeat-requesterror-control schemes. IEEE Communications Magazine, 22(12):5–17,Dec. 1984.
[LCX07] Mingxin Li, Shanzhi Chen, and Dongliang Xie. A multi-step verticalhandoff mechanism for cellular multi-hop networks. In Proceedings ofthe 2Nd ACM Workshop on Performance Monitoring and Measurementof Heterogeneous Wireless and Wired Networks, PM2HW2N ’07, pages119–123. ACM, 2007.
[LDH+14] Joohyung Lee, N.T. Dinh, Ganguk Hwang, Jun Kyun Choi, and Chi-moon Han. Power-efficient load distribution for multihomed serviceswith sleep mode over heterogeneous wireless access networks. IEEETransactions on Vehicular Technology, 63(4):1843–1854, May 2014.
BIBLIOGRAPHY 135
[Les12] Heather Leslie. Introduction to Archetypes and Archetype classes. [On-line]. Available: https://openehr.atlassian.net/wiki/display/healthmod/Introduction+to+Archetypes+and+Archetype+classes, 2012. [Last ac-cess: 15-May-2017].
[Lil67] Hubert W. Lilliefors. On the kolmogorov-smirnov test for normalitywith mean and variance unknown. Journal of the American StatisticalAssociation, 62(318):399–402, June 1967.
[LJH+08] Gyu Myoung Lee, Byung-Chun Jeon, Siyoung Heo, Hanlim Kim,Jongsam Jin, and Seongchun Lee. Load balancing scheme and imple-mentation in multihoming mobile router. In IEEE Network Operationsand Management Symposium, 2008. NOMS 2008., pages 811–814, Apr.2008.
[LL73] C. L. Liu and James W. Layland. Scheduling algorithms for multi-programming in a hard-real-time environment. Journal of the ACM,20(1):46–61, Jan. 1973.
[LL11] Yin Li and Chuang Lin. Qos-aware service composition for workflow-based data-intensive applications. In 2011 IEEE International Confer-ence on Web Services (ICWS), pages 452–459, July 2011.
[LLJ13] A. Lo, Yee Law, and M. Jacobsson. A cellular-centric service architec-ture for machine-to-machine (M2M) communications. IEEE WirelessCommunications, 20(5):143–151, Oct. 2013.
[LLKC12] Shao-Yu Lien, Tzu-Huan Liau, Ching-Yueh Kao, and Kwang-ChengChen. Cooperative Access Class Barring for Machine-to-MachineCommunications. IEEE Transactions on Wireless Communications,11(1):27–32, Jan. 2012.
[LLL+11] R. Lu, X. Li, X. Liang, X. Shen, and X. Lin. GRS: The green, reliability,and security of emerging machine to machine communications. IEEECommunications Magazine, 49(4):28–35, Apr. 2011.
[LLZ06] Xiaoshan Liu, V.O.K. Li, and Ping Zhang. Nxg04-4: Joint ra-dio resource management through vertical handoffs in 4g networks.In IEEE Global Telecommunications Conference, 2006. GLOBECOM’06., pages 1–5, Nov. 2006.
[LMD+03] J. Luo, R. Mukerjee, M. Dillinger, E. Mohyeldin, and E. Schulz. Investi-gation of radio resource scheduling in WLANs coupled with 3G cellularnetwork. IEEE Communications Magazine, 41(6):108–115, June 2003.
[LMKE08] Desmond S. Lun, Muriel Medard, Ralf Koetter, and Michelle Effros.On coding for reliable communication over packet networks. PhysicsCommunications, 1(1):3–20, Mar. 2008.

136 BIBLIOGRAPHY
[LRM+06] D. S. Lun, N. Ratnakar, M. Medard, R. Koetter, D. R. Karger, T. Ho,E. Ahmed, and Fang Zhao. Minimum-cost multicast over coded packetnetworks. IEEE Transactions on Information Theory, 52(6):2608–2623,June 2006.
[Lub02] M. Luby. Lt codes. In The 43rd Annual IEEE Symposium on Founda-tions of Computer Science, 2002. Proceedings., pages 271–280, 2002.
[LYC03] S.-Y.R. Li, R.W. Yeung, and Ning Cai. Linear network coding. IEEETransactions on Information Theory, 49(2):371–381, Feb. 2003.
[MAH12] J. Matamoros and C. Anton-Haro. Data aggregation schemes forMachine-to-Machine gateways: Interplay with MAC protocols. In 2012Future Network Mobile Summit (FutureNetw), pages 1–8, July 2012.
[MCRV16] M. Maier, M. Chowdhury, B. P. Rimal, and D. P. Van. The tactile in-ternet: vision, recent progress, and open challenges. IEEE Communica-tions Magazine, 54(5):138–145, May 2016.
[Mil] David Mills. Network Time Protocol (version 3): Specification, imple-mentation and analysis. IETF RFC 1305. [Online]. Available: https://tools.ietf.org/html/rfc1305. [Last access: 15-May-2017].
[Mil91] D.L. Mills. Internet time synchronization: the network time protocol.IEEE Transactions on Communications, 39(10):1482–1493, Oct. 1991.
[MKSL10] George J. Mandellos, Michael N. Koukias, Ioannis St. Styliadis, andDimitrios K. Lymberopoulos. e-scp- protocol: An expansion on scp-ecgprotocol for health telemonitoring—pilot implementation. InternationalJournal of Telemedicine and Applications, 2010(3):1–17, Mar. 2010.
[ML15] A. Moreira and D.E. Lucani. Coded schemes for asymmetric wirelessinterfaces: Theory and practice. IEEE Journal on Selected Areas inCommunications, 33(2):171–184, Feb. 2015.
[MLC14] María José Morón, Rafael Luque, and Eduardo Casilari. On the capa-bility of smartphones to perform as communication gateways in medicalwireless personal area networks. Sensors, 14(1):575, Jan. 2014.
[MLJ] Steve McCanne, Craig Leres, and Van Jacobson. TCPdump & Libpcap.[Online]. Available: http://www.tcpdump.org. [Last access: 15-May-2017].
[Mos] Mosquitto. An Open Source MQTT v3.1 Broker. [Online]. Available:http://libcoap.sourceforge.net/. [Last access: 15-May-2017].
[MPZ+13] S. Marwat, T. Potsch, Y. Zaki, T. Weerawardane, and C. Gorg. Ad-dressing the Challenges of E-Healthcare in Future Mobile Networks.

BIBLIOGRAPHY 137
In Thomas Bauschert, editor, Advances in Communication Network-ing, volume 8115 of Lecture Notes in Computer Science, pages 90–99.Springer Berlin Heidelberg, 2013.
[MQTa] MQTT. MQTT v3.1 Protocol Specification. [Online]. Available:http://www.ibm.com/developerworks/webservices/library/ws-mqtt/index.html. [Last access: 15-May-2017].
[MQTb] MQTT. Open Source messaging for M2M. [Online]. Available: http://eclipse.org/paho/. [Last access: 15-May-2017].
[MS10] C. Mazurek and M. Stroinski. Innovative ict platform for emergingehealth services: Towards overcoming technical and social barriers andsolving grand challenges in medicine. In ETELEMED ’10 Second In-ternational Conference on eHealth, Telemedicine, and Social Medicine,pages 33–38, Feb. 2010.
[NCI08] NCI. National Intelligence Council, Disruptive Civil Technologies -Six Technologies with Potential Impacts on US Interests Out to 2025 -Conference Report CR 2008-07. [Online]. Available: http://fas.org/irp/nic/disruptive.pdf, Apr. 2008. [Last access: 15-May-2017].
[NH06] D. Niyato and E. Hossain. A cooperative game framework for band-width allocation in 4g heterogeneous wireless networks. In IEEE In-ternational Conference on Communications, 2006. ICC ’06., volume 9,pages 4357–4362, June 2006.
[NK11] Navid Nikaein and Srdjan Krea. Latency for real-time machine-to-machine communication in lte-based system architecture. In 11th Eu-ropean Wireless Conference 2011 - Sustainable Wireless Technologies(European Wireless), pages 1–6, Apr. 2011.
[NVACT13] Quoc-Thinh Nguyen-Vuong, N. Agoulmine, E.H. Cherkaoui, andL. Toni. Multicriteria optimization of access selection to improve thequality of experience in heterogeneous wireless access networks. IEEETransactions on Vehicular Technology, 62(4):1785–1800, May 2013.
[onea] oneM2M. A new phase in oneM2M standardization. [Online]. Avail-able: http://www.etsi.org/index.php/news-events/news/749-2014-01-a-new-phase-in-onem2m-standardization. [Last access: 15-May-2017].
[oneb] oneM2M. Goals for and Benefits of oneM2M Standardization. [On-line]. Available: http://www.onem2m.org/whyjoin.cfm. [Last access:15-May-2017].
[onec] oneM2M. oneM2M prepares for August 2014 release. [On-line]. Available: http://www.onem2m.org/press/2014-0411%20TP10_Release_final2.pdf. [Last access: 15-May-2017].
138 BIBLIOGRAPHY
[oned] oneM2M. oneM2M Standardization. [Online]. Available: http://www.onem2m.org.
[opea] openEHR. Clinical Knowledge Manager. [Online]. Available: http://www.openehr.org/ckm/. [Last access: 15-May-2017].
[Opeb] OpenEHR. openEHR. [Online]. Available: http://www.openehr.org/.[Last access: 15-May-2017].
[opec] openEHR. openEHR Specifications. [Online]. Available: http://www.openehr.org/programs/specification/releases/currentbaseline. [Last ac-cess: 15-May-2017].
[OPM05] O. Ormond, P. Perry, and J. Murphy. Network selection decision inwireless heterogeneous networks. In IEEE 16th International Sympo-sium on Personal, Indoor and Mobile Radio Communications, 2005.PIMRC 2005., volume 4, pages 2680–2684 Vol. 4, Sept. 2005.
[Ora] Oracle. Java Platform, Standard Edition 7 API Specification - cur-rentTimeMillis Method. [Online]. Available: http://docs.oracle.com/javase/7/docs/api/java/lang/System.html#currentTimeMillis(). [Last ac-cess: 15-May-2017].
[oT13] Internet of Things. Project Deliverable D1.1 - SOTA report on existingintegration frameworks/architectures for WSN, RFID and other emerg-ing IoT related Technologies, 2013.
[oTAIA13] Internet of Things Architecture (IOT-A). Project Deliverable D3.1 -Initial M2M API Analysis, 2013.
[PA14] C. Pereira and A. Aguiar. Towards efficient mobile m2m communica-tions: Survey and open challenges. Sensors, 14(10):19582–19608, Oct.2014.
[PA17a] C. Pereira and A. Aguiar. Energy-aware scheduling for mobile iot gate-ways on heterogeneous networks. IEEE Internet of Things Journal,pages 1–13, 2017. Submitted.
[PA17b] C. Pereira and A. Aguiar. Modelling and optimisation of packet trans-mission scheduling in m2m communications. In 2017 IEEE Interna-tional Conference on Communications Workshops (ICC Workshops),pages 576–582, May 2017.
[PAL13] C. Pereira, A. Aguiar, and D. E. Lucani. Dynamic load allocation formulti-homing via coded packets. In 2013 IEEE 77th Vehicular Technol-ogy Conference (VTC Spring), pages 1–5, June 2013.
[PAL16] C. Pereira, A. Aguiar, and Daniel E. Lucani. When are network codingbased dynamic multi-homing techniques beneficial? Computer Net-works, 108(C):55–65, Oct. 2016.
BIBLIOGRAPHY 139
[PBH12] S. Plass, M. Berioli, and R. Hermenier. Concept for an M2M commu-nications infrastructure via airliners. In 2012 Future Network MobileSummit (FutureNetw), pages 1–8, 2012.
[Pea95] Karl Pearson. Proceedings of the Royal Society of London, volume 58.Taylor & Francis, 1895.
[PFB+14] C. Pereira, S. Frade, P. Brandao, R. Correia, and A. Aguiar. Integrat-ing data and network standards into an interoperable e-health solution.In 2014 IEEE 16th International Conference on e-Health Networking,Applications and Services (Healthcom), pages 99–104, Oct. 2014.
[PFW11] G. P. Perrucci, F. H. P. Fitzek, and J. Widmer. Survey on energy con-sumption entities on the smartphone platform. In 2011 IEEE 73rd Ve-hicular Technology Conference (VTC Spring), pages 1–6, May 2011.
[Phy14] Physionet. Heart Rate Variability Analysis with the HRV Toolkit. [On-line]. Available: http://www.physionet.org/tutorials/hrv-toolkit/, 2014.[Last access: 15-May-2017].
[PHZ+11] Abhinav Pathak, Y. Charlie Hu, Ming Zhang, Paramvir Bahl, and Yi-Min Wang. Fine-grained power modeling for smartphones using sys-tem call tracing. In Proceedings of the Sixth Conference on ComputerSystems, EuroSys ’11, pages 153–168, New York, NY, USA, Apr. 2011.ACM.
[PHZ12] Abhinav Pathak, Y. Charlie Hu, and Ming Zhang. Where is the energyspent inside my app?: Fine grained energy accounting on smartphoneswith eprof. In Proceedings of the 7th ACM European Conference onComputer Systems, EuroSys ’12, pages 29–42, New York, NY, USA,Apr. 2012. ACM.
[PKBV11] Kandaraj Piamrat, Adlen Ksentini, Jean-Marie Bonnin, and César Viho.Radio resource management in emerging heterogeneous wireless net-works. Computer Communications, 34(9):1066 – 1076, June 2011. Spe-cial Issue: Next Generation Networks Service Management.
[PKN+13] F. Pauls, S. Krone, W. Nitzold, G. Fettweis, and C. Flores. Evaluationof efficient modes of operation of gsm/gprs modules for m2m commu-nications. In 2013 IEEE 78th Vehicular Technology Conference (VTCFall), pages 1–6, Sept. 2013.
[PMOS11] A. ParandehGheibi, M. Medard, A. Ozdaglar, and S. Shakkottai. Avoid-ing Interruptions: A QoE Reliability Function for Streaming MediaApplications. IEEE Journal on Selected Areas in Communications,29(5):1064–1074, May 2011.
[PNAK11] S. Prabhavat, H. Nishiyama, N. Ansari, and N. Kato. Effective delay-controlled load distribution over multipath networks. IEEE Transactionson Parallel and Distributed Systems, 22(10):1730–1741, Oct. 2011.

140 BIBLIOGRAPHY
[PNW03] C. Prehofer, Nima Nafisi, and Qing Wei. A framework for context-awarehandover decisions. In 14th IEEE Proceedings on Personal, Indoor andMobile Radio Communications (PIMRC), 2003., volume 3, pages 2794–2798 vol.3, Sept. 2003.
[Pos] Jon Postel. Internet Control Message Protocol, IETF RFC 792. [On-line]. Available: https://tools.ietf.org/html/rfc792. [Last access: 15-May-2017].
[PPFA17] C. Pereira, A. Pinto, D. Ferreira, and A. Aguiar. Experimental char-acterization of mobile iot application latency. IEEE Internet of ThingsJournal, 4(4):1082–1094, Aug 2017.
[PPR+16] C. Pereira, A. Pinto, P. Rocha, F. Santiago, J. Sousa, and A. Aguiar.Iot interoperability for actuating applications through standardised m2mcommunications. In 2016 IEEE 17th International Symposium on aWorld of Wireless, Mobile and Multimedia Networks (WoWMoM), pages1–6, June 2016.
[PPZ+08] Abhinav Pathak, Himabindu Pucha, Ying Zhang, Y.Charlie Hu, andZ.Morley Mao. A measurement study of internet delay asymmetry.In Mark Claypool and Steve Uhlig, editors, Passive and Active Net-work Measurement, volume 4979 of Lecture Notes in Computer Sci-ence, pages 182–191. Springer Berlin Heidelberg, 2008.
[PRP+16] C. Pereira, J. Rodrigues, A. Pinto, P. Rocha, F. Santiago, J. Sousa, andA. Aguiar. Smartphones as m2m gateways in smart cities iot applica-tions. In 2016 23rd International Conference on Telecommunications(ICT), pages 184–190, May 2016.
[PUt+14] Filippo Palumbo, Jonas Ullberg, Ales Štimec, Francesco Furfari, LarsKarlsson, and Silvia Coradeschi. Sensor network infrastructure for ahome care monitoring system. Sensors, 14(3):3833, Feb. 2014.
[QWG+10] Feng Qian, Zhaoguang Wang, Alexandre Gerber, Zhuoqing MorleyMao, Subhabrata Sen, and Oliver Spatscheck. Characterizing radio re-source allocation for 3g networks. In Proceedings of the 10th ACMSIGCOMM Conference on Internet Measurement, IMC ’10, pages 137–150, New York, NY, USA, 2010. ACM.
[RBA+14] Md. Mahbubur Rahman, Rummana Bari, Amin Ahsan Ali, MoushumiSharmin, Andrew Raij, Karen Hovsepian, Syed Monowar Hossain,Emre Ertin, Ashley Kennedy, David H. Epstein, Kenzie L. Preston,Michelle Jobes, J. Gayle Beck, Satish Kedia, Kenneth D. Ward, Mustafaal’Absi, and Santosh Kumar. Are we there yet?: Feasibility of continu-ous stress assessment via wireless physiological sensors. In Proceedingsof the 5th ACM Conference on Bioinformatics, Computational Biology,and Health Informatics, BCB ’14, pages 479–488, New York, NY, USA,2014. ACM.

BIBLIOGRAPHY 141
[RFC12] Allen L. Ramaboli, Olabisi E. Falowo, and Anthony H. Chan. Band-width aggregation in heterogeneous wireless networks: A survey of cur-rent approaches and issues. Journal of Network and Computer Applica-tions, 35(6):1674 – 1690, Nov. 2012.
[RIKHK+15] S.M. Riazul Islam, Daehan Kwak, M. Humaun Kabir, M. Hossain, andKyung-Sup Kwak. The internet of things for health care: A comprehen-sive survey. IEEE Access, 3:678–708, June 2015.
[RMM03a] C. A. Rusu, R. Melhem, and D. Mossé. Maximizing the system valuewhile satisfying time and energy constraints. IBM Journal of Researchand Development, 47(5.6):689–702, Sept. 2003.
[RMM03b] Cosmin Rusu, Rami Melhem, and Daniel Mossé. Maximizing rewardsfor real-time applications with energy constraints. ACM Transactionson Embedded Computing Systems, 2(4):537–559, Nov. 2003.
[RQZ07] Ahmad Rahmati, Angela Qian, and Lin Zhong. Understanding human-battery interaction on mobile phones. In Proceedings of the 9th In-ternational Conference on Human Computer Interaction with MobileDevices and Services, MobileHCI ’07, pages 265–272, New York, NY,USA, Sept. 2007. ACM.
[RS60] I. S. Reed and G. Solomon. Polynomial codes over certain finitefields. Journal of the Society for Industrial and Applied Mathematics,8(2):300–304, June 1960.
[RSH+13] S. Raza, H. Shafagh, K. Hewage, R. Hummen, and T. Voigt. Lithe:Lightweight secure coap for the internet of things. IEEE Sensors Jour-nal, 13(10):3711–3720, Oct. 2013.
[SAD+16] M. Simsek, A. Aijaz, M. Dohler, J. Sachs, and G. Fettweis. 5g-enabledtactile internet. IEEE Journal on Selected Areas in Communications,34(3):460–473, Mar. 2016.
[SBMAVJ13] M.S. Shahamabadi, B. Bin Mohd Ali, P. Varahram, and A.J. Jara. Anetwork mobility solution based on 6lowpan hospital wireless sensornetwork (nemo-hwsn). In 2013 Seventh International Conference on In-novative Mobile and Internet Services in Ubiquitous Computing (IMIS),pages 433–438, July 2013.
[SC01] Vishnu Swaminathan and Krishnendu Chakrabarty. Real-time taskscheduling for energy-aware embedded systems. Journal of the FranklinInstitute, 338(6):729 – 750, Sept. 2001.
[SC05] Vishnu Swaminathan and Krishnendu Chakrabarty. Pruning-based,energy-optimal, deterministic i/o device scheduling for hard real-time systems. ACM Transactions on Embedded Computing Systems,4(1):141–167, Feb. 2005.

142 BIBLIOGRAPHY
[SCGM14] Ankit Singla, Balakrishnan Chandrasekaran, P. Brighten Godfrey, andBruce Maggs. The internet at the speed of light. In Proceedings of the13th ACM Workshop on Hot Topics in Networks, HotNets-XIII, pages1:1–1:7, New York, NY, USA, 2014. ACM.
[SCT] A. Stanford-Clark and H. Truong. MQTT For Sensor Networks(MQTTs) Protocol Specification Version 1.2. [Online]. Available: http://mqtt.org/MQTT-S_spec_v1.2.pdf. [Last access: 15-May-2017].
[SEM13] A. Soceanu, A. Egner, and F. Moldoveanu. Towards interoperabilityof ehealth system networked components. In 2013 19th InternationalConference on Control Systems and Computer Science (CSCS), pages147–154, May 2013.
[SHB] Z. Shelby, K. Hartke, and C. Bormann. The Constrained ApplicationProtocol (CoAP), IETF RFC 7252. [Online]. Available: https://tools.ietf.org/html/rfc7252. [Last access: 15-May-2017].
[She05] Nirmala Shenoy. A framework for seamless roaming across het-erogeneous next generation wireless networks. Wireless Networks,11(6):757–774, Nov. 2005.
[Sho06] A. Shokrollahi. Raptor codes. IEEE Transactions on Information The-ory, 52(6):2551–2567, June 2006.
[SJ05] Qingyang Song and A. Jamalipour. A network selection mechanism fornext generation networks. In 2005 IEEE International Conference onCommunications, 2005. ICC 2005., volume 2, pages 1418–1422 Vol. 2,May 2005.
[SJL+13] M.Z. Shafiq, Lusheng Ji, A.X. Liu, J. Pang, and Jia Wang. Large-scalemeasurement and characterization of cellular machine-to-machine traf-fic. IEEE/ACM Transactions on Networking, 21(6):1960–1973, Dec.2013.
[SKM10] Lea Skorin-Kapov and Maja Matijasevic. Analysis of qos requirementsfor e-health services and mapping to evolved packet system qos classes.International Journal of Telemedicine and Applications, 2010:9:1–9:18,Jan. 2010.
[SLD+15] M. Shirvanimoghaddam, Y. Li, M. Dohler, B. Vucetic, and S. Feng.Probabilistic rateless multiple access for machine-to-machine com-munication. IEEE Transactions on Wireless Communications,14(12):6815–6826, Dec. 2015.
[Smi48] N. Smirnov. Table for estimating the goodness of fit of empirical dis-tributions. The Annals of Mathematical Statistics, 19(2):279–281, June1948.

BIBLIOGRAPHY 143
[SMK+17] P. Schulz, M. Matthe, H. Klessig, M. Simsek, G. Fettweis, J. Ansari,S. A. Ashraf, B. Almeroth, J. Voigt, I. Riedel, A. Puschmann,A. Mitschele-Thiel, M. Muller, T. Elste, and M. Windisch. Latency crit-ical iot applications in 5g: Perspective on the design of radio interfaceand network architecture. IEEE Communications Magazine, 55(2):70–78, Feb. 2017.
[Smo03] V. Smotlacha. One-way delay measurement using ntp. In TERENANetworking Conference, 2003.
[SSM08] J.K. Sundararajan, D. Shah, and M. Medard. Arq for network coding.In IEEE International Symposium on Information Theory, 2008. ISIT2008., pages 1651–1655, July 2008.
[SSM09a] Alex Shye, Benjamin Scholbrock, and Gokhan Memik. Into the wild:Studying real user activity patterns to guide power optimizations formobile architectures. In Proceedings of the 42Nd Annual IEEE/ACMInternational Symposium on Microarchitecture, MICRO 42, pages 168–178, New York, NY, USA, Dec. 2009. ACM.
[SSM+09b] J.K. Sundararajan, D. Shah, M. Medard, M. Mitzenmacher, and J. Bar-ros. Network coding meets tcp. In IEEE INFOCOM 2009, pages 280–288, Apr. 2009.
[TBCO12] M. Tesanovic, P. Bucknell, H. Chebbo, and J. Ogunbekun. Service-domain solutions to radio interference for M2M communications andnetworking. In 2012 IEEE Globecom Workshops (GC Wkshps), pages1712–1717, 2012.
[TDC+07] Michelle L Tolerico, Dan Ding, Rory a Cooper, Donald M Spaeth,Shirley G Fitzgerald, Rosemarie Cooper, Annmarie Kelleher, andMichael L Boninger. Assessing mobility characteristics and activitylevels of manual wheelchair users. Journal of rehabilitation researchand development, 44(4):561–571, Apr. 2007.
[TGS+02] Brian Totty, David Gourley, Marjorie Sayer, Anshu Aggarwal, and SailuReddy. Http: The Definitive Guide. O’Reilly & Associates, Inc., Se-bastopol, CA, USA, 2002.
[THM04] A.-E.M. Taha, H.S. Hassanein, and H.T. Mouftah. On robust alloca-tion policies in wireless heterogeneous networks. In Quality of Servicein Heterogeneous Wired/Wireless Networks, 2004. QSHINE 2004. FirstInternational Conference on, pages 198–205, Oct. 2004.
[Tho01] Stephen Thomas. HTTP essentials: protocols for secure, scaleable, Websites. Wiley, 2001.
[TSLX14] Sasu Tarkoma, Matti Siekkinen, Eemil Lagerspetz, and Yu Xiao. Smart-phone Energy Consumption: Modeling and Optimization. CambridgeUniversity Press, Aug. 2014.

144 BIBLIOGRAPHY
[UAH+12] Shagufta Umer, Muhammad Afzal, Maqbool Hussain, Khalid Latif,and Hafiz Farooq Ahmad. Autonomous mapping of hl7 rim and re-lational database schema. Information Systems Frontiers, 14(1):5–18,Mar. 2012.
[VBNCNH+12] M. Vazquez-Briseno, C. Navarro-Cota, J.I. Nieto-Hipolito, E. Jimenez-Garcia, and J.D. Sanchez-Lopez. A proposal for using the internet ofthings concept to increase children’s health awareness. In 2012 22ndInternational Conference on Electrical Communications and Comput-ers (CONIELECOMP), pages 168–172, Feb. 2012.
[C85] V. Cerný. Thermodynamical approach to the traveling salesman prob-lem: An efficient simulation algorithm. Journal of Optimization Theoryand Applications, 45(1):41–51, Jan. 1985.
[VDPAJ+14] B.C. Villaverde, R. De Paz Alberola, A.J. Jara, S. Fedor, S.K. Das, andD. Pesch. Service Discovery Protocols for Constrained Machine-to-Machine Communications. IEEE Communications Surveys Tutorials,16(1):41–60, First 2014.
[VGAZA13] F. Vazquez Gallego, J. Alonso-Zarate, and L. Alonso. Energy and delayanalysis of contention resolution mechanisms for machine-to-machinenetworks based on low-power WiFi. In 2013 IEEE International Con-ference on Communications (ICC), pages 2235–2240, June 2013.
[vGPWCO12] JEWC van Gemert-Pijnen, S Wynchank, HD Covvey, and HC Osse-baard. Improving the credibility of electronic health technologies. Bul-letin of the World Health Organization, 90:323 – 323A, May 2012.
[Vit71] A. Viterbi. Convolutional codes and their performance in communi-cation systems. IEEE Transactions on Communication Technology,19(5):751–772, Oct. 1971.
[VMK07] Demosthenes Vouyioukas, Ilias Maglogiannis, and Dimitris Komnakos.Emergency m-health services through high-speed 3g systems: Simu-lation and performance evaluation. Simulation, 83(4):329–345, Apr.2007.
[WFyLB05] Jörg Widmer, Christina Fragouli, and Jean yves Le Boudec. Low-complexity energy-efficient broadcasting in wireless ad-hoc networksusing network coding. In In Proceedings Workshop on Network Cod-ing, Theory, and Applications, 2005.
[WKR05] Mingquan Wu, Shirish S. Karande, and Hayder Radha. Network-embedded {FEC} for optimum throughput of multicast packet video.Signal Processing: Image Communication, 20(8):728 – 742, Sept. 2005.Special issue on Video Networking.

BIBLIOGRAPHY 145
[WLC+14] Y. Wang, K. Li, H. Chen, L. He, and K. Li. Energy-aware data alloca-tion and task scheduling on heterogeneous multiprocessor systems withtime constraints. IEEE Transactions on Emerging Topics in Computing,2(2):134–148, June 2014.
[WLM05] Ashton L. Wilson, Andrew Lenaghan, and Ron Malyan. Optimisingwireless access network selection to maintain QoS in heterogeneouswireless environments. In Leif Heinzl and Neeli Prasad, editors, WPMC2005, 8th International Symposium on Wireless Personal MultimediaCommunications, pages 1236–1240. NICT, Sept. 2005.
[WM95] Hong Shen Wang and N. Moayeri. Finite-state markov channel-a usefulmodel for radio communication channels. IEEE Transactions on Vehic-ular Technology, 44(1):163–171, Feb. 1995.
[WM97] D. H. Wolpert and W. G. Macready. No free lunch theorems for opti-mization. IEEE Transactions on Evolutionary Computation, 1(1):67–82, Apr. 1997.
[WM05] D. H. Wolpert and W. G. Macready. Coevolutionary free lunches. IEEETransactions on Evolutionary Computation, 9(6):721–735, Dec. 2005.
[Won00] Clinton Wong. Http Pocket Reference. O’Reilly & Associates, Inc.,Sebastopol, CA, USA, 2000.
[WTJ+11] G. Wu, S. Talwar, K. Johnsson, N. Himayat, and K.D. Johnson. M2M:From mobile to embedded internet. IEEE Communications Magazine,49(4):36–43, Apr. 2011.
[XHW+11] Qiang Xu, Junxian Huang, Zhaoguang Wang, Feng Qian, AlexandreGerber, and Zhuoqing Morley Mao. Cellular data network infrastruc-ture characterization and implication on mobile content placement. InProceedings of the ACM SIGMETRICS Joint International Conferenceon Measurement and Modeling of Computer Systems, SIGMETRICS’11, pages 317–328, New York, NY, USA, 2011. ACM.
[XLG+13] Changqiao Xu, Tianjiao Liu, Jianfeng Guan, Hongke Zhang, and G.-M.Muntean. Cmt-qa: Quality-aware adaptive concurrent multipath datatransfer in heterogeneous wireless networks. IEEE Transactions on Mo-bile Computing, 12(11):2193–2205, Nov. 2013.
[XV05] Bo Xing and N. Venkatasubramanian. Multi-constraint dynamic accessselection in always best connected networks. In The Second Annual Int.Conf. on Mobile and Ubiquitous Sys: Netw. and Serv. (MobiQuitous)2005., pages 56–64, July 2005.
[XXC+14] Boyi Xu, Li Da Xu, Hongming Cai, Cheng Xie, Jingyuan Hu, andFenglin Bu. Ubiquitous data accessing method in iot-based informationsystem for emergency medical services. IEEE Transactions on Indus-trial Informatics, 10(2):1578–1586, May 2014.

146 BIBLIOGRAPHY
[XZH+15] G. Xue, H. Zhu, Z. Hu, J. Yu, Y. Zhu, and G. Zhang. Smartcut: Mitigat-ing 3g radio tail effect on smartphones. IEEE Transactions on MobileComputing, 14(1):169–179, Jan. 2015.
[YBC05] Xu Yang, J. Bigham, and L. Cuthbert. Resource management for serviceproviders in heterogeneous wireless networks. In 2005 IEEE WirelessCommunications and Networking Conference, volume 3, pages 1305–1310 Vol. 3, Mar. 2005.
[YDWX12] Li Yongfu, Sun Dihua, Liu Weining, and Zhang Xuebo. A service-oriented architecture for the transportation cyber-physical systems. In2012 31st Chinese Control Conference (CCC), pages 7674–7678, July2012.
[YQST13] Ye Yan, Yi Qian, H. Sharif, and D. Tipper. A survey on smart grid com-munication infrastructures: Motivations, requirements and challenges.IEEE Communications Surveys Tutorials, 15(1):5–20, First 2013.
[YTL12] S. Yunoki, M. Takada, and C. Liu. Experimental results of remote en-ergy monitoring system via cellular network in China. In 2012 Proceed-ings of SICE Annual Conference (SICE), pages 948–954, 2012.
[YXM+14] Geng Yang, Li Xie, M. Mantysalo, Xiaolin Zhou, Zhibo Pang, Li DaXu, S. Kao-Walter, Qiang Chen, and Li-Rong Zheng. A health-iot plat-form based on the integration of intelligent packaging, unobtrusive bio-sensor, and intelligent medicine box. IEEE Transactions on IndustrialInformatics, 10(4):2180–2191, Nov. 2014.
[ZBHC15] Weizhe Zhang, Enci Bai, Hui He, and Albert Cheng. Solving energy-aware real-time tasks scheduling problem with shuffled frog leapingalgorithm on heterogeneous platforms. Sensors, 15(6):13778–13804,June 2015.
[Zepa] Zephyr. Zephyr HxM Bluetooth API Guide. [Online]. Avail-able: http://www.zephyranywhere.com/media/pdf/HXM1_API_P-Bluetooth-HXM-API-Guide_20100722_V01.pdf. [Last access:15-May-2017].
[Zepb] Zephyr. Zephyr HxM BT. [Online]. Available: http://zephyranywhere.com/products/hxm-bluetooth-heart-rate-monitor/. [Last access: 15-May-2017].
[ZHZC15] B. Zhao, W. Hu, Q. Zheng, and G. Cao. Energy-aware web browsing onsmartphones. IEEE Transactions on Parallel and Distributed Systems,26(3):761–774, Mar. 2015.
[ZNKB12] Kaijie Zhou, N. Nikaein, R. Knopp, and C. Bonnet. Contention BasedAccess for Machine-Type Communications over LTE. In 2012 IEEE75th Vehicular Technology Conference (VTC Spring), pages 1–5, 2012.

BIBLIOGRAPHY 147
[ZS10] Ahmed H. Zahran and C.J. Sreenan. Threshold-based media streamingoptimization for heterogeneous wireless networks. IEEE Transactionson Mobile Computing, 9(6):753–764, June 2010.
[ZYX+11] Y. Zhang, R. Yu, S. Xie, W. Yao, Y. Xiao, and M. Guizani. HomeM2M networks: Architectures, standards, and QoS improvement. IEEECommunications Magazine, 49(4):44–52, Apr. 2011.
[ZZCA13] B. Zhao, Q. Zheng, G. Cao, and S. Addepalli. Energy-aware web brows-ing in 3g based smartphones. In 2013 IEEE 33rd International Confer-ence on Distributed Computing Systems (ICDCS), pages 165–175, July2013.
