towards a smart mobility roadmap - project days introduction towards a smart mobility roadmap the...
TRANSCRIPT

2014 - 2020
Towards aSmart Mobility Roadmap

2
CreditsThis brochure presents an initial‘version 1’ framework as atMarch 2012 to define the Smart Mobility roadmap.
Text: AutomotiveNL, Connekt, DITCMLay-out: KlasseOntwerp, UtrechtPrint: Drukkerij Gewoon Badoux, Houten
3
T O W A R D S A S M A R T M O B I L I T Y R O A D M A P
Contents
Introduction 5
1 Realising Smart Mobility solutions 7
2 Services for Smart Mobility 8• Guide to the services 9• Service sheets 10
3 Linking services to technologies 27• Guide to the tables 27• Tables 28
4 Enabling technologies 31• Property definitions 31• Tables 32
5 Milestones so far 34
Source 35

4
5
Introduction
T O W A R D S A S M A R T M O B I L I T Y R O A D M A P
The mobility challenge and itssolutionsMobility is essential, both for society and theeconomy. Projections show continuing growth inthe number of person-kilometres travelled by roadand in the number of freight kilometres. But ifnot addressed properly, increasing mobility alsohas downsides for society, economy and theenvironment. These include delays and uncertaintycaused by increased congestion, health risks throughemissions and noise, and lower safety levels for allroad users.
Smart Mobility challenges these issues. The keyenabler is ICT. Its application will lead to better useof the available infrastructure based on a paradigmshift towards a central point of user control.By introducing new incentives, users will in thefuture base their mobility choices on real-timeinformation on the performance level of the mobilitysystem, before and even during their journeys. Theywill increasingly be able to choose between physicaland virtual infrastructures, as these become moreinterrelated.
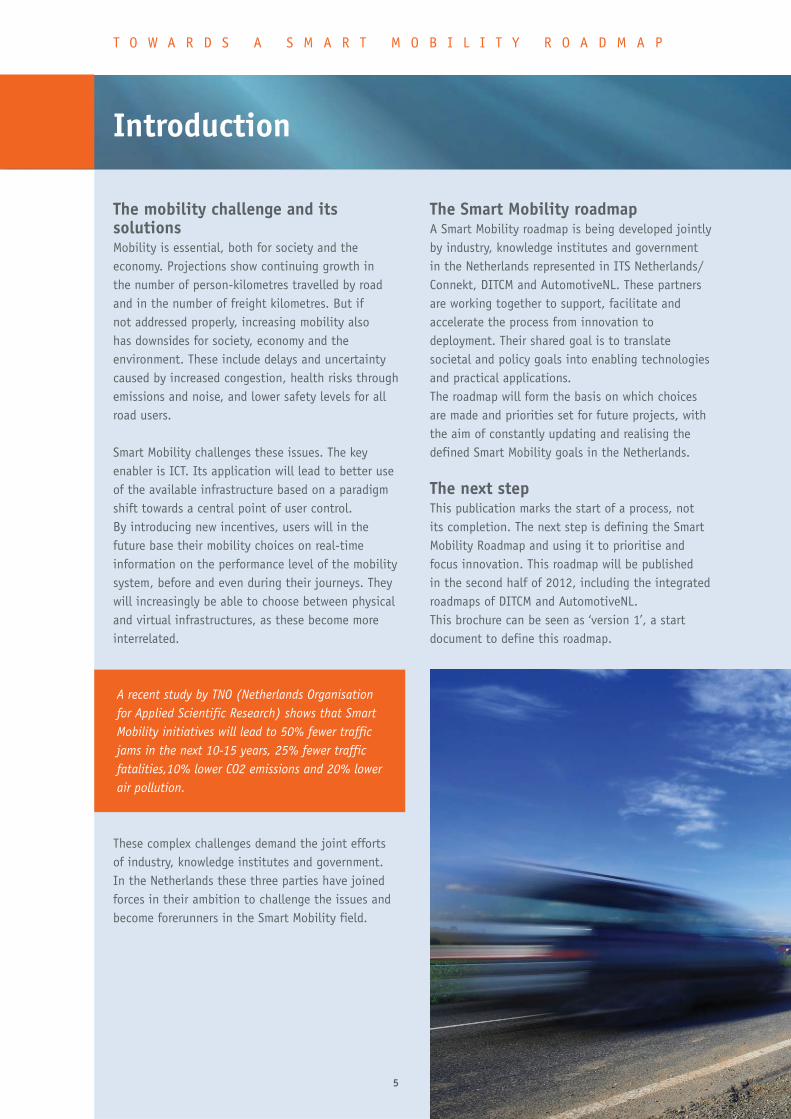
A recent study by TNO (Netherlands Organisationfor Applied Scientific Research) shows that SmartMobility initiatives will lead to 50% fewer trafficjams in the next 10-15 years, 25% fewer trafficfatalities,10% lower CO2 emissions and 20% lowerair pollution.
These complex challenges demand the joint effortsof industry, knowledge institutes and government.In the Netherlands these three parties have joinedforces in their ambition to challenge the issues andbecome forerunners in the Smart Mobility field.
The Smart Mobility roadmapA Smart Mobility roadmap is being developed jointlyby industry, knowledge institutes and governmentin the Netherlands represented in ITS Netherlands/Connekt, DITCM and AutomotiveNL. These partnersare working together to support, facilitate andaccelerate the process from innovation todeployment. Their shared goal is to translatesocietal and policy goals into enabling technologiesand practical applications.The roadmap will form the basis on which choicesare made and priorities set for future projects, withthe aim of constantly updating and realising thedefined Smart Mobility goals in the Netherlands.
The next stepThis publication marks the start of a process, notits completion. The next step is defining the SmartMobility Roadmap and using it to prioritise andfocus innovation. This roadmap will be publishedin the second half of 2012, including the integratedroadmaps of DITCM and AutomotiveNL. This brochure can be seen as ‘version 1’, a startdocument to define this roadmap.
6
T O W A R D S A S M A R T M O B I L I T Y R O A D M A P
The network organisation partners
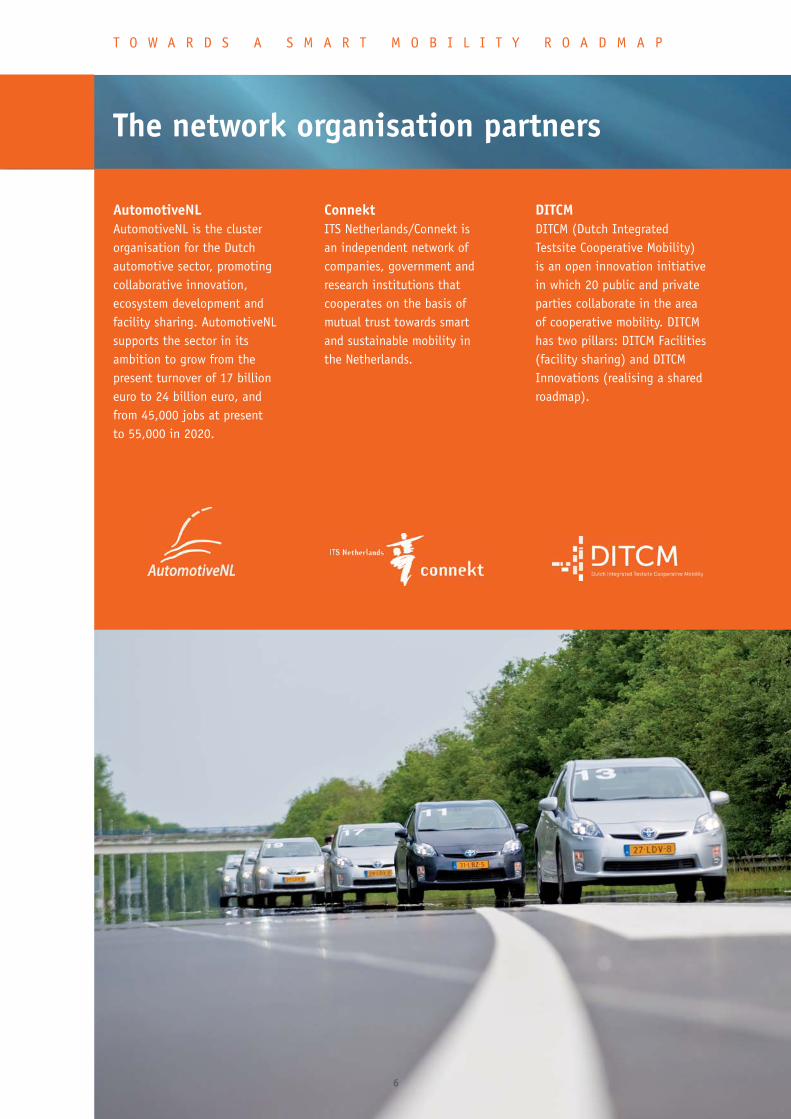
AutomotiveNLAutomotiveNL is the clusterorganisation for the Dutchautomotive sector, promotingcollaborative innovation, ecosystem development andfacility sharing. AutomotiveNLsupports the sector in itsambition to grow from thepresent turnover of 17 billioneuro to 24 billion euro, andfrom 45,000 jobs at presentto 55,000 in 2020.
ConnektITS Netherlands/Connekt isan independent network ofcompanies, government andresearch institutions that cooperates on the basis ofmutual trust towards smartand sustainable mobility inthe Netherlands.
DITCMDITCM (Dutch IntegratedTestsite Cooperative Mobility)is an open innovation initiativein which 20 public and privateparties collaborate in the areaof cooperative mobility. DITCMhas two pillars: DITCM Facilities(facility sharing) and DITCMInnovations (realising a sharedroadmap).
7
T O W A R D S A S M A R T M O B I L I T Y R O A D M A P
Realising Smart Mobility Solutions
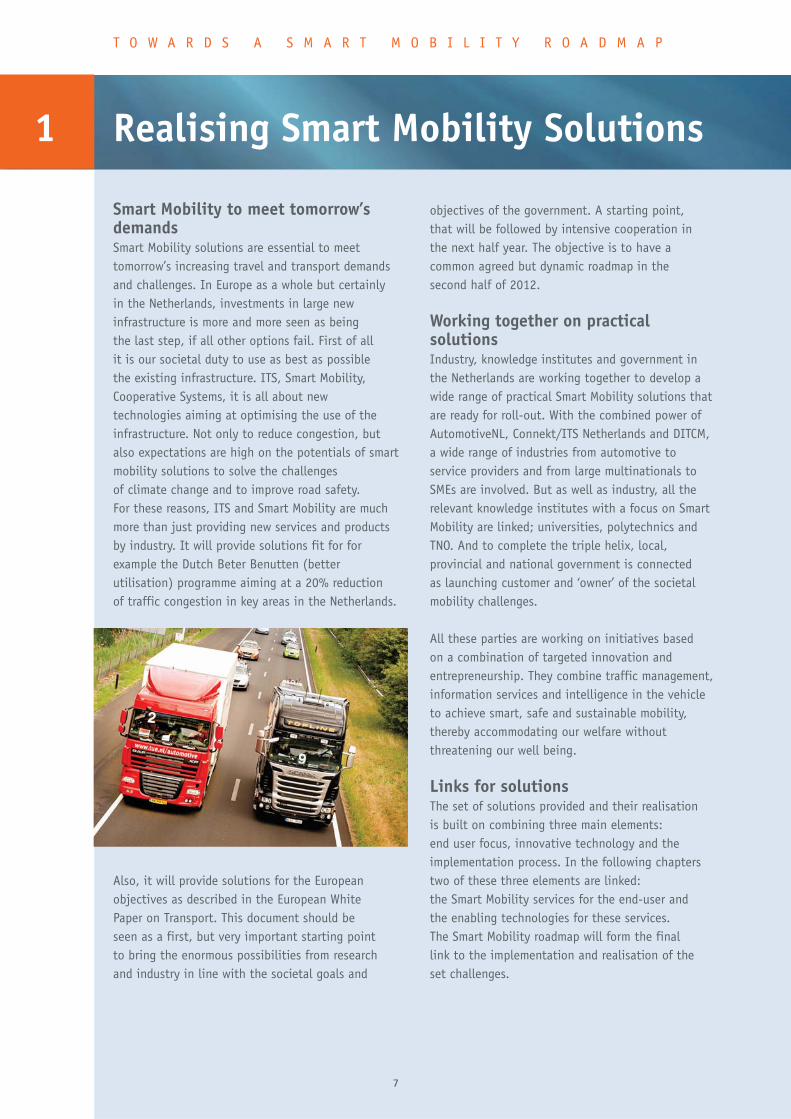
Smart Mobility to meet tomorrow’sdemandsSmart Mobility solutions are essential to meettomorrow’s increasing travel and transport demandsand challenges. In Europe as a whole but certainlyin the Netherlands, investments in large newinfrastructure is more and more seen as beingthe last step, if all other options fail. First of allit is our societal duty to use as best as possiblethe existing infrastructure. ITS, Smart Mobility, Cooperative Systems, it is all about new technologies aiming at optimising the use of theinfrastructure. Not only to reduce congestion, butalso expectations are high on the potentials of smartmobility solutions to solve the challengesof climate change and to improve road safety.For these reasons, ITS and Smart Mobility are muchmore than just providing new services and productsby industry. It will provide solutions fit for forexample the Dutch Beter Benutten (betterutilisation) programme aiming at a 20% reductionof traffic congestion in key areas in the Netherlands.
Also, it will provide solutions for the Europeanobjectives as described in the European WhitePaper on Transport. This document should beseen as a first, but very important starting pointto bring the enormous possibilities from researchand industry in line with the societal goals and
objectives of the government. A starting point,that will be followed by intensive cooperation inthe next half year. The objective is to have acommon agreed but dynamic roadmap in thesecond half of 2012.
Working together on practicalsolutionsIndustry, knowledge institutes and government inthe Netherlands are working together to develop awide range of practical Smart Mobility solutions thatare ready for roll-out. With the combined power ofAutomotiveNL, Connekt/ITS Netherlands and DITCM,a wide range of industries from automotive toservice providers and from large multinationals toSMEs are involved. But as well as industry, all therelevant knowledge institutes with a focus on SmartMobility are linked; universities, polytechnics andTNO. And to complete the triple helix, local,provincial and national government is connectedas launching customer and ‘owner’ of the societalmobility challenges.
All these parties are working on initiatives basedon a combination of targeted innovation andentrepreneurship. They combine traffic management,information services and intelligence in the vehicleto achieve smart, safe and sustainable mobility,thereby accommodating our welfare withoutthreatening our well being.
Links for solutionsThe set of solutions provided and their realisationis built on combining three main elements:end user focus, innovative technology and theimplementation process. In the following chapterstwo of these three elements are linked: the Smart Mobility services for the end-user andthe enabling technologies for these services.The Smart Mobility roadmap will form the finallink to the implementation and realisation of theset challenges.
1
Effective implementation of Smart Mobility dependson the development and roll-out of a wide range ofservices across all travel and transport modalities.The services that are currently under developmentare listed below, and are described in more detailon the following pages.
Forecast and real-time event information servicesHow can event information services effectively bedeployed for road users?
Traffic conditions informationHow can road users efficiently be provided withinformation on traffic conditions through amultimedia network?
Speed limit informationHow can static or dynamic speed limit information bedisplayed?
Travel time informationHow can road users efficiently be provided with traveltime information through a multimedia network?
Co-modal traveller information servicesHow can road users be provided with comprehensiveinformation on co-modal travel?
Dynamic speed limitsHow can variable speed limit solutions beimplemented?
Incident warning managementHow can road users efficiently be warned aboutabnormal situations on the network?
Strategic traffic management (TMP)How can traffic management strategies be deployedon TEN-T roads and corridors?
Incident managementHow best to respond to road incidents and restore thenormal situation?
Intelligent truck parkingHow can truck drivers and haulage operators beprovided with relevant information to optimise theuse of truck parking facilities?
Road user chargingHow can road users and authorities be provided witha comprehensive system for road charging?
Travel time prediction in transport (RITS)How can transport planners and truckers be providedwith accurate travel time predictions?
Dynamic traffic management waterwaysHow can marine logistics planners and shippersbe provided with dynamic capacity information forwaterways?
Synchro-model freight costingHow can freight planners be provided with comprehensive information on multi-modal freightlogistics optimisation?
ADAS: Safe distance warningHow can car drivers be provided with ‘safe distance’information based on speed and car to car distance?
ADAS: Vulnerable road usersHow can car drivers be provided with timelyinformation to prevent accidents with vulnerableroad users?
8
T O W A R D S A S M A R T M O B I L I T Y R O A D M A P
Services for Smart Mobility2
9
T O W A R D S A S M A R T M O B I L I T Y R O A D M A P
Guide to the services
The following pages describe the above servicesin more detail. For each service the followingcomponents are described:
Criteria (Level 0 - Level 4)Levels of deployment of ITS services, ranging frombasic to more advanced. The criteria can also serveas a tool for step-by-step deployment of the service.
ProjectsProjects that have been or are being carried outto explore, pilot, demonstrate or even commerciallyexploit the service - possibly in combination withother services - as described.
EvaluationThe services are evaluated from three perspectiveswhich are described below. The goal of theevaluation is to provide policy-makers with areference and a guide when considering investmentsin ITS services.
Deployment Readiness Level (DRL)This covers the level (1-5) of the service in relationto reliability, stability, interoperability, useracceptance and economic feasibility. A low scoreindicates an exploratory stage of the applicationof a particular service; a high score means a proven,operational and widely practiced service.
LeverageDriven by market developments, technologies canbe applied to single services or can potentially covera broad range of (integrated) services. A low leverage typically means a ‘single technology - single service’ (1 to 1) application; a high leveragerefers to a ‘single technology – multiple services’ situation (1 to n).
Performance/costs ratioThis ratio describes the costs involved in deliveringa specific result in the deployment level of theservice. A high performance/costs ratio (highperformance, low cost) is not by definition ‘cheap’.If the particular level of deployment turns out tohave a ‘low leverage’, it will be difficult to add newITS services to the specific technology platform,and expanding ITS may therefore have adisproportionate cost effect.
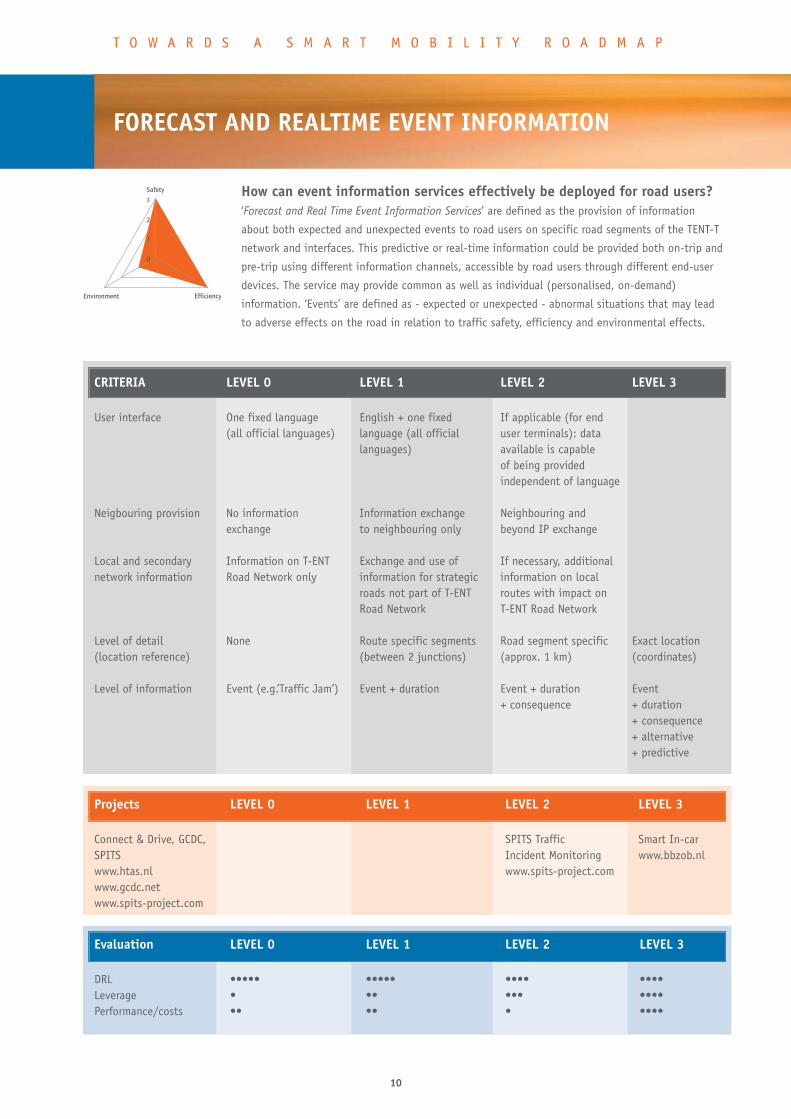
How can event information services effectively be deployed for road users?‘Forecast and Real Time Event Information Services’ are defined as the provision of information
about both expected and unexpected events to road users on specific road segments of the TENT-T
network and interfaces. This predictive or real-time information could be provided both on-trip and
pre-trip using different information channels, accessible by road users through different end-user
devices. The service may provide common as well as individual (personalised, on-demand)
information. ‘Events’ are defined as - expected or unexpected - abnormal situations that may lead
to adverse effects on the road in relation to traffic safety, efficiency and environmental effects.
CRITERIA LEVEL 0 LEVEL 1 LEVEL 2 LEVEL 3
User interface One fixed language English + one fixed If applicable (for end (all official languages) language (all official user terminals): data
languages) available is capableof being providedindependent of language
Neigbouring provision No information Information exchange Neighbouring andexchange to neighbouring only beyond IP exchange
Local and secondary Information on T-ENT Exchange and use of If necessary, additional network information Road Network only information for strategic information on local
roads not part of T-ENT routes with impact on Road Network T-ENT Road Network
Level of detail None Route specific segments Road segment specific Exact location(location reference) (between 2 junctions) (approx. 1 km) (coordinates)
Level of information Event (e.g.’Traffic Jam’) Event + duration Event + duration Event + consequence + duration
+ consequence+ alternative + predictive
Evaluation LEVEL 0 LEVEL 1 LEVEL 2 LEVEL 3
DRL ••••• ••••• •••• ••••Leverage • •• ••• ••••Performance/costs •• •• • ••••
0
1
2
3
Safety
Environment Efficiency
10
FORECAST AND REALTIME EVENT INFORMATION
T O W A R D S A S M A R T M O B I L I T Y R O A D M A P
Projects LEVEL 0 LEVEL 1 LEVEL 2 LEVEL 3
Connect & Drive, GCDC, SPITS Traffic Smart In-carSPITS Incident Monitoring www.bbzob.nlwww.htas.nl www.spits-project.comwww.gcdc.netwww.spits-project.com
11
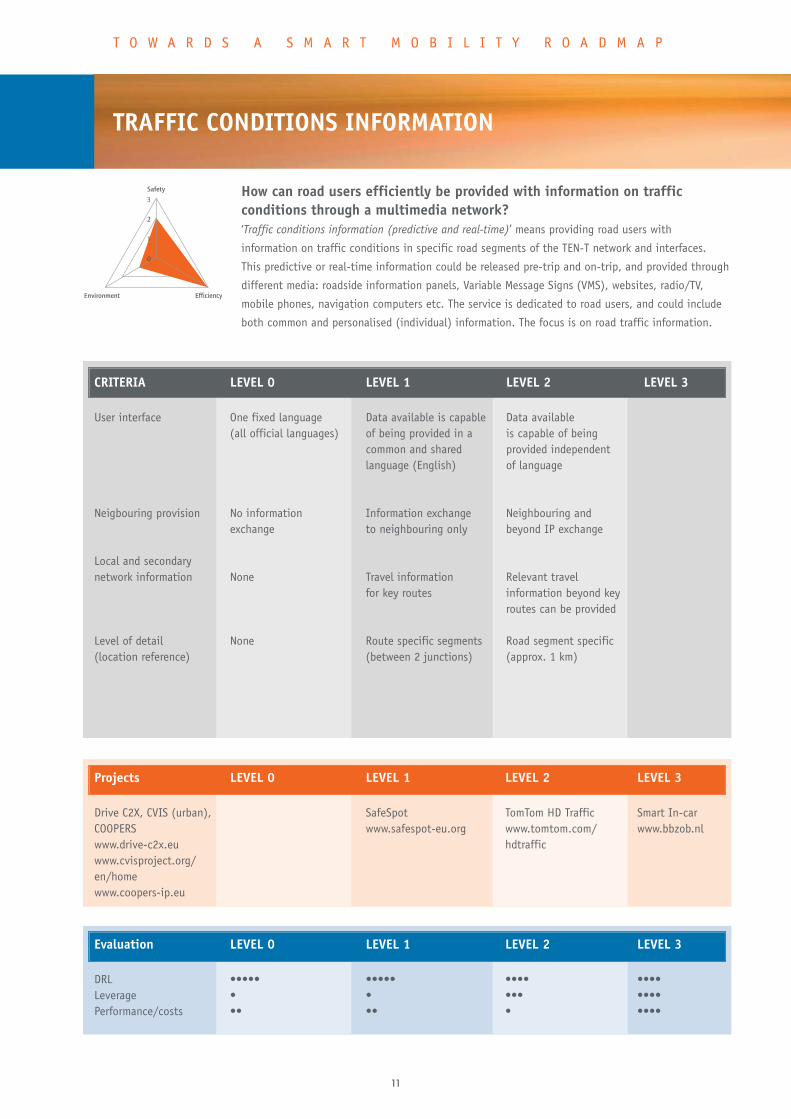
TRAFFIC CONDITIONS INFORMATION
How can road users efficiently be provided with information on trafficconditions through a multimedia network?‘Traffic conditions information (predictive and real-time)’ means providing road users with
information on traffic conditions in specific road segments of the TEN-T network and interfaces.
This predictive or real-time information could be released pre-trip and on-trip, and provided through
different media: roadside information panels, Variable Message Signs (VMS), websites, radio/TV,
mobile phones, navigation computers etc. The service is dedicated to road users, and could include
both common and personalised (individual) information. The focus is on road traffic information.
Evaluation LEVEL 0 LEVEL 1 LEVEL 2 LEVEL 3
DRL ••••• ••••• •••• ••••Leverage • • ••• ••••Performance/costs •• •• • ••••
0
1
2
3
Safety
Environment Efficiency
T O W A R D S A S M A R T M O B I L I T Y R O A D M A P
CRITERIA LEVEL 0 LEVEL 1 LEVEL 2 LEVEL 3
User interface One fixed language Data available is capable Data available(all official languages) of being provided in a is capable of being
common and shared provided independentlanguage (English) of language
Neigbouring provision No information Information exchange Neighbouring and exchange to neighbouring only beyond IP exchange
Local and secondarynetwork information None Travel information Relevant travel
for key routes information beyond keyroutes can be provided
Level of detail None Route specific segments Road segment specific(location reference) (between 2 junctions) (approx. 1 km)
Projects LEVEL 0 LEVEL 1 LEVEL 2 LEVEL 3
Drive C2X, CVIS (urban), SafeSpot TomTom HD Traffic Smart In-carCOOPERS www.safespot-eu.org www.tomtom.com/ www.bbzob.nlwww.drive-c2x.eu hdtrafficwww.cvisproject.org/en/homewww.coopers-ip.eu
12
SPEED LIMIT INFORMATION
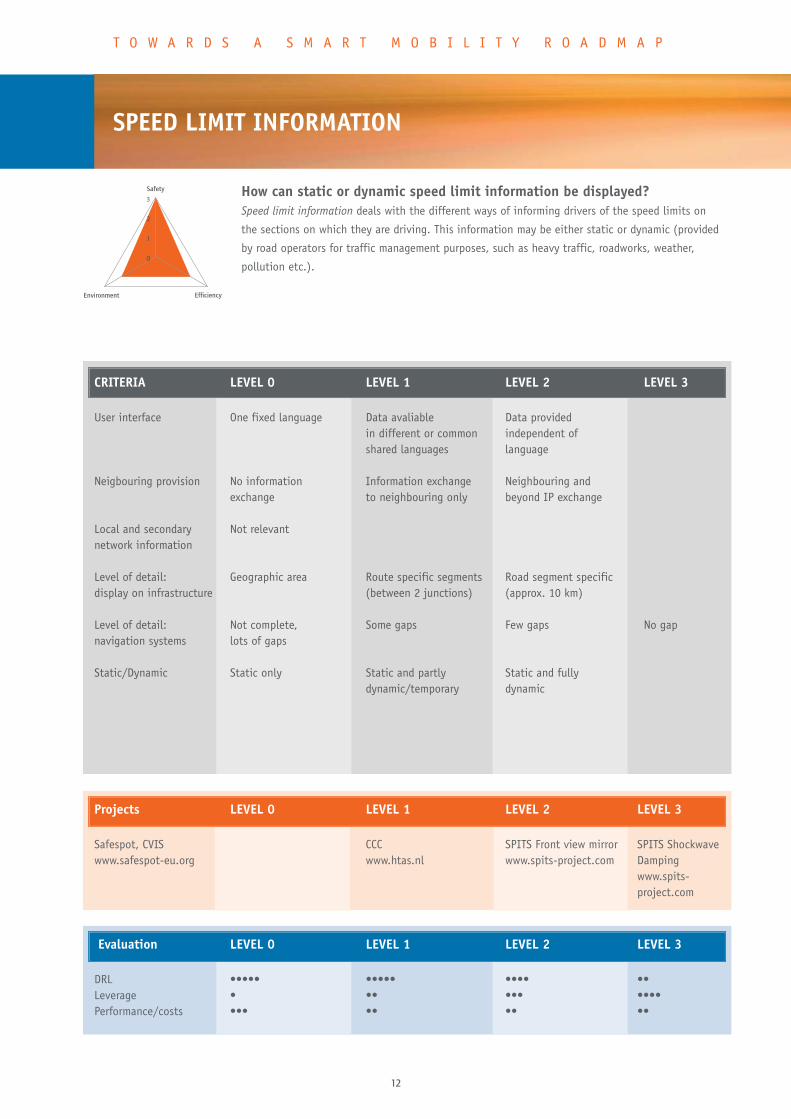
How can static or dynamic speed limit information be displayed?Speed limit information deals with the different ways of informing drivers of the speed limits on
the sections on which they are driving. This information may be either static or dynamic (provided
by road operators for traffic management purposes, such as heavy traffic, roadworks, weather,
pollution etc.).
CRITERIA LEVEL 0 LEVEL 1 LEVEL 2 LEVEL 3
User interface One fixed language Data avaliable Data provided in different or common independent ofshared languages language
Neigbouring provision No information Information exchange Neighbouring and exchange to neighbouring only beyond IP exchange
Local and secondary Not relevantnetwork information
Level of detail: Geographic area Route specific segments Road segment specific display on infrastructure (between 2 junctions) (approx. 10 km)
Level of detail: Not complete, Some gaps Few gaps No gapnavigation systems lots of gaps
Static/Dynamic Static only Static and partly Static and fullydynamic/temporary dynamic
Evaluation LEVEL 0 LEVEL 1 LEVEL 2 LEVEL 3
DRL ••••• ••••• •••• ••Leverage • •• ••• ••••Performance/costs ••• •• •• ••
0
1
2
3
Safety
Environment Efficiency
T O W A R D S A S M A R T M O B I L I T Y R O A D M A P
Projects LEVEL 0 LEVEL 1 LEVEL 2 LEVEL 3
Safespot, CVIS CCC SPITS Front view mirror SPITS Shockwave www.safespot-eu.org www.htas.nl www.spits-project.com Damping
www.spits-project.com
13
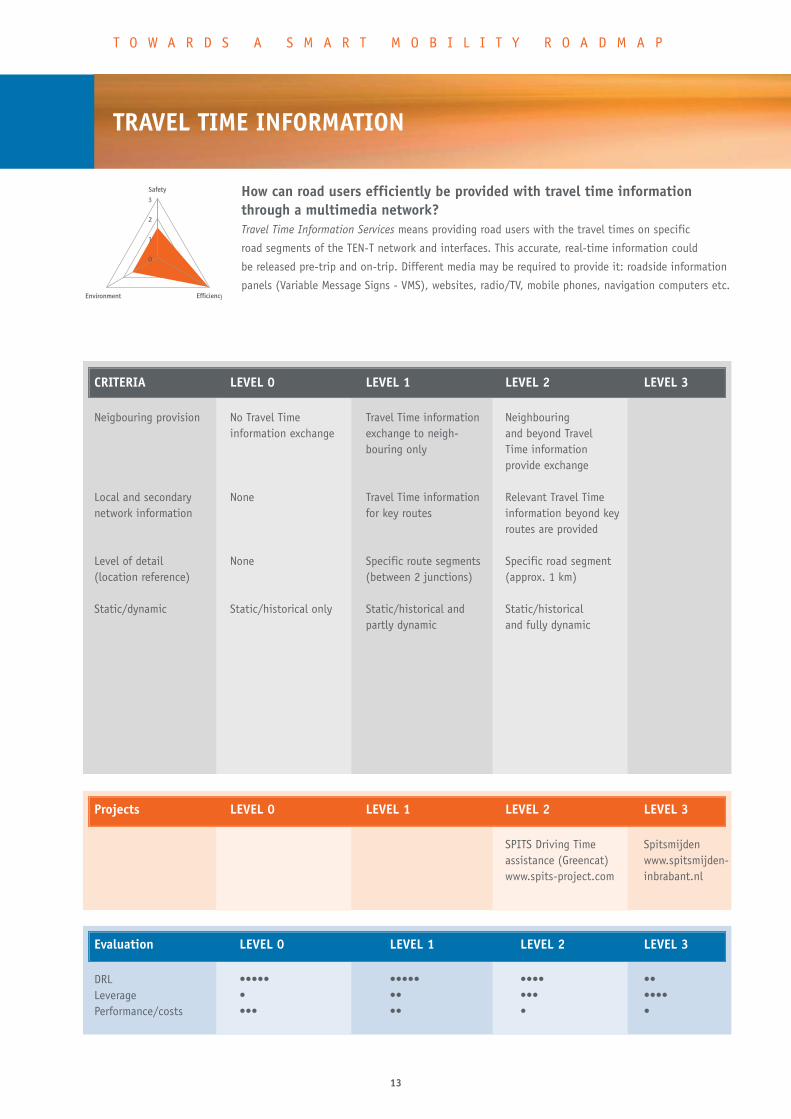
TRAVEL TIME INFORMATION
How can road users efficiently be provided with travel time informationthrough a multimedia network?Travel Time Information Services means providing road users with the travel times on specific
road segments of the TEN-T network and interfaces. This accurate, real-time information could
be released pre-trip and on-trip. Different media may be required to provide it: roadside information
panels (Variable Message Signs - VMS), websites, radio/TV, mobile phones, navigation computers etc.
CRITERIA LEVEL 0 LEVEL 1 LEVEL 2 LEVEL 3
Neigbouring provision No Travel Time Travel Time information Neighbouring information exchange exchange to neigh- and beyond Travel
bouring only Time informationprovide exchange
Local and secondary None Travel Time information Relevant Travel Time network information for key routes information beyond key
routes are provided
Level of detail None Specific route segments Specific road segment (location reference) (between 2 junctions) (approx. 1 km)
Static/dynamic Static/historical only Static/historical and Static/historical partly dynamic and fully dynamic
Evaluation LEVEL 0 LEVEL 1 LEVEL 2 LEVEL 3
DRL ••••• ••••• •••• ••Leverage • •• ••• ••••Performance/costs ••• •• • •
0
1
2
3
Safety
Environment Efficiency
T O W A R D S A S M A R T M O B I L I T Y R O A D M A P
Projects LEVEL 0 LEVEL 1 LEVEL 2 LEVEL 3
SPITS Driving Time Spitsmijdenassistance (Greencat) www.spitsmijden-www.spits-project.com inbrabant.nl
14
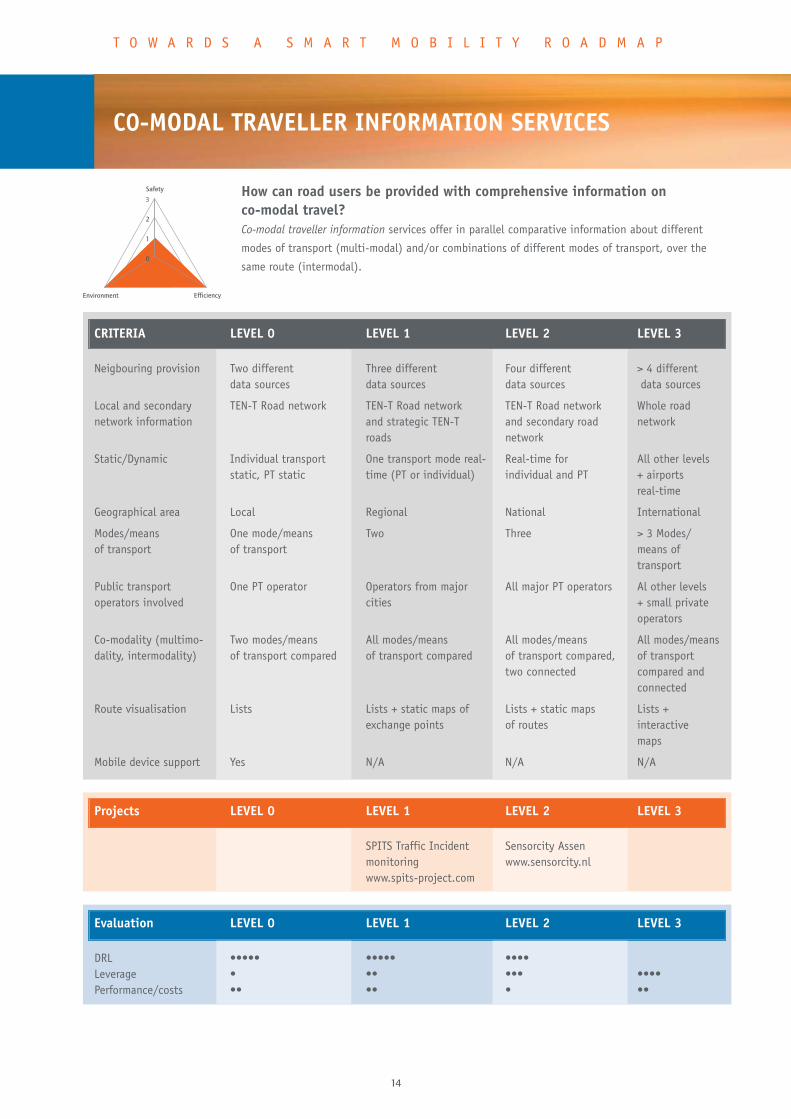
C0-MODAL TRAVELLER INFORMATION SERVICES
How can road users be provided with comprehensive information onco-modal travel?Co-modal traveller information services offer in parallel comparative information about different
modes of transport (multi-modal) and/or combinations of different modes of transport, over the
same route (intermodal).
CRITERIA LEVEL 0 LEVEL 1 LEVEL 2 LEVEL 3
Neigbouring provision Two different Three different Four different > 4 different data sources data sources data sources data sources
Local and secondary TEN-T Road network TEN-T Road network TEN-T Road network Whole road network information and strategic TEN-T and secondary road network
roads network
Static/Dynamic Individual transport One transport mode real- Real-time for All other levelsstatic, PT static time (PT or individual) individual and PT + airports
real-time
Geographical area Local Regional National International
Modes/means One mode/means Two Three > 3 Modes/of transport of transport means of
transport
Public transport One PT operator Operators from major All major PT operators Al other levels operators involved cities + small private
operators
Co-modality (multimo- Two modes/means All modes/means All modes/means All modes/meansdality, intermodality) of transport compared of transport compared of transport compared, of transport
two connected compared andconnected
Route visualisation Lists Lists + static maps of Lists + static maps Lists +exchange points of routes interactive
maps
Mobile device support Yes N/A N/A N/A
Evaluation LEVEL 0 LEVEL 1 LEVEL 2 LEVEL 3
DRL ••••• ••••• ••••Leverage • •• ••• ••••Performance/costs •• •• • ••
0
1
2
3
Safety
Environment Efficiency
T O W A R D S A S M A R T M O B I L I T Y R O A D M A P
Projects LEVEL 0 LEVEL 1 LEVEL 2 LEVEL 3
SPITS Traffic Incident Sensorcity Assen monitoring www.sensorcity.nlwww.spits-project.com
15
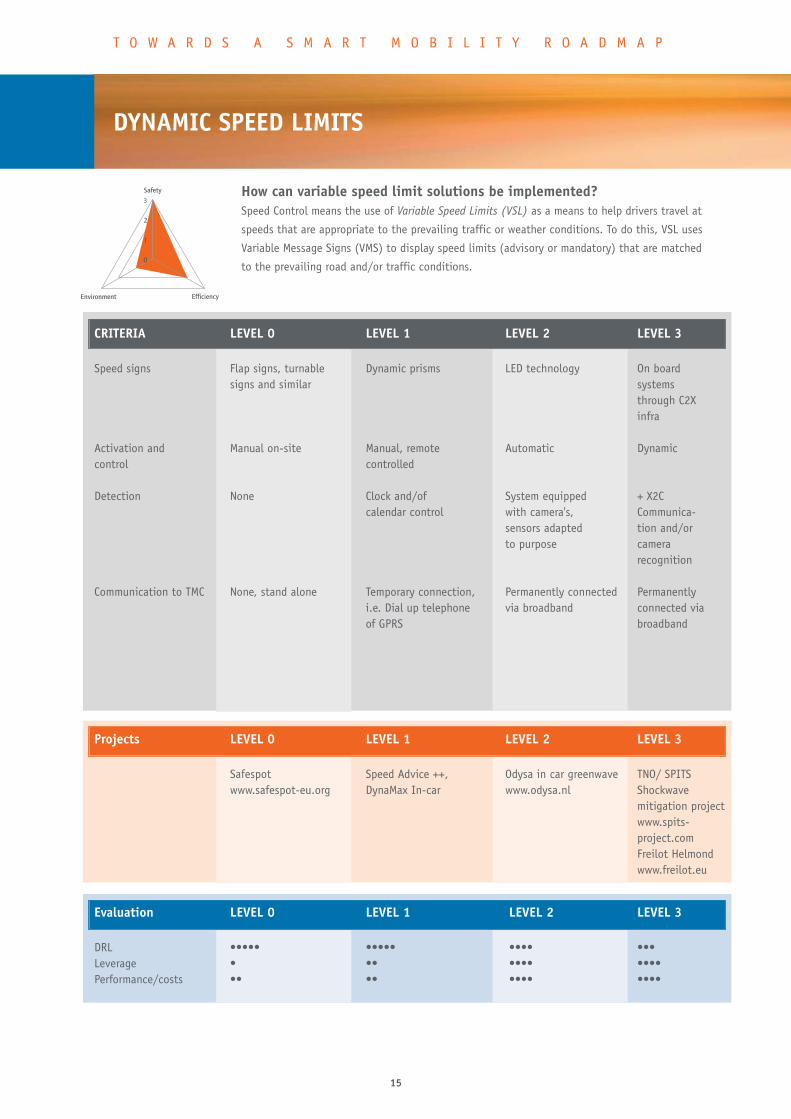
DYNAMIC SPEED LIMITS
How can variable speed limit solutions be implemented?Speed Control means the use of Variable Speed Limits (VSL) as a means to help drivers travel at
speeds that are appropriate to the prevailing traffic or weather conditions. To do this, VSL uses
Variable Message Signs (VMS) to display speed limits (advisory or mandatory) that are matched
to the prevailing road and/or traffic conditions.
CRITERIA LEVEL 0 LEVEL 1 LEVEL 2 LEVEL 3
Speed signs Flap signs, turnable Dynamic prisms LED technology On board signs and similar systems
through C2X infra
Activation and Manual on-site Manual, remote Automatic Dynamiccontrol controlled
Detection None Clock and/of System equipped + X2C calendar control with camera's, Communica-
sensors adapted tion and/or to purpose camera
recognition
Communication to TMC None, stand alone Temporary connection, Permanently connected Permanentlyi.e. Dial up telephone via broadband connected viaof GPRS broadband
Evaluation LEVEL 0 LEVEL 1 LEVEL 2 LEVEL 3
DRL ••••• ••••• •••• •••Leverage • •• •••• ••••Performance/costs •• •• •••• ••••
0
1
2
3
Safety
Environment Efficiency
T O W A R D S A S M A R T M O B I L I T Y R O A D M A P
Projects LEVEL 0 LEVEL 1 LEVEL 2 LEVEL 3
Safespot Speed Advice ++, Odysa in car greenwave TNO/ SPITS www.safespot-eu.org DynaMax In-car www.odysa.nl Shockwave
mitigation projectwww.spits-project.comFreilot Helmondwww.freilot.eu
16
INCIDENT WARNING MANAGEMENT
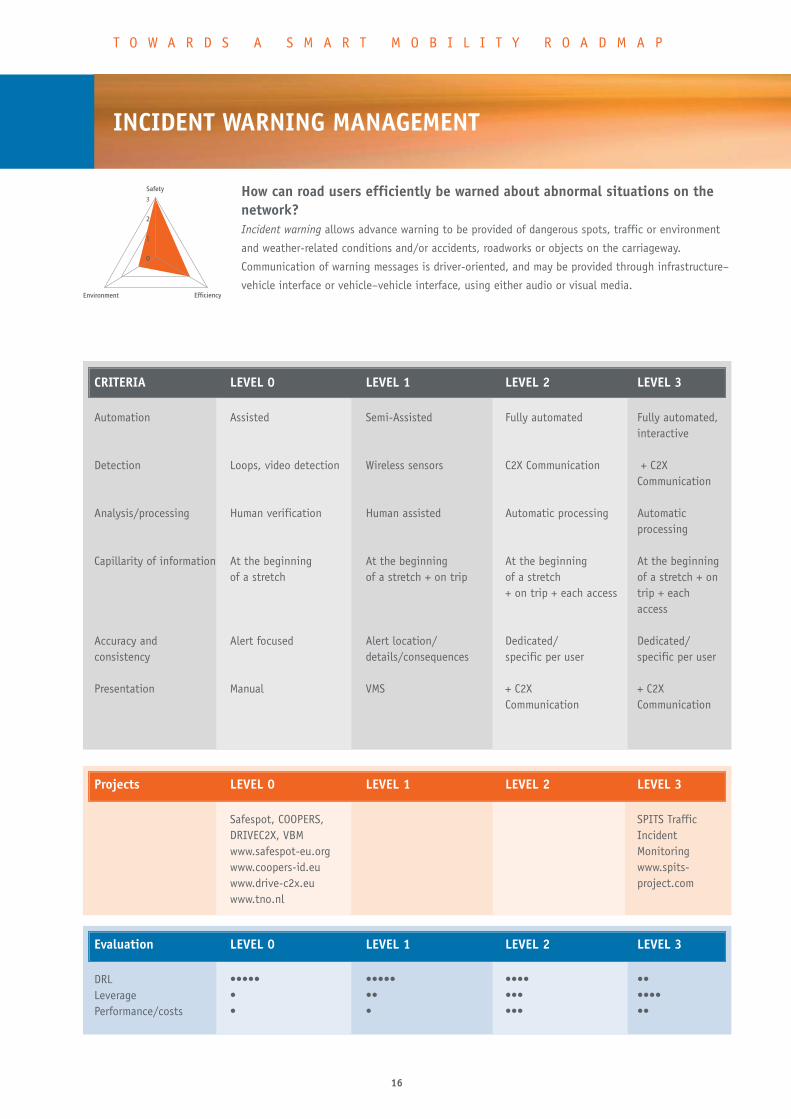
How can road users efficiently be warned about abnormal situations on thenetwork?Incident warning allows advance warning to be provided of dangerous spots, traffic or environment
and weather-related conditions and/or accidents, roadworks or objects on the carriageway.
Communication of warning messages is driver-oriented, and may be provided through infrastructure–
vehicle interface or vehicle–vehicle interface, using either audio or visual media.
CRITERIA LEVEL 0 LEVEL 1 LEVEL 2 LEVEL 3
Automation Assisted Semi-Assisted Fully automated Fully automated,interactive
Detection Loops, video detection Wireless sensors C2X Communication + C2XCommunication
Analysis/processing Human verification Human assisted Automatic processing Automaticprocessing
Capillarity of information At the beginning At the beginning At the beginning At the beginningof a stretch of a stretch + on trip of a stretch of a stretch + on
+ on trip + each access trip + eachaccess
Accuracy and Alert focused Alert location/ Dedicated/ Dedicated/consistency details/consequences specific per user specific per user
Presentation Manual VMS + C2X + C2XCommunication Communication
Evaluation LEVEL 0 LEVEL 1 LEVEL 2 LEVEL 3
DRL ••••• ••••• •••• ••Leverage • •• ••• ••••Performance/costs • • ••• ••
0
1
2
3
Safety
Environment Efficiency
T O W A R D S A S M A R T M O B I L I T Y R O A D M A P
Projects LEVEL 0 LEVEL 1 LEVEL 2 LEVEL 3
Safespot, COOPERS, SPITS TrafficDRIVEC2X, VBM Incidentwww.safespot-eu.org Monitoringwww.coopers-id.eu www.spits-www.drive-c2x.eu project.comwww.tno.nl
17
STRATEGIC TRAFFIC MANAGEMENT (TMP)
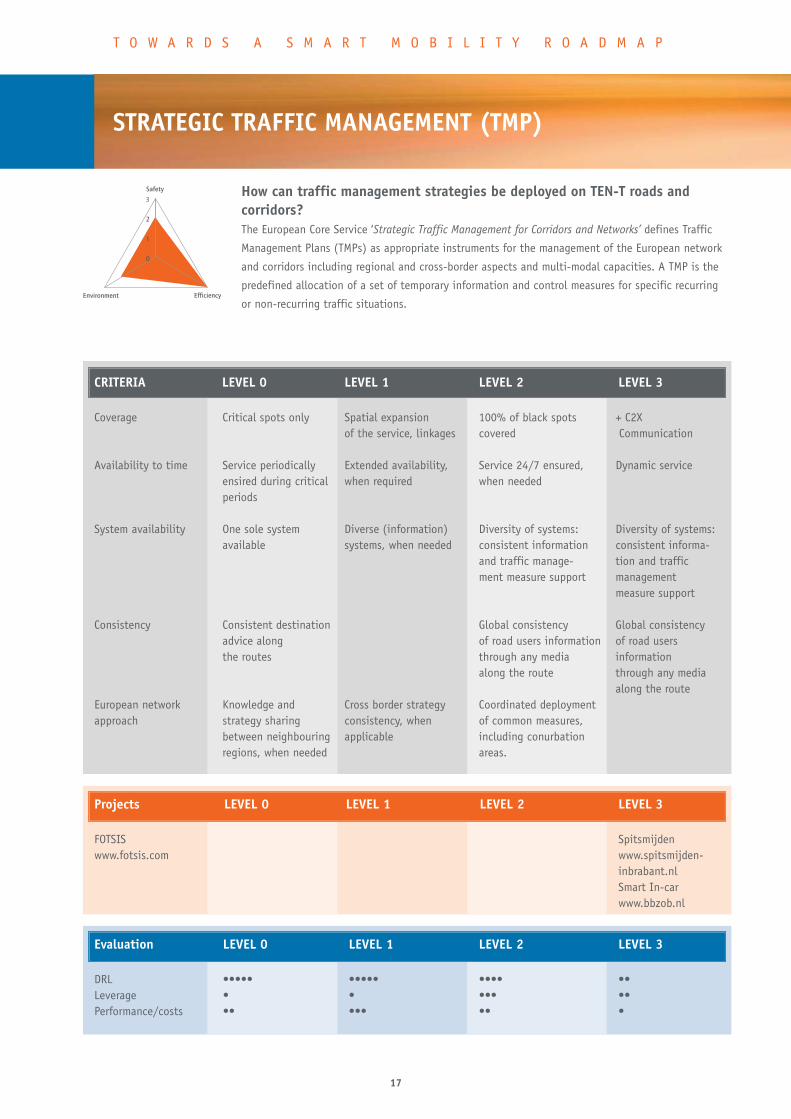
How can traffic management strategies be deployed on TEN-T roads andcorridors?The European Core Service ‘Strategic Traffic Management for Corridors and Networks’ defines Traffic
Management Plans (TMPs) as appropriate instruments for the management of the European network
and corridors including regional and cross-border aspects and multi-modal capacities. A TMP is the
predefined allocation of a set of temporary information and control measures for specific recurring
or non-recurring traffic situations.
CRITERIA LEVEL 0 LEVEL 1 LEVEL 2 LEVEL 3
Coverage Critical spots only Spatial expansion 100% of black spots + C2X of the service, linkages covered Communication
Availability to time Service periodically Extended availability, Service 24/7 ensured, Dynamic serviceensired during critical when required when neededperiods
System availability One sole system Diverse (information) Diversity of systems: Diversity of systems:available systems, when needed consistent information consistent informa-
and traffic manage- tion and trafficment measure support management
measure support
Consistency Consistent destination Global consistency Global consistency advice along of road users information of road usersthe routes through any media information
along the route through any media along the route
European network Knowledge and Cross border strategy Coordinated deploymentapproach strategy sharing consistency, when of common measures,
between neighbouring applicable including conurbation regions, when needed areas.
Evaluation LEVEL 0 LEVEL 1 LEVEL 2 LEVEL 3
DRL ••••• ••••• •••• ••Leverage • • ••• ••Performance/costs •• ••• •• •
0
1
2
3
Safety
Environment Efficiency
T O W A R D S A S M A R T M O B I L I T Y R O A D M A P
Projects LEVEL 0 LEVEL 1 LEVEL 2 LEVEL 3
FOTSIS Spitsmijdenwww.fotsis.com www.spitsmijden-
inbrabant.nlSmart In-carwww.bbzob.nl
18
INCIDENT MANAGEMENT
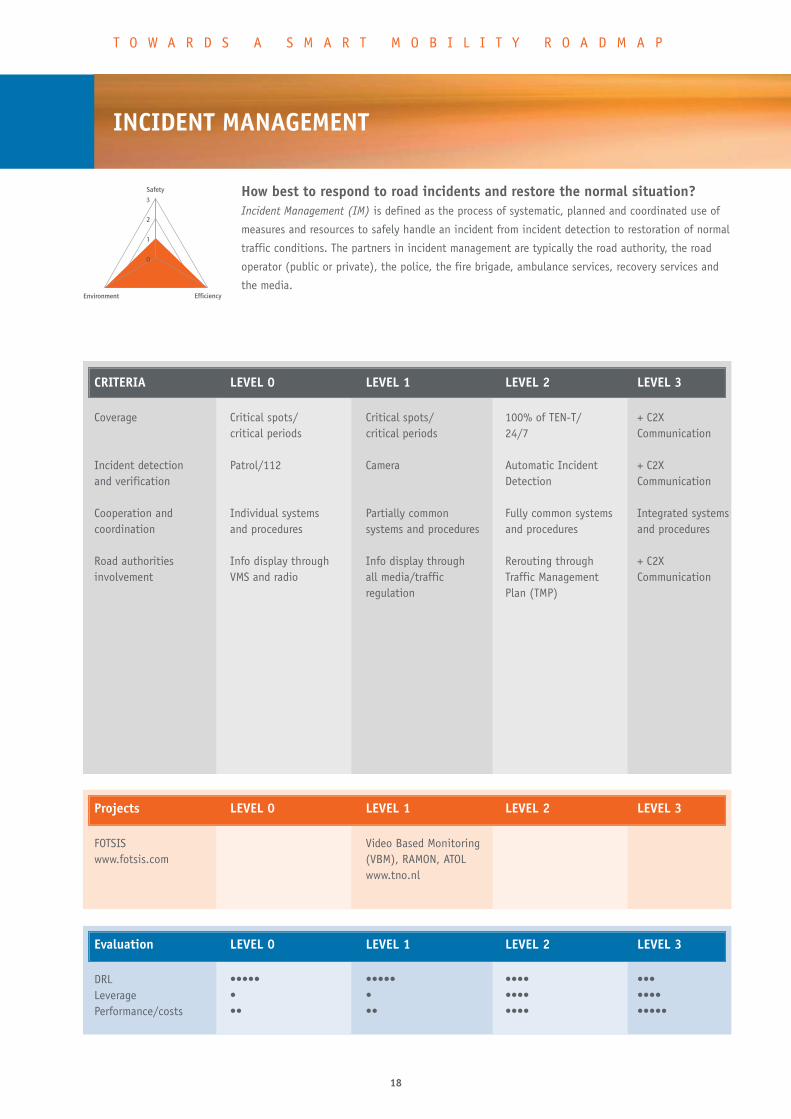
How best to respond to road incidents and restore the normal situation?Incident Management (IM) is defined as the process of systematic, planned and coordinated use of
measures and resources to safely handle an incident from incident detection to restoration of normal
traffic conditions. The partners in incident management are typically the road authority, the road
operator (public or private), the police, the fire brigade, ambulance services, recovery services and
the media.
CRITERIA LEVEL 0 LEVEL 1 LEVEL 2 LEVEL 3
Coverage Critical spots/ Critical spots/ 100% of TEN-T/ + C2X critical periods critical periods 24/7 Communication
Incident detection Patrol/112 Camera Automatic Incident + C2X and verification Detection Communication
Cooperation and Individual systems Partially common Fully common systems Integrated systemscoordination and procedures systems and procedures and procedures and procedures
Road authorities Info display through Info display through Rerouting through + C2X involvement VMS and radio all media/traffic Traffic Management Communication
regulation Plan (TMP)
Evaluation LEVEL 0 LEVEL 1 LEVEL 2 LEVEL 3
DRL ••••• ••••• •••• •••Leverage • • •••• ••••Performance/costs •• •• •••• •••••
0
1
2
3
Safety
Environment Efficiency
T O W A R D S A S M A R T M O B I L I T Y R O A D M A P
Projects LEVEL 0 LEVEL 1 LEVEL 2 LEVEL 3
FOTSIS Video Based Monitoring www.fotsis.com (VBM), RAMON, ATOL
www.tno.nl

19
INTELLIGENT TRUCK PARKING
How can truck drivers and haulage operators be provided with relevantinformation to optimise the use of truck parking facilities?Intelligent Truck Parking is implemented to optimise the use of the existing infrastructure in
terms of parking facilities, and to provide relevant information to European truck drivers, haulage
operators and service providers. The guideline therefore does not address simply building new
parking areas, although integration of the ‘intelligent’ aspect is recommended right from the
planning stage of new truck parking areas.
Evaluation LEVEL 0 LEVEL 1 LEVEL 2 LEVEL 3
DRL ••••• ••••• •••• •••Leverage • •• •• ••Performance/costs •• •• •• •
0
1
2
3
Safety
Environment Efficiency
T O W A R D S A S M A R T M O B I L I T Y R O A D M A P
CRITERIA LEVEL 0 LEVEL 1 LEVEL 2 LEVEL 3 LEVEL 4
Service Provision of static + Real-time + Short term + Pre-trip and + Provision of levels information information forecast (on-trip) on-trip forecast on facilities for
in parking (on-trip) on a section a larger area, bookingarea (pre-trip) including corridor
guidance system
Projects LEVEL 0 LEVEL 1 LEVEL 2 LEVEL 3 LEVEL 4
CVIS SPITS parking demo ParckR Toll Collect www.cvisproject.org www.spits- www.bbzob.nl (German Truck
project.com Stockholm Tolling system)congestion chargewww.stockholms-forsoket.se

20
ROAD USER CHARGING
How can road users and authorities be provided with a comprehensive systemfor road charging?Road user charging is a mechanism through which motorists pay to use defined areas of road
(for example by tolling), and is currently used extensively across Europe. It can also form larger
schemes to charge for the use of road space, and provide a means through which road space can
be reallocated in favour of public transport, for example.
CRITERIA LEVEL 0 LEVEL 1 LEVEL 2 LEVEL 3
Coverage Specific services + Specific roads/ + Specific time Dynamic, like a bridge motorways/sections intervals dependent on
traffic situation
Access Manual, toll Manual + automatic + Cameras + C2XCommunication
Costs strategy Charge for use + Distance dependent + Time of use Dynamicof feature dependent
Charging strategy Manual Manual Automatic Automatic
Evaluation LEVEL 0 LEVEL 1 LEVEL 2 LEVEL 3
DRL ••••• ••••• •••• •••Leverage •••• •••• ••••• •••••Performance/costs •• ••• •••• •••
0
1
2
3
Safety
Environment Efficiency
T O W A R D S A S M A R T M O B I L I T Y R O A D M A P
Projects LEVEL 0 LEVEL 1 LEVEL 2 LEVEL 3
CVISwww.cvisproject.org
21
TRAVEL TIME PREDICTION IN TRANSPORT (RITS)
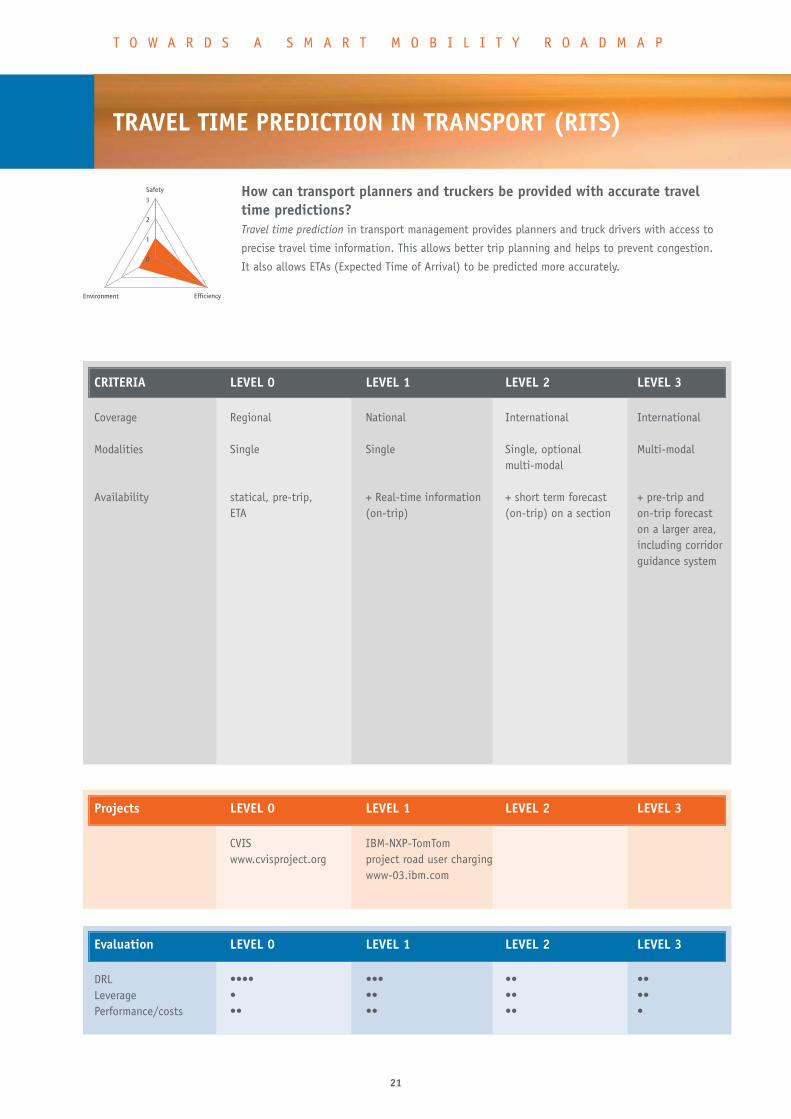
How can transport planners and truckers be provided with accurate traveltime predictions?Travel time prediction in transport management provides planners and truck drivers with access to
precise travel time information. This allows better trip planning and helps to prevent congestion.
It also allows ETAs (Expected Time of Arrival) to be predicted more accurately.
CRITERIA LEVEL 0 LEVEL 1 LEVEL 2 LEVEL 3
Coverage Regional National International International
Modalities Single Single Single, optional Multi-modalmulti-modal
Availability statical, pre-trip, + Real-time information + short term forecast + pre-trip and ETA (on-trip) (on-trip) on a section on-trip forecast
on a larger area, including corridorguidance system
Evaluation LEVEL 0 LEVEL 1 LEVEL 2 LEVEL 3
DRL •••• ••• •• ••Leverage • •• •• ••Performance/costs •• •• •• •
0
1
2
3
Safety
Environment Efficiency
T O W A R D S A S M A R T M O B I L I T Y R O A D M A P
Projects LEVEL 0 LEVEL 1 LEVEL 2 LEVEL 3
CVIS IBM-NXP-TomTomwww.cvisproject.org project road user charging
www-03.ibm.com
22
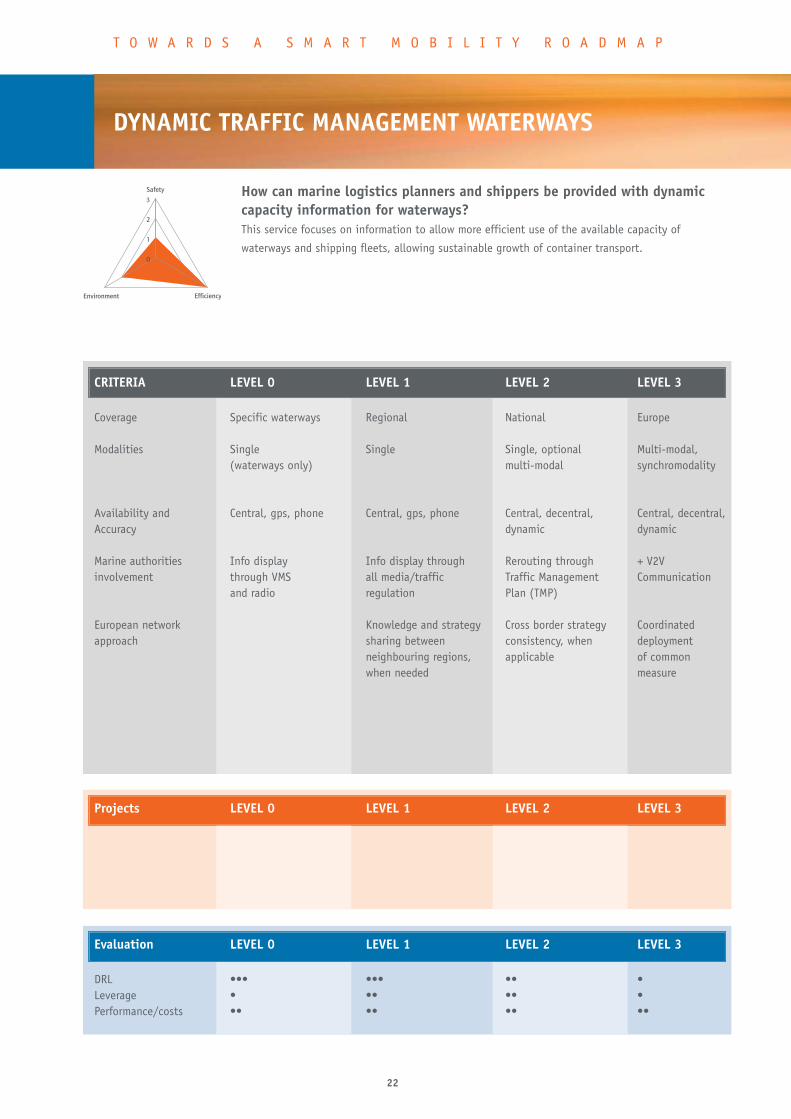
DYNAMIC TRAFFIC MANAGEMENT WATERWAYS
How can marine logistics planners and shippers be provided with dynamiccapacity information for waterways?This service focuses on information to allow more efficient use of the available capacity of
waterways and shipping fleets, allowing sustainable growth of container transport.
CRITERIA LEVEL 0 LEVEL 1 LEVEL 2 LEVEL 3
Coverage Specific waterways Regional National Europe
Modalities Single Single Single, optional Multi-modal,(waterways only) multi-modal synchromodality
Availability and Central, gps, phone Central, gps, phone Central, decentral, Central, decentral,Accuracy dynamic dynamic
Marine authorities Info display Info display through Rerouting through + V2V involvement through VMS all media/traffic Traffic Management Communication
and radio regulation Plan (TMP)
European network Knowledge and strategy Cross border strategy Coordinatedapproach sharing between consistency, when deployment
neighbouring regions, applicable of common when needed measure
Projects LEVEL 0 LEVEL 1 LEVEL 2 LEVEL 3
Evaluation LEVEL 0 LEVEL 1 LEVEL 2 LEVEL 3
DRL ••• ••• •• •Leverage • •• •• •Performance/costs •• •• •• ••
0
1
2
3
Safety
Environment Efficiency
T O W A R D S A S M A R T M O B I L I T Y R O A D M A P
23
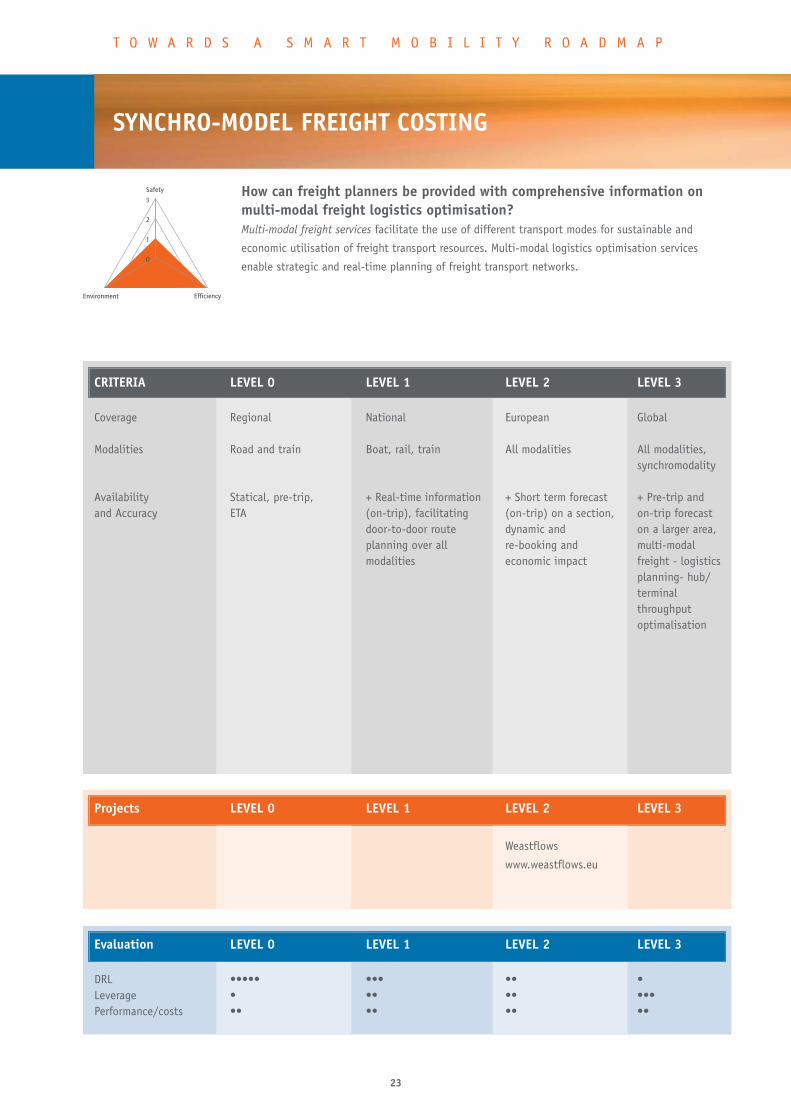
SYNCHRO-MODEL FREIGHT COSTING
How can freight planners be provided with comprehensive information onmulti-modal freight logistics optimisation?Multi-modal freight services facilitate the use of different transport modes for sustainable and
economic utilisation of freight transport resources. Multi-modal logistics optimisation services
enable strategic and real-time planning of freight transport networks.
CRITERIA LEVEL 0 LEVEL 1 LEVEL 2 LEVEL 3
Coverage Regional National European Global
Modalities Road and train Boat, rail, train All modalities All modalities, synchromodality
Availability Statical, pre-trip, + Real-time information + Short term forecast + Pre-trip and and Accuracy ETA (on-trip), facilitating (on-trip) on a section, on-trip forecast
door-to-door route dynamic and on a larger area,planning over all re-booking and multi-modal modalities economic impact freight - logistics
planning- hub/terminal throughputoptimalisation
Evaluation LEVEL 0 LEVEL 1 LEVEL 2 LEVEL 3
DRL ••••• ••• •• •Leverage • •• •• •••Performance/costs •• •• •• ••
0
1
2
3
Safety
Environment Efficiency
T O W A R D S A S M A R T M O B I L I T Y R O A D M A P
Projects LEVEL 0 LEVEL 1 LEVEL 2 LEVEL 3
Weastflows
www.weastflows.eu
24
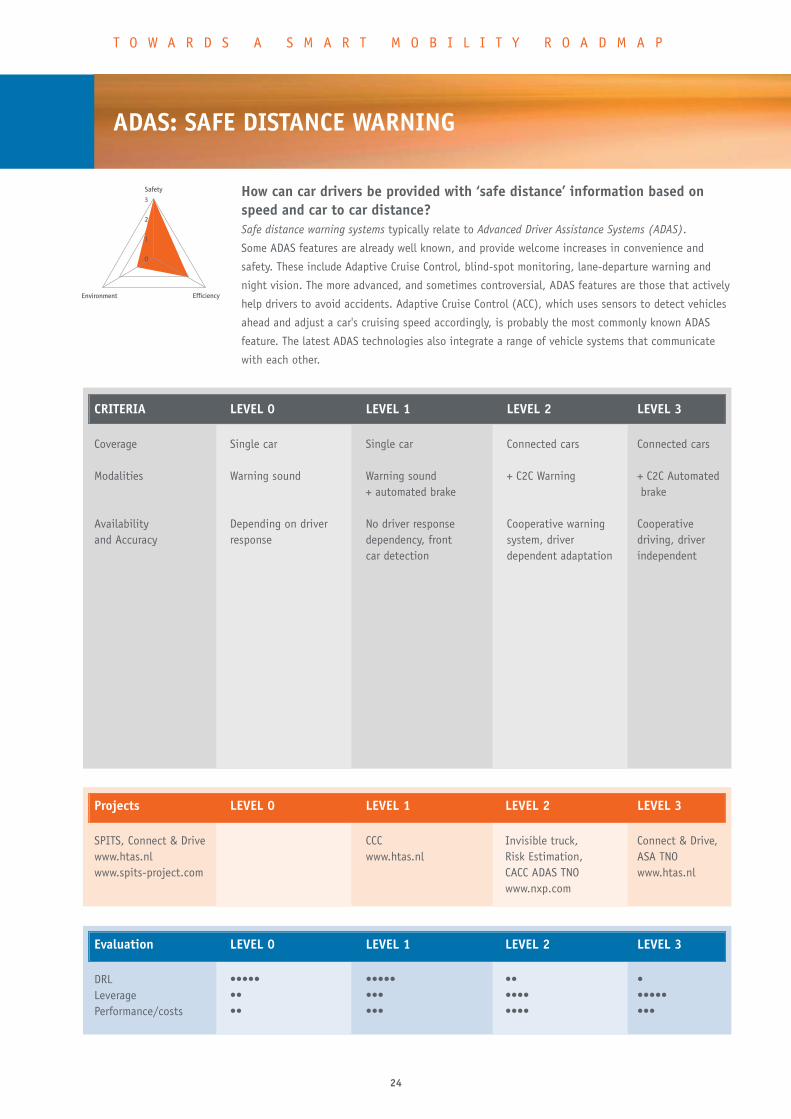
ADAS: SAFE DISTANCE WARNING
How can car drivers be provided with ‘safe distance’ information based onspeed and car to car distance?Safe distance warning systems typically relate to Advanced Driver Assistance Systems (ADAS).
Some ADAS features are already well known, and provide welcome increases in convenience and
safety. These include Adaptive Cruise Control, blind-spot monitoring, lane-departure warning and
night vision. The more advanced, and sometimes controversial, ADAS features are those that actively
help drivers to avoid accidents. Adaptive Cruise Control (ACC), which uses sensors to detect vehicles
ahead and adjust a car's cruising speed accordingly, is probably the most commonly known ADAS
feature. The latest ADAS technologies also integrate a range of vehicle systems that communicate
with each other.
CRITERIA LEVEL 0 LEVEL 1 LEVEL 2 LEVEL 3
Coverage Single car Single car Connected cars Connected cars
Modalities Warning sound Warning sound + C2C Warning + C2C Automated + automated brake brake
Availability Depending on driver No driver response Cooperative warning Cooperative and Accuracy response dependency, front system, driver driving, driver
car detection dependent adaptation independent
Evaluation LEVEL 0 LEVEL 1 LEVEL 2 LEVEL 3
DRL ••••• ••••• •• •Leverage •• ••• •••• •••••Performance/costs •• ••• •••• •••
0
1
2
3
Safety
Environment Efficiency
T O W A R D S A S M A R T M O B I L I T Y R O A D M A P
Projects LEVEL 0 LEVEL 1 LEVEL 2 LEVEL 3
SPITS, Connect & Drive CCC Invisible truck, Connect & Drive, www.htas.nl www.htas.nl Risk Estimation, ASA TNOwww.spits-project.com CACC ADAS TNO www.htas.nl
www.nxp.com
25
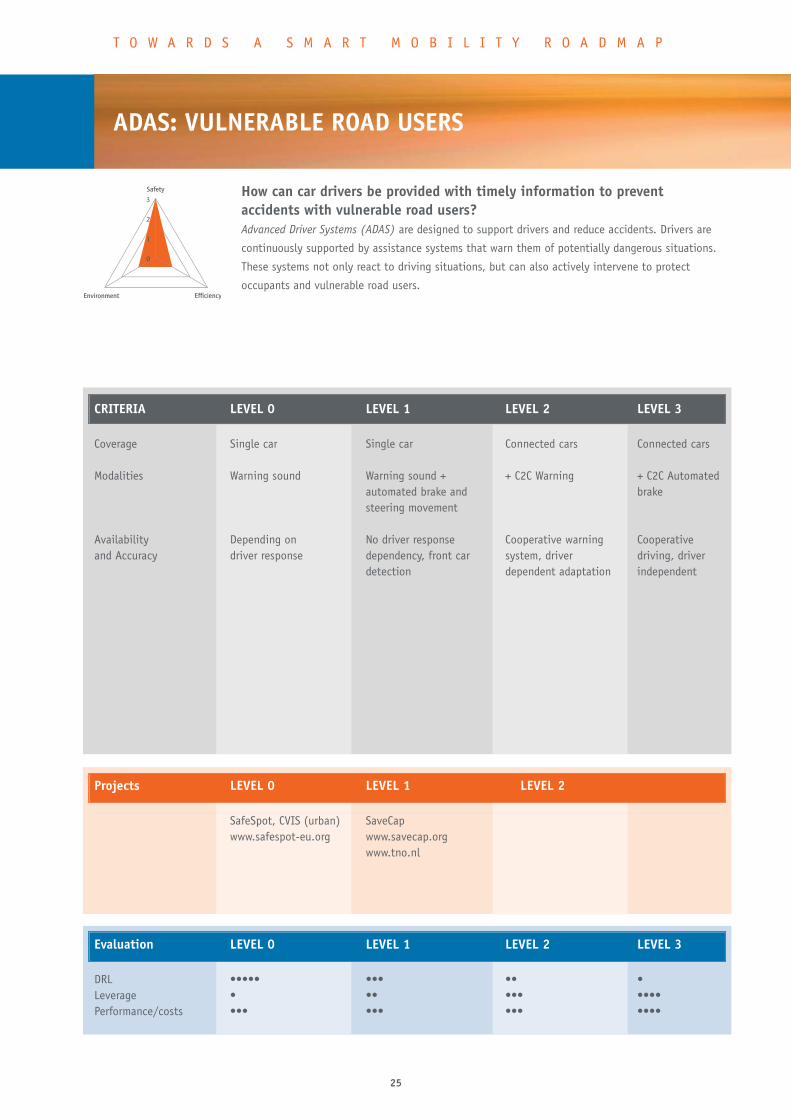
ADAS: VULNERABLE ROAD USERS
How can car drivers be provided with timely information to preventaccidents with vulnerable road users?Advanced Driver Systems (ADAS) are designed to support drivers and reduce accidents. Drivers are
continuously supported by assistance systems that warn them of potentially dangerous situations.
These systems not only react to driving situations, but can also actively intervene to protect
occupants and vulnerable road users.
CRITERIA LEVEL 0 LEVEL 1 LEVEL 2 LEVEL 3
Coverage Single car Single car Connected cars Connected cars
Modalities Warning sound Warning sound + + C2C Warning + C2C Automated automated brake and brakesteering movement
Availability Depending on No driver response Cooperative warning Cooperative and Accuracy driver response dependency, front car system, driver driving, driver
detection dependent adaptation independent
Evaluation LEVEL 0 LEVEL 1 LEVEL 2 LEVEL 3
DRL ••••• ••• •• •Leverage • •• ••• ••••Performance/costs ••• ••• ••• ••••
0
1
2
3
Safety
Environment Efficiency
T O W A R D S A S M A R T M O B I L I T Y R O A D M A P
Projects LEVEL 0 LEVEL 1 LEVEL 2
SafeSpot, CVIS (urban) SaveCapwww.safespot-eu.org www.savecap.org
www.tno.nl

26
3
27
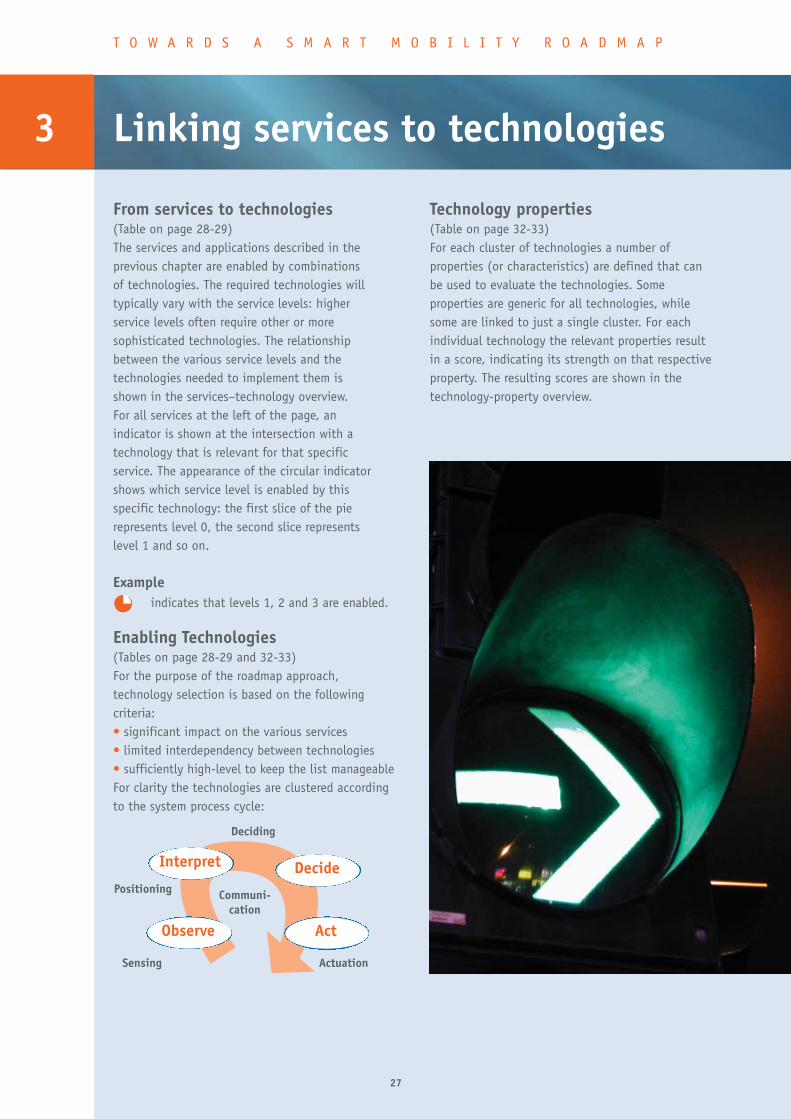
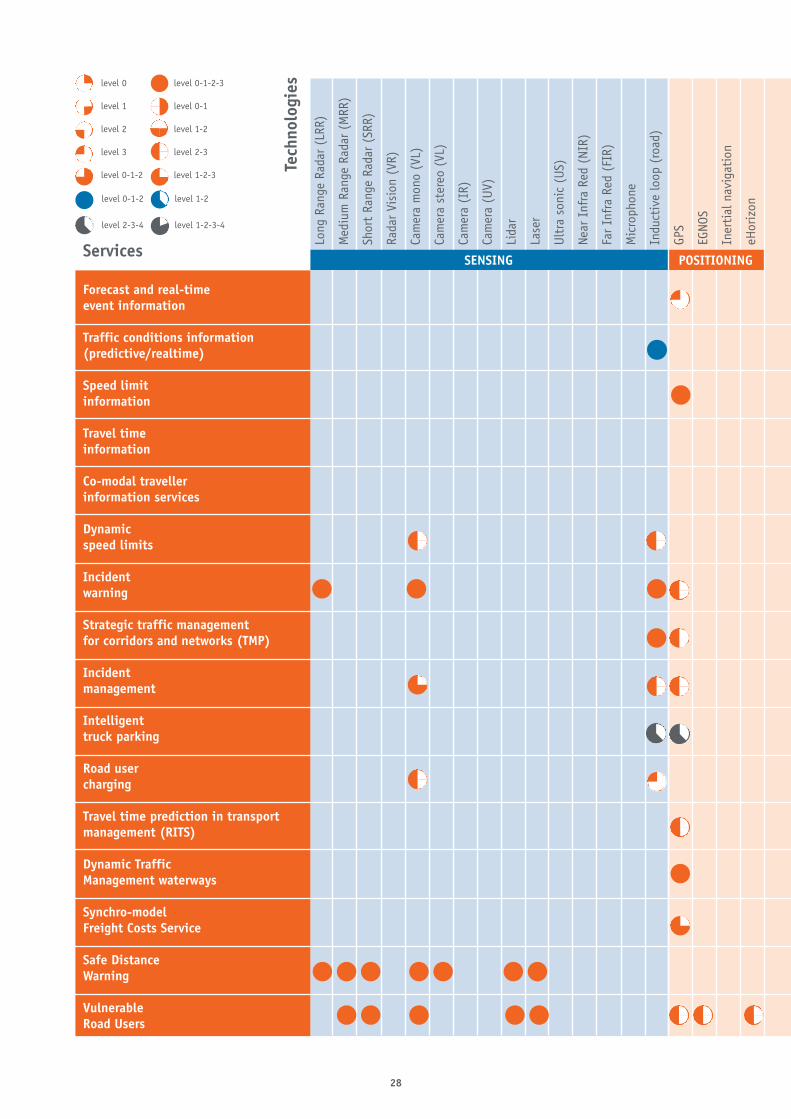
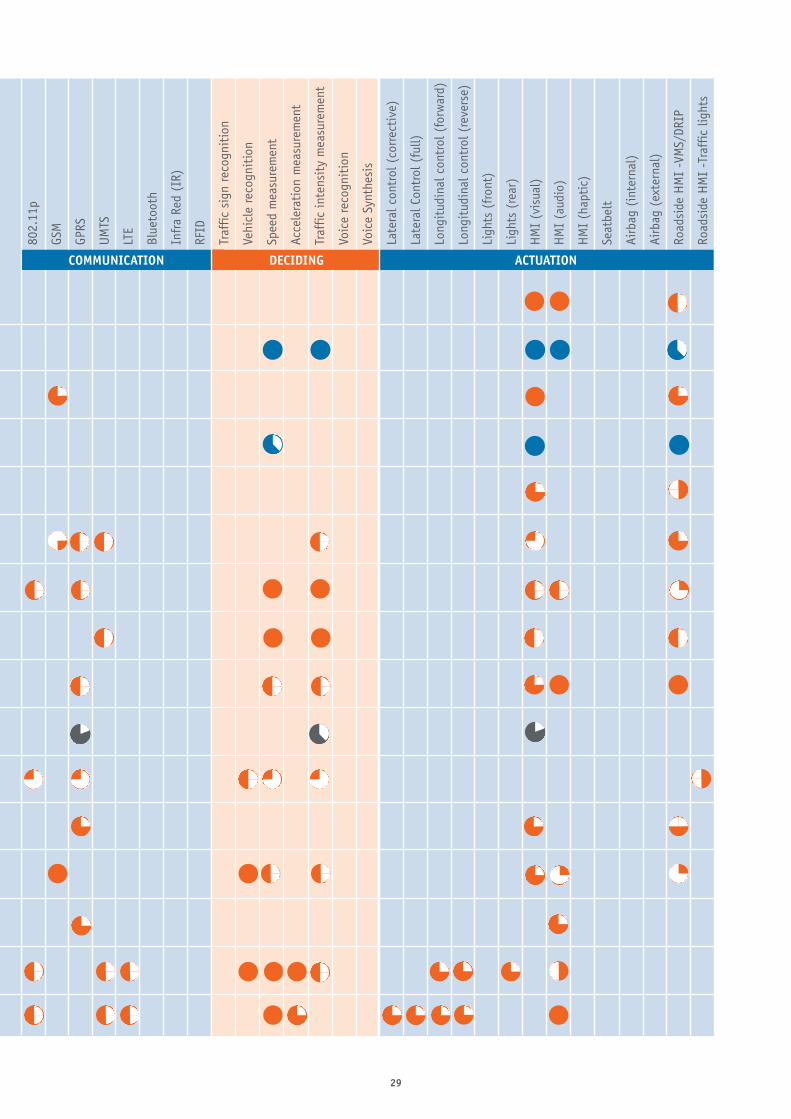
From services to technologies (Table on page 28-29)The services and applications described in theprevious chapter are enabled by combinationsof technologies. The required technologies willtypically vary with the service levels: higherservice levels often require other or moresophisticated technologies. The relationshipbetween the various service levels and thetechnologies needed to implement them isshown in the services–technology overview.For all services at the left of the page, anindicator is shown at the intersection with atechnology that is relevant for that specificservice. The appearance of the circular indicatorshows which service level is enabled by thisspecific technology: the first slice of the pierepresents level 0, the second slice representslevel 1 and so on.
Exampleindicates that levels 1, 2 and 3 are enabled.
Enabling Technologies(Tables on page 28-29 and 32-33)For the purpose of the roadmap approach,technology selection is based on the followingcriteria:• significant impact on the various services• limited interdependency between technologies• sufficiently high-level to keep the list manageableFor clarity the technologies are clustered accordingto the system process cycle:
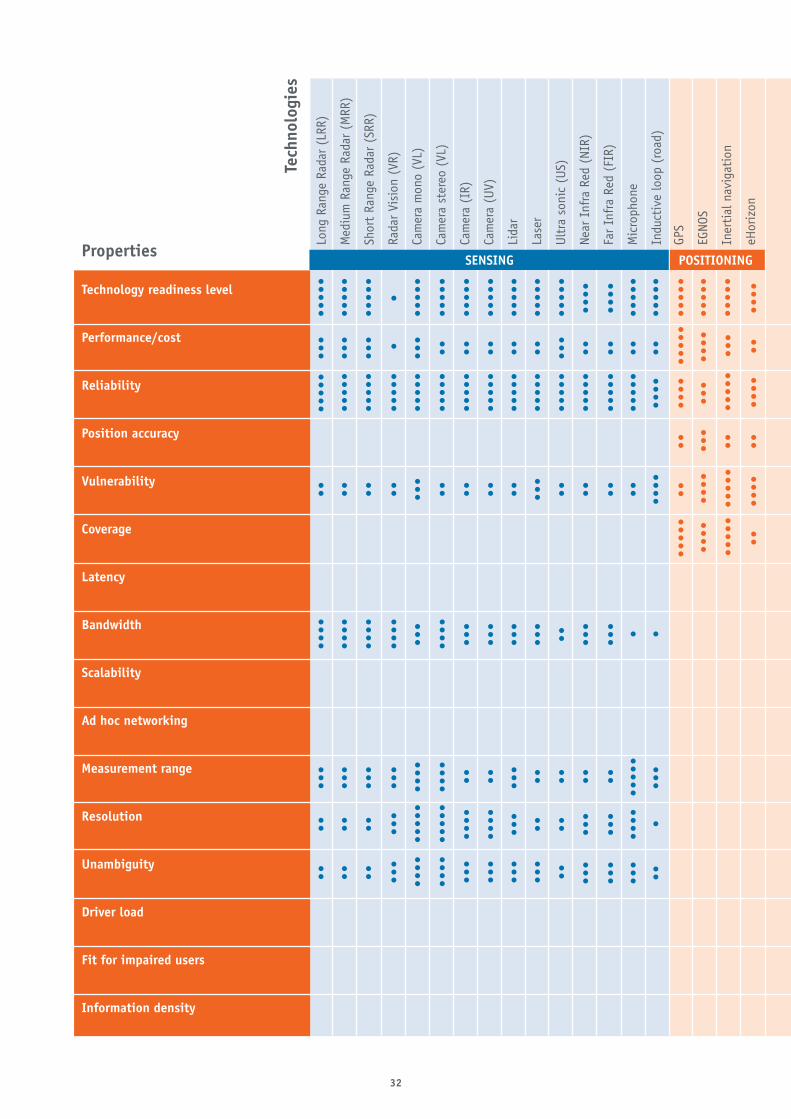
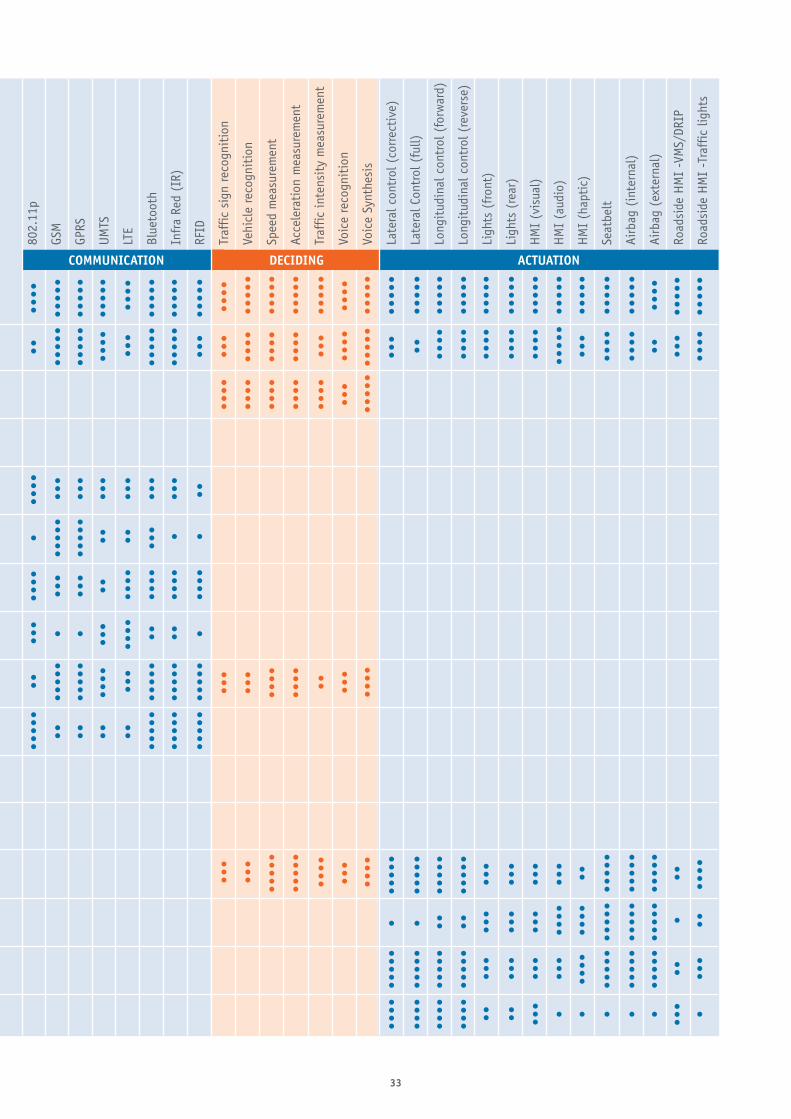
Technology properties(Table on page 32-33)For each cluster of technologies a number ofproperties (or characteristics) are defined that canbe used to evaluate the technologies. Someproperties are generic for all technologies, whilesome are linked to just a single cluster. For eachindividual technology the relevant properties resultin a score, indicating its strength on that respectiveproperty. The resulting scores are shown in thetechnology-property overview.
Observe
Interpret
Act
Decide
Deciding
ActuationSensing
Positioning Communi-cation
Linking services to technologies
T O W A R D S A S M A R T M O B I L I T Y R O A D M A P
28
Tech
nolo
gies
SENSING POSITIONING
Long
Ran
ge R
adar
(LR
R)
Med
ium
Ran
ge R
adar
(M
RR)
Shor
t Ra
nge
Rada
r (S
RR)
Rada
r Vi
sion
(VR
)
Cam
era
mon
o (V
L)
Cam
era
ster
eo (
VL)
Cam
era
(IR)
Cam
era
(UV)
Lida
r
Lase
r
Ult
ra s
onic
(US
)
Near
Inf
ra R
ed (
NIR)
Far
Infr
a Re
d (F
IR)
Mic
roph
one
Indu
ctiv
e lo
op (
road
)
GPS
EGNO
S
Iner
tial
nav
igat
ion
eHor
izon
level 0
level 1
level 2
level 3
level 0-1-2
level 0-1-2-3
level 0-1
level 1-2
level 2-3
level 1-2-3
level 0-1-2 level 1-2
level 2-3-4 level 1-2-3-4
Services
Forecast and real-timeevent information
Traffic conditions information (predictive/realtime)
Speed limitinformation
Travel timeinformation
Co-modal travellerinformation services
Dynamicspeed limits
Incidentwarning
Strategic traffic managementfor corridors and networks (TMP)
Incidentmanagement
Intelligenttruck parking
Road usercharging
Travel time prediction in transportmanagement (RITS)
Dynamic TrafficManagement waterways
Synchro-modelFreight Costs Service
Safe DistanceWarning
VulnerableRoad Users
29
COMMUNICATION DECIDING ACTUATION
802.
11p
GSM
GPRS
UM
TS
LTE
Blue
toot
h
Infr
a Re
d (I
R)
RFID
Traf
fic s
ign
reco
gnit
ion
Vehi
cle
reco
gnit
ion
Spee
d m
easu
rem
ent
Acce
lera
tion
mea
sure
men
t
Traf
fic in
tens
ity
mea
sure
men
t
Voic
e re
cogn
itio
n
Voic
e Sy
nthe
sis
Late
ral c
ontr
ol (
corr
ecti
ve)
Late
ral C
ontr
ol (
full)
Long
itud
inal
con
trol
(fo
rwar
d)
Long
itud
inal
con
trol
(re
vers
e)
Ligh
ts (
fron
t)
Ligh
ts (
rear
)
HM
I (v
isua
l)
HM
I (a
udio
)
HM
I (h
apti
c)
Seat
belt
Airb
ag (
inte
rnal
)
Airb
ag (
exte
rnal
)
Road
side
HM
I -V
MS/
DRIP
Road
side
HM
I -T
raff
ic li
ghts

30
31
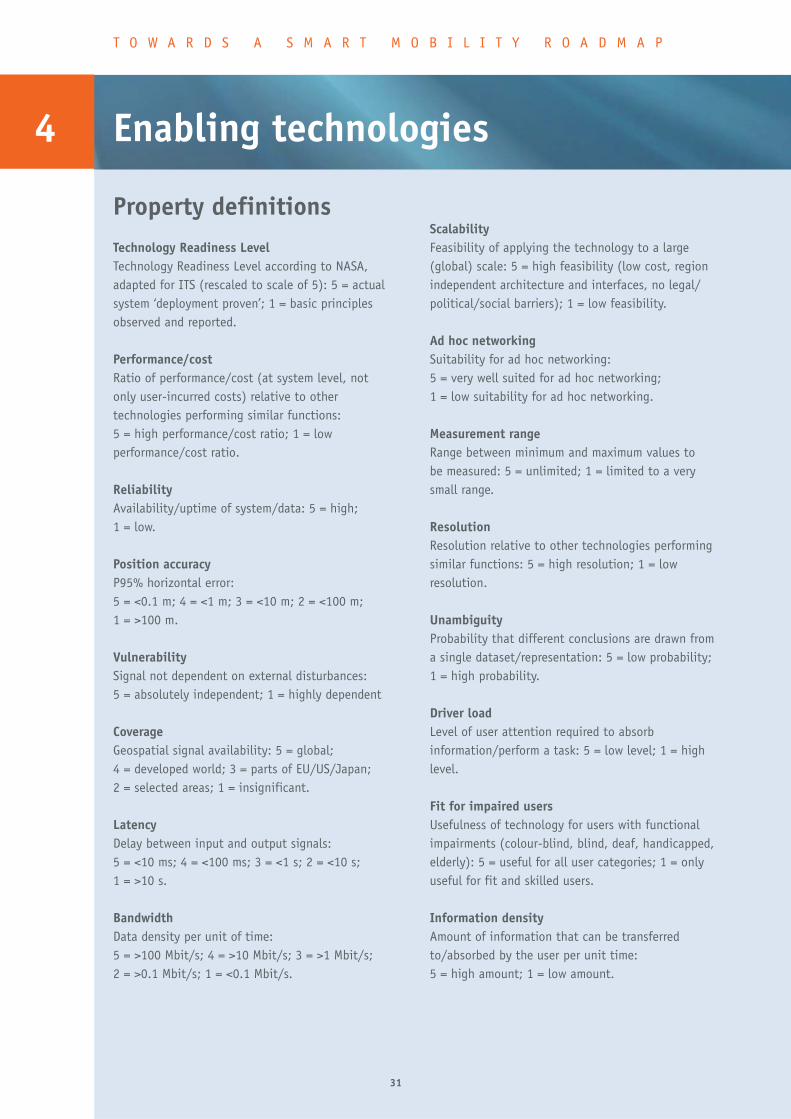
Property definitionsTechnology Readiness Level Technology Readiness Level according to NASA,adapted for ITS (rescaled to scale of 5): 5 = actualsystem ‘deployment proven’; 1 = basic principlesobserved and reported.
Performance/cost Ratio of performance/cost (at system level, notonly user-incurred costs) relative to othertechnologies performing similar functions:5 = high performance/cost ratio; 1 = lowperformance/cost ratio.
ReliabilityAvailability/uptime of system/data: 5 = high;1 = low.
Position accuracyP95% horizontal error:5 = <0.1 m; 4 = <1 m; 3 = <10 m; 2 = <100 m;1 = >100 m.
VulnerabilitySignal not dependent on external disturbances:5 = absolutely independent; 1 = highly dependent
CoverageGeospatial signal availability: 5 = global;4 = developed world; 3 = parts of EU/US/Japan;2 = selected areas; 1 = insignificant.
LatencyDelay between input and output signals:5 = <10 ms; 4 = <100 ms; 3 = <1 s; 2 = <10 s;1 = >10 s.
BandwidthData density per unit of time:5 = >100 Mbit/s; 4 = >10 Mbit/s; 3 = >1 Mbit/s;2 = >0.1 Mbit/s; 1 = <0.1 Mbit/s.
ScalabilityFeasibility of applying the technology to a large(global) scale: 5 = high feasibility (low cost, regionindependent architecture and interfaces, no legal/political/social barriers); 1 = low feasibility.
Ad hoc networkingSuitability for ad hoc networking:5 = very well suited for ad hoc networking;1 = low suitability for ad hoc networking.
Measurement rangeRange between minimum and maximum values tobe measured: 5 = unlimited; 1 = limited to a verysmall range.
ResolutionResolution relative to other technologies performingsimilar functions: 5 = high resolution; 1 = lowresolution.
Unambiguity Probability that different conclusions are drawn froma single dataset/representation: 5 = low probability;1 = high probability.
Driver loadLevel of user attention required to absorbinformation/perform a task: 5 = low level; 1 = highlevel.
Fit for impaired usersUsefulness of technology for users with functionalimpairments (colour-blind, blind, deaf, handicapped,elderly): 5 = useful for all user categories; 1 = onlyuseful for fit and skilled users.
Information densityAmount of information that can be transferredto/absorbed by the user per unit time:5 = high amount; 1 = low amount.
4 Enabling technologies
31
T O W A R D S A S M A R T M O B I L I T Y R O A D M A P
32
Properties
Technology readiness level
Performance/cost
Reliability
Position accuracy
Vulnerability
Coverage
Latency
Bandwidth
Scalability
Ad hoc networking
Measurement range
Resolution
Unambiguity
Driver load
Fit for impaired users
Information density
SENSING POSITIONING
•••••
•••••
••••••
••••••
•• •• •• •• •• •• •• •• •••••
•••••
•••••
•••••
•••••
•••••
•••••
•••••
•••••
•••••
•••••
•••••
•••••
•••••
•••••
•••••
••••
•••••
•••••
•••••
•••••
•••••
•••••
•••••
•••••
•••••
•••••
•••••
•••••
••••
••••
•••••
•
•• •• •• •••••
•• •• •• •••••
•• •• •• ••••••
••••
••••
••••
•••••••
•••••••
••••••
•••••
•••••• • •
••••••
••••••
••••
•••••• ••
••••• •• •• ••
•••••
•••
•• •• •••••
•• •• •••••
•••••
•••••
••••
•••••••
•• •••••
••• •••••
••••
•••••••
••••••
•••••
••••••
•••••
••••
•••••••
•••
•••••••
•••••
••••
•••••
•• ••
••••••
••••
••••••••••
••••
•••••••
Tech
nolo
gies
Long
Ran
ge R
adar
(LR
R)
Med
ium
Ran
ge R
adar
(M
RR)
Shor
t Ra
nge
Rada
r (S
RR)
Rada
r Vi
sion
(VR
)
Cam
era
mon
o (V
L)
Cam
era
ster
eo (
VL)
Cam
era
(IR)
Cam
era
(UV)
Lida
r
Lase
r
Ult
ra s
onic
(US
)
Near
Inf
ra R
ed (
NIR)
Far
Infr
a Re
d (F
IR)
Mic
roph
one
Indu
ctiv
e lo
op (
road
)
GPS
EGNO
S
Iner
tial
nav
igat
ion
eHor
izon
33
••••
•••••
•••••
•••••
••
••••
•••••
•••••
•••••••••
•••••
•••••
••••••
•••
•••••
•••••
•••••••
••••••
••••••
•••••
••••••
••••••• ••
•••• •
•••••••
•••••
••••
••••
••••
••••
••• • • •••••••
•• •• •
•••••••
•••••
•••••••
•••••
•••••
••••••••••
•• •• •• •••••••
•••••
•••••
••••
•••••
•••••
•••••
•••••
••••
•••••
••••
••••
•••••••
••••
•••••••••
••••
••••
••••
•••••••
•••••
••••••
••••
••••••
•••••••
••••••
•••••
•••••
•••••••
••••
••••
••••
••••
••••
••••
•••••
•••••
•••••
•••••
•••••
•••••
•••••
•••••
•••••
•••••
•••••
••••
•••••
•••••
•••••
•••••
•••••••
••••
••••••
•••
•••••
•••••
•••••
•••••
••••••
••••••
••••••
•••••
•••••
•••••••
• • •• •••••
••••••
••••
••••
•••••
•••••
•••••• ••
•••••
•••••
•••••
•••••
••••••
••••••
••••
•••••
•••••
•••••••
•••
••••
••••
••••
•••••• ••
••• • • • • • ••••
COMMUNICATION DECIDING ACTUATION
802.
11p
GSM
GPRS
UM
TS
LTE
Blue
toot
h
Infr
a Re
d (I
R)
RFID
Traf
fic s
ign
reco
gnit
ion
Vehi
cle
reco
gnit
ion
Spee
d m
easu
rem
ent
Acce
lera
tion
mea
sure
men
t
Traf
fic in
tens
ity
mea
sure
men
t
Voic
e re
cogn
itio
n
Voic
e Sy
nthe
sis
Late
ral c
ontr
ol (
corr
ecti
ve)
Late
ral C
ontr
ol (
full)
Long
itud
inal
con
trol
(fo
rwar
d)
Long
itud
inal
con
trol
(re
vers
e)
Ligh
ts (
fron
t)
Ligh
ts (
rear
)
HM
I (v
isua
l)
HM
I (a
udio
)
HM
I (h
apti
c)
Seat
belt
Airb
ag (
inte
rnal
)
Airb
ag (
exte
rnal
)
Road
side
HM
I -V
MS/
DRIP
Road
side
HM
I -T
raff
ic li
ghts
34
T O W A R D S A S M A R T M O B I L I T Y R O A D M A P
Milestones so farThe partnerships between industry, governmentand knowledge institutes are currently buildingon what has already been achieved, with the focuson achieving the defined goals in the Netherlands. A few of the most important milestones in thesepartnerships are listed below.
• March 2012: Joint Smart Mobility Connekt -DITCM - AutomotiveNL at the Intertraffic 2012
• January 2012: The ministry gives the startingsignal for the implementation of measures in theBrabant region to improve traffic flows
• January 2012: Launch of AutomotiveNL
• October 2011: Winning two of the threeiMobility awards for GCDC and pilots in the‘Brainport’ region
• October 2011: Ertico - ITS Europe and ETSIorganise the first interoperability testing eventfor cooperative mobility services, hosted by theNetherlands
• September 2011: DITCM - Automotive SmartMobility roadmap integrated
• August 2011: HTSM Automotive Smart Mobilityroadmap with three programme lines: VehicleState Estimation; Connected Car; and TrafficManagement
• June 2011: DITCM Roadmap with threeprogramme lines: Human Factors on CooperativeDriving; Development environment for CooperativeDriving; and Effect studies
• June 2011: The ministry announces aninvestment of more than 1 billion euro in theBeter Benutten (‘better utilisation’) programmein which government and the most importanteconomic regions in the Netherlands aim toreduce traffic congestion at the busiestintersections by 20%
• May 2011: GCDC (Grand Cooperative DrivingChallenge): Promoting cooperation andstandardisation in an informal setting toaccelerate innovation on smart mobility
• May 2011: DITCM: Signing of a letter ofunderstanding by 15 parties for collaborationon cooperative mobility, sharing of facilities andimplementation of a shared roadmap
• January 2011: TU/e starts Smart Mobilitystrategic area
• November 2010: Meeting of top managers fromindustry, government and knowledge institutes.These parties have committed to investigatethe feasibility of setting up an integrated testenvironment for smart traffic systems.
5

Source
T O W A R D S A S M A R T M O B I L I T Y R O A D M A P
The format for the Smart Mobility Services:EasyWay deployment guidelines brochure 2011
EasyWay is a multi-annual project for thedeployment of harmonised Intelligent TransportSystems and services across Europe in fieldslike traveller information, traffic management,freight and logistics.
The project is in line with the directive recentlyadopted by the European Commission.The EasyWay partners have defined the deploymentguidelines for harmonised services across Europethat have been validated by the member statesand are now being implemented by road authoritiesacross Europe. For further information, seewww.easyway-its.eu
35
AutomotiveNLHerm VerbeekP.O. Box 1015NL-5700 MC HelmondT +31 492 562 [email protected]
ConnektPaul PottersP.O. Box 48NL-2600 AA DelftT + 31 15 251 65 [email protected]
DITCMJoëlle van den BroekP.O. Box 756NL-5700 AT HelmondT +31 88 866 57 [email protected]
TOWA R D S A S M A R T M O B I L I T Y R OA D M A P