towards a model of dns client behaviorengr.case.edu/rabinovich_michael/otherpubs/dns_pam2016.pdf ·...
TRANSCRIPT
Towards a Model of DNS Client Behavior?
Kyle Schomp†, Michael Rabinovich†, Mark Allman‡
†Case Western Reserve University, Cleveland, OH, USA‡International Computer Science Institute, Berkeley, CA, USA
Abstract. The Domain Name System (DNS) is a critical componentof the Internet infrastructure as it maps human-readable hostnames intothe IP addresses the network uses to route traffic. Yet, the DNS behaviorof individual clients is not well understood. In this paper, we presenta characterization of DNS clients with an eye towards developing ananalytical model of client interaction with the larger DNS ecosystem.While this is initial work and we do not arrive at a DNS workload model,we highlight a variety of behaviors and characteristics that enhance ourmental models of how DNS operates and move us towards an analyticalmodel of client-side DNS operation.
1 Introduction
The modern Internet relies on the Domain Name System (DNS) for two mainfunctions. First, the DNS allows people to leverage human-friendly hostnames(e.g., “www.cnn.com”) instead of obtuse IP addresses to identify a host. Second,hostnames provide a layer of abstraction such that the IP address assigned toa hostname can vary over time. In particular, Content Distribution Networks(CDNs) employ this late binding to direct users to the best content replica.Previous work shows that DNS lookups precede over 60% of TCP connections[14]. As a result, individual clients issue large numbers of DNS queries. Yet,our understanding of DNS query streams is largely based on aggregate popula-tions of clients—e.g., at an organizational [6] or residential level [3]—leaving ourknowledge of individual client behavior limited.
This paper represents an initial step towards understanding individual clientDNS behavior. We monitor DNS transactions between a population of thousandsof clients and their local resolver such that we are able to directly tie lookupsto individual clients. Our ultimate goal is an analytical model of DNS clientbehavior that can be used for everything from workload generation to resourceprovisioning to anomaly detection. In this paper we provide a characterizationof DNS behavior along the dimensions our model will ultimately cover and alsoanecdotally show promising modeling approaches.
Note, one view holds that DNS is a “side service” and should not be directlymodeled, but rather can be well understood by deriving the DNS workload fromapplications such as web browsing and email transmission. However, deriving aDNS workload from application behavior is at best difficult because (i) client
? This work was funded in part by NSF grant CNS-1213157.
caching policies impact what DNS queries are actually sent in response to anapplication event, (ii) some applications selectively use pre-fetching to lookupnames before they are needed and (iii) such a derivation would entail under-standing many applications to pull together a reasonable DNS workload. There-fore, we take the approach that focusing on the DNS traffic itself is the mosttractable way to understand—and eventually model—name lookups.
To motivate the need for a model, we provide an exemplar from our previouswork. In [14], we propose that clients should directly resolve hostnames instead ofusing a recursive resolver. Ideally, an evaluation of this end system-based mech-anism would be conducted in the context of end systems themselves. However,the best data we could obtain was at the level of individual households—whichwe know to include multiple hosts behind a NAT. Therefore, the results of ourtrace-driven simulations are at best an approximation of the impact of the mech-anism we were investigating. Our results would have been more precise had webeen able to leverage a model of individual client DNS behavior.
Broadly, the remainder of this paper follows the contours of what a modelwould capture. We first focus on understanding the nature of the clients them-selves in §3, finding that while most are traditional user-facing devices, there areothers that interact with the DNS in distinct ways. Next we observe in §4 thatDNS queries often occur closely-spaced in time—e.g., driven by loading objectsfor a single web page from disparate servers—and therefore we develop a methodto gather together queries into clusters. We then assess the number and spacingof queries in §5 and finally tackle the patterns in what hostnames individualclients lookup in §6. We find that clients have fairly distinct “working sets” ofnames, and also that hostname popularity has power law properties.
2 Dataset
Our dataset comes from two packet taps at Case Western Reserve University(CWRU) that monitor the links connecting the two data centers that house allfive of the University’s DNS resolvers—i.e., between client devices and their re-cursive DNS resolvers. We collect full payload packet traces of all UDP trafficinvolving port 53 (the default DNS port). The campus wireless network situatesclient devices behind NATs and therefore we cannot isolate DNS traffic to in-dividual clients. Hence, we do not consider this traffic in our study (although,future work remains to better understand DNS usage on mobile devices). TheUniversity Acceptable Use Policy prohibits the use of NAT on its wired networkswhile offering wireless access throughout the campus, and therefore we believethe traffic we capture from the wired network does represent individual clients.Our dataset includes all DNS traffic from two separate weeks and is partitionedby client location—in the residential or office portions of the network. Details ofthe datasets are given in Table 1 including the number of queries, the numberof clients that issue those queries, and the number of hostnames queried.Validation: During the February data collection, we collect query logs fromthe five campus DNS resolvers to validate our datasets1. Comparing the packet
1 We prefer traces over logs due to the better timestamp resolution (msec vs. sec).
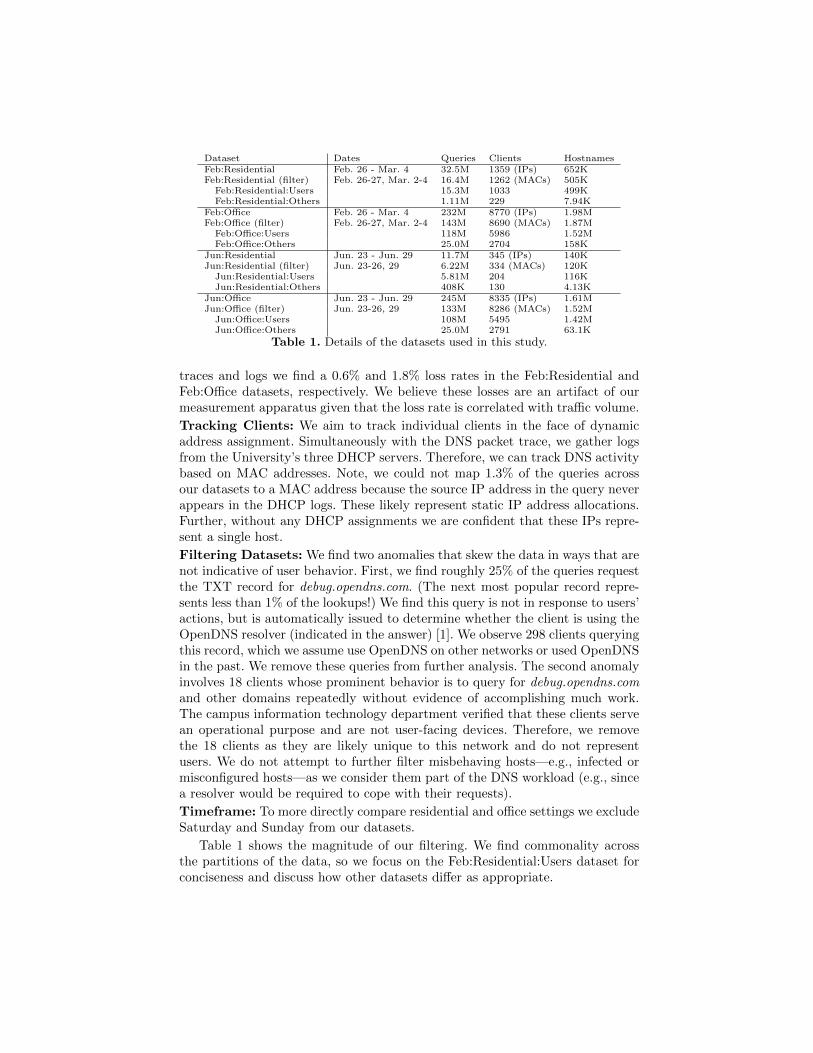
Dataset Dates Queries Clients HostnamesFeb:Residential Feb. 26 - Mar. 4 32.5M 1359 (IPs) 652KFeb:Residential (filter) Feb. 26-27, Mar. 2-4 16.4M 1262 (MACs) 505K
Feb:Residential:Users 15.3M 1033 499KFeb:Residential:Others 1.11M 229 7.94K
Feb:Office Feb. 26 - Mar. 4 232M 8770 (IPs) 1.98MFeb:Office (filter) Feb. 26-27, Mar. 2-4 143M 8690 (MACs) 1.87M
Feb:Office:Users 118M 5986 1.52MFeb:Office:Others 25.0M 2704 158K
Jun:Residential Jun. 23 - Jun. 29 11.7M 345 (IPs) 140KJun:Residential (filter) Jun. 23-26, 29 6.22M 334 (MACs) 120K
Jun:Residential:Users 5.81M 204 116KJun:Residential:Others 408K 130 4.13K
Jun:Office Jun. 23 - Jun. 29 245M 8335 (IPs) 1.61MJun:Office (filter) Jun. 23-26, 29 133M 8286 (MACs) 1.52M
Jun:Office:Users 108M 5495 1.42MJun:Office:Others 25.0M 2791 63.1K
Table 1. Details of the datasets used in this study.
traces and logs we find a 0.6% and 1.8% loss rates in the Feb:Residential andFeb:Office datasets, respectively. We believe these losses are an artifact of ourmeasurement apparatus given that the loss rate is correlated with traffic volume.
Tracking Clients: We aim to track individual clients in the face of dynamicaddress assignment. Simultaneously with the DNS packet trace, we gather logsfrom the University’s three DHCP servers. Therefore, we can track DNS activitybased on MAC addresses. Note, we could not map 1.3% of the queries acrossour datasets to a MAC address because the source IP address in the query neverappears in the DHCP logs. These likely represent static IP address allocations.Further, without any DHCP assignments we are confident that these IPs repre-sent a single host.
Filtering Datasets: We find two anomalies that skew the data in ways that arenot indicative of user behavior. First, we find roughly 25% of the queries requestthe TXT record for debug.opendns.com. (The next most popular record repre-sents less than 1% of the lookups!) We find this query is not in response to users’actions, but is automatically issued to determine whether the client is using theOpenDNS resolver (indicated in the answer) [1]. We observe 298 clients queryingthis record, which we assume use OpenDNS on other networks or used OpenDNSin the past. We remove these queries from further analysis. The second anomalyinvolves 18 clients whose prominent behavior is to query for debug.opendns.comand other domains repeatedly without evidence of accomplishing much work.The campus information technology department verified that these clients servean operational purpose and are not user-facing devices. Therefore, we removethe 18 clients as they are likely unique to this network and do not representusers. We do not attempt to further filter misbehaving hosts—e.g., infected ormisconfigured hosts—as we consider them part of the DNS workload (e.g., sincea resolver would be required to cope with their requests).
Timeframe: To more directly compare residential and office settings we excludeSaturday and Sunday from our datasets.
Table 1 shows the magnitude of our filtering. We find commonality acrossthe partitions of the data, so we focus on the Feb:Residential:Users dataset forconciseness and discuss how other datasets differ as appropriate.

Marker Clients %All 1262 100%Google analytics 983 78%Search engine 1010 80%
Google 1006 80%Any other 602 48%
Gmail 881 70%LDAP Login 840 66%Any 1033 82%
Table 2. Feb:Residential clients that fit markers for general purpose devices.
3 Identifying Types of Clients
Since our focus is on characterizing general purpose user-facing devices, we aim toseparate them from other types of end systems. We expect general-purpose sys-tems are involved in tasks, such as (i) web browsing, (ii) accessing search engines,(iii) using email, and (iv) conducting institutional-specific tasks2. Therefore, wedevelop the following markers to identify general-purpose hosts:
Browsing: A large number of web sites embed Google Analytics [8] in theirpages, thus there is a high likelihood that regular users will query for GoogleAnalytics hostnames on occasion.
Searching: We detect web search activity via DNS queries for the largest searchengines: Google, Yahoo, Bing, AOL, Ask, DuckDuckGo, Altavista, Baidu,Lycos, Excite, Naver, and Yandex.
Email: CWRU uses Google to manage campus email and therefore we usequeries for “mail.google.com” to indicate email use.
Institutional-Specific Tasks: CWRU uses a single sign-on system for authen-ticating users before they perform a variety of tasks and therefore we usequeries for the corresponding hostname as indicative of user behavior.
Table 2 shows the breakdown of the clients in the Feb:Residential dataset.Of the 1,262 clients we identify 1,033 as user-facing based on at least one of theabove markers. Intuitively we expect that multiple markers likely apply to mostgeneral purpose systems and in fact we find at least two markers apply to 991 ofthe clients in our dataset. Results for our other datasets are similar.
We next turn to the 229 clients (≈ 18%) that do not match any of our mark-ers for user-facing clients. To better understand these clients we aggregate thembased on the vendor portion of their MAC addresses. First, we find a set of ven-dors and query streams that indicate special-purpose devices: (i) 48 Microsoftdevices that query for names within the xboxlive.com domain, which we concludeare Xbox gaming consoles, (ii) 33 Sony devices that query for names within theplaystation.net domain, which we conclude are Sony Playstation gaming con-soles, (iii) 16 Apple devices that have an average of 11K queries—representing96% of their lookups—for the apple.com domain, even though the average acrossall devices that lookup an apple.com name is 262 queries, which we concludeare Apple TV devices and (iv) 7 Linksys devices that issue queries for es-uds.usatech.com, which we conclude are transaction systems attached to thelaundry machines in the residence halls (!).
2 In our case, this is campus-life tasks, e.g., checking the course materials portal.

In addition to these, we find devices that we cannot pinpoint explicitly, butdo not in fact seem to be general-purpose client systems. We find 41 Dell devicesthat differ from the larger population of hosts in that they query for more PTRrecords than A records. A potential explanation is that these devices are serversobtaining hostnames for clients that connect to them (e.g., as part of sshd ’sverification steps or to log client connects). We also identify 12 Kyocera devicesthat issue queries for only the campus NTP and SMTP servers. We concludethat these are copy machines that also offer emailing of scanned documents.
For the IP addresses that do not appear in the DHCP logs (i.e., addressesstatically configured on the hosts), we cannot obtain a vendor ID. However, wenote that 97% of the queries and 96% of the unique domain names from thesemachines involve CWRU domains and therefore we conclude that they servesome administrative function and are not general purpose clients. The remaining61 devices are distributed among 42 hardware vendors. In the remainder of thepaper we will consider the general purpose clients (Users) and the special purposeclients (Others) separately, as we detail in Table 1. We find that our high-levelobservations hold across all of the Users datasets, and thus present results forthe Feb:Residential:Users dataset only.
4 Query Clusters
Applications often call for multiple DNS queries in rapid succession—e.g., as partof loading all objects on a web page, or prefetching names for links users mayclick. In this section, we quantify this behavior using the DBSCAN algorithm [4]to construct clusters of DNS queries that likely share an application event. TheDBSCAN algorithm uses two parameters to form clusters: a minimum clustersize M and a distance ε that controls the addition of samples to a cluster. Weuse the absolute difference in the query timestamps as the distance metric. Ourfirst task is to choose suitable parameters. Our strategy is to start with a rangeof parameters and determine whether there is a point of convergence where theresults of clustering do not change greatly with the parameters. Based on thestrategy in [4], we start with an M range of 3–6 and an ε range of 0.5–5 seconds—note that M = 2 simplifies to threshold based clustering, but does not producea point of convergence. We find that 96% of the clusters we identify with M = 6are exactly found when M = 3 and hence at M = 3 we have converged on areasonably stable answer which we use in the subsequent analysis. Additionally,we find that for ε ∈ [2.5, 5], the total number of clusters, the distribution ofcluster sizes, and the assignment of queries to clusters remain similar irrespectiveof ε value and therefore use ε = 2.5 seconds in our analysis. We define the firstDNS query per cluster as the root and all subsequent queries in the clusteras dependents. In the Feb:Residential:Users dataset, we find 1M clusters thatencompass 80% of the roughly 15M queries in the dataset.
To validate the clustering algorithm we first inspect the 67K unique host-names the algorithm labels as noise. We find a variety of hostnames with themost frequent being: WPAD [7] queries for discovering proxies, Google Mailand Google Docs, software update polling (e.g., McAfee and Symantec), heart-beat signals for gaming applications (e.g., Origin, Steam, Blizzard, Riot), video

0.0
0.1
0.2
0.3
0.4
0.5
0.6
0.7
0.8
0.9
1.0
1 10 100Count per metric (log scale)
CD
F p
er c
lust
er
SLDs Hostnames Queries
Fig. 1. Number of queries, hostnames,and SLDs per cluster.
0.0
0.1
0.2
0.3
0.4
0.5
0.6
0.7
0.8
0.9
1.0
0.1 1 10 100 1K 10KMean queries sent per day (log scale)
CD
F p
er c
lient
Feb:Residential:Others Feb:Residential:Users
Fig. 2. Queries issued by each client perday.
streaming (e.g., Netflix, YouTube, Twitch), and the Network Time Protocol(NTP). All of these names can intuitively come from applications that requireonly sporadic DNS queries, as they are either making quick checks every once ina while, or are using long-lived sessions that leverage DNS only when starting.
To validate the clusters themselves, we observe that there are frequently oc-curring roots. Indeed, the 1M clusters have only 72K unique roots, with the 100most frequently occurring roots accounting for 395K (40%) of the clusters. Fur-ther, the 100 most popular roots include popular web sites (e.g., www.facebook.com,www.google.com). These are the type of names we would expect to be roots inthe context of web browsing. Another common root is safebrowsing.google.com[9], a blacklist directory used by some web browsers to determine if a given website is safe to retrieve. This is a distinctly different type of root than a popularweb site because the root is not directly related to the dependents by the pagecontent, but rather via a process running on the clients. This in some sense meansSafeBrowsing-based clusters have two roots. While use of SafeBrowsing is fairlycommon in our dataset, we do not find additional prevalent cases of this “tworoots” phenomenon. From a modeling standpoint we have not yet determinedwhether “two roots” clusters would need special treatment.
Figure 1 shows the distribution of queries per cluster. While the major-ity of clusters are small, there are relatively few large clusters. We find that90% of clusters contain at most 26 queries for at most 22 hostnames. Addi-tionally, we find 90% of the clusters encompass at most 10 SLDs. The largestcluster spans 95 seconds and consists of 9,366 queries for names that matchto the 3rd level label. The second largest cluster consists of 6,211 queries formyapps.developer.ubuntu.com—which is likely a Ubuntu bug.
5 Query Timing
Next we tackle the question of when and how many queries clients issue. We beginwith the distribution of the average number of queries that clients issue per day,
0.0
0.1
0.2
0.3
0.4
0.5
0.6
0.7
0.8
0.9
1.0
0.001 0.01 0.1 1 10 100Inter−query time in seconds (log scale)
CD
F p
er in
ter−
quer
y tim
e
90% Aggregate
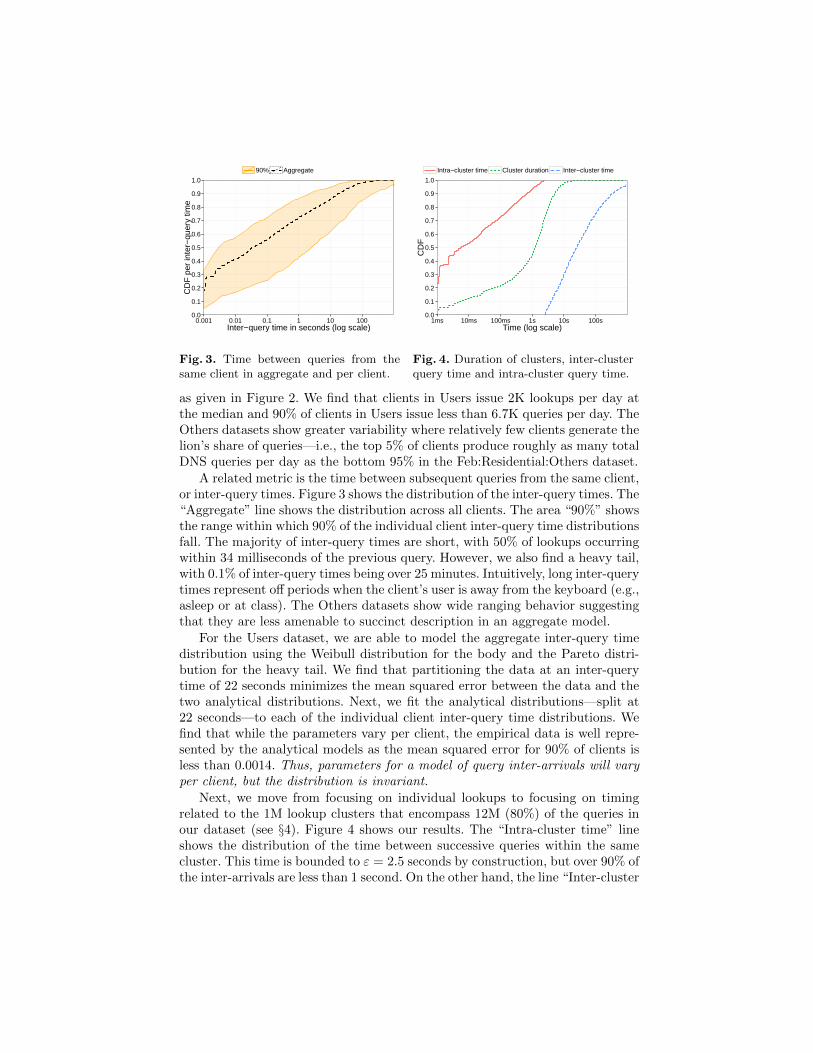
Fig. 3. Time between queries from thesame client in aggregate and per client.
0.0
0.1
0.2
0.3
0.4
0.5
0.6
0.7
0.8
0.9
1.0
1ms 10ms 100ms 1s 10s 100sTime (log scale)
CD
F
Intra−cluster time Cluster duration Inter−cluster time
Fig. 4. Duration of clusters, inter-clusterquery time and intra-cluster query time.
as given in Figure 2. We find that clients in Users issue 2K lookups per day atthe median and 90% of clients in Users issue less than 6.7K queries per day. TheOthers datasets show greater variability where relatively few clients generate thelion’s share of queries—i.e., the top 5% of clients produce roughly as many totalDNS queries per day as the bottom 95% in the Feb:Residential:Others dataset.
A related metric is the time between subsequent queries from the same client,or inter-query times. Figure 3 shows the distribution of the inter-query times. The“Aggregate” line shows the distribution across all clients. The area “90%” showsthe range within which 90% of the individual client inter-query time distributionsfall. The majority of inter-query times are short, with 50% of lookups occurringwithin 34 milliseconds of the previous query. However, we also find a heavy tail,with 0.1% of inter-query times being over 25 minutes. Intuitively, long inter-querytimes represent off periods when the client’s user is away from the keyboard (e.g.,asleep or at class). The Others datasets show wide ranging behavior suggestingthat they are less amenable to succinct description in an aggregate model.
For the Users dataset, we are able to model the aggregate inter-query timedistribution using the Weibull distribution for the body and the Pareto distri-bution for the heavy tail. We find that partitioning the data at an inter-querytime of 22 seconds minimizes the mean squared error between the data and thetwo analytical distributions. Next, we fit the analytical distributions—split at22 seconds—to each of the individual client inter-query time distributions. Wefind that while the parameters vary per client, the empirical data is well repre-sented by the analytical models as the mean squared error for 90% of clients isless than 0.0014. Thus, parameters for a model of query inter-arrivals will varyper client, but the distribution is invariant.
Next, we move from focusing on individual lookups to focusing on timingrelated to the 1M lookup clusters that encompass 12M (80%) of the queries inour dataset (see §4). Figure 4 shows our results. The “Intra-cluster time” lineshows the distribution of the time between successive queries within the samecluster. This time is bounded to ε = 2.5 seconds by construction, but over 90% ofthe inter-arrivals are less than 1 second. On the other hand, the line “Inter-cluster
1E−7
1E−6
1E−5
1E−4
1E−3
1E−2
1E−1
1E+0
1 10 100 1K 10K 100KIndex of name, sorted (log scale)
Fra
ctio
n of
tota
l que
ries
(log
scal
e)
90% Aggregate
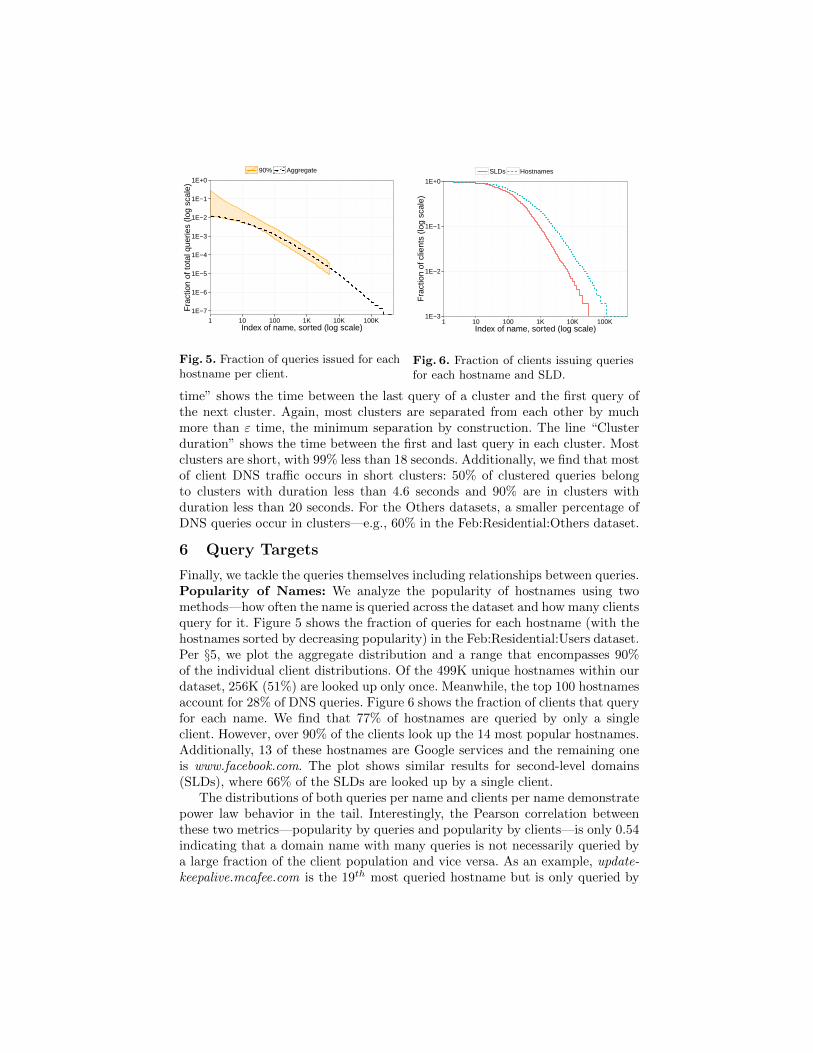
Fig. 5. Fraction of queries issued for eachhostname per client.
1E−3
1E−2
1E−1
1E+0
1 10 100 1K 10K 100KIndex of name, sorted (log scale)
Fra
ctio
n of
clie
nts
(log
scal
e)
SLDs Hostnames
Fig. 6. Fraction of clients issuing queriesfor each hostname and SLD.
time” shows the time between the last query of a cluster and the first query ofthe next cluster. Again, most clusters are separated from each other by muchmore than ε time, the minimum separation by construction. The line “Clusterduration” shows the time between the first and last query in each cluster. Mostclusters are short, with 99% less than 18 seconds. Additionally, we find that mostof client DNS traffic occurs in short clusters: 50% of clustered queries belongto clusters with duration less than 4.6 seconds and 90% are in clusters withduration less than 20 seconds. For the Others datasets, a smaller percentage ofDNS queries occur in clusters—e.g., 60% in the Feb:Residential:Others dataset.
6 Query Targets
Finally, we tackle the queries themselves including relationships between queries.Popularity of Names: We analyze the popularity of hostnames using twomethods—how often the name is queried across the dataset and how many clientsquery for it. Figure 5 shows the fraction of queries for each hostname (with thehostnames sorted by decreasing popularity) in the Feb:Residential:Users dataset.Per §5, we plot the aggregate distribution and a range that encompasses 90%of the individual client distributions. Of the 499K unique hostnames within ourdataset, 256K (51%) are looked up only once. Meanwhile, the top 100 hostnamesaccount for 28% of DNS queries. Figure 6 shows the fraction of clients that queryfor each name. We find that 77% of hostnames are queried by only a singleclient. However, over 90% of the clients look up the 14 most popular hostnames.Additionally, 13 of these hostnames are Google services and the remaining oneis www.facebook.com. The plot shows similar results for second-level domains(SLDs), where 66% of the SLDs are looked up by a single client.
The distributions of both queries per name and clients per name demonstratepower law behavior in the tail. Interestingly, the Pearson correlation betweenthese two metrics—popularity by queries and popularity by clients—is only 0.54indicating that a domain name with many queries is not necessarily queried bya large fraction of the client population and vice versa. As an example, update-keepalive.mcafee.com is the 19th most queried hostname but is only queried by

8.1% of the clients. At the same time, 55% of the clients query for s2.symcb.com,but in terms of total queries this hostname ranks as only the 1215th most pop-ular. This phenomenon may be partially explained by differences in TTL. Therecord for s2.symcb.com has a one hour TTL—limiting the query frequency.Meanwhile, updatekeepalive.mcafee.com has a 1 minute TTL. Given this shortTTL and that the name implies polling activity, the large numbers of queriesfrom a given client is unsurprising. Thus, a model of DNS client behavior mustaccount for the popularity of hostnames in terms of both queries and clients.
The heavy tails of the popularity distributions represent a large fraction ofDNS transactions. However, we cannot disregard unpopular names—even thosequeried just once—because together they are responsible for the majority of DNSactivity therefore impacting the entire DNS ecosystem (e.g., cache behavior).
Co-occurrence Name Relationships: In addition to understanding popular-ity, we next assess the relationships between names, as these have implicationson how to model client behavior. The crucial relationship between two namesthat we seek to quantify is frequent querying for the pair together. We beginwith the request clusters (§4) and leverage the intuition that the first querywithin a cluster triggers the subsequent queries in the cluster and is thereforethe root lookup. This follows from the structure of modern web pages, with acontainer page calling for additional objects from a variety of servers—e.g., anaverage web page uses objects from 16 different hostnames [10].
Finding co-occurrence is complicated due to client caching. That is, we cannotexpect to see the entire set of dependent lookups each time we observe someroot lookup. Our methodology for detecting co-occurrence is as follows. First, wedefine clusters(r) as the number of clusters with r as the root across our datasetand pairs(r, d) as the number of clusters with root r that include dependentd. Second, we limit our analysis to the case when clusters(r) ≥ 10 to reducethe potential for false positive relationships based on too few samples. In theFeb:Residential:Users dataset, we find 7.1K (9.9%) of the clusters meet thesecriteria. Within these clusters we find 7.5M dependent queries and 2.2M unique(r, d) pairs. Third, for each pair (r, d), we compute the co-occurrence as C =pairs(r, d)/clusters(r)—i.e., the fraction of the clusters with root r that included. Co-occurrence of most pairs is low with 2.0M (93%) pairs having a C muchless than 0.1. We focus on the 78K pairs that have high C—greater than 0.2.These pairs include 98% of the roots we identify, i.e., nearly all roots have at leastone dependent with which they co-occur frequently. Also, these pairs comprise28% of the 7.5M dependent queries we study.
We note that intuitively dependent names could be expected to share labelswith their roots—e.g., www.facebook.com and star.c10r.facebook.com—and thiscould be a further way to assess co-occurrence. However, we find that only 27%of the pairs within clusters with co-occurrence of at least 0.2 share the same SLDand 11% share the 3rd level label as the cluster root. This suggests that whilenot rare, counting on co-occurring names to be from the same zone to buildclusters is dubious. As an extreme example, Google Analytics is a dependent of1,049 unique cluster roots, most of which are not Google names.

0.0
0.1
0.2
0.3
0.4
0.5
0.6
0.7
0.8
0.9
1.0
0.0 0.1 0.2 0.3 0.4 0.5 0.6 0.7 0.8 0.9 1.0Min cos similarity for same client on consecutive days
CD
F p
er c
lient
Hostnames SLDs
Fig. 7. Cosine similarity between thequery vectors for the same client.
0.0
0.1
0.2
0.3
0.4
0.5
0.6
0.7
0.8
0.9
1.0
0.0 0.1 0.2 0.3 0.4 0.5 0.6 0.7 0.8 0.9 1.0Max cos similarity between clients for any day(s)
CD
F p
er c
lient
pai
r
Hostnames SLDs
Fig. 8. Cosine similarity between thequery vectors for different clients.
Finally, we cannot test the majority of the clusters and pairs for co-occurrencebecause of limited samples. However, we hypothesize that our results apply toall clusters. We note that the distribution of the number of queries per cluster inFigure 1 is similar to the distribution of the number of dependents per root wherethe co-occurrence fraction is greater than 0.2. Combining our observations that80% of queries occur in clusters, 28% of the dependent queries within clustershave high co-occurrence with the root, and the average cluster has 1 root and10 dependents, we estimate that at a minimum 80 ∗ 0.28 ∗ 10/11 = 20% of DNSqueries are driven by co-occurrence relationships. We conclude that co-occurrencerelationships are common, though the relationships do not always manifest asrequests on the wire due to caching.
Temporal Locality: We next explore how the set of names a client querieschanges over time. As a foundation, we construct a vector Vc,d for each client cand each day d in our dataset, which represents the fraction of lookups for eachname we observe in our dataset. Specifically, we start from an alphabeticallyordered list of all hostnames looked up across all clients in our dataset, N . Weinitially set each Vc,d to a vector of |N | zeros. We then iterate through N andset the corresponding position in each Vc,d as the total number of queries clientc issues for name Ni on day d divided by the total number of queries c issues onday d. Thus, an example Vc,d would be < 0, 0.25, 0, 0.5, 0.25 > in the case wherethere are five total names in the dataset and on day d the client queries for thesecond name once, the fourth name twice and the fifth name once. We repeatthis process using only the SLDs from each query, as well.
We first investigate whether clients’ queries tend to remain stable across daysin the dataset. For this, we compute the minimum cosine similarity of the queryvectors for each client across all pairs of consecutive days. Figure 7 shows thedistribution of minimum cosine similarity per client in the Feb:Residential:Usersdataset. In general, the cosine similarity values are high—greater than 0.5 for80% of clients for unique hostnames—indicating that clients query for a similarset of names in similar relative frequencies across days. Given this result, it isunsurprising that the figure also shows high similarity across SLDs.
0.0
0.1
0.2
0.3
0.4
0.5
0.6
0.7
0.8
0.9
1.0
1 10 100 1K 10KMean names queried per day (log scale)
CD
F p
er c
lient
SLDs Hostnames
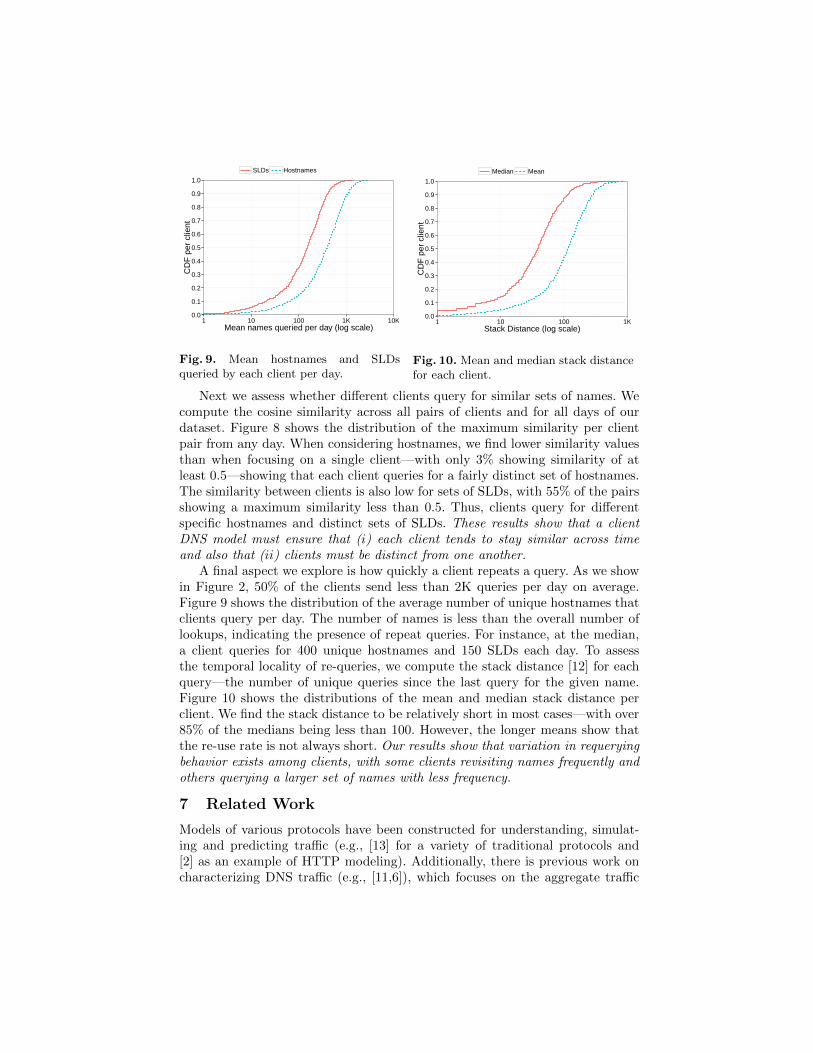
Fig. 9. Mean hostnames and SLDsqueried by each client per day.
0.0
0.1
0.2
0.3
0.4
0.5
0.6
0.7
0.8
0.9
1.0
1 10 100 1KStack Distance (log scale)
CD
F p
er c
lient
Median Mean
Fig. 10. Mean and median stack distancefor each client.
Next we assess whether different clients query for similar sets of names. Wecompute the cosine similarity across all pairs of clients and for all days of ourdataset. Figure 8 shows the distribution of the maximum similarity per clientpair from any day. When considering hostnames, we find lower similarity valuesthan when focusing on a single client—with only 3% showing similarity of atleast 0.5—showing that each client queries for a fairly distinct set of hostnames.The similarity between clients is also low for sets of SLDs, with 55% of the pairsshowing a maximum similarity less than 0.5. Thus, clients query for differentspecific hostnames and distinct sets of SLDs. These results show that a clientDNS model must ensure that (i) each client tends to stay similar across timeand also that (ii) clients must be distinct from one another.
A final aspect we explore is how quickly a client repeats a query. As we showin Figure 2, 50% of the clients send less than 2K queries per day on average.Figure 9 shows the distribution of the average number of unique hostnames thatclients query per day. The number of names is less than the overall number oflookups, indicating the presence of repeat queries. For instance, at the median,a client queries for 400 unique hostnames and 150 SLDs each day. To assessthe temporal locality of re-queries, we compute the stack distance [12] for eachquery—the number of unique queries since the last query for the given name.Figure 10 shows the distributions of the mean and median stack distance perclient. We find the stack distance to be relatively short in most cases—with over85% of the medians being less than 100. However, the longer means show thatthe re-use rate is not always short. Our results show that variation in requeryingbehavior exists among clients, with some clients revisiting names frequently andothers querying a larger set of names with less frequency.
7 Related Work
Models of various protocols have been constructed for understanding, simulat-ing and predicting traffic (e.g., [13] for a variety of traditional protocols and[2] as an example of HTTP modeling). Additionally, there is previous work oncharacterizing DNS traffic (e.g., [11,6]), which focuses on the aggregate traffic

of a population of clients, in contrast to our focus on individual clients. Finally,we note—as we discuss in §1—that several recent studies involving DNS makeassumptions about the behavior of individual clients or need to analyze data forspecific information before proceeding. For instance, the authors of [5] modelDNS hierarchical cache performance using an analytical arrival process, while in[14], the authors use simulation to explore changes to the resolution path. Bothstudies would benefit from a greater understanding of DNS client behavior.
8 Conclusion
This work is an initial step towards richly understanding individual DNS clientbehavior. We characterize client behavior in ways that will ultimately inform ananalytical model. We find that different types of clients interact with the DNSin distinct ways. Further, DNS queries often occur in short clusters of relatednames. As a step towards an analytical model, we show that the client queryarrival process is well modeled by a combination of the Weibull and Paretodistributions. In addition, we find that clients have a “working set” of namesthat is both fairly stable over time and fairly distinct from other clients. Fi-nally, our high-level results hold across both time and qualitatively different userpopulations—student residential vs. University office. This is an initial indicationthat the broad properties we illuminate hold the promise to be invariants.
References1. OpenDNS. http://www.opendns.com/.2. P. Barford and M. Crovella. Generating Representative Web Workloads for Net-
work and Server Performance Evaluation. In ACM SIGMETRICS, 1998.3. T. Callahan, M. Allman, and M. Rabinovich. On Modern DNS Behavior and
Properties. ACM SIGCOMM Computer Communication Review, July 2013.4. M. Ester, H.-P. Kriegel, J. Sander, and X. Xu. A Density-Based Algorithm for
Discovering Clusters in Large Spatial Databases with Noise. In AAAI InternationalConference on Knowledge Discovery and Data Mining, 1996.
5. N. C. Fofack and S. Alouf. Modeling Modern DNS Caches. In ACM InternationalConference on Performance Evaluation Methodologies and Tools, 2013.
6. H. Gao, V. Yegneswaran, Y. Chen, et al. An Empirical Re-examination of GlobalDNS Behavior. In ACM SIGCOMM, 2013.
7. P. Gauthier, J. Cohen, and M. Dunsmuir. The Web Proxy Auto-Discovery Pro-tocol. IETF Internet Draft. https://tools.ietf.org/html/draft-ietf-wrec-
wpad-01 (work in progress), 1999.8. Websites Using Google Analytics. http://trends.builtwith.com/analytics/
Google-Analytics.9. Google Safe Browsing. https://developers.google.com/safe-browsing.
10. HTTP Archive. http://httparchive.org.11. J. Jung, A. W. Berger, and H. Balakrishnan. Modeling TTL-Based Internet Caches.
In IEEE International Conference on Computer Communications, 2003.12. R. L. Mattson, J. Gecsei, D. R. Slutz, and I. L. Traiger. Evaluation Techniques for
Storage Hierarchies. IBM Systems Journal, 1970.13. V. Paxson. Empirically Derived Analytic Models of Wide-Area TCP Connections.
IEEE/ACM Transactions on Networking, 1994.14. K. Schomp, M. Allman, and M. Rabinovich. DNS Resolvers Considered Harmful.
In ACM Workshop on Hot Topics in Networks, 2014.