toward objective quantification of perfusion- weighted ... · diagnostic test in this unstable...
TRANSCRIPT

Toward Objective Quantification of Perfusion-weighted Computed Tomography in Subarachnoid
Hemorrhage: Quantification of Symmetry andAutomated Delineation of Vascular Territories1
Celina Imielinska, PhD, Xin Liu, MD, MS, Joel Rosiene, PhD, Michael E., Sughrue, BS, Ricardo J. Komotar, MD,J. Mocco, MD, Evan R. Ransom, BA, Angela Lignelli, MD, Brad E. Zacharia, BS, E. Sander Connolly, Jr, MD,
Anthony L. D=Ambrosio, MD
Rationale and Objectives. Perfusion-weighted computed tomography (CTP) is a relatively recent innovation that esti-mates a value for cerebral blood flow (CBF) using a series of axial head CT images tracking the time course of a signalfrom an intravenous contrast bolus.
Materials and Methods. CTP images were obtained using a standard imaging protocol and were analyzed using commer-cially available software. A novel computer-based method was used for objective quantification of side-to-side asymme-tries of CBF values calculated from CTP images.
Results. Our method corrects for the inherent variability of the CTP methodology seen in the subarachnoid hemorrhage(SAH) patient population to potentially aid in the diagnosis of cerebral vasospasm (CVS). This method analyzes andquantifies side-to-side asymmetry of CBF and presents relative differences in a construct termed a Relative DifferenceMap (RDM). To further automate this process, we have developed a unique methodology that enables a computer to de-lineate vascular territories within a brain image, regardless of the size and shape of the brain.
Conclusions. While both the quantification of image symmetry using RDMs and the automated assignment of vascular territo-ries were initially designed for the analysis of CTP images, it is likely that they will be useful in a variety of applications.
Key Words . CT; brain; perfusion; cerebral blood flow; aneurysmal subarachnoid hemorrhage; ischemic stroke© AUR, 2005
Stroke is the third leading cause of death and disabilityin contemporary society. Subarachnoid hemorrhage(SAH) accounts for approximately 6% to 8% of all
Acad Radiol 2005; 12:874–887
1 From the Departments of Biomedical Informatics (C.I., X.L.), ComputerScience (C.I.), Neurological Surgery (M.S., R.K., J.M., E.R., B.Z., E.S., A.D.)and Neuroradiology (A.L.), Columbia University, New York, NY, USA; andthe Department of Mathematics and Computer Science, Eastern Connecti-cut State University, CT (J.R.) Received March 16, 2005; revision receivedMarch 16; revision accepted March 31. Address correspondence to C.I.e-mail: [email protected]
©
AUR, 2005doi:10.1016/j.acra.2005.03.074874
strokes and 22% to 25% of cerebrovascular deaths. Be-tween 1 million and 12 million people in the UnitedStates harbor intracranial aneurysms, and the annualprevalence of aneurysmal SAH (aSAH) in this countryis believed to be in excess of 30,000 persons. Despiteconsiderable advances in the diagnosis and treatment ofSAH, the outcome remains poor [1,2]. The presence ofsubarachnoid blood is sufficient to produce severe lu-minal narrowing of cerebral arteries. This process iscalled cerebral vasospasm (CVS). However, the pri-mary mechanism for vasospasm is uncertain, and there-
fore, any patient with SAH is considered to be at risk
Academic Radiology, Vol 12, No 7, July 2005 CT PERFUSION IN SUBARACHNOID HEMORRHAGE
for developing CVS [3,4]. Rapid diagnosis and treat-ment of CVS pose a true clinical dilemma, and thelack of reliably predictive tests often leads to delayedintervention and irreversible neurological injury [5].Developing a noninvasive, reliable, and sensitive testthat could risk-stratify patients for CVS during the firstdays of their hospital admission into high-, medium-,and low-risk populations would be of immense benefitfor patients and could potentially decrease health carecosts.
Perfusion-weighted computed tomography (CTP) is arelatively recent innovation that utilizes a series of axialhead CT images to track the time course of a signal froman administered bolus of intravenous contrast [6,8]. Theseimages are then processed using either deconvolution ormaximum slope algorithms to extrapolate a numericalvalue for cerebral blood flow (CBF) [9,18,19]. While “bo-lus tracking” methods may provide accurate quantificationof CBF under controlled conditions, variability in cardiacfunction, systemic blood pressure, and cerebrovasculartone often seen in the setting of acute SAH makes quanti-tative and qualitative assessment of these studies bothdifficult and potentially hazardous [7–12].
Although CTP has found some utility in the diagno-sis and management of ischemic stroke, its potentialuse in the diagnosis and management of delayed CVShas not been investigated. Furthermore, since this im-aging study is both fast and noninvasive, it is an idealdiagnostic test in this unstable patient population. Un-fortunately, due to the inherent variability describedabove, there is no currently accepted, standardizedmethod of interpreting these scans. Most commonly,scans are interpreted using the qualitative detection ofgross side-to-side asymmetry of CBF, an approach thatlends itself to misdiagnosis and potential failure totreat CVS. Recent work with CTP has focused on thedevelopment of methods to quantitatively analyze CTPimages. Most of these approaches utilize the region ofinterest (ROI) method [11,13]. In this approach, theclinician circles an ROI on the post-processed CTPimage, and the mean CBF is compared to that of thecorresponding ROI in the contralateral hemisphere todetect asymmetry. A growing body of data supportsimproved safety and efficacy of this approach in thesetting of acute ischemic stroke, though data for SAHis less complete.
We have developed a novel algorithm for analyzingpost-processed CTP images obtained from a standard per-
fusion CT software package (Siemens Medical Solutions,Malvern, PA). This method converts CBF values, whichmust be viewed as meaningless outside of the context ofa given scan, to relative “difference,” which representsside-to-side asymmetry and is a meaningful value as it isspecific to a given scan. This conversion is performed bycomparing a small region of the scan to the correspondingregion in the contralateral hemisphere, quantifying thedegree of relative difference, and representing this quan-tity of relative difference in 2D and 3D in a construct wetermed a Relative Difference Map (RDM). We analyzeand quantify the amount of “relative difference” in bothbrain hemispheres and the 6 major vascular territories toassess the degree of hypoperfusion in the regions. Themethod is automated and has the potential to provide abetter and more stable analysis of the perfusion parame-ters of SAH patients.
MATERIALS AND METHODS
Patient Population and Image SelectionBetween 1996 and 2003, all patients presenting to New
York Presbyterian Hospital following SAH resulting fromthe rupture of an angiographically confirmed intracranialaneurysm were prospectively enrolled in the SAH Out-comes Project (SHOP), an IRB-approved project in whichextensive clinical and long-term health outcomes datawere collected on all patients.
CTP studies were performed by the treating physiciansas part of routine management. During a 2-year period(July 2001 to July 2003), 122 CTP scans were performedin 85 patients in SHOP. Digital Imaging and Communica-tions in Medicine (DICOM) images from these patientswere collected retrospectively, processed by a neuroradi-ologist, and selected for this analysis. Unusable scanswere excluded on the basis of having poor tissue en-hancement curves. All images of SAH patients weretaken from this cohort.
Based on the assumptions described below, we ex-cluded patients with significant midline shift from focalhematoma, hydrocephalus, or focal cerebral edema. Fu-ture work will focus on automatically identifying the mid-line in a curvilinear fashion to correct for possible struc-tural asymmetries.
Premises and AssumptionsFor our analysis, we made the following assumptions:
(1) In normal cases, the axial CT images of the left and
right hemispheres are structurally symmetric and compa-875

IMIELINSKA ET AL Academic Radiology, Vol 12, No 7, July 2005
rable, and there should be no more than minor side-to-side differences in relative blood flow between the 2hemispheres; (2) In abnormal cases, the left and righthemispheres are still structurally symmetric and compara-ble, but there is a significant relative blood flow differ-ence between the 2 hemispheres; this can be detected us-ing CTP images.
Preliminary Work: The Relative Difference Map(RDM) as a Measure of Asymmetry
Original color DICOM images (Fig. 1a) were trans-formed into 8-bit binary format, where the color scales inthe original images are normalized into the scale rangingfrom 0 to 255 (Fig. 1b). Using our stated assumptions, astraight line representing the image midline (an axis ofsymmetry) was drawn by hand along the anterior–poste-rior axis through the septum pelucidum to equally dividethe brain into 2 symmetric hemispheres. For quantifica-tion of symmetry 2 9 x 9 windows are constructed inboth brain hemispheres that visit the opposite regionspixel-by-pixel in a scan-line fashion. Centered at apixel location at its 9 x 9 window is compared to itssister window in the opposite hemisphere, around theconstructed axis of symmetry. The Kolmogorov-Smirnovtest [14] is applied to find the greatest statistical discrep-ancy between the observed and expected cumulative fre-quencies between 2 populations. The average intensitiesof pixels in the window from one hemisphere are sub-tracted from those of the contralateral hemisphere, and
Figure 1. Relative difference map for CBF: (a) CBF image displaymidline, (c) output RDM.
the absolute difference is divided by the intensity value
876
on the side where CBF reading is relatively larger (“rela-tively normal hemisphere”). The result is displayed on theside where the reading of the mirrored window is smaller(“relatively abnormal hemisphere”) to display the scorefor relative difference map (Fig. 1c). While the data inthis figure utilizes CBF data, an identical method can beused to quantify the cerebral blood volume (CBV), andan inverse method can be used to quantify the time topeak (TTP) parameter.
The resulting RDM is then subdivided by hand intothe 6 major cerebrovascular territories, and regional histo-grams are calculated for each territory. Figure 2 repre-sents a hypothetical distribution of histograms of regionsin the RDMs computed for CBF. These curves representthe conceptual basis behind our algorithm. We hypothe-size that in disease states, “difference” will cluster in af-
y Siemens’ perfusion software; (b) CT input CBF with selected
Figure 2. Hypothesized regional histograms quantified from rela-tive difference maps (RDM) of normal patients; patients with in-creased vasospasm risk; angiographic vasospasm; and ischemic
ed b
stroke.

Academic Radiology, Vol 12, No 7, July 2005 CT PERFUSION IN SUBARACHNOID HEMORRHAGE
fected territories, and will skew the regional histogram tothe right in “problem areas.”
Toward a Fully Automated System forQuantification of CTP
While our original method appeared promising, its de-pendence on a significant degree of user input limited itspotential in that it was entirely dependent on subjectivedetermination of the axis of symmetry and delineation ofcerebrovascular territories. Thus, minor intra-observervariations could potentially cause significant alteration inthe data provided by RDMs. As well, the method wasvery time consuming and not feasible to use in a clinicalsetting.
Thus, we sought to develop a methodology by whichRDMs could be generated with minimal user input. Thispresented a particular challenge in the SAH population asCTPs were obtained from brains of differing sizes andshapes, with varying degrees of minor distortion of corti-cal surface anatomy caused by extracerebral masses, spe-cifically postoperative pneumocephalus, or small amountsof subarachnoid blood. While such blood and air can besegmented out and do not appear in the postprocessedimage, minor distortions of brain shape are very commonin the SAH population and present a special difficulty inour attempt to design automated systems for assessingsymmetry.
The method described herein addresses this problemand can be roughly summarized in 4 key steps:
(a) Computation of axis of symmetry of an inputCBF image and re-orientation of the image in up-right position, if necessary.
(b) Computation of unwrapped image.(c) Computation of RDM using the assigned axis of
symmetry and 9 x 9 window difference calcula-tion on the unwrapped image. Resampling of databack onto the original dataset.
(d) Registration of 6 vascular territories using genericangles and computation of a histogram for eachterritory.
Automated Determination of the Axis ofSymmetry
Computation of axis of symmetry in an irregular 2Dimage is a multistep process which we perform in thismethod using the following processes: (a) computationof the convex hull of the anatomical region (ie, an out-
line of a brain region); (b) computation of centroidsfrom which the axis of symmetry is derived; (c) un-wrapping of the image onto a rectangular stretcher withthe axis of symmetry as a vertical midline, to poten-tially calibrate selection of the axis using underlyingimage information.
Computation of the Convex HullA 2D region is convex if a line segment between any
2 points in the region is inside that region. A convex hullof a 2D shape is the smallest convex region that fullyencloses the shape. There are standard techniques to com-pute a convex hull for a set of points in 2D by first con-structing a star-shaped polygon [15] as illustrated in Fig-ure 3. Because our images consist of digital pixels, wefirst devised a method that can sweep a 2D digital imagefrom a centroid point by visiting each pixel and generat-ing a star-shaped polygon that allows quick and easycomputation of the convex hull.
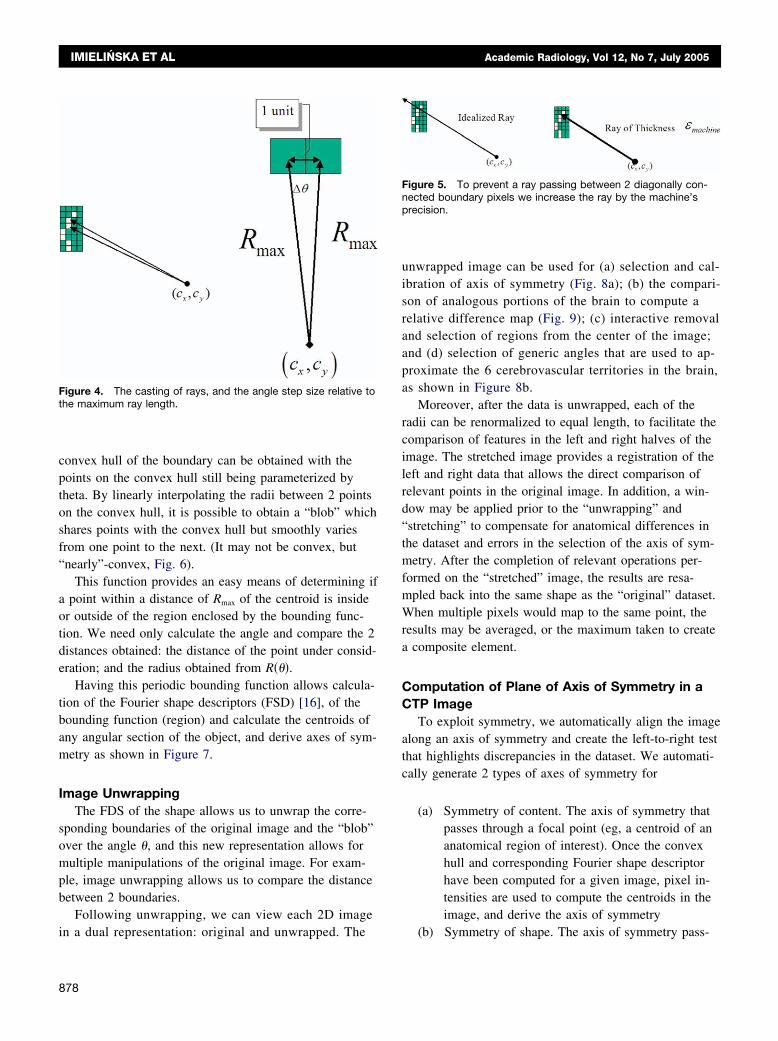
Computation of Fourier Shape Descriptor UsingRay Casting: Determination of BoundingFunctions of Theta
For a given 2D digital image, to obtain a boundaryfunction for a region in the image described by points onthe outermost edge of the region, we cast rays from thecentroid �cx,cy� of the region outward at specific increas-ing angles, �. To obtain a valid sampling, we increased
theta at each step by a �� � sin�1� 1
2Rmax� as indicated in
Figure 4, some rays may pass through a singularity in theboundary, meaning that it is possible that a ray will passbetween 2 boundary pixels that are diagonally connected.To prevent this we can make the ray have a thickness onthe order of the precision of the machine (Fig. 5).
By recording the length of the ray at each angle, wehave a description of a bounding function R��� of the re-gion as a function of �. This function may not have desir-
Figure 3. Computation of convex hull (CH) from a set of pointsin 2D: (a) input, (b) sorting, (c) star-shaped polygon and its con-vex hull.
able properties; for example, it may not be convex.The
877
IMIELINSKA ET AL Academic Radiology, Vol 12, No 7, July 2005
convex hull of the boundary can be obtained with thepoints on the convex hull still being parameterized bytheta. By linearly interpolating the radii between 2 pointson the convex hull, it is possible to obtain a “blob” whichshares points with the convex hull but smoothly variesfrom one point to the next. (It may not be convex, but“nearly”-convex, Fig. 6).
This function provides an easy means of determining ifa point within a distance of Rmax of the centroid is insideor outside of the region enclosed by the bounding func-tion. We need only calculate the angle and compare the 2distances obtained: the distance of the point under consid-eration; and the radius obtained from R���.
Having this periodic bounding function allows calcula-tion of the Fourier shape descriptors (FSD) [16], of thebounding function (region) and calculate the centroids ofany angular section of the object, and derive axes of sym-metry as shown in Figure 7.
Image UnwrappingThe FDS of the shape allows us to unwrap the corre-
sponding boundaries of the original image and the “blob”over the angle �, and this new representation allows formultiple manipulations of the original image. For exam-ple, image unwrapping allows us to compare the distancebetween 2 boundaries.
Following unwrapping, we can view each 2D image
Figure 4. The casting of rays, and the angle step size relative tothe maximum ray length.
in a dual representation: original and unwrapped. The
878
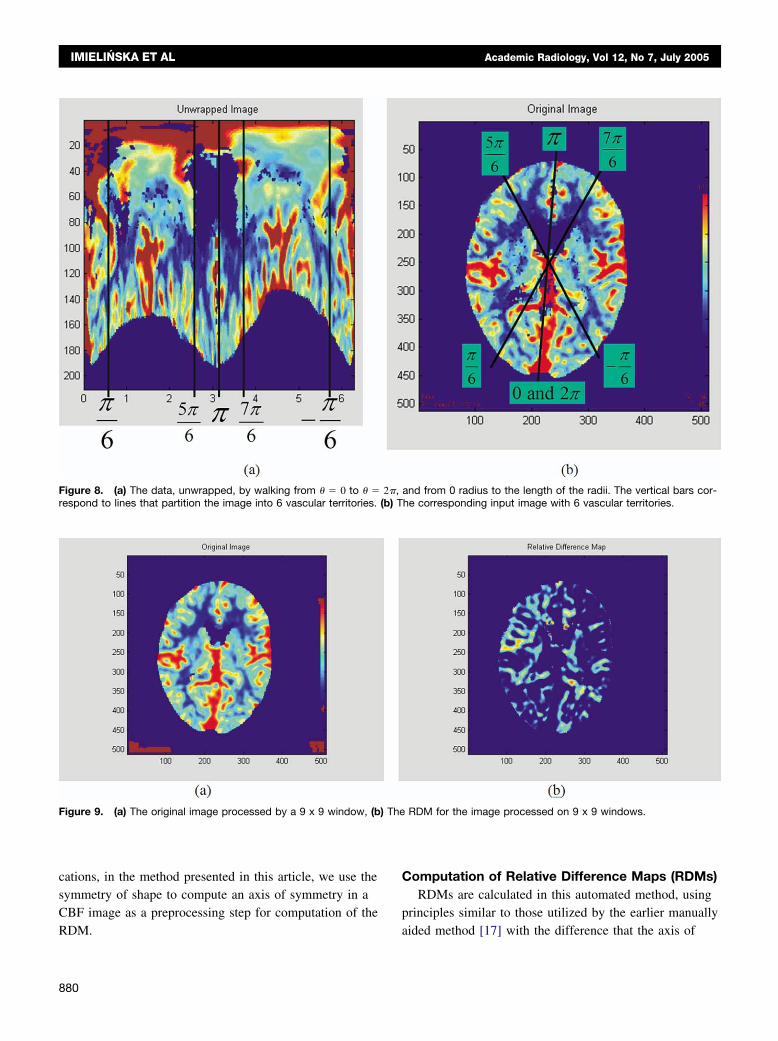
unwrapped image can be used for (a) selection and cal-ibration of axis of symmetry (Fig. 8a); (b) the compari-son of analogous portions of the brain to compute arelative difference map (Fig. 9); (c) interactive removaland selection of regions from the center of the image;and (d) selection of generic angles that are used to ap-proximate the 6 cerebrovascular territories in the brain,as shown in Figure 8b.
Moreover, after the data is unwrapped, each of theradii can be renormalized to equal length, to facilitate thecomparison of features in the left and right halves of theimage. The stretched image provides a registration of theleft and right data that allows the direct comparison ofrelevant points in the original image. In addition, a win-dow may be applied prior to the “unwrapping” and“stretching” to compensate for anatomical differences inthe dataset and errors in the selection of the axis of sym-metry. After the completion of relevant operations per-formed on the “stretched” image, the results are resa-mpled back into the same shape as the “original” dataset.When multiple pixels would map to the same point, theresults may be averaged, or the maximum taken to createa composite element.
Computation of Plane of Axis of Symmetry in aCTP Image
To exploit symmetry, we automatically align the imagealong an axis of symmetry and create the left-to-right testthat highlights discrepancies in the dataset. We automati-cally generate 2 types of axes of symmetry for
(a) Symmetry of content. The axis of symmetry thatpasses through a focal point (eg, a centroid of ananatomical region of interest). Once the convexhull and corresponding Fourier shape descriptorhave been computed for a given image, pixel in-tensities are used to compute the centroids in theimage, and derive the axis of symmetry
Figure 5. To prevent a ray passing between 2 diagonally con-nected boundary pixels we increase the ray by the machine’sprecision.
(b) Symmetry of shape. The axis of symmetry pass-

Academic Radiology, Vol 12, No 7, July 2005 CT PERFUSION IN SUBARACHNOID HEMORRHAGE
ing through the centroid of the unwrapped dataset.The perfusion-weighted image is unwrapped ontoa rectangular stretcher with the axis of symmetry
Figure 6. Convex hull and the blob: (a) The black line bounding the imconvex hull, and the black asterisks are the centroids of the 4 quadrants
Figure 7. Axis of symmetry: (a) An input image and (b) 4 quadranaxes of symmetry.
as a vertical line in the middle. The symmetry
axis is adjusted by finding the indentation point inthe unwrapped stretched image.
s the convex hull, the outermost yellow line is a blob which contains theblob. (b) A closeup view of the convex hull and the blob.
rived from the centroids computed of the blob (FDS) that yield
age i
of thets de
While the symmetry of content is useful in other appli-
879
(b) T
) The
IMIELINSKA ET AL Academic Radiology, Vol 12, No 7, July 2005
cations, in the method presented in this article, we use thesymmetry of shape to compute an axis of symmetry in aCBF image as a preprocessing step for computation of the
Figure 8. (a) The data, unwrapped, by walking from � � 0 to � �respond to lines that partition the image into 6 vascular territories.
Figure 9. (a) The original image processed by a 9 x 9 window, (b
RDM.
880
Computation of Relative Difference Maps (RDMs)RDMs are calculated in this automated method, using
principles similar to those utilized by the earlier manually
and from 0 radius to the length of the radii. The vertical bars cor-he corresponding input image with 6 vascular territories.
RDM for the image processed on 9 x 9 windows.
2�,
aided method [17] with the difference that the axis of

Academic Radiology, Vol 12, No 7, July 2005 CT PERFUSION IN SUBARACHNOID HEMORRHAGE
symmetry is computed automatically. Given an input im-age and its unwrapped representation with the axis ofsymmetry, we compute the RDM (Fig. 9). From the un-wrapped representation of the RDM we derive left andright hemispheres.
Automated Registration of CerebrovascularTerritories.
Because the most relevant application of CBF quan-tification is the determination of regional CBFs in the 6major vascular territories of the brain (anterior cerebralartery [ACA], middle cerebral artery [MCA], and pos-terior cerebral artery [PCA] territories in the left andright hemispheres), we sought to develop an automatedmethod for dividing brain images into these territoriesso that each region could be analyzed independently.Achieving this task is difficult for 2 principle reasons.First, the territories are irregularly shaped. Second, theterritories differ greatly in both shape and size. Sincethe results of our quantified method are presented ashistograms of the RDM values in each of the vascularterritories, and the geometric and statistical features ofthe histograms are to be used for clinical interpretationof patients with SAH, we believe that defining generic,simplified, estimated vascular territories might be agood first approach to automation of the process.
In our preliminary results we delineated the vascularterritories using anatomical landmarks that were opera-tor-dependent and time consuming. Because of theseinherent limitations to the manual method, we soughtto develop a method for automatically dividing thebrain tissue into generic vascular territories in a repro-ducible and reliable way. The advantages of such anautomated tool in the clinical setting are obvious, asthis is the way the brain is conceptually divided byclinicians treating patients with suspected or knownbrain ischemia.
In Figure 8 we outline the steps of this method.Briefly, this method uses an unwrapped input CBF im-age to roughly divide the brain into generic territoriesusing estimated angles that roughly estimate the ACA,MCA, and PCA territories. These sub-divisions arethen mapped into a corresponding RDM image. This isachieved (Fig. 8a) by walking from � � 0 to � � 2�,and from radius 0 to the length of 2 radii, defining ver-tical bars corresponding to the lines that partition theunwrapped image into 6 vascular territories. The angles
that we have found best estimate the territories are: (a)right posterior cerebral artery at � � �0,�
6�, (b) right
middle cerebral artery at � � ��
6,
5
6��, (c) right ante-
rior cerebral artery at � � �5
6�, ��, (d) left anterior
cerebral artery at � � ��,7
6��, (e) left middle cere-
bral artery at � � �7
6�, �
�
6�, (f) right posterior cere-
bral artery at � � � ��
6, 0�. When mapped into the
original image (Figure 8b), the wedge-shaped vascularterritories are defined by these generic angles, and plot-ting the relative difference values for all the pixelswithin each territory generates the RDM histogram.
RESULTS
Preliminary Results: RDMs With ManualDemarcation of the Axis of Symmetry and theVascular Territories
Our preliminary results were encouraging and sug-gested the potential promise of the RDM method forcharacterizing asymmetry in CTP images. The 3 illustra-tive cases described below were selected because theyrepresent the spectrum of potential CBF alterations. Theimages are presented as RDMs processed from CBFmaps. Data for Patient 2 were kindly provided by Dr.Tomandl, Dept. of Neuroradiology, University of Erlan-gen-Nuremberg.
Patient 1.— The patient is a 43-year-old man who pre-sented with Hunt and Hess grade II SAH. Cerebral an-giography disclosed a large (2 cm) MCA aneurysm,which involved the lenticulostriates. The patient’s clinicalcourse was unremarkable from a neurological standpoint,with no episodes of CVS detected by daily transcranialDoppler sonography (TCD), cerebral angiography, or rou-tine neurological examination. On SAH day 5, the patientunderwent CTP, depicted in Figure 10. Regional histo-grams of vascular territories demonstrate relatively mini-mal deviation of the curve from zero in all territories,indicating relatively normal levels of perfusion throughoutthe brain.
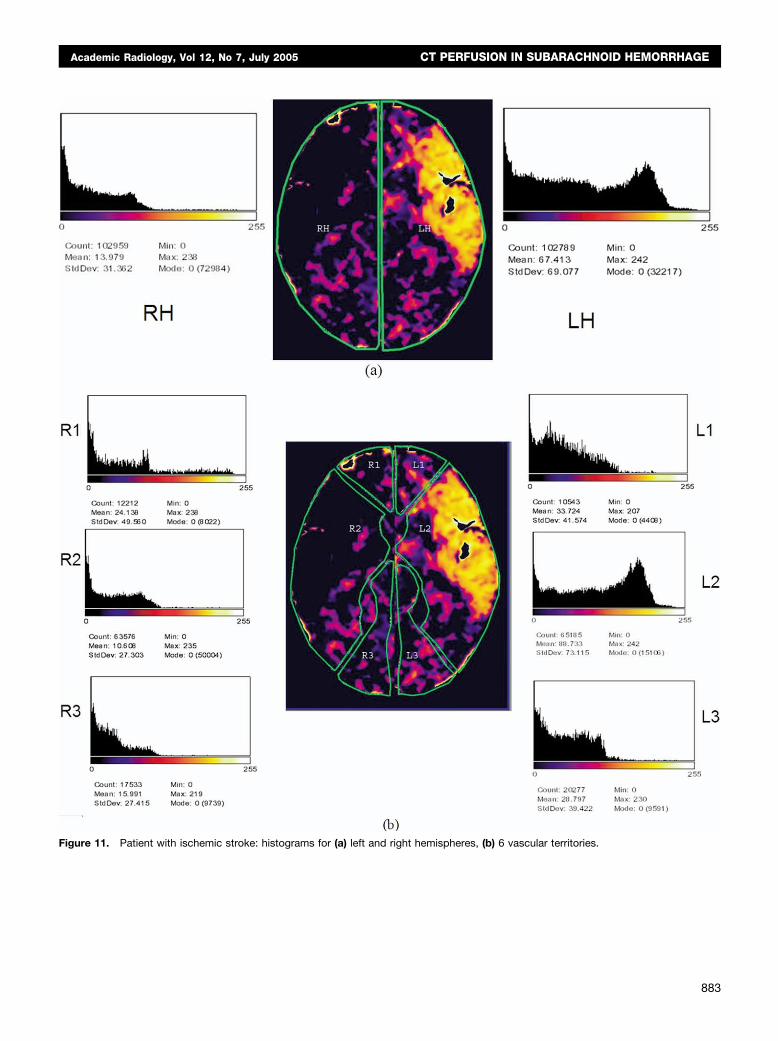
Patient 2.— The patient is a 77-year-old womanwho presented with symptoms consistent with leftMCA infarction. Figure 11 clearly demonstrates large
wedge-shaped region of severe hypoperfusion in the881

IMIELINSKA ET AL Academic Radiology, Vol 12, No 7, July 2005
Figure 10. Patient with “normal” CBF”: histograms for (a) left and right hemispheres, (b) 6 vascular territories: L1, left anterior cerebralartery; L2, left middle cerebral artery; L3, left posterior cerebral artery; R1, right anterior cerebral artery; R2, right middle cerebral artery;
R3, right posterior cerebral artery.882
Academic Radiology, Vol 12, No 7, July 2005 CT PERFUSION IN SUBARACHNOID HEMORRHAGE
Figure 11. Patient with ischemic stroke: histograms for (a) left and right hemispheres, (b) 6 vascular territories.
883

isphe
IMIELINSKA ET AL Academic Radiology, Vol 12, No 7, July 2005
MCA territory consistent with acute proximal occlusionof this vessel. When this image was processed usingour algorithm, a clear peak on the far right was seen in
Figure 12. Patient with SAH: histograms for (a) left and right hem
the histogram representing the left MCA territory that
884
is consistent with our theoretical stroke curve as shownin Figure 2. The histograms for other vascular territo-ries have significantly smaller means, and many appear
res, (b) 6 vascular territories.
“normal.”
Academic Radiology, Vol 12, No 7, July 2005 CT PERFUSION IN SUBARACHNOID HEMORRHAGE
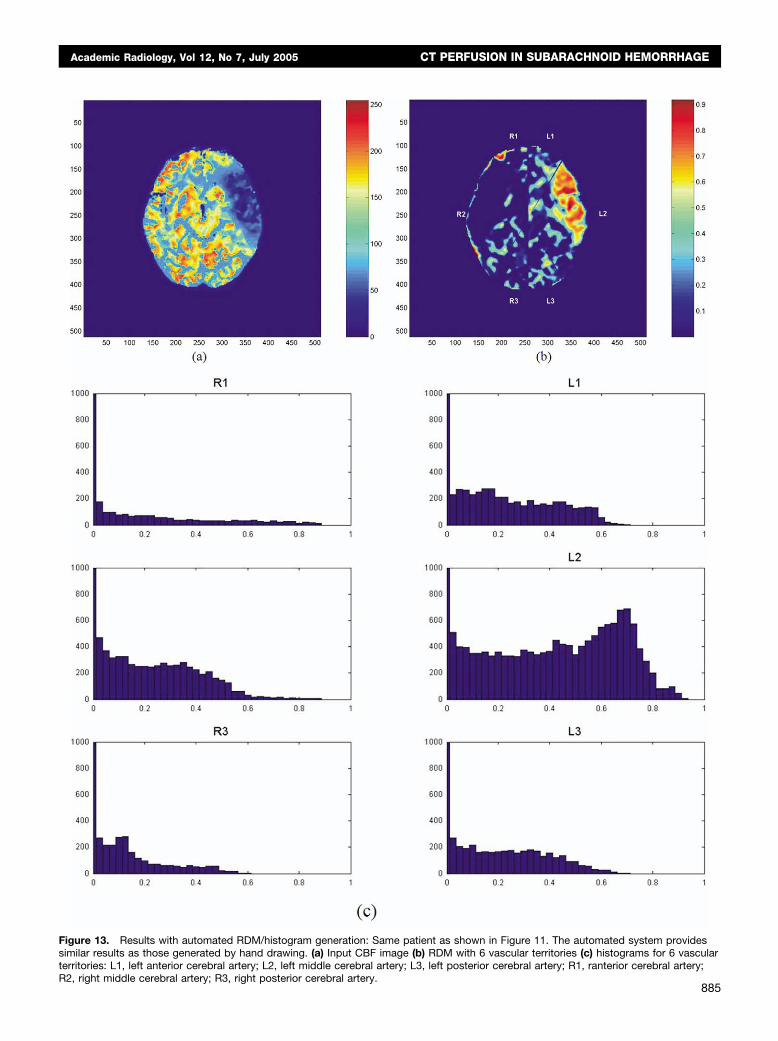
Figure 13. Results with automated RDM/histogram generation: Same patient as shown in Figure 11. The automated system providessimilar results as those generated by hand drawing. (a) Input CBF image (b) RDM with 6 vascular territories (c) histograms for 6 vascularterritories: L1, left anterior cerebral artery; L2, left middle cerebral artery; L3, left posterior cerebral artery; R1, ranterior cerebral artery;
R2, right middle cerebral artery; R3, right posterior cerebral artery.885

IMIELINSKA ET AL Academic Radiology, Vol 12, No 7, July 2005
Patient 3.— Patient is a 36-year-old woman who pre-sented with Hunt and Hess grade IV SAH. Cerebral an-giography disclosed a 4-mm x 3-mm right anterior cho-roidal artery aneurysm. Her neurological examination im-proved significantly postoperatively. However, on SAHday 5, she experienced an acute decline in mental status,but neurological exam demonstrated no focal neurologicaldeficit. A CTP performed at that time (Fig. 12), was readas normal by an attending neuroradiologist. The patientsubsequently developed bilateral arm weakness and wastaken for angiography, which revealed severe vasospasmof the right and left MCA and right ACA. This spasmwas treated with angioplasty, with significant clinical im-provement. Unfortunately, however, follow-up MRI 2months later demonstrated old cerebral infarction in theright frontal lobe. The RDMs demonstrate significant re-gions of side-to-side asymmetry in the left MCA andright ACA territories, consistent with the results seen atangiography. The histograms of these regions, while notas striking as those seen for Patient 2, nevertheless dem-onstrate significant increases in frequency of significantlymismatched pixels (ie, shift of curve to the right).
Subsequent Results With Fully Automated RDMGeneration and Vascular Territory Delineation
We have found that RDMs and their histograms de-rived for vascular territories can be successfully generatedusing the automated method described above and the re-sults closely approximate those obtained by careful man-ual delineation. In the histograms shown, we use bucketsize (an interval in the x axis of the histogram) of 0.02,and the number of pixels in each bucket is depicted usinga normalized scale consistent across all histograms.
In all cases, the automated process produced similarhistograms to those obtained by the manual method. Forthe sake of brevity, we present the results for one patient,Patient 2 (Fig. 13), who at the time of the scan was suf-fering a large left MCA ischemic stroke. These dataclosely mimic the results obtained by hand-drawn territo-ries. This demonstrates that this process can be ade-quately automated to rapidly generate RDM/histogramdata of equal quality to those done by a clinician.
DISCUSSION
In this article we describe a novel methodology thataims to provide an objective quantitative measure of side-
to-side CBF asymmetry measured by CTP. Our prelimi-886
nary results have been promising; however, it should benoted that validation of these methods is still in process.Further, while the SAH subjects presented here wereyoung, previously asymptomatic patients who were un-likely to have premorbid intracranial arterial stenoses, ouranalysis did not include baseline Day 0 imaging analysis.Thus, although unlikely given the clinical history, it ispossible that the asymmetries detected could representpremorbid intracranial arterial disease. Currently, we areperforming validation studies of our software in a pro-spective fashion, with emphasis on comparison to base-line scans, to minimize the effect of premorbid cerebro-vascular disease.
We implemented a fully automated method for compu-tation of the RDM of postprocessed CT perfusion imagesand creation of histograms in each vascular territory. Weare in the process of designing and implementing an auto-mated system for analyzing histogram features to provideclinicians with a quantitative assessment of CBF quality.However, generating a reliable and reproducible approachto the analysis of postprocessed CT perfusion data willrequire a long-term effort.
Interestingly, the creation of our algorithm necessitatedthe development of a number of novel methodologies foraddressing specific issues of image processing and analysisthat have the potential for use in other medical imaging ap-plication. A fundamental pattern of patho-anatomical alter-ation common to numerous disease processes is the develop-ment of side-to-side asymmetry within the organ structure.Consequently, looking for asymmetry is a common methodused throughout radiology. While gross, homogenous side-to-side asymmetry probably does not require numerical anal-ysis of image characteristics using a computer, subtler,patchy asymmetry may be missed routinely.
The strength of our method is its emphasis on perfu-sion asymmetry as the principle manifestation of cerebralischemia, though this may also be one of its shortcom-ings. This is particularly true with respect to CVS follow-ing SAH. In uncommon cases of widespread exposure ofcerebral arteries to subarachnoid blood, CVS may occurbilaterally and thus possibly result in the cancellation ofmeasured perfusion defects. While this is an anticipatedlimitation of this method, it should be noted that whilediffuse multivessel angiographic vasospasm is commonlynoted on vasospasm, bilateral vasospasm severe enoughto cause cerebral infarction (that would lead to a clini-cally important cancellation effect) is exceedingly uncom-mon. Indeed, only 16 cases of bilateral ACA infarction
due to vasospasm have been reported in the literature to
Academic Radiology, Vol 12, No 7, July 2005 CT PERFUSION IN SUBARACHNOID HEMORRHAGE
date [5], and thus should pose only minimal limitations tothe detection of vasospasm using symmetry based meth-odologies.
Our algorithm provides a robust method for detectingthe edges of an organ, determining its axis of symmetry,and characterizing the degree of side-to-side mismatchusing regional histograms. While application of thesemethods to other regions of the body might be limited bya lack of true side-to-side symmetry, the potential appli-cations of a fully developed, automated method for com-plex characterization and quantification of asymmetry arenumerous and span multiple fields of medicine.
REFERENCES
1. Janjua N, Mayer, SA. Cerebral vasospasm after subarachnoid hemor-rhage. Curr Opin Crit Care 2003; 9:113–119
2. Ronkainen A, Niskanen M, Rinne J, Koivisto T, Hernesniemi J, Va-palahti M. Evidence for excess long-term mortality after treated sub-arachnoid hemorrhage. Stroke 2001; 32:2850–2853
3. Weir B. The history of cerebral vasospasm. Neurosurg Clin N Am 1990;1:265–276
4. Barker FG 2nd, Heros RC. Clinical aspects of vasospasm. NeurosurgClin N Am 1990; 1:277–288
5. Sanchez RaP-SJ. Radiologic features of cerebral vasospasm. Neuro-surg Clin N Am 1990; 1:289–306
6. Axel L. Cerebral blood flow determination by rapid-sequence computedtomography: Theoretical analysis. Radiology. 1980; 137:679–686
7. Roberts HC, Dillon WP, Smith WS. Dynamic CT perfusion to assess the
effect of carotid revascularization in chronic cerebral ischemia. AJNR:Am J Neuroradiol 2000; 21:421–4258. Nabavi DG, Cenic A, Craen RA, et al. CT assessment of cerebralperfusion: Experimental validation and initial clinical experience. Radiol-ogy 1999; 213:141–149
9. Ostergaard L, Sorensen AG, Kwong KK, Weisskoff RM, Gyldensted C,Rosen BR. High resolution measurement of cerebral blood flow usingintravascular tracer bolus passages. Part II: Experimental comparisonand preliminary results. Magn Reson Med 1996; 36:726–736
10. Ostergaard L, Weisskoff RM, Chesler DA, Gyldensted C, Rosen BR.High resolution measurement of cerebral blood flow using intravasculartracer bolus passages. Part I: Mathematical approach and statisticalanalysis. Magn Reson Med 1996; 36:715–725
11. Koenig M, Kraus M, Theek C, Klotz E, Gehlen W, Heuser L. Quantita-tive assessment of the ischemic brain by means of perfusion-relatedparameters derived from perfusion CT. Stroke 2001; 32:431–437
12. Axel L. Tissue mean transit time from dynamic computed tomogra-phy by a simple deconvolution technique. Invest Radiol 1983; 18:94 –99
13. Nabavi DG, Kloska SP, Nam E-M, et al. Mosaic: Multimodal stroke as-sessment using computed tomography: Novel diagnostic approach forthe prediction of infarction size and clinical outcome. Stroke 2002; 33:2819–2826
14. Chakravarti L, and Roy J. Handbook of methods of applied statistics.New York, NY: John Wiley and Sons; 1967.
15. Preparata FP, Shamos MI. Computational geometry. New York:Springer; 1985.
16. Gonzalez RC, Woods RE. Digital image processing, 2nd ed. UpperSaddle River, NJ: Prentice Hall; 2002.
17. Imielinska C, Xin L, Sughrue M, Hagiwara E, Connolly ES Jr,D=Ambrosio A. Proceedings of CARS 2004. Computer Assisted Radiol-ogy and Surgery. June 2004:pp. 34-43 Elsevier-Verlag. Amsterdam,2004. pp. 830-835.
18. Klotz. E, König, “perfusion measurements of the brain: using dynamicCT for the quantitative assessment of cerebral ischemia in acutestroke, European Journal of Radiology, 30:170–184, 1999.
19. Tomandl BF, Klotz E, Handschu R, et al., Comprehensive imaging of
ischemic stroke with multisection CT”, RadioGraphics, 23:565–592,2003.887