toward normal with bezafibrate treatment. lipoproteins in ... · hypertriglyceridemia reversal...
TRANSCRIPT

Abnormalities in very low, low and high densitylipoproteins in hypertriglyceridemia. Reversaltoward normal with bezafibrate treatment.
S Eisenberg, … , M Fainaru, R J Deckelbaum
J Clin Invest. 1984;74(2):470-482. https://doi.org/10.1172/JCI111444.
The effects of triglyceridemia on plasma lipoproteins were investigated in 16hypertriglyceridemic (HTG) subjects (222-2,500 mg/dl) before and after the initiation ofbezafibrate therapy. Bezafibrate caused a mean reduction of 56% in plasma triglyceride andincreased the levels of lipoprotein and hepatic triglyceride lipases by 260 and 213%,respectively. The natures of very low density lipoprotein (VLDL), isolated at plasma densityand of low and high density lipoprotein (LDL and HDL), separated by zonalultracentrifugation, were determined. HTG-LDL appears as multiple fractions whereas HTG-HDL is seen predominantly as HDL3. HTG-VLDL is relatively poor in apoproteins andtriglycerides but enriched in free and esterified cholesterol. HTG-LDL (main fraction) isdepleted of free and esterified cholesterol but enriched in apoprotein and triglyceride. It isalso denser and smaller than normal. HTG-HDL3 is denser than N-HDL3 and demonstratescompositional abnormalities similar to those of HTG-LDL. With the reduction of the VLDLmass, all abnormalities revert towards normal. This is accompanied by an increase in LDL-apoprotein B and cholesterol levels, which indicates an increased conversion of VLDL toLDL. Significant correlations between plasma triglyceride and the degree of allabnormalities are shown. The data obtained during treatment corroborate theserelationships. The observations support the concept that most abnormalities reflect thedegree of triglyceridemia. We suggest that plasma core-lipid transfer protein(s) is an effectorof […]
Research Article
Find the latest version:
http://jci.me/111444/pdf

Abnormalities in Very Low, Low,and High Density Lipoproteins inHypertriglyceridemiaReversal toward Normal withBezafibrate Treatment
Shlomo Eisenberg, Dov Gavish, Yitzchak Oschry,Menahem Fainaru, and Richard J. DeckelbaumDepartments of Medicine B, Gastroenterology, and Pediatrics,Hadassah University Hospital, Jerusalem 91120, Israel
As bstract. The effects of triglyceridemia onplasma lipoproteins were investigated in 16 hypertri-glyceridemic (HTG) subjects (222-2,500 mg/dl) beforeand after the initiation of bezafibrate therapy. Bezafibratecaused a mean reduction of 56% in plasma triglycerideand increased the levels of lipoprotein and hepatic tri-glyceride lipases by 260 and 213%, respectively. The na-tures of very low density lipoprotein (VLDL), isolated atplasma density and of low and high density lipoprotein(LDL and HDL), separated by zonal ultracentrifugation,were determined. HTG-LDL appears as multiple fractionswhereas HTG-HDL is seen predominantly as HDL3.
HTG-VLDL is relatively poor in apoproteins and tri-glycerides but enriched in free and esterified cholesterol.HTG-LDL (main fraction) is depleted of free and esterifiedcholesterol but enriched in apoprotein and triglyceride.It is also denser and smaller than normal. HTG-HDL3is denser than N-HDL3 and demonstrates compositionalabnormalities similar to those of HTG-LDL. With thereduction of the VLDL mass, all abnormalities reverttowards normal. This is accompanied by an increase inLDL-apoprotein B and cholesterol levels, which indicatesan increased conversion of VLDL to LDL.
Significant correlations between plasma triglycerideand the degree of all abnormalities are shown. The dataobtained during treatment corroborate these relationships.The observations support the concept that most abnor-malities reflect the degree of triglyceridemia.
Address reprint requests to Dr. Eisenberg, Lipid Research Laboratory,Department of Medicine B, Hadassah University Hospital.
Received for publication 12 December 1983 and in revised form 4April 1984.
Wesuggest that plasma core-lipid transfer protein(s)is an effector of the abnormal cholesteryl ester distribution.Its prolonged action on increasingly large and slowly me-tabolized VLDL populations would entail a correspond-ingly excessive transfer of cholesteryl ester to VLDL andof triglyceride to LDL and HDL. It is calculated that, inmoderate HTG, LDL and HDLcontain only 50% of thenormal cholesterol load. It is suggested that cholesterylester redistribution in HTGmight be important in reg-ulating metabolic events.
Introduction
Studies carried out during the last decade have demonstratedseveral metabolic pathways that affect all plasma lipoproteinclasses. One such pathway is the activity of the lipoprotein lipasesystem, which results not only in triglyceride (TG)' hydrolysisbut also in the formation of intermediate and low density li-poprotein (IDL and LDL) (1, 2). This same activity contributeslipids and proteins to the high density lipoprotein (HDL)(1-5) and may be essential for the formation in plasma of thelighter and larger subpopulation HDL2 (6). Another pathwayinvolves cholesterol esterification by lecithin/cholesterol acyl-transferase (7) and the redistribution of cholesteryl esters (CEs)among the different lipoproteins, a reaction mediated by specificlipid transfer proteins (8-1 1). These proteins are also responsiblefor the redistribution of TGfrom TG-rich lipoproteins to LDLand HDL (12). Analysis of the potential effects of these andother metabolic events predicts that lipoprotein composition,structure, and metabolism should differ among subjects withvarious forms of dyslipoproteinemia, in particular hypertriglyc-eridemia (HTG). Indeed, in severe forms of HTGsuch as the
1. Abbreviations used in this paper: apo A-I and apo B, apoproteinsA-I and B; C, cholesterol; CE, cholesterol ester; HTG, hypertriglyceri-demia, hypertriglyceridemic; NTG, normotriglyceridemia, normotri-glyceridemic; SDS-PAGE, sodium dodecyl sulfate-polyacrylamide gelelectrophoresis; TC, total cholesterol; TG, triglyceride.
470 S. Eisenberg, D. Gavish, Y. Oschry, M. Fainaru, and R. J. Deckelbaum
J. Clin. Invest.© The American Society for Clinical Investigations, Inc.0021-9738/84/08/0470/ 13 $ 1.00Volume 74, August 1984, 470-482

lipoprotein lipase or apoprotein C-II deficiency syndromes, sev-eral abnormalities have been described. For example, LDL andHDL-cholesterol levels are low, and the two are enormouslyenriched with TGs (13, 14). Whenever studied, both LDL andHDLare denser and smaller than the normal lipoproteins (15).
The present investigation was undertaken to determinewhether abnormalities can be found in patients with milder andmore common forms of HTGand whether such abnormalities,if they exist, can be ascribed to the HTGstate. To this end, wehave determined the nature of the plasma lipoprotein systemin 16 subjects with HTGat two levels of plasma TGs, high andreduced. Bezafibrate (2-[4-[2-(4-chlorobenzamide)ethyl]phen-oxyl]2-methyl-propionic acid), a drug known to reduce plasmaTG levels, was used to achieve the lower TG levels. This ex-perimental design, therefore, allowed comparisons of lipoproteinsin the same individual before and during TG-lowering therapy.
The study indeed revealed multiple abnormalities in all lipo-protein classes that depend on the degree of triglyceridemia.
MethodsSubjects. 16 males with HTGand 7 normolipidemic male subjects agreedto participate in the study. The 16 patients were identified in the JerusalemLipid Research Clinic and were followed for from 6 mo to 6 yr. Allpatients were instructed to consume a standard isocaloric type IV dietrecommended for such patients in our clinic. The diet contains 40% ofcalories as fats (daily cholesterol intake < 300 mg), 40% as complexcarbohydrates (sugar is excluded from the diet), and 20% as protein.The patients were on this diet for at least 3 mobefore they entered thestudy. The normal subjects consumed a regular Israeli diet, which usuallywas similar to that reported recently by the Jerusalem Lipid ResearchClinic prevalence study (16).
The characteristics of the patients and their prestudy plasma lipidand lipoprotein-cholesterol levels are shown in Table I. Three patients
Table I. Characteristics of NTGand HTGSubjects
Plasma Lipoproteins
Patient Age Quetelet TG Cholesterol VLDL-C LDL-C HDL-C Remarks
yr wI/hi2 mg/100 ml plasma mg/100 ml plasma
HTG1 48 28.7 764 179 90 67 22 IHD2 66 24.2 341 178 70 84 24 IHD, F3 55 25.0 222 196 40 132 24 IHD, F4 44 26.2 507 240 118 94 25 IHD, F5 48 25.4 468 220 78 114 28 DM8 37 24.0 245 210 60 120 30 -9 50 29.4 2,340 520 422 70 28 IHD, DM, F
10 59 25.3 890 304 189 90 25 IHD15 40 23.6 475 220 90 100 30 IHD, F17 44 27.6 2,500 440 380 40 20 IHD, DM18 26 21.8 300 270 73 171 27 F20 29 25.4 700 240 156 56 30 F25 51 27.3 250 230 55 152 2326 39 25.8 400 230 116 90 24 IHD, F27 38 24.0 500 200 80 90 30 F28 44 25.7 1,000 306 213 65 28 IHD
Mean±SEM 44.9±2.6 25.5±0.5 744±151 261±23 139±27 96±9 26.2±0.8
NTGNI 31 27.1 46 123 21 69 33N2 48 23.5 207 174 33 108 33N3 38 27.4 54 178 34 107 37N4 41 26.2 150 199 23 143 33N5 33 20.4 111 202 19 146 37N6 33 24.6 144 214 45 137 32N7 45 24.3 136 231 28 161 42
Mean±SEM 38.4±2.5 24.9± 1.0 121.1±21.4 189.4± 13.9 29±3.4 124.6±11.9 35.3± 1.4
IHD, ischemic heart disease; DM, diabetes mellitus; F, familial HTG.
471 Abnormal VLDL, LDL, and HDL in Hypertriglyceridemia

had mild type II diabetes mellitus (fasting plasma glucose, 120 to 220mg/dl) treated with diet only. Hepatic, renal, and thyroid functions werenormal in all patients and none was receiving drug treatment for otherconditions. A positive family history of HTGwas obtained in ninepatients. A lack of enough first-degree relatives prevented family in-vestigations in the other patients. For the same reason, we could notclassify the subjects into familial HTGor familial combined hyperli-poproteinemia. Yet all patients and their affected relatives exhibitedHTGwith normal or low LDL levels. Pretreatment levels of plasmaTG, plasma total cholesterol (TC), very low density lipoprotein-cholesterol(VLDL-C), LDL-C, and HDL-C are shown in Table I. Similar lipidlevels were also recorded on multiple occasions in all patients beforethey entered the study.
Study protocol. Patients thought to be suitable for the study wereidentified in the Lipid Clinic. After receiving a detailed explanationabout the study and signing an informed consent form, the patientsbegan the study. Three fasting blood samples were obtained in EDTA(I mg/ml) before the institution of bezafibrate treatment, usually atweekly intervals. On the second visit, blood was also obtained 10 minafter intravenous injection of 3,000 IU of sodium heparin (35-45IU/kg). Plasma was promptly separated and stored at -20°C for future(4-8 mo) determinations of heparin-releasable lipolytic activities (seebelow). Bezafibrate treatment, 200 mg three times per day, was institutedon the day of the third visit. On that day, a larger blood sample (60-80 ml) was obtained to determine the nature of the lipoprotein systembefore therapy. Blood samples (20-30 ml) were drawn after 1, 2, 4, 8,12, 24, and 48 wk of treatment. At the end of the fourth week oftreatment, a larger sample was again obtained for special studies. Alsoon that day, a second post-heparin sample was drawn.
Seven normolipidemic healthy males volunteered to participate inthe study as controls. Some characteristics of these subjects are alsoshown in Table I. The procedures for obtaining plasma for lipoproteincharacterization and for determining post-heparin lipolytic activitieswere identical to those described for the patients.
All plasma samples were drawn between 8 and 9 AMafter at leasta 12-h fast. The blood was kept on ice, and plasma was separated within60 min by low speed centrifugation (3,000 rpm) for 20 min at 4°C.Post-heparin plasma samples were divided into aliquots and then im-mediately frozen at -20°C. The separation of lipoproteins was alsostudied on the day of blood collection after the procedure detailed below.
Preparation of lipoproteins. Two procedures were employed to sep-arate plasma lipoproteins. The first was identical to that of the JerusalemLipid Research Clinic program (17) and was used to determine VLDL,LDL, and HDL cholesterol levels. In short, plasma samples were firstcentrifuged at plasma density (40,000 rpm, 18 h), and the VLDL wasseparated by the tube slicing technique (18). Aliquots of the VLDL andof the lipoprotein fraction of d > 1.006 g/ml were taken for cholesteroland TG determination. The remaining VLDL was washed once at adensity of 1.006 g/ml as above and was kept for further analysis. HDLcholesterol was determined on the 1.006 g/ml infranatant fraction bythe heparin/manganese precipitation method, and LDL-cholesterol wascalculated. The second procedure was used to obtain LDL and HDLsubfractions. To that end, two 10-ml samples of the VLDL-free plasma(d > 1.006 g/ml) were applied to zonal ultracentrifugation systems. Theseparation of LDL and HDLpopulations with this method was carriedout as previously described (19). LDL and IDL were separated after 140min of centrifugation in a 14 Ti zonal rotor spinning at 42,000 rpm ina 1.0-1.3 g/ml linear NaBr gradient. HDL populations were separatedafter 22 h of centrifugation at 41,000 rpm in a discontinuous 1.0-1.4g/ml gradient. Eluted samples were monitored continuously at 280 nm
(UA-5 absorbance monitor; Isco, Inc., Environmental Div., Lincoln,NE) and 25 ml samples were collected. Lipoprotein fractions were iden-tified, pooled, dialyzed against a 0.9% NaCl, 0.0 1%NaN3, 0.0 1%EDTA,pH = 7.4 solution, and concentrated by vacuum dialysis (20). Lipo-proteins were kept at 4°C for further analysis.
Analytical procedures. Lipoprotein protein and phospholipid weredetermined by standard procedures (21, 22). Total plasma cholesteroland total and lipoprotein TGs were determined by the AutoAnalyzertechnique (Technicon Instrument Corp., Tarrytown, NY) (17). CEandfree cholesterol content in lipoproteins were measured by the cholesteroloxidase-cholesterol esterase technique (23) with a commercial kit (Boeh-ringer Mannheim GmbH, Mannheim, Federal Republic of Germany).Sodium dodecyl sulfate-polyacrylamide gel electrophoresis (SDS-PAGE)of apolipoproteins by the use of 10% gels was performed after the methoddescribed by Weber and Osborn (24). Negatively stained electron mi-crographs of LDL and HDLwere obtained in an electron microscope(Philips 300; Philips Electronic Instruments, Inc., Mahwah, NJ) as de-scribed previously (20). Lipoproteins were photographed at 90,000 diamand prints were enlarged to 225,000 diam. For particle sizing, the di-ameters of 50-100 particles were measured and the mean was calculated.The standard deviation of particle distribution ranged between 5and 10%.
Plasma apoprotein A-I (apo A-I) and plasma LDL-apoprotein B(apo B) levels were determined by immunoassays (25, 26). The apoA-I content of whole plasma was measured by a specific radioimmu-noassay procedure (26). Apo B was quantified by radial immunodiffusionwhich used 1.2% antiserum and 1% agarose (BDH Chemicals, Ltd.,Poole, England) in 0.05 Mbarbital buffer, pH 8.6 (25). LDL protein,determined by the Lowry procedure served as standard, and ring diameterwas measured after 48 h. The standard curve was linear between 10and 200 mg/dl. The precision and sensitivity of the immunoassay werepublished recently (25). All samples of an individual subject were analyzedin one assay, thus minimizing interassay variation.
Measurements of heparin-releasable plasma lipases. Lipoprotein li-pase and hepatic TGhydrolase activities were measured in post-heparinplasma samples by two methods. Lipoprotein lipase activity was deter-mined in samples where the hepatic TG hydrolase was completely in-hibited by specific antiserum against the human enzyme. The antiserumwas supplied by Dr. T. Olivecrona (University of Umea, Sweden) andwas raised in rabbits against purified human hepatic TGhydrolase. Theprocedure used to measure lipoprotein lipase activity closely followedthat described by Huttunen et al. (27). 40 gsl of post-heparin plasmawas first allowed to incubate on ice with 10 ul of immune or nonimmunerabbit serum. Thereafter, the hydrolysis of [3H]oleate-TGs (in washedIntralipid [Vitrum, Stockholm] [28]) was determined at 37°C in a ther-mostated shaking water bath. The incubation mixture (0.7 ml) contained4 mg/ml of Intralipid, 0.05 MTris buffer, pH 8.6, 0.1 MNaCl, andthe post-heparin and control or immune rabbit plasma samples. Pre-liminary experiments demonstrated identical activities in mixtures withor without nonimmune rabbit plasma and complete inhibition of lipaseactivity in mixtures containing immune rabbit serum and 1 MNaCI.The second method used was separation of lipoprotein lipase and hepaticTGhydrolase by affinity chromatography on heparin-Sepharose CL-6Bcolumns (Pharmacia Fine Chemicals, Piscataway, NJ) as described byBengtsson and Olivecrona (29). Lipoprotein lipase activity was assayedin the 1.5 MNaCl eluate in the presence of 50 Ml/ml of normal humanserum, and hepatic TG hydrolase activity was assayed in the 0.7 Meluate in the absence of serum. Hepatic TG hydrolase activity was cal-culated from the total post-heparin lipolytic activity, the ratios of heparin-Sepharose eluted activities, and the directly measured lipoprotein lipase
472 S. Eisenberg, D. Gavish, Y. Oschry, M. Fainaru, and R. J. Deckelbaum

activity. Post-heparin plasma samples obtained from the same patientbefore and 4 wk after the initiation of therapy were always included inthe same assay.
Statistical analysis. Tests for significant differences between untreatedand treated HTGpatients were performed by paired t test evaluationand between NTGsubjects and untreated HTGpatients by unpaired ttest evaluation. Linear regression analysis was used to determine coef-ficients of correlation between lipoprotein parameters and lipase activitiesas compared with plasma TGlevels (log transformed). Significance levelswere obtained by t and r tables (30).
Results
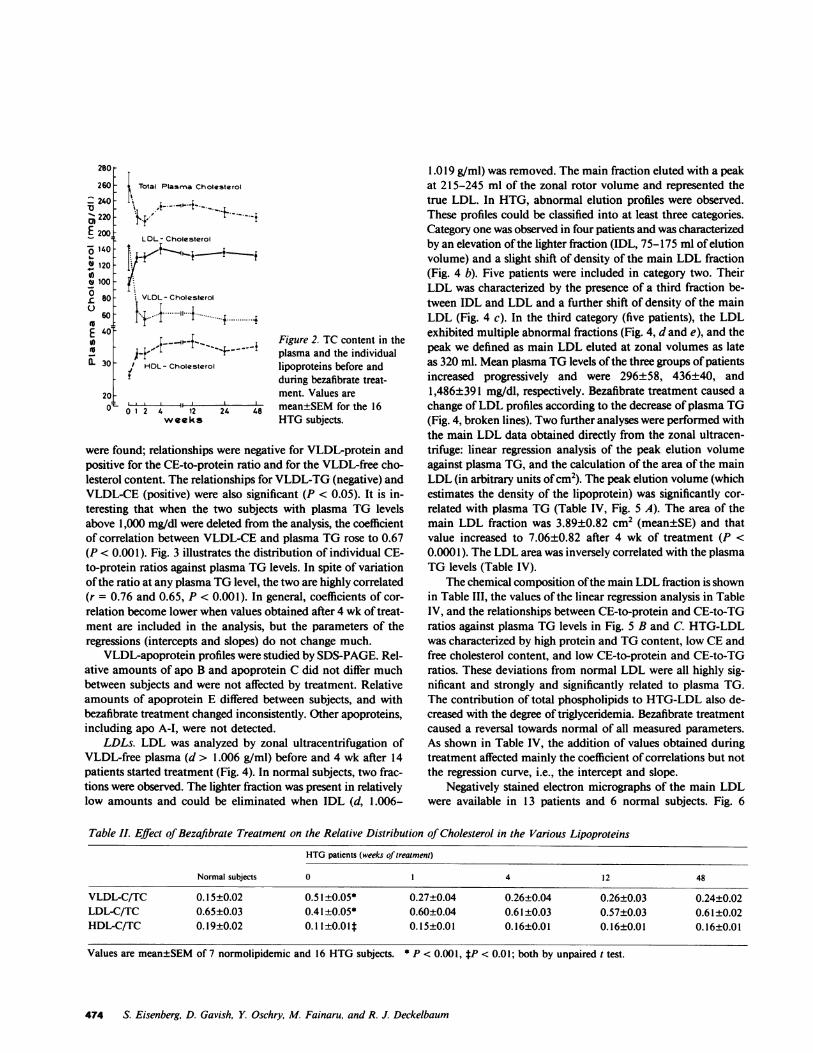
Plasma lipids and lipoprotein-lipid levels. Mean plasma TGdecreased by 56±4.3% (mean±SEM, P < 0.005) after 1 wk oftreatment and remained at that low level for the 48 wk of study(Fig. 1 a). The decrease of plasma TGwas observed in all subjectsand ranged between 29 and 82% (Fig. 1 b). A moderate decreaseof mean plasma cholesterol from 257±21 to 220±9.3 mg/dl(P < 0.05) was observed after 1 wk and to 214±6.8 mg/dl(P < 0.05) after 2 wk (Fig. 2). At subsequent examinations,mean plasma cholesterol increased but remained lower thanpretreatment levels. The change of plasma cholesterol in in-dividual subjects ranged from + 18.5% to -51.6%, and the max-imal decrease was seen in subjects with the highest plasma TG
0
._ )
a >_ W
4. .
.
r 4
FL-
ouv
60
40 1 Si- f-1
Period of Treatment( Weeks)
levels (patients 9, 10, 17, and 28). Lipoprotein-C levels are alsoshown in Fig. 2. The change of VLDL-C paralleled that ofplasma TG, and a mean decrease from 144±30 to 60±14 mg/dl was observed after 1 wk of treatment (P < 0.005). LDL-Cand HDL-C levels increased in all patients. After 1 wk of treat-ment, mean LDL-C increased from 96±8.6 to 131±8.5 mg/dl(P < 0.005). The highest LDL-C was observed after 4 wk, at139±7.4 mg/dl. HDL-C increased from 26.2±0.8 to 32.9±1.2mg/dl (P < 0.005) after 1 wk and peaked at 12 wk at 36.3±2.0mg/dl. Thus, the distribution of cholesterol among lipoproteinschanged markedly with treatment from very abnormal distri-bution towards that found in the NTGsubjects (Table II).
VLDL. VLDL was isolated and characterized before and 4wk after treatment was started (Table III). Several abnormalitiesof HTG-VLDL are evident: low protein and TG content andhigh CE and free cholesterol content. The CE-to-protein andCE-to-TG mass ratios in HTG-VLDL are twice those inN-VLDL, and the CE to phospholipid ratio is -50% abovenormal. After 4 wk of treatment, VLDL composition changedtowards that observed in normal subjects. Linear regressionanalysis of the compositional data against plasma TGlevels wasperformed separately for untreated subjects (NTGs and HTGs)and for all subjects, and included values measured after 4 wkof treatment (Table IV). Highly significant negative relationships
Figure 1. Relative plasma TG levels inHTGsubjects before and during treatmentwith bezafibrate. (a) Mean±SEMvalue forthe 16 subjects; (b) individual values.
473 Abnormal VLDL, LDL, and HDL in Hypertriglyceridemia
280
260
_ 240-" 220-
E 200:0 140
° 120 -
VI -
8 100 -
L 80-
60D -t
( 30
i Total Plasma Cholesterol
LDL- Cholesterol
VLDL- Cholesterol
.I---- --11------...... +
/, HDL- Cholesterol
20 to:L 0 1 2 4 12
weeks24
Figure 2. TC content in theplasma and the individuallipoproteins before andduring bezafibrate treat-ment. Values aremean±SEMfor the 16HTGsubjects.
were found; relationships were negative for VLDL-protein andpositive for the CE-to-protein ratio and for the VLDL-free cho-lesterol content. The relationships for VLDL-TG (negative) andVLDL-CE (positive) were also significant (P < 0.05). It is in-teresting that when the two subjects with plasma TG levelsabove 1,000 mg/dl were deleted from the analysis, the coefficientof correlation between VLDL-CE and plasma TG rose to 0.67(P < 0.001). Fig. 3 illustrates the distribution of individual CE-to-protein ratios against plasma TGlevels. In spite of variationof the ratio at any plasma TGlevel, the two are highly correlated(r = 0.76 and 0.65, P < 0.001). In general, coefficients of cor-relation become lower when values obtained after 4 wk of treat-ment are included in the analysis, but the parameters of theregressions (intercepts and slopes) do not change much.
VLDL-apoprotein profiles were studied by SDS-PAGE. Rel-ative amounts of apo B and apoprotein C did not differ muchbetween subjects and were not affected by treatment. Relativeamounts of apoprotein E differed between subjects, and withbezafibrate treatment changed inconsistently. Other apoproteins,including apo A-I, were not detected.
LDLs. LDL was analyzed by zonal ultracentrifugation ofVLDL-free plasma (d > 1.006 g/ml) before and 4 wk after 14patients started treatment (Fig. 4). In normal subjects, two frac-tions were observed. The lighter fraction was present in relativelylow amounts and could be eliminated when IDL (d, 1.006-
1.019 g/ml) was removed. The main fraction eluted with a peakat 215-245 ml of the zonal rotor volume and represented thetrue LDL. In HTG, abnormal elution profiles were observed.These profiles could be classified into at least three categories.Category one was observed in four patients and was characterizedby an elevation of the lighter fraction (IDL, 75-175 ml of elutionvolume) and a slight shift of density of the main LDL fraction(Fig. 4 b). Five patients were included in category two. TheirLDL was characterized by the presence of a third fraction be-tween IDL and LDL and a further shift of density of the mainLDL (Fig. 4 c). In the third category (five patients), the LDLexhibited multiple abnormal fractions (Fig. 4, d and e), and thepeak we defined as main LDL eluted at zonal volumes as lateas 320 ml. Mean plasma TG levels of the three groups of patientsincreased progressively and were 296±58, 436±40, and1,486±391 mg/dl, respectively. Bezafibrate treatment caused achange of LDL profiles according to the decrease of plasma TG(Fig. 4, broken lines). Two further analyses were performed withthe main LDL data obtained directly from the zonal ultracen-trifuge: linear regression analysis of the peak elution volumeagainst plasma TG, and the calculation of the area of the mainLDL (in arbitrary units of cm2). The peak elution volume (whichestimates the density of the lipoprotein) was significantly cor-related with plasma TG (Table IV, Fig. 5 A). The area of themain LDL fraction was 3.89±0.82 cm2 (mean±SE) and thatvalue increased to 7.06±0.82 after 4 wk of treatment (P <0.0001). The LDL area was inversely correlated with the plasmaTG levels (Table IV).
The chemical composition of the main LDL fraction is shownin Table III, the values of the linear regression analysis in TableIV, and the relationships between CE-to-protein and CE-to-TGratios against plasma TG levels in Fig. 5 B and C. HTG-LDLwas characterized by high protein and TGcontent, low CEandfree cholesterol content, and low CE-to-protein and CE-to-TGratios. These deviations from normal LDL were all highly sig-nificant and strongly and significantly related to plasma TG.The contribution of total phospholipids to HTG-LDL also de-creased with the degree of triglyceridemia. Bezafibrate treatmentcaused a reversal towards normal of all measured parameters.As shown in Table IV, the addition of values obtained duringtreatment affected mainly the coefficient of correlations but notthe regression curve, i.e., the intercept and slope.
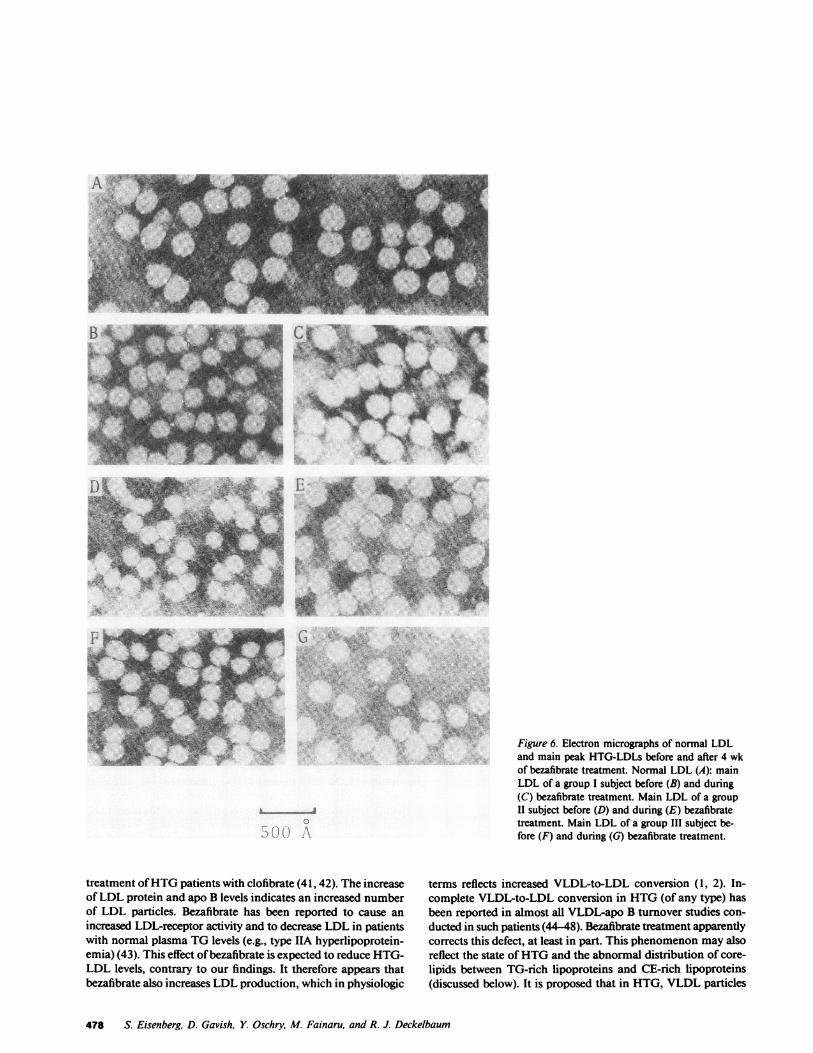
Negatively stained electron micrographs of the main LDLwere available in 13 patients and 6 normal subjects. Fig. 6
Table II. Effect of Bezafibrate Treatment on the Relative Distribution of Cholesterol in the Various Lipoproteins
HTGpatients (weeks of treatment)
Normal subjects 0 1 4 12 48
VLDL-C/TC 0.15±0.02 0.51±0.05* 0.27±0.04 0.26±0.04 0.26±0.03 0.24±0.02LDL-C/TC 0.65±0.03 0.41±0.05* 0.60±0.04 0.61±0.03 0.57±0.03 0.61±0.02HDL-C/TC 0.19±0.02 0.11 ±0.0O t 0.15±0.01 0.16±0.01 0.16±0.01 0.16±0.01
Values are mean±SEMof 7 normolipidemic and 16 HTGsubjects. * P < 0.001, tP < 0.01; both by unpaired t test.
474 S. Eisenberg, D. Gavish, Y. Oschry, M. Fainaru, and R. J. Deckelbaum

Table III. Relative Composition of Lipoproteins in NTGand HTGSubjects Before (Untreated)and During (Treated) Bezafibrate Treatment
Lipo-protein Subjects Protein TG CE FC PL CE/PR CE/PL CE/TG
VLDL HTG, 10.21±0.52 53.42±1.73 11.71±0.26 6.23±0.3 18.41±0.74 1.184±0.09 0.64±0.04 0.23±0.02untreated
HTG, 12.27±0.62* 55.9±1.4* 8.79±0.6* 4.94±0.24* 18.22±0.69 0.75±0.07* 0.48±0.03t 0.16±0.01*treated
NTG 14.2±0.46§ 55.8±0.92 8.3±0.65§ 4.2±0.36§ 17.5±0.8 0.58±0.06§ 0.44±0.05" 0.126±0.01§
LDL HTG, 27.79±1.18 10.59±1.64 34.69±1.7 6.71±0.53 20.16±0.51 1.3 1±0.1 It 1.72±0.07 4.06±0.63untreated
HTG, 22.92±0.94* 7.38±0.77t 39.55±1.23* 8.95±0.36* 22.42±0.45* 1.77±0.1* 1.77±0.05* 6.01±0.72*treated
NTG 21.7±0.6§ 5.9±1.08 41.4±0.64§ 9.2±0.47¶ 21.7±0.64§ 1.97±0.169¶ 1.91±0.2 7.34±1.2§
HDL HTG, 53.2±1.2 8.54±0.92 12.4±0.57 1.88±0.08 23.91±1.23 0.23±0.01 0.54±0.05 1.73±0.23untreated
HTG, 52.0±0.95 5.22±0.66** 14.58±0.67* 1.86±0.1 26.28±0.54t 0.28±0.01* 0.56±0.03 3.16±0.59ttreated
NTG 52.0±1.7 4.68±0.46§ 18.52±0.49§ 2.07±0.11 22.75±1.64 0.36±0.01§ 0.83±0.08¶ 4.16±0.47§
Values are expressed in weight percent or weight ratios (mean±SEM). * P < 0.001, tP < 0.01, **P <0.05; all paired t test, treated vs. un-treated HTGsubjects. § P < 0.001, ¶P < 0.05, "P < 0.05; all unpaired t test, normolipemics vs. untreated HTGsubjects.
presents electron micrographs from one normal subject andthree patients with HTG; each represents a patient of one ofthe three different categories. HTG-LDL is smaller than normalLDL, and LDL size increases with therapy. The smallest LDLwas found in patient 17, with diameter of 167 A (normal 200-220 A). As for other LDL parameters, the diameter of the LDLwas strongly and significantly related (negatively) to plasma TG(Fig. 5 D, Table IV).
SDS-PAGEof the main LDL revealed that apo B was themain apoprotein present. It is estimated that more than 90%of the total protein content was accounted for by apo B. Smallamounts of apoprotein C were also identified. The apoproteinprofile of LDL was not changed by treatment. Apo B contentof VLDL-free plasma (d > 1.006 g/ml) in the 16 patients beforethe initiation of bezafibrate treatment was 95±4.5 mg/dl(mean±SEM). This value increased to 110±4.4 mg/dl after 4wk of treatment (P < 0.05). With treatment, the cholesterol-to-apo B weight ratio also increased, from 1.02 to 1.33(P < 0.005). A more pronounced increase was found for themain LDL protein and CE content, from 38±4.1 to 55±6.6mg/dl (P < 0.05) and from 54±8.8 to 93±13.6 mg/dl (P< 0.05), respectively.
HDLs. HDLpopulations were isolated from the plasma of13 patients and 7 normal subjects. In HTG, the predominantHDL population was HDL3 (Fig. 4). HDL2 was either barelyidentified or not present at all. The analysis therefore is confinedto HDL3.
HTG-HDL3 eluted in the zonal rotor later than N-HDL3
(peak elution volumes of 285±4.8 and 260±7.0 ml(mean±SEM), respectively). Peak elution volumes were signif-icantly related to plasma TG levels (Fig. 7 A and Table IV).Bezafibrate treatment caused a shift of HDL3 towards a lowerdensity in 10 of the 13 patients (examples in Fig. 4), with apeak elution volume of 271±6.1 ml (mean±SEM, P < 0.01, ascompared with pretreatment volumes).
The chemical composition of HDL3 is shown in Table IIIand the linear regression analysis of the relationships of HDL3constituents to plasma TG is shown in Table IV and Fig. 7 Band C. HTG-HDL3 was characterized by a minor elevation ofprotein content, an increased TG and decreased CE content,and low CE-to-protein, CE-to-TG, and CE-to-phospholipid ra-tios. Except for the protein, all other parameters were significantlyrelated to plasma TG levels (Table IV). Bezafibrate treatmentcaused all abnormalities to reverse toward normal. SDS-PAGEdemonstrated that apo A-I and apoprotein A-II were the pre-dominant HDL3apoproteins, and no qualitative differences werenoted between groups of subjects.
Plasma apo A-I was measured by radioimmunoassay duringthe first 12 wk of treatment in eight patients (Fig. 8). Withtreatment, plasma HDL-C in these eight patients increased by33.7%, whereas plasma apo A-I content increased by only 5. 1%.Thus, the ratio of plasma apo A-I to HDL-C decreased by 22.0%.
Heparin-releasable plasma lipases. The activity of the hep-arin-releasable plasma lipoprotein lipase and the hepatic TGhydrolase are shown in Table V and Fig. 9. Both activities werelow in HTG before treatment. A highly significant negative
475 Abnormal VLDL, LDL, and HDL in Hypertriglyceridemia
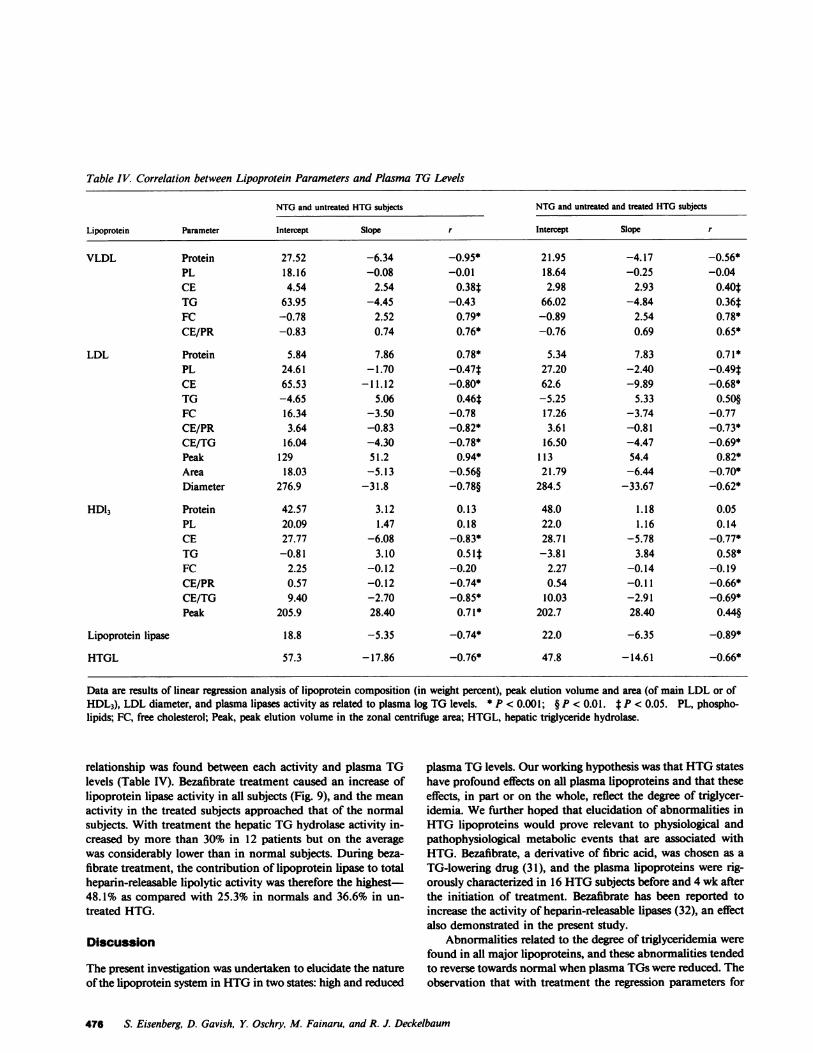
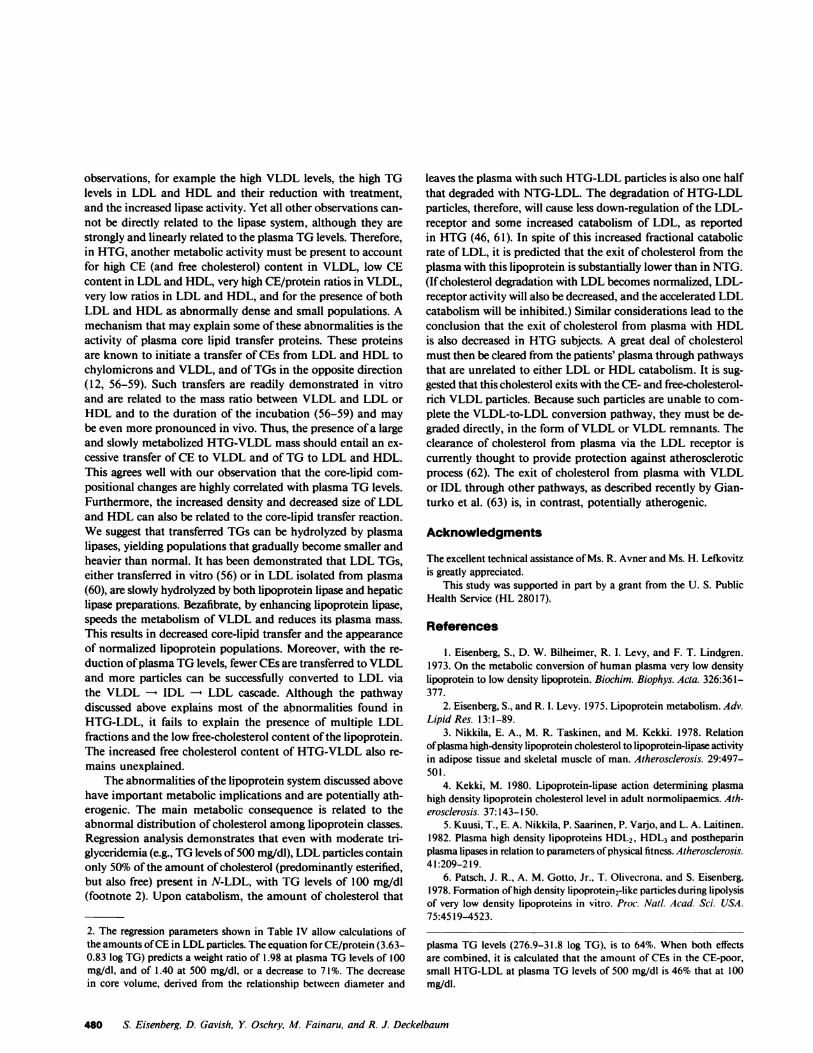
Table IV. Correlation between Lipoprotein Parameters and Plasma TG Levels
NTGand untreated HTGsubjects NTGand untreated and treated HTGsubjects
Lipoprotein Parameter Intercept Slope r Intercept Slope r
VLDL Protein 27.52 -6.34 -0.95* 21.95 -4.17 -0.56*PL 18.16 -0.08 -0.01 18.64 -0.25 -0.04CE 4.54 2.54 0.38t 2.98 2.93 0.40*TG 63.95 -4.45 -0.43 66.02 -4.84 0.36tFC -0.78 2.52 0.79* -0.89 2.54 0.78*CE/PR -0.83 0.74 0.76* -0.76 0.69 0.65*
LDL Protein 5.84 7.86 0.78* 5.34 7.83 0.71*PL 24.61 -1.70 -0.47t 27.20 -2.40 -0.49*CE 65.53 -11.12 -0.80* 62.6 -9.89 -0.68*TG -4.65 5.06 0.46t -5.25 5.33 0.50§FC 16.34 -3.50 -0.78 17.26 -3.74 -0.77CE/PR 3.64 -0.83 -0.82* 3.61 -0.81 -0.73*CE/TG 16.04 -4.30 -0.78* 16.50 -4.47 -0.69*Peak 129 51.2 0.94* 113 54.4 0.82*Area 18.03 -5.13 -0.56§ 21.79 -6.44 -0.70*Diameter 276.9 -31.8 -0.78§ 284.5 -33.67 -0.62*
HDl3 Protein 42.57 3.12 0.13 48.0 1.18 0.05PL 20.09 1.47 0.18 22.0 1.16 0.14CE 27.77 -6.08 -0.83* 28.71 -5.78 -0.77*TG -0.81 3.10 0.51t -3.81 3.84 0.58*FC 2.25 -0.12 -0.20 2.27 -0.14 -0.19CE/PR 0.57 -0.12 -0.74* 0.54 -0.11 -0.66*CE/TG 9.40 -2.70 -0.85* 10.03 -2.91 -0.69*Peak 205.9 28.40 0.71* 202.7 28.40 0.44§
Lipoprotein lipase 18.8 -5.35 -0.74* 22.0 -6.35 -0.89*
HTGL 57.3 -17.86 -0.76* 47.8 -14.61 -0.66*
Data are results of linear regression analysis of lipoprotein composition (in weight percent), peak elution volume and area (of main LDL or ofHDL3), LDL diameter, and plasma lipases activity as related to plasma log TG levels. * P < 0.001; § P < 0.01. t P < 0.05. PL, phospho-lipids; FC, free cholesterol; Peak, peak elution volume in the zonal centrifuge area; HTGL, hepatic triglyceride hydrolase.
relationship was found between each activity and plasma TGlevels (Table IV). Bezafibrate treatment caused an increase oflipoprotein lipase activity in all subjects (Fig. 9), and the meanactivity in the treated subjects approached that of the normalsubjects. With treatment the hepatic TGhydrolase activity in-creased by more than 30% in 12 patients but on the averagewas considerably lower than in normal subjects. During beza-fibrate treatment, the contribution of lipoprotein lipase to totalheparin-releasable lipolytic activity was therefore the highest48.1% as compared with 25.3% in normals and 36.6% in un-treated HTG.
Discussion
The present investigation was undertaken to elucidate the natureof the lipoprotein system in HTGin two states: high and reduced
plasma TGlevels. Our working hypothesis was that HTGstateshave profound effects on all plasma lipoproteins and that theseeffects, in part or on the whole, reflect the degree of triglycer-idemia. Wefurther hoped that elucidation of abnormalities inHTG lipoproteins would prove relevant to physiological andpathophysiological metabolic events that are associated withHTG. Bezafibrate, a derivative of fibric acid, was chosen as a
TG-lowering drug (31), and the plasma lipoproteins were rig-orously characterized in 16 HTGsubjects before and 4 wk afterthe initiation of treatment. Bezafibrate has been reported toincrease the activity of heparin-releasable lipases (32), an effectalso demonstrated in the present study.
Abnormalities related to the degree of triglyceridemia werefound in all major lipoproteins, and these abnormalities tendedto reverse towards normal when plasma TGswere reduced. Theobservation that with treatment the regression parameters for
476 S. Eisenberg, D. Gavish, Y. Oschry, M. Fainaru, and R. J. Deckelbaum

2.0rc 1.8
1.6S0 _
0. 0v 1.4
1.2
eC
1.0t E0.8
° 06
L 0.2U 0
0@0
00* 0
S0
O sB
AO 000A
A 0 0 0A 0
0
0
350E
3000_
E 250
(L 200.2.50
.2 2.002 1.50
_ 1.00
U' 0.50o
10.00
0 8.00
6.00
2.00
250
r 0.76
50 100 200 500 1000 3000Plasma Triglycerides
(mg / dl )
Figure 3. The distribution of individual VLDL-CE-to-protein ratiosagainst plasma TG levels. A, normal subjects; ., untreated HTGsub-jects; o, HTGsubjects after 4 wk of bezafibrate treatment. The rvalue is for the HTGuntreated and normal groups.
2-
0
200
I50
A 0
I * 0o 0
AA ot r O094
rz-0.82
.. . A
A AC oo a04 00e%8*
C 00* * 0
L_ ... 1
AAA 0&AA
0cP0IA'S
9.1
D 0o °AAP
A#0 go0 0
00*
0*
20 50 100 200 S00 1000Plasma Triglyceride
Figure 5. The relationshipof individual LDL parame-ters to plasma TG levels.
rz-0.78 Parameters are: (A) zonalpeak elution volumes; (B)CE-to-protein weight ratios;
% (C) CE-to-TG weight ra-tios; and (D) diameters of
r -0.78 the main LDLs. A, normalsubjects; ., untreated HTGsubjects; o, bezafibrate-
* treated subjects. The r val-ues are for the HTGun-
(rmg/dl) treated and normal groups.
NI oI- rU -a I
Ec0cDCl
SI
UsC
0VI.04
|d, l Group IIIa0.03 '- (TG =890)
0~~~~~~~~~~~~~~~~~~~~~~~~~~~~~~~~~~10.09
eGroup IIIb(TG=2060)
0.06
0.03
0 100 200 300 100 500 0 100 200 300 400 500Zonal Rotor Effluent (ml )
Figure 4. Zonal ultracentrifugate elution profiles of lipoproteins fromnormal and HTGsubjects (-) and from HTGsubjects after 4 wkof bezafibrate treatment (- -). In the left column are LDL elutionprofiles; in the right column are HDL elution profiles (see Methods).Elution profiles of HTGsubjects (b-e) represent the categories de-scribed in Results, and a presents the profile of a normal subject. Therange of the elution volume can be 75-175 ml of the effluent volumefor IDL, 175-350 ml for LDL, 75-150 ml for HDL2, and 150-375ml for HDL3, as indicated in a.
most measured data have not changed much supports the con-cept that most abnormalities indeed reflect the degree of tri-glycerides or the basic metabolic pathways that are responsiblefor the HTGstate. HTG-VLDL is depleted of apoproteins andTGs and is enriched in CEs and free cholesterol. While the lowprotein content may reflect a predominance of lighter VLDLpopulations (1, 33-36), this possibility fails to explain the lipidabnormalities. In fact, light and large VLDL contain more TGsand less cholesterol (free and ester) than does small and denseVLDL. For similar considerations, our data cannot be explainedby contamination of the VLDLwith chylomicrons; chylomicronscontain more TGs and less cholesterol than does VLDL (37).Wetherefore conclude that the abnormal lipid composition ofHTG-VLDL must reflect a metabolic defect related to the stateof HTGand not merely a changing subpopulation distribution.This conclusion is supported by the observation that these ab-normalities diminish with the reduction of HTGby bezafibratetreatment.
Several abnormalities were identified in the LDL fraction.In addition to the high TG and low TC content reported pre-viously in LDL from severely HTGsubjects (13, 14), we foundhigh apoprotein content, low free cholesterol and CE content,higher hydrated density, and smaller diameter of the main LDLfractions. Similar results were recently reported by Vakakis etal. while studying a group of HTGsubjects from the Framinghamcohort (38). In the present investigation, we show that all theseabnormalities are strongly and significantly related to the degreeof triglyceridemia and are potentially reversible when plasmaTGlevels are reduced. Strong relationships between plasma TGlevels and TC-to-TG ratios in LDL (39) and HDL(39, 40) havealso been described in populations where the majority of thesubjects are NTGs. Free and esterified cholesterol, however,were not separated in these studies.
Bezafibrate treatment caused an increase in all LDL con-stituents except TGs. Similar observations were reported during
477 Abnormal VLDL, LDL, and HDL in Hypertriglyceridemia
(3
Figure 6. Electron micrographs of normal LDLand main peak HTG-LDLs before and after 4 wkof bezafibrate treatment. Normal LDL (A): mainLDL of a group I subject before (B) and during(C) bezafibrate treatment. Main LDL of a groupII subject before (D) and during (E) bezafibratetreatment. Main LDL of a group III subject be-fore (F) and during (G) bezafibrate treatment.
treatment of HTGpatients with clofibrate (41, 42). The increaseof LDL protein and apo B levels indicates an increased numberof LDL particles. Bezafibrate has been reported to cause anincreased LDL-receptor activity and to decrease LDL in patientswith normal plasma TGlevels (e.g., type IIA hyperlipoprotein-emia) (43). This effect of bezafibrate is expected to reduce HTG-LDL levels, contrary to our findings. It therefore appears thatbezafibrate also increases LDL production, which in physiologic
terms reflects increased VLDL-to-LDL conversion (1, 2). In-complete VLDL-to-LDL conversion in HTG(of any type) hasbeen reported in almost all VLDL-apo B turnover studies con-ducted in such patients (44 48). Bezafibrate treatment apparentlycorrects this defect, at least in part. This phenomenon may alsoreflect the state of HTGand the abnormal distribution of core-lipids between TG-rich lipoproteins and CE-rich lipoproteins(discussed below). It is proposed that in HTG, VLDL particles
478 S. Eisenberg, D. Gavish, Y Oschry, M. Fainaru, and R. J Deckelbaum
)

350wE' 3006
E 250#Uw 200
a.
0..0 -
._
w0,- 0.30-
u 0.20
600i
5.00 -
( 44.00-
_ 3.00U 2.00
1.00
021
A0
0 r- 0.71
II II I
- B £ ArA--074-AA 00.0
80 ,oo
0
I*
C 0o r=-o.85A
A 0A C6' 0
0 %
° 0, ,,.1 I,, ,ll
50 100 200 500 1000 2000 5000Plasma Triglyceride (mg/dl)
Figure 7. The relationship of individual HDL parameters to plasmaTG levels. Parameters are (A) zonal peak elution volumes; (B) CE-to-protein weight ratios; and (C) CE-to-TG weight ratios. A, normalsubjects; *, untreated HTGsubjects; o, bezafibrate-treated subjects.The r values are for the HTGuntreated and normal groups.
contain surplus CE molecules and therefore cannot completethe VLDL - IDL - LDL conversion process. As we describedin an abstract, this indeed is the case for most, if not all, largeand light HTG-VLDL populations (49).
The abnormalities found in the HDLsystem are similar tothose of LDL, i.e., the HDLbelongs predominantly to the small,heavier HDL3 subpopulation and is TG and protein rich andCE poor. Dense HDL populations have previously been de-scribed in HTG(50). The present study demonstrates that theappearance of such HDL populations depends at least in part
0 40 ;
140
E 130
4L E 120
5
4
3
Table V. Effect of Bezafibrate Treatmenton Heparin-Releasable Plasma Lipases
LPL LPL HTGL
%of jAmol FA/ml gimol FA/mlPHLA per h per h
HTG, untreated 36.6±3.7 3.4±0.57 4.6±1.02HTG, treated 48.1±4.5 8.9±1.37* 9.8±1.41*NTG 26.3±3.5 8.8±0.84* 25.2±3.32*
Data are mean±SEMof 16 HTGpatients before (untreated) and 4wk after initiation of bezafibrate treatment (treated), and of 7 NTGsubjects. LPL, lipoprotein lipase; PHLA, post-heparin plasma Lipo-lytic activity; HTGL, hepatic triglyceride hydrolase, FA, fatty acids.* P < 0.001, unpaired t test.
on the degree of triglyceridemia and that it is partially reversiblewhen plasma TG levels are reduced. Bezafibrate caused an in-crease of HDL mass and HDL-C levels with only a minimalchange of plasma apo A-I levels. This probably reflects the in-creased lipoprotein lipase activity caused by bezafibrate. Nu-merous studies have demonstrated that HDL-C levels are directlyrelated to the activity of the lipoprotein lipase system (4, 5),owing to the higher transfer of surface remnants from lipolyzedTG-rich lipoproteins to HDL (6, 51). The effects of the lipaseon apo A-I are presumably less dominant.
Our data indicate that decreased plasma lipase activity isan important factor that determines the presence and degree ofHTG. This conclusion agrees with previous reports (52, 53) andwith the concept that in humans TGproduction rates vary andthe degree of triglyceridemia depends on the removal mecha-nisms (54, 55). Decreased lipase activity explains some of our
111{J)
w-j E
'U 1'
to
0
4>IE
Figure 8. The effect of be-zafibrate on HDL choles-
i terol, plasma apo A-I, andthe apo A-I/HDL-C ratioduring 12 wk of bezafibratetreatment. Values indicatethe mean and SEMvaria-tions.
50r
40
30
20
10
0
-0
.0
-0
Intreated Treated Normal lUtreated TreatedHT6 HTS IST HTS
Figure 9. The activities of heparin-releasable lipoprotein lipase (left)and hepatic TG lipase (right) in normal subjects (o), untreated HTGsubjects (A), and HTGsubjects after 4 wk of bezafibrate treatment(A). Dashed line (--- -) and shaded areas indicate the mean and SEMvariations.
479 Abnormal VLDL, LDL, and HDL in Hypertriglyceridemia
I0
0,a:0
CI
0 1 2 4 8weeks
0
observations, for example the high VLDL levels, the high TGlevels in LDL and HDL and their reduction with treatment,and the increased lipase activity. Yet all other observations can-not be directly related to the lipase system, although they arestrongly and linearly related to the plasma TGlevels. Therefore,in HTG, another metabolic activity must be present to accountfor high CE (and free cholesterol) content in VLDL, low CEcontent in LDL and HDL, very high CE/protein ratios in VLDL,very low ratios in LDL and HDL, and for the presence of bothLDL and HDLas abnormally dense and small populations. Amechanism that may explain some of these abnormalities is theactivity of plasma core lipid transfer proteins. These proteinsare known to initiate a transfer of CEs from LDL and HDLtochylomicrons and VLDL, and of TGs in the opposite direction(12, 56-59). Such transfers are readily demonstrated in vitroand are related to the mass ratio between VLDL and LDL orHDLand to the duration of the incubation (56-59) and maybe even more pronounced in vivo. Thus, the presence of a largeand slowly metabolized HTG-VLDL mass should entail an ex-cessive transfer of CE to VLDL and of TG to LDL and HDL.This agrees well with our observation that the core-lipid com-positional changes are highly correlated with plasma TGlevels.Furthermore, the increased density and decreased size of LDLand HDLcan also be related to the core-lipid transfer reaction.Wesuggest that transferred TGs can be hydrolyzed by plasmalipases, yielding populations that gradually become smaller andheavier than normal. It has been demonstrated that LDL TGs,either transferred in vitro (56) or in LDL isolated from plasma(60), are slowly hydrolyzed by both lipoprotein lipase and hepaticlipase preparations. Bezafibrate, by enhancing lipoprotein lipase,speeds the metabolism of VLDL and reduces its plasma mass.This results in decreased core-lipid transfer and the appearanceof normalized lipoprotein populations. Moreover, with the re-duction of plasma TGlevels, fewer CEs are transferred to VLDLand more particles can be successfully converted to LDL viathe VLDL IDL - LDL cascade. Although the pathwaydiscussed above explains most of the abnormalities found inHTG-LDL, it fails to explain the presence of multiple LDLfractions and the low free-cholesterol content of the lipoprotein.The increased free cholesterol content of HTG-VLDL also re-mains unexplained.
The abnormalities of the lipoprotein system discussed abovehave important metabolic implications and are potentially ath-erogenic. The main metabolic consequence is related to theabnormal distribution of cholesterol among lipoprotein classes.Regression analysis demonstrates that even with moderate tri-glyceridemia (e.g., TGlevels of 500 mg/dl), LDL particles containonly 50% of the amount of cholesterol (predominantly esterified,but also free) present in N-LDL, with TG levels of 100 mg/dl(footnote 2). Upon catabolism, the amount of cholesterol that
2. The regression parameters shown in Table IV allow calculations ofthe amounts of CEin LDL particles. The equation for CE/protein (3.63-0.83 log TG) predicts a weight ratio of 1.98 at plasma TG levels of 100mg/dl, and of 1.40 at 500 mg/dl, or a decrease to 71%. The decreasein core volume, derived from the relationship between diameter and
leaves the plasma with such HTG-LDL particles is also one halfthat degraded with NTG-LDL. The degradation of HTG-LDLparticles, therefore, will cause less down-regulation of the LDL-receptor and some increased catabolism of LDL, as reportedin HTG(46, 61). In spite of this increased fractional catabolicrate of LDL, it is predicted that the exit of cholesterol from theplasma with this lipoprotein is substantially lower than in NTG.(If cholesterol degradation with LDL becomes normalized, LDL-receptor activity will also be decreased, and the accelerated LDLcatabolism will be inhibited.) Similar considerations lead to theconclusion that the exit of cholesterol from plasma with HDLis also decreased in HTGsubjects. A great deal of cholesterolmust then be cleared from the patients' plasma through pathwaysthat are unrelated to either LDL or HDLcatabolism. It is sug-gested that this cholesterol exits with the CE- and free-cholesterol-rich VLDL particles. Because such particles are unable to com-plete the VLDL-to-LDL conversion pathway, they must be de-graded directly, in the form of VLDL or VLDL remnants. Theclearance of cholesterol from plasma via the LDL receptor iscurrently thought to provide protection against atheroscleroticprocess (62). The exit of cholesterol from plasma with VLDLor IDL through other pathways, as described recently by Gian-turko et al. (63) is, in contrast, potentially atherogenic.
Acknowledgments
The excellent technical assistance of Ms. R. Avner and Ms. H. Lefkovitzis greatly appreciated.
This study was supported in part by a grant from the U. S. PublicHealth Service (HL 28017).
References
1. Eisenberg, S., D. W. Bilheimer, R. I. Levy, and F. T. Lindgren.1973. On the metabolic conversion of human plasma very low densitylipoprotein to low density lipoprotein. Biochim. Biophys. Acta. 326:361-377.
2. Eisenberg, S., and R. I. Levy. 1975. Lipoprotein metabolism. Adv.Lipid Res. 13:1-89.
3. Nikkila, E. A., M. R. Taskinen, and M. Kekki. 1978. Relationof plasma high-density lipoprotein cholesterol to lipoprotein-lipase activityin adipose tissue and skeletal muscle of man. Atherosclerosis. 29:497-501.
4. Kekki, M. 1980. Lipoprotein-lipase action determining plasmahigh density lipoprotein cholesterol level in adult normolipaemics. Ath-erosclerosis. 37:143-150.
5. Kuusi, T., E. A. Nikkila, P. Saarinen, P. Varjo, and L. A. Laitinen.1982. Plasma high density lipoproteins HDL2, HDL3 and postheparinplasma lipases in relation to parameters of physical fitness. Atherosclerosis.41:209-219.
6. Patsch, J. R., A. M. Gotto, Jr., T. Olivecrona, and S. Eisenberg.1978. Formation of high density lipoprotein2-like particles during lipolysisof very low density lipoproteins in vitro. Proc. Nail. Acad. Sci. USA.75:4519-4523.
plasma TG levels (276.9-31.8 log TG), is to 64%. When both effectsare combined, it is calculated that the amount of CEs in the CE-poor,small HTG-LDL at plasma TG levels of 500 mg/dl is 46% that at 100mg/dl.
480 S. Eisenberg, D. Gavish, Y. Oschry, M. Fainaru, and R. J. Deckelbaum
7. Glomset, J. A. 1968. The plasma lecithin:cholesterol acyltransferasereaction. J. Lipid Res. 9:155-167.
8. Zilversmit, D. B., L. B. Hughes, and J. Balmer. 1975. Stimulationof cholesterol ester exchange by lipoprotein-free rabbit plasma. Biochim.Biophys. Acta. 409:393-398.
9. Chajek, T., and C. J. Fielding. 1978. Isolation and characterizationof a human serum cholesterol ester transfer protein. Proc. Natl. Acad.Sci. USA. 75:3445-3449.
10. Morton, R. E., and D. B. Zilversmit. 1982. Purification andcharacterization of lipid transfer protein(s) from human lipoprotein-deficient plasma. J. Lipid Res. 23:1058-1067.
11. Ihm, J., J. L. Ellsworth, B. Chataing, and J. A. K. Harmony.1982. Plasma protein-facilitated coupled exchange of phosphatidylcholineand cholesteryl ester in the absence of cholesterol esterification. J. Biol.Chem. 257:4818-4827.
12. Hopkins, G. J. and P. J. Barter. 1980. Transfers of esterifiedcholesterol and triglyceride between high density and very low densitylipoproteins: in vitro studies of rabbits and humans. Metab. Clin. Exp.29:546-550.
13. Breckenridge, W. C., J. A. Little, G. Steiner, A. Chow, and M.Poapst. 1978. Hypertriglyceridemia associated with deficiency of apo-lipoprotein C-II. NewEngl. J. Med. 298:1265-1273.
14. Miller, N. E., S. N. Rao, P. Alaupovic, N. Noble,J. Slack, J. D. Brunzell, and B. Lewis. 1981. Familial apolipoproteinCII deficiency: plasma lipoproteins and apolipoproteins in heterozygousand homozygous subjects and the effects of plasma infusion. Eur. J.Clin. Invest. 11:69-76.
15. Fredrickson, D. S., R. I. Levy, and F. T. Lindgren. 1968. Acomparison of heritable abnormal lipoprotein patterns as defined bytwo different techniques. J. Clin. Invest. 47:2446-2457.
16. Kaufmann, N. A., Y. Friedlander, S.-T. Halfon, P. E. Slater,B. H. Dennis, D. McClish, S. Eisenberg, and Y. Stein. 1982. Nutrientintake in Jerusalem-Consumption in adults. Isr. J. Med. Sci. 18:1183-1197.
17. Lipid Research Clinics Program: Manual of Laboratory Oper-ations. 1976. Vol. I. Lipid and lipoprotein analysis. Department of Health,Education and Welfare-NIH Publication No. 76-628. U. S. GovernmentPrinting Office, Washington, DC. 9-37.
18. Havel, R. J., A. H. Eder, and J. H. Bragdon. 1955. The distributionand chemical composition of ultracentrifugally separated lipoprotein inhuman serum. J. Clin. Invest. 34:1345-1353.
19. Patsch, J. R., S. Sailer, G. Kostner, F. Sandhofer, A. Holasek,and H. Braunsteiner. 1974. Separation of the main lipoprotein densityclasses from human plasma by rate-zonal centrifugation. J. Lipid Res.15:356-366.
20. Oschry, Y., and S. Eisenberg. 1982. Rat plasma lipoproteins: re-evaluation of a lipoprotein system in an animal devoid of cholesterylester transfer activity. J. Lipid Res. 23:1099-1106.
21. Lowry, 0. H., N. J. Rosebrough, A. L. Farr, and R. J. Randall.1951. Protein measurement with the Folin phenol reagent. J. Biol. Chem.193:265-275.
22. Bartlett, G. R. 1959. Phosphorus assay in column chromatog-raphy. J. Biol. Chem. 234:466-468.
23. Patsch, W., J. R. Patsch, G. M. Kostner, S. Sailer, and H. Braun-steiner. 1978. Isolation of subfractions of human very low density li-poproteins by ultracentrifugation. J. Biol. Chem. 253:4911-4915.
24. Weber, K., and M. Osborn. 1969. The reliability of molecularweight determinations by dodecyl sulfate-polyacrylamide gel electro-phoresis. J. Biol. Chem. 244:4406-4412.
25. Fainaru, M., R. Deckelbaum, and M. S. Golbus. 1981. Apoli-
poproteins in human fetal blood and amniotic fluid in mid-trimesterpregnancy. Prenatal Diagn. 1: 125-129.
26. Fainaru, M., M. C. Glangeaud, and S. Eisenberg. 1975. Ra-dioimmunoassay of human high density lipoprotein A-I. Biochim. Bio-phys. Acta. 386:432-443.
27. Huttunen, J. K., C. Ehnholm, P. J. Kinnunen, and E. A. Nikkila.1975. An immunochemical method for selective measurement of twotriglyceride lipases in human postheparin plasma. Clin. Chim. Acta.63:335-349.
28. Wallinder, L., G. Bengtsson, and T. Olivecrona. 1979. Guineapig very low density lipoproteins are a good substrate for lipoproteinlipase. Biochim. Biophys. Acta. 575:458-462.
29. Bengtsson, G., and T. Olivecrona. 1977. Interaction of lipoproteinlipase with heparin-sepharose evaluation of conditions for affinity binding.Biochem. J. 167:109-120.
30. Hill, A. B. 1971. Principles of Medical Statistics. 9th ed. LancetLtd., London. 143-151, 317, and 376.
31. Fellin, R., S. Martini, G. Crepaldi, U. Senin, E. Mannarino, G.Avellone, A. Notarbartolo, A. Capurso, C. d'Agostino, U. Montaguti,D. Celin, G. C. Descovich, and E. Mantovani. 1981. Multicenter trialwith bezafibrate in primary hyperlipidemias. Curr. Ther. Res. Clin. Exp.29:657-666.
32. Vessby, B., H. Lithell, and H. Ledermann. 1982. Elevated li-poprotein lipase activity in skeletal muscle tissue during treatment ofhypertriglyceridaemic patients with bezafibrate. Atherosclerosis. 44:113-118.
33. Lossow, W. J., F. T. Lindgren, J. C. Murchio, G. R. Stevens,and L. C. Jensen. 1969. Particle size and protein content of six fractionsof the Sf > 20 plasma lipoproteins isolated by density gradient centrif-ugation. J. Lipid Res. 10:68-76.
34. Hazzard, W. R., F. T. Lindgren, and E. L. Bierman. 1970. Verylow density lipoprotein subfractions in a subject with broad-beta disease(type III hyperlipoproteinemia) and a subject with endogenous lipemia(type IV). Chemical composition and electrophoretic mobility. Biochim.Biophys. Acta. 202:517-525.
35. Sata, T., R. J. Havel, and A. L. Jones. 1972. Characterizationof subfractions of triglyceride-rich lipoproteins separated by gel chro-matography from blood plasma of normolipemic and hyperlipemic hu-mans. J. Lipid Res. 13:757-768.
36. Kuchinskiene, Z., and L. A. Carlson. 1982. Composition, con-centration, and size of low density lipoproteins and of subfractions ofvery low density lipoproteins from serum of normal men and women.J. Lipid Res. 23:762-769.
37. Schaefer, E. J., M. G. Wetzel, G. Bengtsson, R. 0. Scow, H. B.Brewer, Jr., and T. Olivecrona. 1982. Transfer of human lymph chy-lomicron constituents to other lipoprotein density fractions during invitro lipolysis. J. Lipid Res. 23:1259-1273.
38. Vakakis, N., T. G. Redgrave, D. M. Small, and W. P. Castelli.1983. Cholesterol content of red blood cells and low-density lipoproteinsin hypertriglyceridemia. Biochim. Biophys. Acta. 751:280-285.
39. Myers, L. H., N. R. Phillips, and R. J. Havel. 1976. Mathematicalevaluation of methods for estimation of the concentration of the majorlipid components of human serum lipoproteins. J. Lab. Clin. Med.88:491-505.
40. Phillips, N. R., R. J. Havel, and J. P. Kane. 1982. Serum apo-lipoprotein A-I levels. Relationship to lipoprotein lipid levels and selecteddemographic variables. Am. J. Epidemiol. 116:302-313.
41. Nichols, A. V., E. H. Strisower, F. T. Lindgren, G. L. Adamson,and E. L. Coggiola. 1968. Analysis of change in untracentrifugal lipo-protein profiles following heparin and ethyl-p-chlorophenoxyisobutyrateadministration. Clin. Chim. Acta. 20:277-283.
481 Abnormal VLDL, LDL, and HDL in Hypertriglyceridemia

42. Wilson, D. E., and R. S. Lees. 1972. Metabolic relationshipsamong the plasma lipoproteins. Reciprocal changes in the concentrationsof very low and low density lipoproteins in man. J. Clin. Invest. 51:1051-1057.
43. Stewart, J. M., C. J. Packard, A. R. Lorimer, D. E. Boag, andJ. Shepherd. 1982. Effects of bezafibrate on receptor-mediated and re-ceptor-independent low density lipoprotein catabolism in type II hy-perlipoproteinaemic subjects. Atherosclerosis. 44:355-365.
44. Berman, M., M. Hall III, R. I. Levy, S. Eisenberg, D. W. Bilheimer,R. D. Phair, and R. H. Goebel. 1978. Metabolism of apoB and apoClipoproteins in man: kinetic studies in normal and hyperlipoproteinemicsubjects. J. Lipid Res. 19:38-56.
45. Sigurdsson, G., A. Nicoll, and B. Lewis. 1976. The metabolismof low density lipoprotein in endogenous hypertriglyceridaemia. Eur.J. Clin. Invest. 6:151-158.
46. Sigurdsson, G., A. Nicoll, and B. Lewis. 1976. Metabolism ofvery low density lipoproteins in hyperlipidaemia: studies of apolipoproteinB kinetics in man. Eur. J. Clin. Invest. 6:167-177.
47. Reardon, M. F., N. H. Fidge, and P. J. Nestel. 1978. Catabolismof very low density lipoprotein B apoprotein in man. J. Clin. Invest.61:850-860.
48. Kissebah, A. H., S. Alfarsi, and P. W. Adams. 1981. Integratedregulation of very low density lipoprotein triglyceride and apolipoprotein-B kinetics in man: normolipemic subjects, familial hypertriglyceridemiaand familial combined hyperlipidemia. Metab. Clin. Exp. 30:856-868.
49. Oschry, Y., E. Eisenberg, R. Deckelbaum, and T. Olivecrona.1982. Is hypertriglyceridemic very low density lipoprotein a precursorof normal low density lipoprotein? Arteriosclerosis. 2:442a. (Abstr.)
50. Patsch, J. R., and A. M. Gotto. 1979. Separation and analysisof HDL subclasses by zonal ultracentrifugation. In Report of the HighDensity Lipoprotein Methodology Workshop. Department of Health,Education and Welfare-NIH Publication No. 79-1661. U. S. GovernmentPrinting Office, Washington, DC. 310-324.
51. Tall, A. R., and D. M. Small. 1978. Current concepts: plasmahigh-density lipoproteins. NewEngl. J. Med. 299: 1232-1236.
52. Huttunen, J. K., C. Ehnholm, M. Kekki, and E. A. Nikkila.1976. Post-heparin plasma lipoprotein lipase and hepatic lipase in normalsubjects and in patients with hypertriglyceridaemia: correlation to sex,age and various parameters of triglyceride metabolism. Clin. Sci. Mol.Med. 50:249-260.
53. Boberg, J., M. Boberg, R. Gross, J. D. Turner, J. Augustin, andW. V. Brown. 1979. Hepatic triglyceride and lipoprotein lipase activitiesof post-heparin plasma in normals and hypertriglyceridemics. Ups. J.Med. Sci. 84:215-227.
54. Grundy, S. M., H. Y. I. Mok, L. Zech, D. Steinberg, and M.Berman. 1979. Transport of very low density lipoprotein triglyceridesin varying degrees of obesity and hypertriglyceridemia. J. Clin. Invest.63:1274-1283.
55. Kekki, M. 1980. Plasma triglyceride turnover in 92 adult nor-molipaemic and 30 hypertriglyceridaemic subjects-the effect of age,synthesis rate and removal capacity on plasma triglyceride concentration.Ann. Clin. Res. 12:64-76.
56. Deckelbaum, R. J., S. Eisenberg, Y. Oschry, E. Butbul, I. Sharon,and T. Olivecrona. 1982. Reversible modification of human plasma lowdensity lipoproteins toward triglyceride-rich precursors. J. Biol. Chem.257:6509-6517.
57. Deckelbaum, R., S. Eisenberg, E. Granot, Y. Oschry, and T.Olivecrona. 1982. Core lipid exchange and lipoprotein lipase in modelinghuman high density lipoprotein. Arteriosclerosis. 2:437a. (Abstr.)
58. Barter, P. J., and G. J. Hopkins. 1983. Relative rates of incor-poration of esterified cholesterol into human very low density lipoproteinsand low density lipoproteins. In vitro studies of two separate pathways.Biochim. Biophys. Acta. 751:33-40.
59. Marcel, Y. L., C. Vezina, and R. W. Milne. 1983. Cholesterylester and apolipoprotein E transfer between human high density lipo-proteins and chylomicrons. Biochim. Biophys. Acta. 750:411-417.
60. Musliner, T. A., P. N. Herbert, and M. J. Kingston. 1979. Li-poprotein substrates of lipoprotein lipase and hepatic triacylglycerollipase from human post-heparin plasma. Biochim. Biophys. Acta.575:277-288.
61. Janus, E. D., A. M. Nicoll, P. R. Turner, P. Magill, and B. Lewis.1980. Kinetic bases of the primary hyperlipidaemias: studies of apoli-poprotein B turnover in genetically defined subjects. Eur. J. Clin. Invest.10:161-172.
62. Goldstein, J. L., and M. S. Brown. 1982. Lipoprotein receptors:genetic defense against atherosclerosis. Clin. Res. 30:417-426.
63. Gianturco, S. H., A. M. Gotto, Jr., S. L. C. Hwang, J. B. Karlin,A. H. Y. Lin, S. C. Prasad, and W. A. Bradley. 1983. ApolipoproteinE mediates uptake of Sf 100-400 hypertriglyceridemic very low densitylipoproteins by the low density lipoprotein receptor pathway in normalhuman fibroblasts. J. Biol. Chem. 258:4526-2533.
482 S. Eisenberg, D. Gavish, Y. Oschry, M. Fainaru, and R. J. Deckelbaum