toward improving the quality of labor force data from the american community survey thomas palumbo...
TRANSCRIPT

Toward Improving the Quality of Labor Force Data from the American Community Survey
Thomas Palumbo
Housing and Household Economic Statistics Division
U.S. Census Bureau
May 11, 2005

2
Labor Force Measurements • Government uses several means to measure the
status of the nation’s labor force activity :• surveys of people (household surveys)• surveys of employers (establishment surveys)• administrative records
• Broadest measures are from household surveys• Since 1940’s: Decennial Census long form/Current
Population Survey (CPS)/American Community Survey
• ACS measurement methods virtually same as those for Census 2000
3
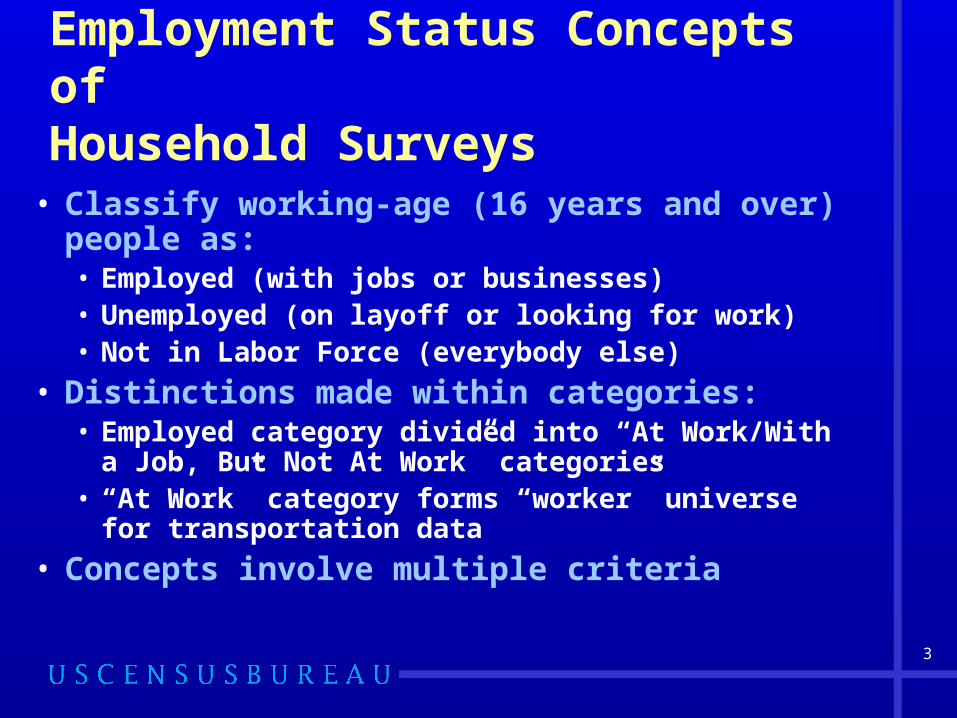
Employment Status Concepts ofHousehold Surveys
• Classify working-age (16 years and over) people as: • Employed (with jobs or businesses)• Unemployed (on layoff or looking for work)• Not in Labor Force (everybody else)
• Distinctions made within categories: • Employed category divided into “At Work/With a
Job, But Not At Work” categories • “At Work” category forms “worker” universe for
transportation data
• Concepts involve multiple criteria
4
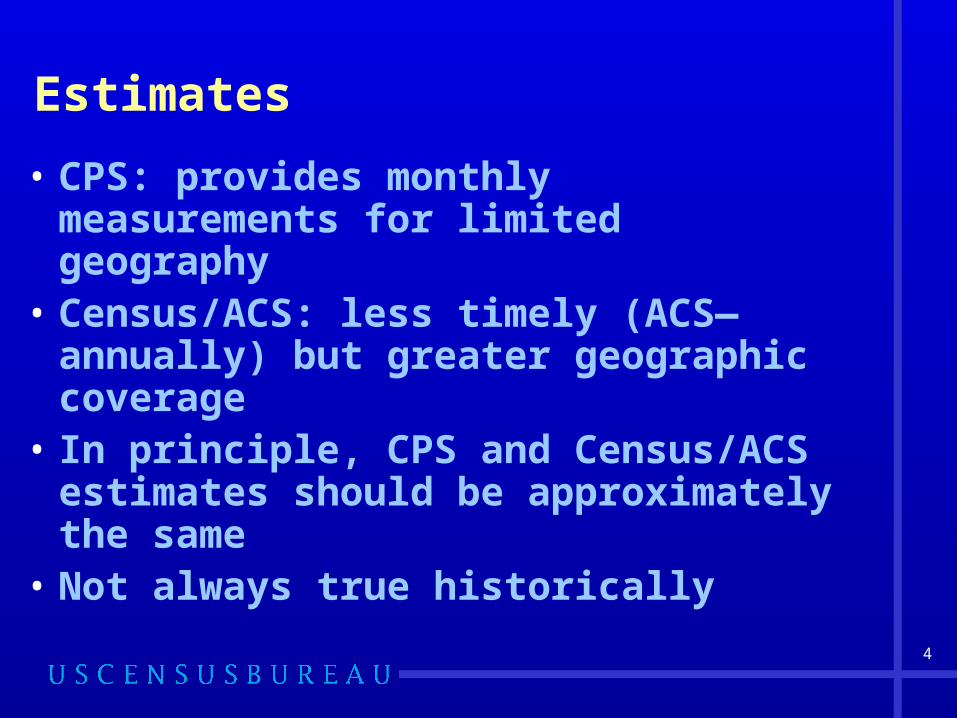
Estimates
• CPS: provides monthly measurements for limited geography
• Census/ACS: less timely (ACS—annually) but greater geographic coverage
• In principle, CPS and Census/ACS estimates should be approximately the same
• Not always true historically
5
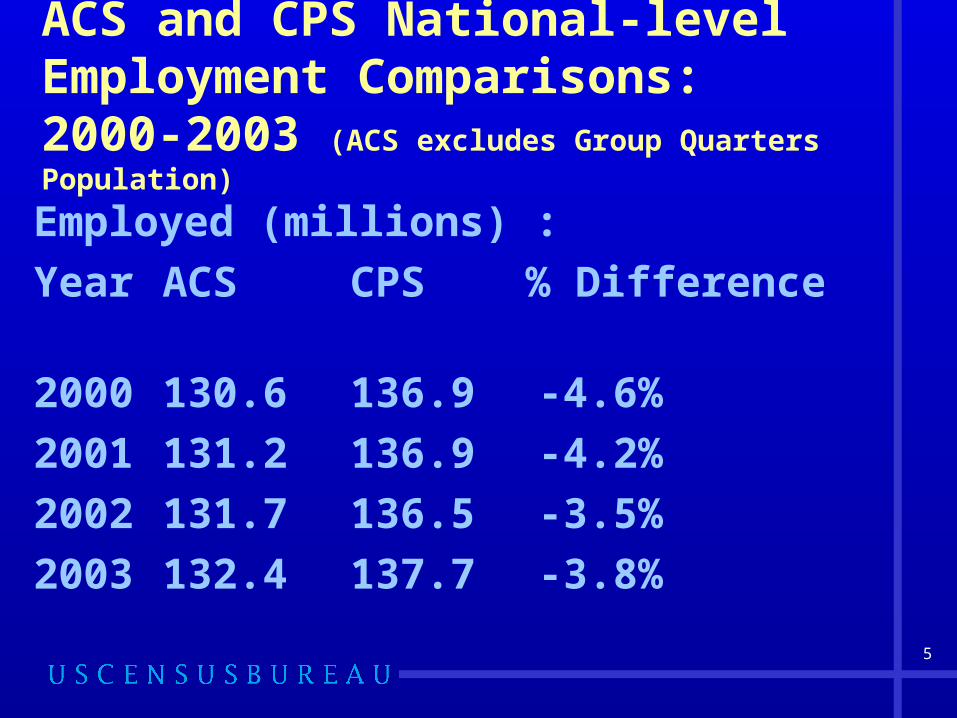
ACS and CPS National-level Employment Comparisons: 2000-2003 (ACS excludes Group Quarters Population)
Employed (millions) :
Year ACS CPS % Difference
2000 130.6 136.9 -4.6%
2001 131.2 136.9 -4.2%
2002 131.7 136.5 -3.5%
2003 132.4 137.7 -3.8%

6
ACS and CPS National-level Unemployment Comparisons: 2000-2003 (ACS excludes Group Quarters Population)
Unemployed (millions): Year ACS CPS % Difference
2000 7.4 5.7 29.8%
2001 8.6 6.8 26.5%
2002 10.6 8.4 26.2%
2003 11.0 8.8 25.0%

7
Decennial Census -- CPS comparisons
• ACS labor force pedigree: modeled after decennial censuses; uses same questions and concepts as Census 2000
• Census has historically underestimated employed people and (since 1990) overestimated unemployed relative to CPS
• Census 2000 gaps larger than ever:• Employed: 5 percent below CPS• Unemployed: 53 percent above CPS

8
Difference in Census and CPS Employed as a Percent of CPS Employed: 1950-2000
-10
-8
-6
-4
-2
0
2
4
1950 1960 1970 1980 1990 2000
Year
Dif
fere
nc
e a
s a
pe
rce
nt
of
CP
S
Total
Male
Female

9
Historical Unemployed gap
Difference in Census and CPS Unemployed as a Percent of CPS Unemployed: 1950-2000
-30
-20
-10
0
10
20
30
40
50
60
1950 1960 1970 1980 1990 2000
Year
Dif
fere
nc
e a
s a
pe
rce
nt
of
CP
S
Total
Male
Female

10
Which is right ?
• CPS is gold standard for household labor force estimates• collected continuously for over 50
years• constant attention to quality
• CPS should surpass accuracy of ACS
11
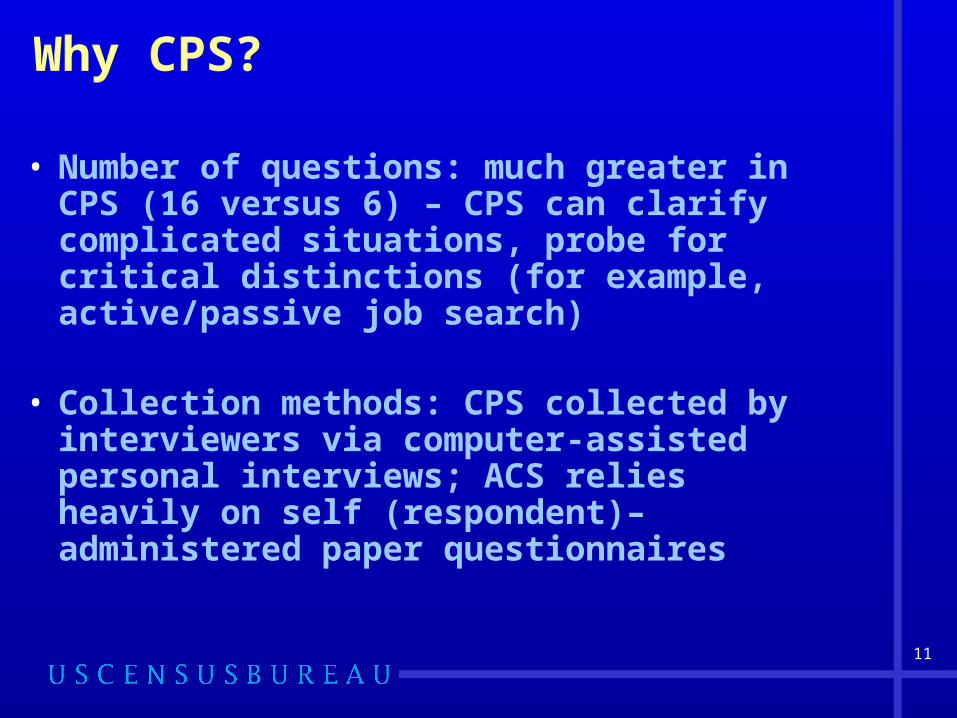
Why CPS?
• Number of questions: much greater in CPS (16 versus 6) – CPS can clarify complicated situations, probe for critical distinctions (for example, active/passive job search)
• Collection methods: CPS collected by interviewers via computer-assisted personal interviews; ACS relies heavily on self (respondent)–administered paper questionnaires

12
What to do about the gaps
• Focus was on ways to identify and eliminate sources of bias in the ACS• Many potential sources• Control over questions, edits, and imputations
only
• Census 2000 studies suggested likely presence of flaws in the questions
• Census Bureau asked OMB for permission to revise the questions
• OMB set up committee of federal-agency stakeholders
13
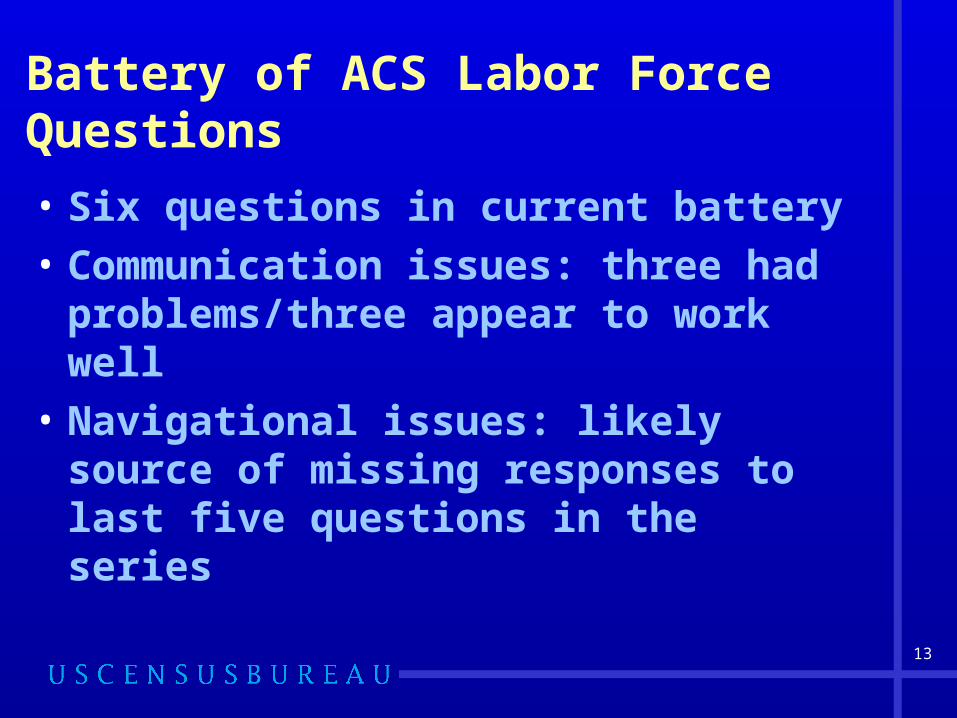
Battery of ACS Labor Force Questions
• Six questions in current battery
• Communication issues: three had problems/three appear to work well
• Navigational issues: likely source of missing responses to last five questions in the series

14
Primary Finding
• Communication problems with the “Work Last Week” Question
• Divides working-age population into “workers/non-workers”
• Relatively low failure rate can reduce employed category and significantly inflate unemployed category

15
“LAST WEEK, did this person do any work for either pay or profit?”Failure to communicate meaning of “work” :• “for pay or profit” confusing to irregular
workers• “any work” confusing to people with regular
jobs or businesses• “profit” confusing to people with jobs (as
opposed to businesses)• retired people: think question not applicable;
or applies only to pre-retirement work
16
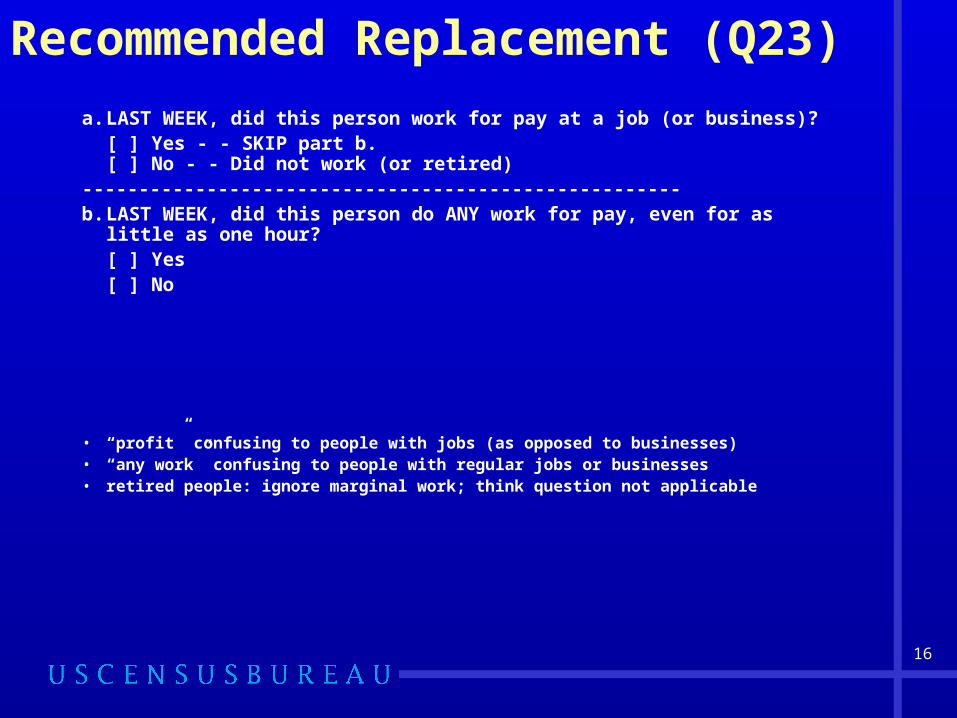
Recommended Replacement (Q23)
a. LAST WEEK, did this person work for pay at a job (or business)?[ ] Yes - - SKIP part b.[ ] No - - Did not work (or retired)
-----------------------------------------------------b. LAST WEEK, did this person do ANY work for pay, even for as little as
one hour?[ ] Yes[ ] No
• “profit” confusing to people with jobs (as opposed to businesses)• “any work” confusing to people with regular jobs or businesses• retired people: ignore marginal work; think question not applicable
17
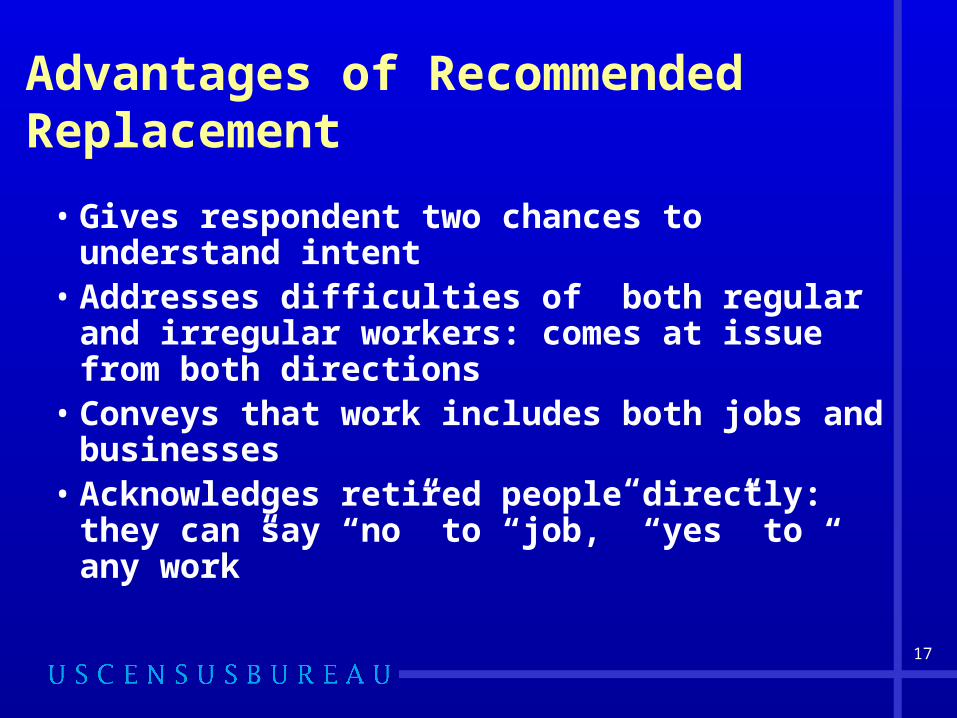
Advantages of Recommended Replacement
• Gives respondent two chances to understand intent
• Addresses difficulties of both regular and irregular workers: comes at issue from both directions
• Conveys that work includes both jobs and businesses
• Acknowledges retired people directly: they can say “no” to “job,” “yes” to “ any work”

18
Worker Universe• Work Last Week question also used to
make At work/Not at work distinction• Creates special “worker” universe for
transportation data• ACS has slightly higher proportion of
employed people who are “at work” than CPS: ACS 97%; CPS 95-96 %
• Not sure how revisions to question will affect special “worker” universe – something to consider in evaluations
19
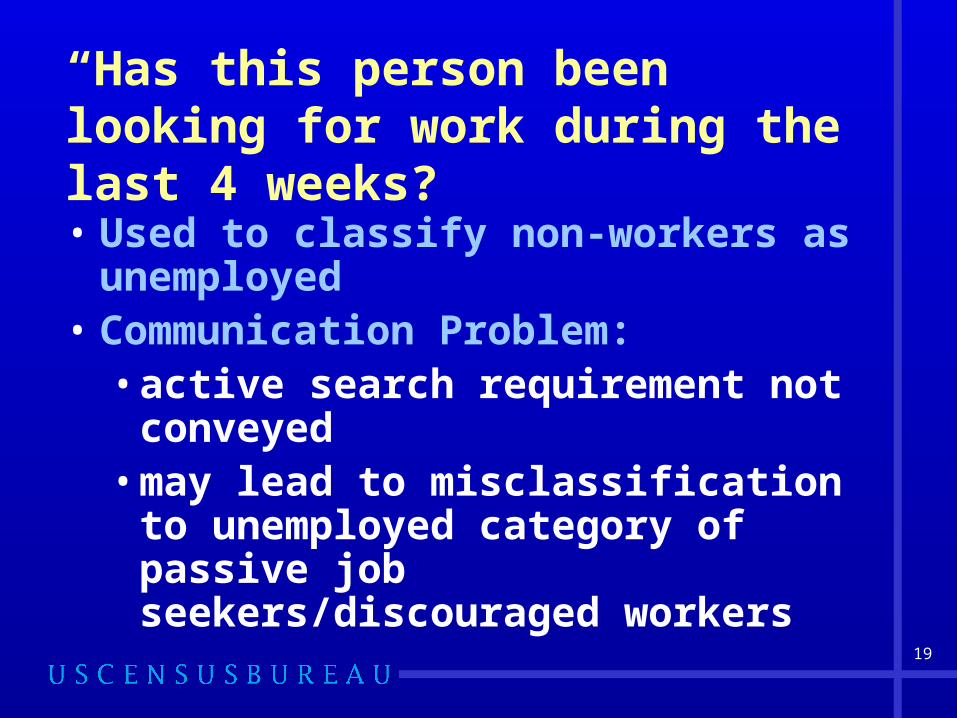
“Has this person been looking for work during the last 4 weeks?
• Used to classify non-workers as unemployed
• Communication Problem:• active search requirement not
conveyed • may lead to misclassification to
unemployed category of passive job seekers/discouraged workers
20
Recommended Replacement (Q30)
During the LAST 4 WEEKS, has this person been ACTIVELY looking for work? [ ] Yes [ ] No

21
Navigational Issues• Respondent must encounter each applicable
question in proper order: purpose of skip instructions
• Journey-to-work questions break up continuity of labor force questions
• Some evidence that they interfere with progression of non-workers to the unemployment/not in labor force questions
• Result: need to impute labor force status as unemployed or not in the labor force
• Potential solution: improve questionnaire design

22
Next Steps• Test new set of questions in the 2006 Content
Test• Control will be current set of questions• Primary survey and a follow-up survey• Use primary-survey data to compare non-
response rates and frequency distributions • Use follow-up survey to measure response bias
and response variance• If new questions are successful, we will ask OMB
for authorization to use them in the 2008 ACS.

23
References• Census 2000 Evaluation Study B.7, Accuracy of
Data as Measured by the CPS-Census 2000 Match, at: http://www.census.gov/pred/www/rpts/B.7%20Final%20Report.pdf
• Census 2000 Auxiliary Study B.8, Comparing Employment, Income, and Poverty:Census 2000 and the Current Population Survey, at: http://www.census.gov/hhes/www/laborfor/final2_b8_nov6.pdf
• ACS Evaluations: http://www.census.gov/acs/www/AdvMeth/index.htm
• ACS homepage: http://www.census.gov/acs/www/

24
For more information:
Tom Palumbo,
301-763-3230
Sandra Clark,
301-763-3230