toward better global poverty measures
TRANSCRIPT

Toward Better Global Poverty
Measures
Martin Ravallion
Georgetown University
1
Presentation at WIDER 30th annual conference, Helsinki,
September 2015

Poverty monitoring must be socially relevant
• An approach to measurement that is out of step with social thought and the aims of social policy will become irrelevant.
• The current focus on counting the poor relative to a fixed absolute line needs to be complemented by new measures.
2

The “elephant in the room:”
Social effects on welfare

Social effects on welfare
• Poverty measures that use a constant real line do not take account of the concerns people face about relative deprivation, shame and social exclusion. These are specific to place and time.
• The overriding principle: poverty is absolute in the space of welfare: “…an absolute approach in the space of capabilities translates into a relative approach in the space of commodities” (Amartya Sen, 1983)
4

Why do we see higher (real) poverty lines in
richer countries?
5
0
10
20
30
40
50
0.0 0.5 1.0 1.5 2.0 2.5 3.0 3.5 4.0 4.5 5.0
Log private consumption per capita ($PPP per day)
Na
tio
na
l p
ove
rty lin
e (
$P
PP
pe
r d
ay p
er
pe
rso
n)
Luxembourg
USA

Two possible reasons for higher lines in richer
countries
1. Social norms: Richer countries implicitly use a higher reference level of welfare for defining poverty. Then we would want to use a common social standard an absolute line in terms of real income.
2. Social effects: Relative deprivation or rising costs of social inclusion (avoiding shame). Then a relative line is called for if we are to be absolute in the space of welfare.
6
But we do not know which is right!

The big uncertainty about global poverty
• We may never resolve the matter from conventional empirical evidence.
• This uncertainty makes it compelling to consider both approaches when measuring global poverty.
7
Proposed bounds to global poverty
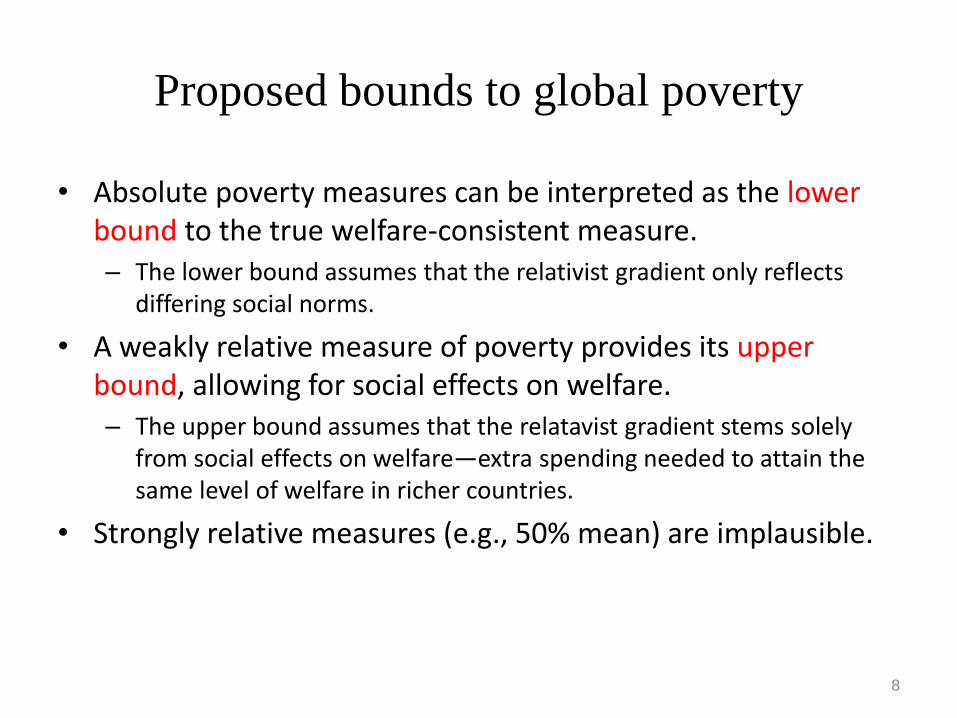
• Absolute poverty measures can be interpreted as the lower bound to the true welfare-consistent measure.– The lower bound assumes that the relativist gradient only reflects
differing social norms.
• A weakly relative measure of poverty provides its upper bound, allowing for social effects on welfare. – The upper bound assumes that the relatavist gradient stems solely
from social effects on welfare—extra spending needed to attain the same level of welfare in richer countries.
• Strongly relative measures (e.g., 50% mean) are implausible.
8

Lower bound + upper bound
Poverty line ($ per
day; 2005 PPP)
Slope=1/2
$1.25/day
$1.25/2
Upper
bound
Excellent fit with data on national lines9
2/]0,25.1$max[25.1$)( itit MMZ
25.1$)( itMZ (lower bound)
(upper)

0
10
20
30
40
50
60
70
1980 1984 1988 1992 1996 2000 2004 2008 2012
Headcount index (% below poverty line)
Upper bound:
absolute + relative
Lower bound:
absolute poverty
Poverty measures for the developing world
10
Rising proportion of relatively poor: 80% of the relatively poor in 1981
were absolutely poor, but by 2008 the
proportion had fallen to under half.

0
500
1000
1500
2000
2500
3000
1981 1984 1987 1990 1993 1996 1999 2002 2005 2008
Number of poor in millions
Numbers of poor
11
Absolutely poor
Relatively poor but not absolutely poor
Two-thirds of the increase in the number of people who are
relatively poor but not absolutely poor is accountable to the
decrease in the number of absolutely poor.
Upper
bound
Lower
bound

Monitoring progress in assuring that
no one is left behind
12
The 2013 U.N. report on setting new development
goals argued that: “the indicators that track them
should be disaggregated to ensure no one is left
behind.”

New trajectory for average household
consumption in the new millennium
Were the poorest left behind?
13
0
1
2
3
4
5
6
1980 1984 1988 1992 1996 2000 2004 2008 2012
Mean consumption per person ($ per person per day)(Developing world)

A widely held view: poorest left behind
• “The poorest of the world are being left behind. We need to reach out and lift them into our lifeboat.” U.N. Secretary-General Ban Ki-moon, 2011
• “Poverty is not yet defeated. Far too many are being left behind.” Guy Ryder, ILO
• And in 2015 the Vatican’s representative to the U.N. reaffirmed that the poorest of the world are being left behind.
14

Yet economists appear to tell a very
different story
• We hear adages such as “a rising tide lifts all boats” or claims that “growth is good for the poor” (Dollar and Kraay) or that there has been a “breakthrough from the bottom” (Radlet).
• Economists have mostly supported this alternative view, drawing on evidence such as this =>
15

16
Reduction in the incidence of absolute
poverty
0
10
20
30
40
50
60
70
80
1980 1984 1988 1992 1996 2000 2004 2008 2012
$2.00
$1.25
$1.00
$0.87
$0.77
$0.67
$0.50
Pe
rce
nta
ge
liv
ing
be
low
ea
ch
lin
e
Note: All in 2005 prices at purchasing power parity

How can we understand these
conflicting views?
17

Assessing progress against poverty 1:
The counting approach
• Arthur Bowley and many others since.
• Theoretical foundations in a large literature, in which various axioms have been proposed.
– Focus, monotonicity, subgroup monotonicity, scale invariance, transfer principle,….
• The counting approach includes counts with unequal weights (such as PG, SPG, Watts)
18

Assessing progress against poverty 2:
The Rawlsian approach
• Focuses on a consumption floor—the lowest expected level of living.
• John Rawls: Maximize advantages of the least advantaged
• If the poorest person sees a gain (loss) then (by definition) the consumption floor must rise (fall).
19

Arguments for studying the floor
• Rights-based approaches to justice
– Justice must be concerned with each citizen not averages
– Rights must be secured for all; none left behind.
• Mahatma Gandhi’s talisman:
– “Recall the face of the poorest and weakest person you have seen and ask if the step you contemplate is going to be any use to them.”
• Social policies also aim to raise the floor above the biological minimum for survival.
– Statutory minimum wage rates: first appeared in late 19th
century in an effort to help raise the consumption floor.
– Basic-income guarantee (BIG): A firm floor. “Right of
citizenship” rather than targeted based on “need.”
– Social policies explicitly aim to raise the floor (Dibao, NREGS)20
The counting approach may miss what is
happening at the floor
21
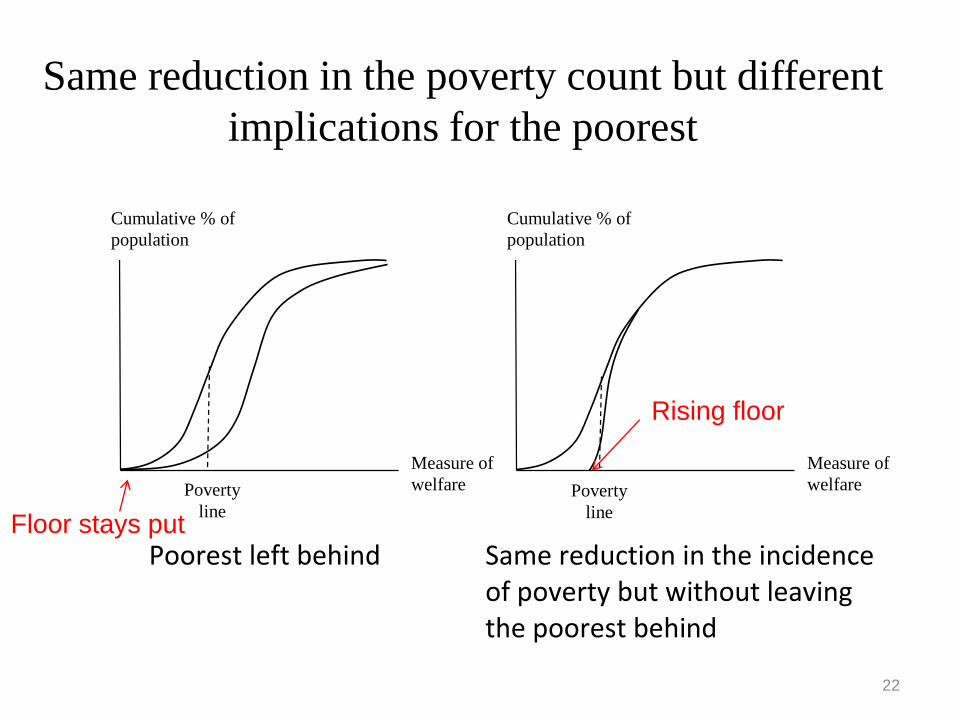
Same reduction in the poverty count but different
implications for the poorest
22
Poorest left behind Same reduction in the incidence of poverty but without leaving the poorest behind
Measure of
welfare
Cumulative % of
population
Measure of
welfare
Cumulative % of
population
Poverty
line
Poverty
line Floor stays put
Rising floor

How can the floor be estimated?
23

We cannot be sure that the lowest
consumption in a survey is the floor
• Identifying the floor as the strict lower bound of the empiricaldistribution of consumption could well be subject to idiosyncratic transient factors.
• We need an approach that is more robust to transient effects and measurement errors, but is still operational.
• Given the uncertainty, a probabilistic approach is called for. However, the weights are positive not normative.
24

Assumptions and main result
• Beyond some critical level of observed consumption there is no longer any chance of being the poorest person in terms of latent permanent consumption.
• For those observed to be living below y* the probability of observed consumption being the true lower bound of permanent consumption falls linearly as observed consumption rises until y* is reached.
• Under these assumptions:
SPG and PG are the Foster-Greer-Thorbecke measures.
25
)/1()( ***min PGSPGyyyE

Focusing on the floor gives a very different
picture to the counting approach
26

Estimated mean floor = $0.67 a day
• With y* = $1.25, $0.67 (averaging all years)
• 95% confidence interval: ($0.47, $0.87).
• This is remarkably close to Lindgren’s (2015) (independent) estimate of the cost of a “barebones basket” of food items.
• Slow growth in the floor—at 0.4% per annum
• And unresponsive to growth in the overall mean consumption.
27
)( min yyE

Much less progress in raising the
consumption floor
28
0
1
2
3
4
5
6
1980 1984 1988 1992 1996 2000 2004 2008 2012
Overall mean for
developing world
Consumption floor: expected level of lowest consumption
Mean consumption ($ per person per day)
$0.67 on average
No sign that the new
Millennium raised the floor

Yes, the poorest have been left behind!Fewer people living near the floor, but little change in the floor
29
0
2
4
6
8
10
12
0 10 20 30 40 50 60 70 80 90 100
Percentile
Ab
so
lute
ga
in 1
98
1-2
01
1 ($
pe
r p
ers
on
pe
r d
ay)
-40
-20
0
20
40
60
80
100
0 2 4 6 8 10 12 14 16 18 20
Pe
rce
nt o
f th
e p
op
ula
tio
n
Consumption or income per person ($ per day, 2005 prices)
1981
2011
Difference (2011-1981)
Long-term perspective: Today’s rich world
• The level of the floor doubled in today’s rich world over 100 years after 1850.
• The annualized rate of growth in the floor over this period in today’s rich world was 0.7%, about double the rate we have seen in the developing world over the last 30 years.
• Compared to the developing world over the last 30 years, today’s rich world over 1850-1950 was slower at reducing poverty by the counting approach but faster at raising the floor.
30
Conclusions: Two additions to the dashboard
of poverty indicators
31

Bounds to the true welfare-consistent measure
• Two global poverty lines are needed—a familiar lower line with fixed purchasing power across countries and a new upper line given by the poverty line that one would expect given the country’s level of average income.
• The true welfare-consistent absolute line lies somewhere between the two bounds.
32

We can also measure our success at leaving no-
one behind
• The floor is not all we care about, but we cannot continue to ignore it in monitoring poverty.
• Our success in assuring that no-one is left behind can be readily monitored from existing data sources under certain assumptions.
• That would also assure more consistency between how we monitor poverty and how we think about social protection policies.
33

Thank you for your attention!
34