toward an integrated model of driver behavior in a ...salvucci/publications/salvucci-trb01.pdf ·...
TRANSCRIPT
Salvucci, Boer, & Liu 1
Toward an Integrated Model of Driver Behavior
in a Cognitive Architecture
Dario D. Salvucci * Erwin R. Boer Andrew Liu
Nissan Cambridge Basic Research Nissan Cambridge Basic Research Man Vehicle Laboratory
Four Cambridge Center Four Cambridge Center Mass. Institute of Technology
Cambridge, MA 02142 USA Cambridge, MA 02142 USA Cambridge, MA 02139 USA
+1 617 374 9669 +1 617 374 9663 +1 617 253 7758
[email protected] [email protected] [email protected]
* = corresponding author
Word count (including abstract, references, and captions): 6432 words + 4 figures
In Press, Transportation Research Record

Salvucci, Boer, & Liu 2
Toward an Integrated Model of Driver Behavior in a Cognitive Architecture
Dario D. Salvucci *, Nissan Cambridge Basic Research, Four Cambridge Center, Cambridge, MA 02142
Erwin R. Boer, Nissan Cambridge Basic Research, Four Cambridge Center, Cambridge, MA 02142
Andrew Liu, Man Vehicle Laboratory, Massachusetts Institute of Technology, Cambridge, MA 02139
* corresponding author ([email protected])
Abstract. Driving is a multitasking activity that requires drivers to manage their attention between various
driving- and non-driving-related tasks. By modeling drivers as continuous controllers, the discrete nature
of drivers’ control actions is lost and with it an important component for characterizing behavioral
variability. We propose the use of cognitive architectures for developing models of driver behavior that
integrate cognitive and perceptual-motor processes in a serial model of task and attention management. A
cognitive architecture is a computational framework that incorporates built-in, well-tested parameters and
constraints on cognitive and perceptual-motor processes. All driver models implemented in a cognitive
architecture necessarily inherit these parameters and constraints, resulting in more predictive and
psychologically plausible models than those that do not characterize driving as a multi-tasking activity. We
demonstrate these benefits with a driver model developed in the ACT-R cognitive architecture. The model
is validated by comparing its behavior to that of human drivers navigating a four-lane highway with traffic
in our fixed-based driving simulator. Results show that the model successfully predicts aspects of both
lower-level control, such as steering and eye movements during lane changes, as well as higher-level
cognitive tasks, such as task management and decision making. Many of these predictions are not
explicitly built into the model but rather come from the cognitive architecture as a result of the model’s
implementation in the ACT-R architecture.
INTRODUCTION
Computational driver models have been developed to characterize many aspects of the driving task.
However, the vast majority focuses on lower-level control behavior, such as process models of lane
Salvucci, Boer, & Liu 3
keeping and curve negotiation (e.g., 1, 2, 3, 4, 5, 6). Given these detailed models, researchers have started
to develop integrated driver models that combine these lower-level models of control with a higher-level
model of cognitive processing and decision making (e.g., 7, 8). The higher-level cognitive components of
such an integrated driver model are responsible for maintaining situation awareness, determining strategies
for navigation, deciding when to initiate and terminate maneuvers, and managing other tasks that are not
immediately relevant to the primary driving task (e.g. changing radio stations or talking on a cell phone).
Integrated driver models thus require task prioritization and attention management to handle the
multitasking nature of the driving task (9). The issue at hand is what computational framework is best
suited for tying together existing lower-level control models with higher-level goal setting such that known
constraints on perception, cognition, and control are not violated.
In this paper we propose a novel approach to developing integrated driver models using cognitive
architectures. A cognitive architecture is a theory of human cognition and perceptual-motor actions that
provides a rigorous framework for building, running, and testing computational models of behavior. The
architecture includes numerous built-in, well-tested predictions concerning the parameters and constraints
of cognition (e.g., memory and forgetting effects, errors, attention allocation) and of visual-motor
performance (e.g., manual control actions, eye movements). Cognitive architectures have been employed
extensively in psychology and the cognitive sciences to model human behavior (e.g., 10, 11, 12). By
developing a model of driving in a cognitive architecture, the model inherits all the cognitive and
perceptual-motor predictions of the architecture and allows for more psychologically plausible models of
behavior. The model also produces quantitative predictions about control and perceptual behavior that can
be compared directly to observed driver behavior (e.g., steering and eye-movement data). Thus, the model
provides a theoretical understanding of driving behavior, a practical formalization of driver intentions for
intelligent vehicle support systems, or a testbed to predict the effect of various in-car systems on driver
behavior.
To demonstrate the benefits of our approach, we present a computational driver model developed in the
ACT-R cognitive architecture (10). The model focuses on highway driving, particularly on the integration
of the lane keeping, curve negotiation, and lane changing subtasks. The model is based on our integrated
hierarchical driver modeling framework (9) in that it characterizes the interaction between operational
Salvucci, Boer, & Liu 4
control and cognitive information processing. Operational control involves lane keeping, speed regulation,
and headway regulation. These mechanisms are based on the perceptually plausible control model that we
have developed in the past (13). The cognitive processing monitors the environment to maintain awareness
of other vehicles and makes decisions on when to change lanes based on its current mental model of the
situation and thresholds of acceptable behavior (e.g., desired time headway to the lead car). It effectively
controls the amount of attention allocated to control, situation awareness, and other non-driving tasks
through serial temporal multiplexing (i.e. sequentially allocating the available attention on a task). A
practical model of driving should be based on (1) use of input variables that drivers can actually perceive,
(2) realistic constraints on memory, cognitive processing speed, and attention dynamics, and (3) a
cognitively plausible characterization of how drivers evaluate performance (2, 14). In this paper, we
explicitly focus on the cognitive components of the model, but also utilize perceptually plausible lower-
level controllers and represent performance with a satisficing rather than optimizing implementation (13).
We validate the driver model by comparing the model's behavior to the behavior of human drivers in an
empirical study with our fixed-based driving simulator (15). The study collected various types of control
data as drivers navigated a four-lane highway with moderate traffic. In addition, eye movements were
monitored in our experiments and used as a rational surrogate for attention shifts. Results show that the
model reproduces key signatures of driving behavior at the operational as well as the cognitive level. It is
capable of predicting attentional demands and reproducing drivers' attention shifts during lane keeping and
curve negotiation as well as before and during lane changes.
COGNITIVE ARCHITECTURES AND DRIVING
Cognitive architectures are formal frameworks for specifying models of human behavior (10, 11, 12).
In a sense, cognitive architectures are similar to computer programming languages in which users can write
and run behavioral models. However, unlike standard programming languages, cognitive architectures are
designed to be psychologically plausible by incorporating numerous parameters and constraints of human
cognition and perceptual-motor behavior. Thus, models developed within these architectures automatically
abide by these parameters and constraints and thus provide a more accurate representation of human
abilities.
Salvucci, Boer, & Liu 5
This section offers a brief overview of cognitive architectures with an emphasis on their application to
driving. For simplicity, we focus on a specific type of cognitive architecture, namely production-system
architectures based on condition-action rules (e.g., ACT-R, 10), that are particularly appropriate to
modeling the interaction of higher- and lower-level behavior. Interested readers can refer to (10, 11, 12)
for more details on these and other architectures.
A Brief Introduction to Cognitive Architectures
Cognitive architectures, loosely speaking, can be described in three components: knowledge
representation, performance, and learning. Knowledge representation provides a formalization of both
factual and skill knowledge available to the person. Skill knowledge is often represented as condition-
action (or "production") rules that "fire" when the conditions are satisfied, thus producing the specified
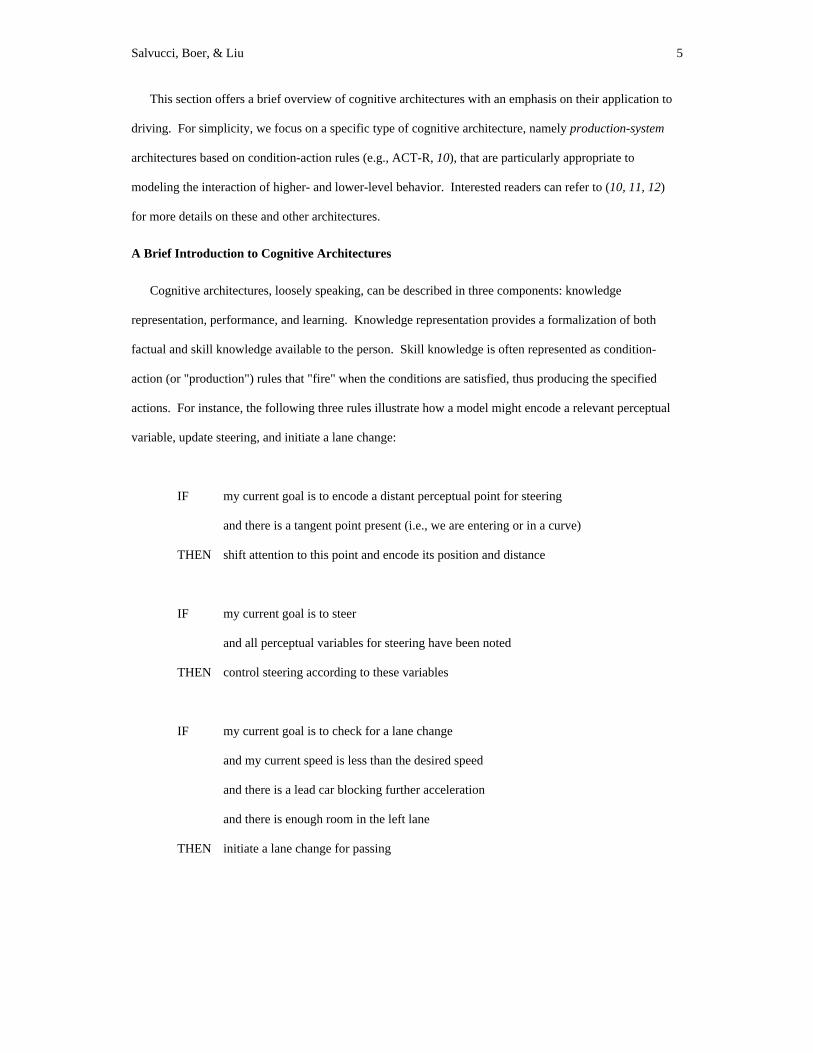
actions. For instance, the following three rules illustrate how a model might encode a relevant perceptual
variable, update steering, and initiate a lane change:
IF my current goal is to encode a distant perceptual point for steering
and there is a tangent point present (i.e., we are entering or in a curve)
THEN shift attention to this point and encode its position and distance
IF my current goal is to steer
and all perceptual variables for steering have been noted
THEN control steering according to these variables
IF my current goal is to check for a lane change
and my current speed is less than the desired speed
and there is a lead car blocking further acceleration
and there is enough room in the left lane
THEN initiate a lane change for passing
Salvucci, Boer, & Liu 6
These rules act upon the factual knowledge currently stored in memory. In driving, for instance, factual
knowledge includes information for perception and control (e.g., the location of lane markings), situation
awareness (e.g., “there is a car to the right in my blind spot”), and navigation (e.g., “my destination is at
highway exit 17”). This factual knowledge is continually updated by perceptual modules that sample the
environment and maintain information about the current situation.
Performance for a cognitive architecture describes how the architecture processes information and
generates behavior through rule applications. At each cycle of a simulation, the architecture determines
which rules can fire and selects them in a "conflict resolution" process; this process evaluates rules
according to each rule's costs and benefits and fires the rule with the greatest total gain (i.e., total benefit
minus cost); the benefit is associated with the higher-level goal that should be satisfied, such as safe arrival
at the destination, and the cost is associated with both the immediate cost of firing the rule and the
estimated remaining long-term cost of following the global strategy embodied by the rule (if any). In firing
the rule, the architecture generates the actions of that rule which typically include one or more of perceptual
actions (e.g., look at the lead car), motor actions (e.g., steer some amount), and updates to factual
knowledge. Each rule firing takes some predetermined time, possibly dependent on the time needed to
retrieve the factual knowledge in the condition set. Also, the architecture typically incorporates parameters
for generated perceptual-motor actions, such as the time needed to move the hands or to shift visual
attention and move the eyes, etc. Thus, a model simulation generates a sequence of behaviors completely
analogous to those generated by humans.
Learning in a cognitive architecture can occur at two levels. First, there is discrete learning in which
new facts or rules are integrated into the old system. For instance, if a passenger tells the driver that his
house is directly ahead, the driver incorporates this as new factual knowledge. Second, there is continuous
learning in which existing facts or rules are strengthened or weakened as a result of practice. For instance,
if a particular rule or fact is used very often, its strength increases steadily thus facilitating its use in future
applications; on the other hand, it is used infrequently, it can decay to the point in which it must be
relearned. With both discrete and continuous learning acting in unison, cognitive architectures can account
for a very wide range of adaptive behavior from novices to experts; it should be noted, however, that
producing reasonable learning with different mechanisms acting together can sometimes be difficult to
Salvucci, Boer, & Liu 7
control, and there is much work to be done to determine how such mechanisms interact in the complex
domain of driving.
Advantages of Modeling Driver Behavior in a Cognitive Architecture
Cognitive architectures have been successfully employed in a wide variety of domains to model and
study human behavior (see 10, 11, 12). Surprisingly, there has been only one attempt to model driving in a
cognitive architecture, namely Aasman's model of a driver approaching an unordered intersection (16).
However, we believe that cognitive architectures offer a host of benefits for modeling driver behavior that
could nicely build on existing work in this area. There are at least two primary reasons for this optimism.
First, cognitive architectures are extremely adept at integrating lower-level perceptual and motor control
processes with higher-level cognitive and decision-making processes. Architectures typically rely on a
central cognitive processor to maintain a mental model and make decisions about higher-level strategies to
execute. This processor communicates with numerous perceptual and motor processors that run in parallel
with the cognitive processor, executing requested commands from cognition and communicating sensory
input to cognition. Any model developed in a cognitive architecture necessarily brings to bear both these
cognitive and perceptual-motor aspects of behavior. This feature greatly facilitates the integration of
lower-level control models, such as for lateral or longitudinal control, with higher-level decision making
models that act upon the current situation and the current needs and desires of the driver. Such an
integration has been proposed as a conceptual model (9); cognitive architectures provide a way to
implement this type of conceptual model as a computational predictive model.
The other major benefit of cognitive architectures is their incorporation of built-in mechanisms to
model common psychophysical phenomena. For instance, cognitive architectures typically have a
mechanism for modeling how people store, recall, and sometimes forget information; how people execute
manual motor control for typing and other tasks; and how people move their eyes to visual targets and
encode the information therein. Each of these mechanisms has typically been rigorously analyzed and
tested in empirical studies that emphasize basic psychophysical tasks. Thus, researchers develop strong
support for the individual mechanisms, and then combine these mechanisms to form a rigorous architecture
that allows for their integration. This allows behavioral models for complex domains, such as driving, to
Salvucci, Boer, & Liu 8
utilize these well-tested mechanisms and concentrate on those aspects of behavior that are particular to the
different domains.
We can note several of the most important phenomena successfully modeled by cognitive architectures
and how they might be addressed in driving:
• individual variability: Architectures allow for several types of variability ranging from simple errors
to those stemming from statistical variations in attention management to variations in higher-level
cognitive strategies. The parameters that account for such variability could be tuned in driver models
to represent different classes or types of drivers (e.g., younger versus older, passive versus aggressive).
• satisficing behavior: Most architectures do not guarantee optimal performance, but rather perform to a
"satisficing" threshold above which any performance is acceptable. This feature helps to account for
results showing that driver behavior is often better characterized as satisficing rather than optimal (9,
13, 14).
• attention and attentional capacity: While drivers can see a great deal in their field of view, the
amount of information they can process through visual attention is much more limited and requires
movement of attention between salient regions of the view. Architectures help to describe how much
information can be processed, how quickly it is processed, and how this processing may interfere with
other driving tasks.
• working memory load: Architectures typically include limits on the amount of information that can
be mentally stored and processed during a given time period. Such limits help to account for cognitive
limitations in dealing with heavy multitasking with multiple tasks or instruments (e.g., a cell phone or
navigation device).
• seriality versus parallelism: The necessity of multitasking during driving brings up the important
issue of how much processing (visual, motor, and cognitive) can be done in parallel and how much
must be done serially. Architectures vary on this issue but generally agree that a system with limited
parallelism but otherwise primarily sequential execution is best suited to account for human behavior,
thus constraining the structure of driver models and capturing certain aspects of driver limitations.

Salvucci, Boer, & Liu 9
• workload: Architectures typically have some interpretation of multitasking workload for their
particular parameters and constraints, though they differ greatly on these interpretations. Nevertheless,
architectures could allow a given driver model to predict effects on mental and physical workload
given different settings of these parameters for different individuals and situations.
Note that the above aspects of behavior can be quite interdependent, and in fact another advantage of a
cognitive architecture is that it allows for rigorous exploration of the interactions between any combination
of these factors.
AN ARCHITECTURE-BASED INTEGRATED DRIVER MODEL
To demonstrate the power of modeling driver behavior in a cognitive architecture, we have developed a
computational driver model in the cognitive architecture ACT-R (10). ACT-R has been employed to model
behavior in a wide array of domains ranging from list memory to mathematical problem solving to air
traffic control (see 10). The step to modeling driver behavior offers both many challenges for the
architecture in handling such a complex multitasking domain, and many opportunities to learn more about
driver behavior and modeling through implementation in this rigorous framework. The core foundation of
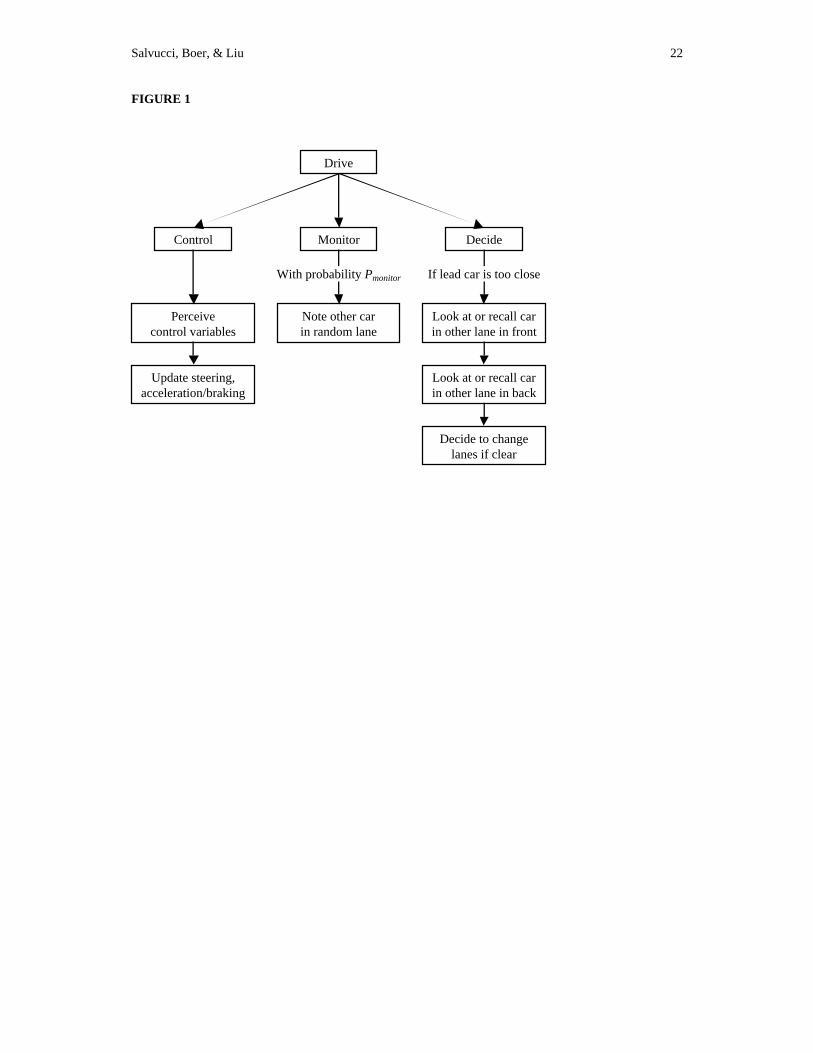
the integrated driver model is its skill knowledge specified as condition-action rules. The model contains
45 rules that fire serially such that the various tasks require management to interleave and execute. We can
characterize the model in terms of three core components: control, monitoring, and decision making.
Figure 1 provides an outline of these components and shows how they fit together.
<< Insert Figure 1 here >>
As a long-term goal, the model presented here serves as a foundation for exploring many of the
behavioral phenomena described earlier. For the purposes of this paper, we focus on two particular aspects
of highway driving behavior: control behavior as indicated by steering, and monitoring behavior as
indicated by drivers’ eye movements (and thus visual attention). We now describe the three model
components in turn using Figure 1 as a guide.
Salvucci, Boer, & Liu 10
Control
To control the vehicle, the driver model first runs through several steps to perceive the relevant aspects
the external environment. The model uses a basic two-way control paradigm (3) that centers on two
perceptual targets:
• near point: a nearby point representing the focus of visual attention when determining the vehicle’s
current placement within its lane. The near point is located in the center of the vehicle lane with a time
headway of 0.5 seconds, as has been found in empirical studies (17).
• far point: a distant point representing the driver’s focus of visual attention when previewing the road
ahead. The far point can be one of three visual targets: the lead car when there is a car present; the
tangent point (18) on a curved road segment; or the vanishing point on a straight road segment, with a
maximum time heading of four seconds (14). Of these three possible targets, the far point is
designated to be the target closest to the near point in terms of visual angle.
To encode these two targets, the model moves its visual attention to the near point and then the far point,
gathering perceptually plausible variables that will be used for vehicle control. The model first encodes the
near and far point horizontal visual angles θnear and θ far , and the type of far point (vanishing point,
tangent point, or lead car). When the type of far point is a lead car, the model also computes the time
headway THWcar to the lead car given the current perceived velocity v. If the type of far point has not
changed since the last update cycle, the model also calculates the changes in each of these variables,
namely ∆θnear , ∆θ far , and ∆THWcar . Finally, the model notes the elapsed time ∆ t since the last update
cycle.
Using these perceptual variables, the model can calculate the necessary updates for the purposes of
steering and speed control. The model employs a controller very similar to a standard PID controller (19)
for both types of control. For steering, the model computes a change in steering angle ∆steer as follows:
∆steer = c1(∆θ far ) + c2 (∆θnear ) + c3 (θnear )∆t (Equation 1)
Salvucci, Boer, & Liu 11
The first term in the equation attempts to maintain the far point at a constant visual angle, a strategy that
has been found to be crucial to locomotion (e.g., 20). Thus the first term provides a preview of upcoming
curves and predicts anticipatory steering before entering curves. The second and third terms attempt to
keep the visual angle of the near point at a constant angle near zero. These terms thus maintain the
vehicle’s position near the center of the current lane.
For speed control, the model uses a single variable acc to represent the position of the accelerator and
brake pedal: positive values in (0,1] represent the ratio of accelerator depression, with 1 meaning full
throttle; and negative values in [–1,0) represent the negative of the ratio of brake depression, with –1
meaning full braking. (Future versions of the model could incorporate more complex representations to
better account for separate movement on the individual pedals.) The model’s update equation for this value
is similar to that for steering:
∆acc = c4(∆THWcar ) + c5(THWcar − THW follow)∆t (Equation 2)
This equation utilizes a value THW follow that represents the driver’s desired time headway from the lead
car. The model also limits the value of acc to a threshold accmax to represent the maximum accelerator
depression to achieve a desired maximum speed. Both THW follow and accmax are assumed to come from
the driver’s internal state of goals and needs for the particular individual and driving situation. It is
important to note that this model of speed control only considers the lead car and ignores changes in road
curvature; this is a reasonable assumption for highway driving where road curvatures are typically minimal
such that little or no speed control is needed for curve negotiation. The vehicle model is a bicycle model
for lateral dynamics and an energy balance model for longitudinal dynamics, both of which are reasonable
first order approximations of vehicle dynamics (15).
The above model describes the basic control behavior during lane keeping and curve negotiation. So
the question arises, what needs to be done for the model to account for control behavior during lane
changing? In fact there is a very simple and elegant answer: to change lanes, the model simply switches
attention from the near and far points of the current lane to the near and far points of the destination lane.
Salvucci, Boer, & Liu 12
This switch results in a large θnear which, by the third term in Equation 1, results in a change in steering
toward the destination lane; however, the first two terms in Equation 1 help to maintain steady steering
such that the car does not jerk violently toward the destination lane. In addition to this steadying factor,
drivers also have an internal model of how quickly they wish to execute the lane change; to account for this
factor, the model includes a parameter θnear. m a x that limits the reaction to the sudden displacement with a
threshold on θnear . As the lane change passes, the control model steers in the opposite direction to
straighten the car and the lane change is soon completed. Thus, the model can account for both lane
keeping / curve negotiation and lane changing all with a single straightforward model of steering control.
Monitoring
In addition to control, monitoring is clearly a critical part of highway driving that is necessary to
maintain situation awareness. One aspect of monitoring occurs during normal lane keeping where the
driver occasionally checks the environment to update her/his awareness of other vehicles. With some
probability Pmonitor , the model randomly chooses a lane (left or right) and a direction (front or back, with
front three times as likely as back to model the relative ease of front gazes). The model then focuses its
visual attention on the nearest vehicle in the chosen lane / direction and notes the position of this vehicle as
a knowledge fact. (Note that monitoring a car in back of the driver entails looking in the rear-view mirror.)
If the encoded vehicle was previously encoded as a fact, the old and new distances are used to compute the
estimated relative velocity to the driver car. This stochastic monitoring behavior helps the model to
account for periodic checking of the environment by drivers even in the absence of immediate decision
making, as may be necessary to act quickly in critical situations. However, as the next section describes,
such monitoring can also take place in service of decision making.
Decision Making
Given the awareness of the current environment as produced by monitoring, the model can examine the
situation and decide whether or not to execute a lane change. This occurs in two stages. First, the model
decides whether or not to attempt a lane change. In the right lane, the model decides to attempt a lane
change if there is a lead car nearer than the desired time headway to pass, THWpass . In the left lane, the
Salvucci, Boer, & Liu 13
model decides to attempt the change if there is no lead car nearer than THWpass , since this would mean
that the left lane in front of the driver is clear and the driver should attempt to move back into the right lane.
When the model attempts a lane change, it must ensure that the destination lane is clear. This process
requires the model to check the destination lane both in front of and behind the driver vehicle. To check
each position, the model monitors the nearest car in the given lane / direction as before by focusing its
visual attention and encoding its distance (and updating its relative velocity if possible). If there is a car
within a safe distance Dsafe from the driver car, the lane change is aborted. Otherwise the model attempts
to recall a memorized location of any car that might prevent a lane change: Because there may be a vehicle
in the driver’s blind spot that is not currently visible, this recall ensures that the driver checks her/his
mental model of the environment in addition to what s/he can currently see. If both monitoring and recall
indicate that a lane change can safely occur, the model makes the decision to change lanes. This decision
simply switches the driver’s current desired lane to the destination lane, producing the control necessary for
a lane change as described earlier.
Parameter Estimation
Given the complexity of the model and the different behaviors we wish to account for, obtaining very
precise estimates for the model parameters is not particularly practical or useful at this stage of
development. However, it is important to obtain at least reasonable estimates for the parameters to ensure
that the model’s behavior approximates that of human drivers. For the majority of parameters, we simply
preset them to reasonable values based on empirical results and informal observation. The estimates for
these parameters are as follows: THW follow = 1 s, THWpass = 2 s, Dsafe= 30 m, accmax= .8, and
Pmonitor = .33. The parameters ci in Equations 1 and 2 and the parameter θnear. m a x required more rigorous
treatment. First we derived rough estimates by setting parameters to random values and informally
observing the behavior of the model in simulation. We found this process to be extremely useful in
eliminating gross errors in settings that produced erratic behavior, such as driving off the road or producing
degenerate oscillatory steering. Second, we tried values of parameters near the initial rough estimates and
checked the resulting data in the same aggregate analysis used to analyze subject data (see 15). This
process gave us reasonable estimates without undue time spent overfitting particular aspects of the data.
Salvucci, Boer, & Liu 14
The final estimates for these parameters are: c1= 20, c2 = 10, c3 = 5, c4= 3, c5 = 1, and θnear. m a x= .5. We
did not incorporate any type of learning into our model; however, it is very feasible that these parameter
values could be learned through experience given the learning mechanisms built into the ACT-R
architecture.
Model Simulation and Output
The current implementation of the model runs in an integrated environment in which the ACT-R system
communicates directly with a minimal-graphics simulated environment. A simulation run produces an
output data file with the same format generated by our driving simulator, including steering-wheel angle,
accelerator and brake position, turn signal activation, and eye movements. The model protocols can be
replayed directly in the full simulator to observe the model’s driving in various playback speeds and
configurations, just as we do with human subject protocols.
EMPIRICAL VALIDATION
To validate the driver model, we compared the behavior of the model to that of human drivers in an
empirical study (21). The empirical data were collected in a fixed-based driving simulator with a
naturalistic highway environment. Space constraints preclude a detailed analysis of all aspects of the
human and model data. Thus we focus on two particular aspects of the data, namely driver’s steering
behavior and eye movements, during the lane keeping / curve negotiation, and lane changing tasks of
highway driving.
Data Collection
The empirical study we used for model validation (21) examined driver behavior in a highway
environment. In the study, drivers navigated two simulated highways with four lanes, two in each
direction, and standard American lane markings; one highway included shallow curves of various
curvatures and lengths while the other included no curves. The highways contained no scenery except for a
side wall off the roadside and included no on-ramps or off-ramps. Moderate vehicle traffic was introduced
with automated vehicles that drove at various desired speeds and passed one another (and the driver car)
when necessary.
Salvucci, Boer, & Liu 15
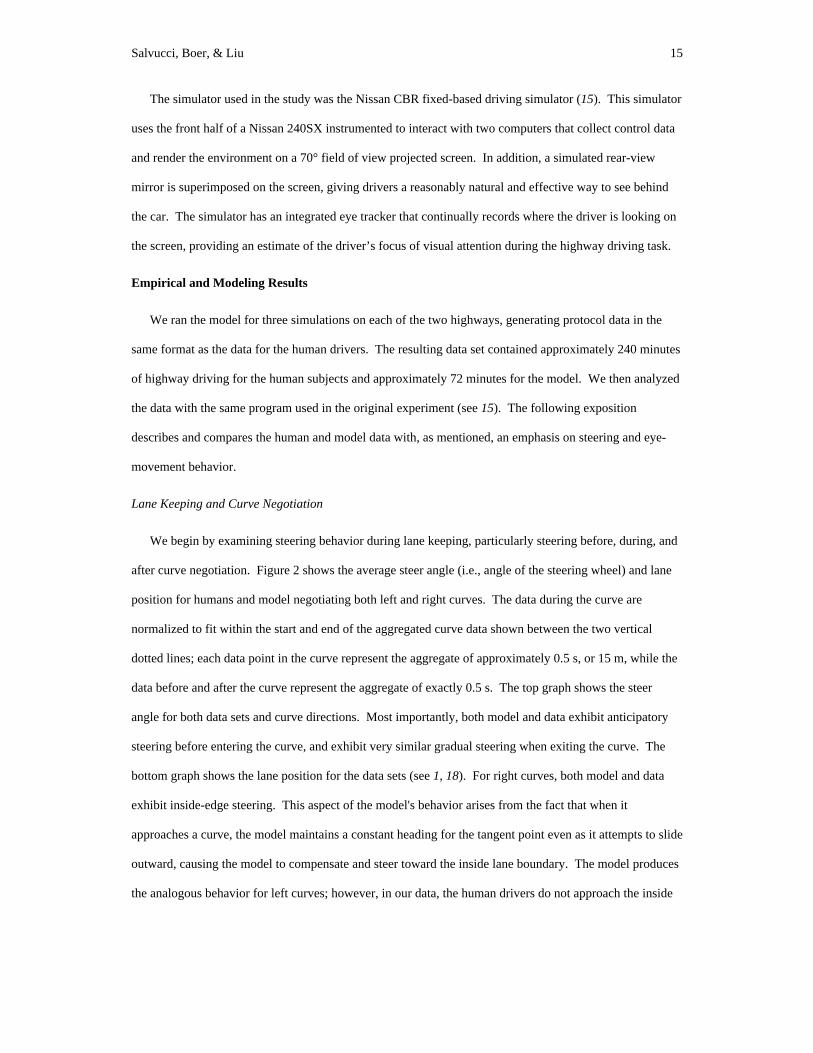
The simulator used in the study was the Nissan CBR fixed-based driving simulator (15). This simulator
uses the front half of a Nissan 240SX instrumented to interact with two computers that collect control data
and render the environment on a 70° field of view projected screen. In addition, a simulated rear-view
mirror is superimposed on the screen, giving drivers a reasonably natural and effective way to see behind
the car. The simulator has an integrated eye tracker that continually records where the driver is looking on
the screen, providing an estimate of the driver’s focus of visual attention during the highway driving task.
Empirical and Modeling Results
We ran the model for three simulations on each of the two highways, generating protocol data in the
same format as the data for the human drivers. The resulting data set contained approximately 240 minutes
of highway driving for the human subjects and approximately 72 minutes for the model. We then analyzed
the data with the same program used in the original experiment (see 15). The following exposition
describes and compares the human and model data with, as mentioned, an emphasis on steering and eye-
movement behavior.
Lane Keeping and Curve Negotiation
We begin by examining steering behavior during lane keeping, particularly steering before, during, and
after curve negotiation. Figure 2 shows the average steer angle (i.e., angle of the steering wheel) and lane
position for humans and model negotiating both left and right curves. The data during the curve are
normalized to fit within the start and end of the aggregated curve data shown between the two vertical
dotted lines; each data point in the curve represent the aggregate of approximately 0.5 s, or 15 m, while the
data before and after the curve represent the aggregate of exactly 0.5 s. The top graph shows the steer
angle for both data sets and curve directions. Most importantly, both model and data exhibit anticipatory
steering before entering the curve, and exhibit very similar gradual steering when exiting the curve. The
bottom graph shows the lane position for the data sets (see 1, 18). For right curves, both model and data
exhibit inside-edge steering. This aspect of the model's behavior arises from the fact that when it
approaches a curve, the model maintains a constant heading for the tangent point even as it attempts to slide
outward, causing the model to compensate and steer toward the inside lane boundary. The model produces
the analogous behavior for left curves; however, in our data, the human drivers do not approach the inside
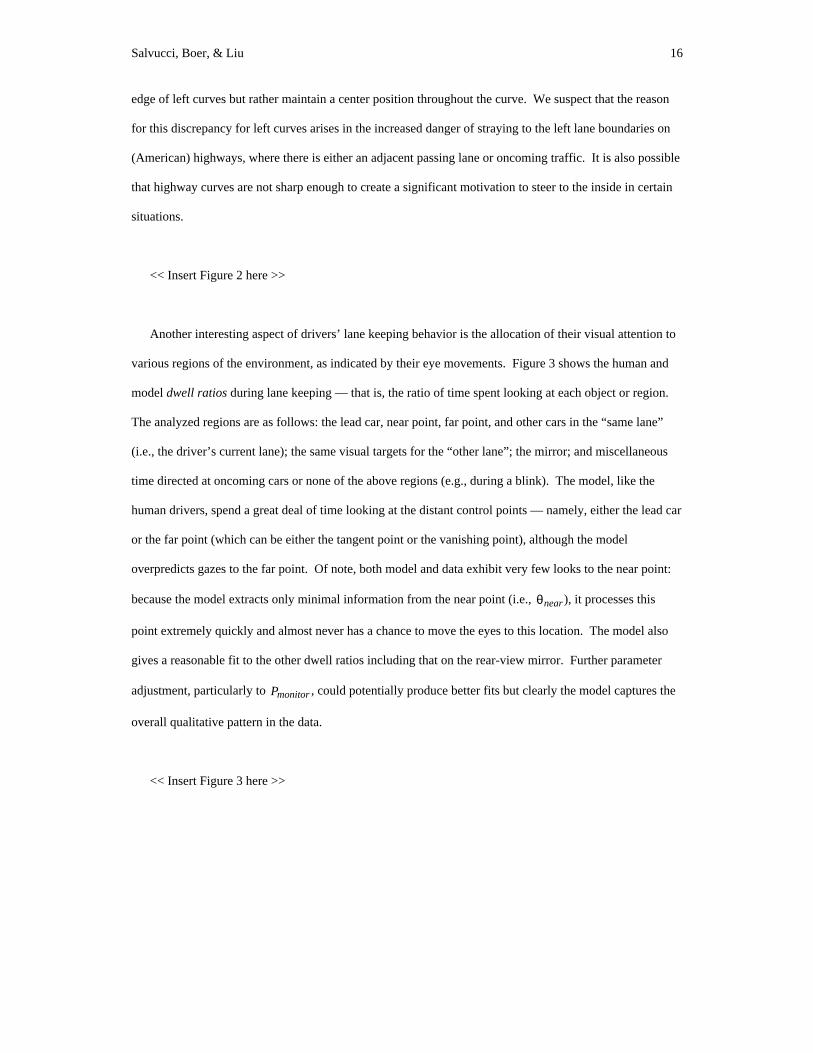
Salvucci, Boer, & Liu 16
edge of left curves but rather maintain a center position throughout the curve. We suspect that the reason
for this discrepancy for left curves arises in the increased danger of straying to the left lane boundaries on
(American) highways, where there is either an adjacent passing lane or oncoming traffic. It is also possible
that highway curves are not sharp enough to create a significant motivation to steer to the inside in certain
situations.
<< Insert Figure 2 here >>
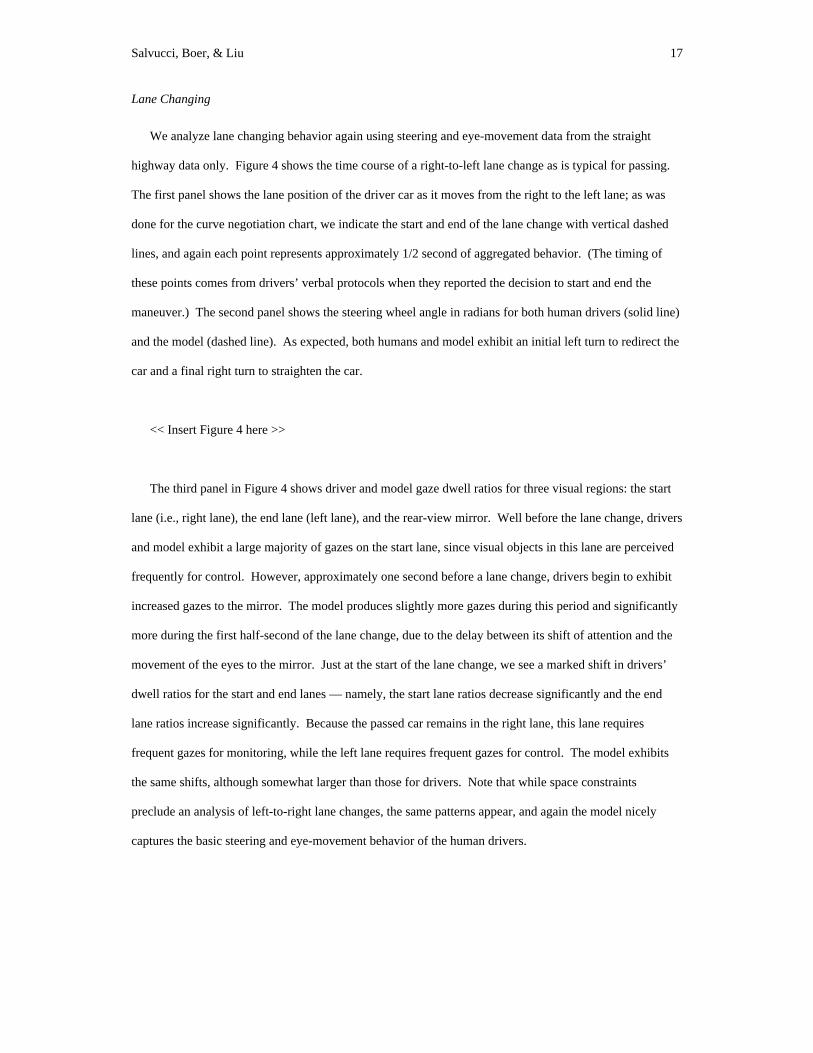
Another interesting aspect of drivers’ lane keeping behavior is the allocation of their visual attention to
various regions of the environment, as indicated by their eye movements. Figure 3 shows the human and
model dwell ratios during lane keeping — that is, the ratio of time spent looking at each object or region.
The analyzed regions are as follows: the lead car, near point, far point, and other cars in the “same lane”
(i.e., the driver’s current lane); the same visual targets for the “other lane”; the mirror; and miscellaneous
time directed at oncoming cars or none of the above regions (e.g., during a blink). The model, like the
human drivers, spend a great deal of time looking at the distant control points — namely, either the lead car
or the far point (which can be either the tangent point or the vanishing point), although the model
overpredicts gazes to the far point. Of note, both model and data exhibit very few looks to the near point:
because the model extracts only minimal information from the near point (i.e., θnear), it processes this
point extremely quickly and almost never has a chance to move the eyes to this location. The model also
gives a reasonable fit to the other dwell ratios including that on the rear-view mirror. Further parameter
adjustment, particularly to Pmonitor , could potentially produce better fits but clearly the model captures the
overall qualitative pattern in the data.
<< Insert Figure 3 here >>
Salvucci, Boer, & Liu 17
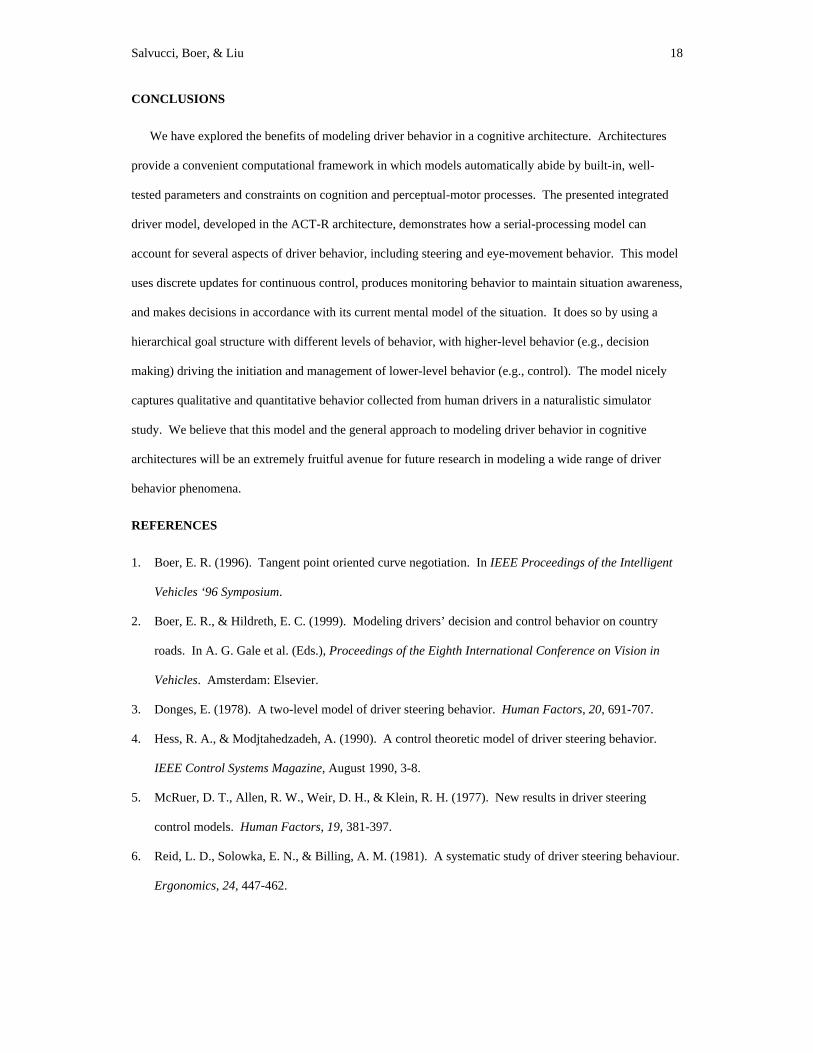
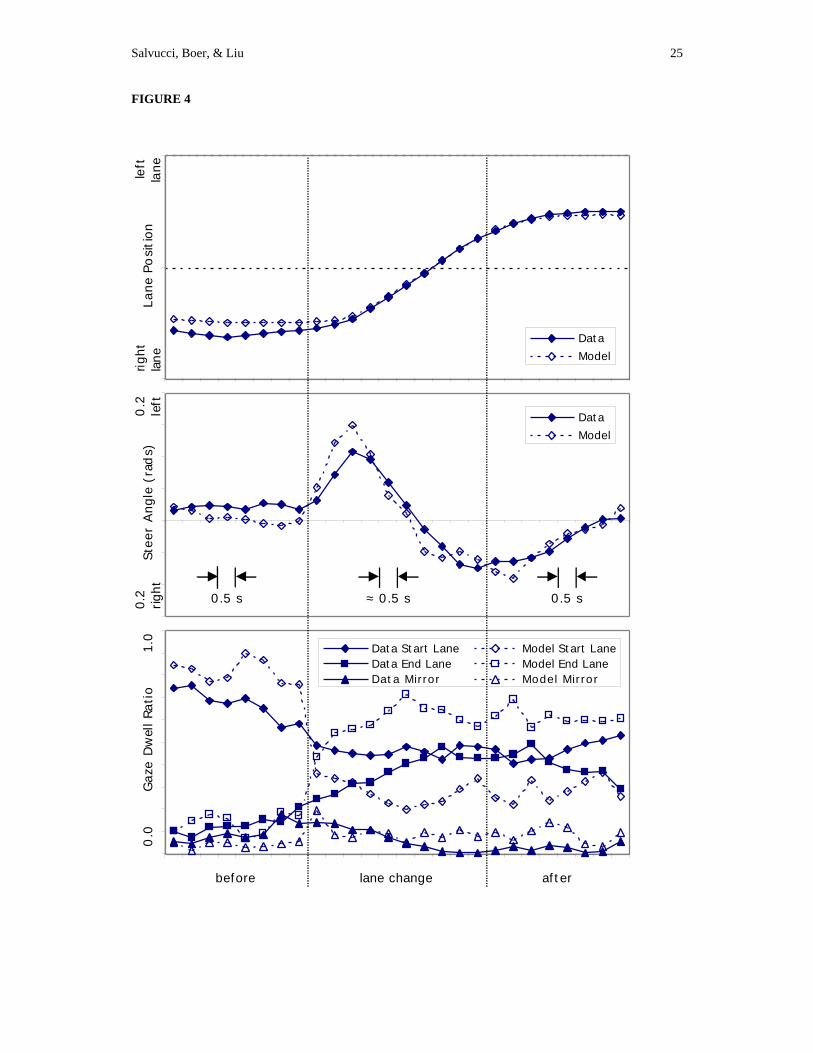
Lane Changing
We analyze lane changing behavior again using steering and eye-movement data from the straight
highway data only. Figure 4 shows the time course of a right-to-left lane change as is typical for passing.
The first panel shows the lane position of the driver car as it moves from the right to the left lane; as was
done for the curve negotiation chart, we indicate the start and end of the lane change with vertical dashed
lines, and again each point represents approximately 1/2 second of aggregated behavior. (The timing of
these points comes from drivers’ verbal protocols when they reported the decision to start and end the
maneuver.) The second panel shows the steering wheel angle in radians for both human drivers (solid line)
and the model (dashed line). As expected, both humans and model exhibit an initial left turn to redirect the
car and a final right turn to straighten the car.
<< Insert Figure 4 here >>
The third panel in Figure 4 shows driver and model gaze dwell ratios for three visual regions: the start
lane (i.e., right lane), the end lane (left lane), and the rear-view mirror. Well before the lane change, drivers
and model exhibit a large majority of gazes on the start lane, since visual objects in this lane are perceived
frequently for control. However, approximately one second before a lane change, drivers begin to exhibit
increased gazes to the mirror. The model produces slightly more gazes during this period and significantly
more during the first half-second of the lane change, due to the delay between its shift of attention and the
movement of the eyes to the mirror. Just at the start of the lane change, we see a marked shift in drivers’
dwell ratios for the start and end lanes — namely, the start lane ratios decrease significantly and the end
lane ratios increase significantly. Because the passed car remains in the right lane, this lane requires
frequent gazes for monitoring, while the left lane requires frequent gazes for control. The model exhibits
the same shifts, although somewhat larger than those for drivers. Note that while space constraints
preclude an analysis of left-to-right lane changes, the same patterns appear, and again the model nicely
captures the basic steering and eye-movement behavior of the human drivers.
Salvucci, Boer, & Liu 18
CONCLUSIONS
We have explored the benefits of modeling driver behavior in a cognitive architecture. Architectures
provide a convenient computational framework in which models automatically abide by built-in, well-
tested parameters and constraints on cognition and perceptual-motor processes. The presented integrated
driver model, developed in the ACT-R architecture, demonstrates how a serial-processing model can
account for several aspects of driver behavior, including steering and eye-movement behavior. This model
uses discrete updates for continuous control, produces monitoring behavior to maintain situation awareness,
and makes decisions in accordance with its current mental model of the situation. It does so by using a
hierarchical goal structure with different levels of behavior, with higher-level behavior (e.g., decision
making) driving the initiation and management of lower-level behavior (e.g., control). The model nicely
captures qualitative and quantitative behavior collected from human drivers in a naturalistic simulator
study. We believe that this model and the general approach to modeling driver behavior in cognitive
architectures will be an extremely fruitful avenue for future research in modeling a wide range of driver
behavior phenomena.
REFERENCES
1. Boer, E. R. (1996). Tangent point oriented curve negotiation. In IEEE Proceedings of the Intelligent
Vehicles ‘96 Symposium.
2. Boer, E. R., & Hildreth, E. C. (1999). Modeling drivers’ decision and control behavior on country
roads. In A. G. Gale et al. (Eds.), Proceedings of the Eighth International Conference on Vision in
Vehicles. Amsterdam: Elsevier.
3. Donges, E. (1978). A two-level model of driver steering behavior. Human Factors, 20, 691-707.
4. Hess, R. A., & Modjtahedzadeh, A. (1990). A control theoretic model of driver steering behavior.
IEEE Control Systems Magazine, August 1990, 3-8.
5. McRuer, D. T., Allen, R. W., Weir, D. H., & Klein, R. H. (1977). New results in driver steering
control models. Human Factors, 19, 381-397.
6. Reid, L. D., Solowka, E. N., & Billing, A. M. (1981). A systematic study of driver steering behaviour.
Ergonomics, 24, 447-462.
Salvucci, Boer, & Liu 19
7. Levison, W. H., & Cramer, N. L. (1995). Description of the integrated driver model (Tech. Rep. No.
FHWA-RD-94-092). McLean, VA: Federal Highway Administration.
8. Wierwille, W. W., & Tijerina, L. (1998). Modelling the relationship between driver in-vehicle visual
demands and accident occurrence. In A. G. Gale et al. (Eds.), Vision in Vehicles VI (pp. 233-243).
Amsterdam: Elsevier.
9. Boer, E. R., & Hoedemaeker, M. (1998). Modeling driver behavior with different degrees of
automation: A hierarchical decision framework of interacting mental models. In Proceedings of the
17th European Annual Conference on Human Decision Making and Manual Control.
10. Anderson, J. R., & Lebiere, C. (1998). The atomic components of thought. Hillsdale, NJ: Lawrence
Erlbaum Associates.
11. Kieras, D. E., & Meyer, D. E. (1997). A computational theory of executive cognitive processes and
multiple-task performance: Part 1. Basic mechanisms. Psychological Review, 104, 3-65.
12. Laird, J. E., Newell, A., & Rosenbloom, P. S. (1987). Soar: An architecture for general intelligence.
Artificial Intelligence, 33, 1-64.
13. Boer, E. R., Hildreth, E. C., & Goodrich, M. A. (1998). A driver model of attention management and
task scheduling: Satisficing decision making with dynamic mental models. In Proceedings of the 17th
European Annual Conference on Human Decision Making and Manual Control.
14. Boer, E. R. (1999). Car following from the driver’s perspective. Transportation Research – Part F, 2,
201-206.
15. Beusmans, J., & Rensink, R. (Eds.) (1995). CBR 1995 Annual Report (Tech. Rep. No. CBR-TR-95-
7). Cambridge, MA: Cambridge Basic Research.
16. Aasman, J. (1995). Modelling driver behaviour in Soar. Leidschendam, The Netherlands: KPN
Research.
17. Land, M., & Horwood, J. (1995). Which parts of the road guide steering?. Nature, 377, 339-340
18. Land, M. F., & Lee, D. N. (1994). Where we look when we steer. Nature, 369, 742-744.
19. Ogata, K. (1990). Modern control engineering. Englewood Cliffs, NJ: Prentice Hall.
20. Rushton, S. K., Harris, J. M., Lloyd, M. R., & Wann, J. P. (1998). Guidance of locomotion on foot
uses perceived target location rather than optic flow. Current Biology, 8, 1191-1194.

Salvucci, Boer, & Liu 20
21. Salvucci, D. D., & Liu, A. (in preparation). Control and monitoring during highway driving.
Salvucci, Boer, & Liu 21
FIGURE CAPTIONS
FIGURE 1 Overview of the ACT-R integrated driver model.
FIGURE 2 Steer angle and lane position before, during, and after curves.
FIGURE 3 Gaze dwell ratios on different visual targets during lane keeping and curve negotiation.
FIGURE 4 Lane position, steer angle, and gaze dwell ratios before, during, and after lane changes.
Salvucci, Boer, & Liu 22
FIGURE 1
Drive
Control
Perceivecontrol variables
Update steering,acceleration/braking
Monitor
Note other carin random lane
With probability Pmonitor
Decide
Look at or recall carin other lane in front
Look at or recall carin other lane in back
Decide to changelanes if clear
If lead car is too close

Salvucci, Boer, & Liu 23
FIGURE 2
Data Left
Data Right
Model Left
Model Right
Data Left
Data Right
Model Left
Model Right
Stee
r A
ngle
(ra
ds)
curve
0.5
right
Lane
Pos
itio
nle
fted
gerig
hted
ge
before after
≈ 0.5 s0.5 s 0.5 s
0.5
left

Salvucci, Boer, & Liu 24
FIGURE 3
0.0
0.1
0.1
0.2
0.2
0.3
0.3
0.4
0.4
0.5
Data
Model
Same Lane Other Lane
Salvucci, Boer, & Liu 25
FIGURE 4
Data
Model
Data
Model
Data Start Lane Model Start LaneData End Lane Model End LaneData Mirror Model Mirror
lane change
Lane
Po
siti
onle
ftla
nerig
htla
ne
before after
0.5 s
Stee
r A
ngle
(ra
ds)
0.2
left
0.2
right
Gaz
e D
wel
l Rat
io1.
00
.0
≈ 0.5 s 0.5 s