toward an in vitro bioequivalence test by jie sheng
TRANSCRIPT
TOWARD AN IN VITRO BIOEQUIVALENCE TEST
by
Jie Sheng
A dissertation submitted in partial fulfillment
of the requirements for the degree of
Doctor of Philosophy
(Pharmaceutical Sciences)
In The University of Michigan
2007
Doctoral Committee:
Professor Gordon L. Amidon, Chair
Professor Henry Y. Wang
Associate Professor Nair Rodriguez-Hornedo
Associate Professor Steven P. Schwendeman

Jie Sheng© 2007
All Rights Reserved

To Kurt Q. Zhu, my husband and my very best friend,
and
to Diana S. Zhu and Brandon D. Zhu, my lovely children.
ii

Acknowledgements
Most of all, I thank Prof. Gordon L. Amidon, for his support, guidance, and
inspiration during my graduate studies at the University of Michigan. Being his student
is the best step happened in my career. I am always amazed by his vision, energy,
patience and dedication to the research and his students. He trained me to grow as a
scientist and as a person.
I also wish to thank all of my committee members, Professors David Fleisher,
Nair Rodriguez-Hornedo, Steven Schwendeman and Henry Wang, for their very
insightful and constructive suggestions to my research. It took all their efforts to raise me
as a professional scientist in pharmaceutical field. They all contributed significantly to
development and improvement of my graduate work. Especially, Prof. Wang has also
guided me in thinking of career development as if 20-year later. I felt to be his student in
many ways.
I thank mentors, colleagues and friends, Prof. John Yu from Ohio State University,
Paul Sirois from Eli Lilly, Kurt Seefeldt, Chet Provoda, Jonathan Miller, John Chung,
Chris Landoswki, Haili Ping and Yasuhiro Tsume from College of Pharmacy, for many
interesting discussions throughout the graduate program. I thank L.D. and Pat for
facilitating my research in the college. I also thank Iris Templin and Gail for their
administrative help along the way.
iii
I thank Prof. David Smith for his support and guidance during the PSTP
fellowship, and beyond. I thank Prof. Kyung-Dall Lee for his perspectives in teaching,
science and research.
Lastly, I am grateful to my husband, Kurt Zhu, for his endless love and patience.
I wish that I had supported him the same way when he was in graduate school. I thank
my children, Diana and Brandon, for being so close to me.
iv
TABLE OF CONTENTS
DEDICATION…………………………………………………………………………...ii
ACKNOWLEDGEMENTS…………………………………………………………….iii
LIST OF TABLES……………………………………………………………………...vii
LIST OF FIGURES……………………………………………………………………..ix
ABSTRACT……………………………………………………………………………...xi
CHAPTER
I. INFLUENCE OF FASTED STATE GASTROENTEROLOGICAL
FACTORS ON IN VIVO DISSOLUTION OF POORLY SOLUBLE
DRUGS…………………………………………………………………...1
Introduction………………………………………………………………..1
Gastrointestinal Factors…………………………………………………...2
Motility………………………………………………………….2
pH………………………………………………………………..4
Bile Salts…………………………………………………….......4
Buffer Species…………………………………………………...6
Other Gastrointestinal Factors…………………………………..7
Effects of GI Factors on BCS II drugs…………………………………….7
Selection of Model Compounds………………………………………….11
Implications of GI Factors in Establishing Bioequivalence Dissolution
Methodology……………………………………………………………..12
Summary…………………………………………………………………15
Specific Aims…………………………………………………………….16
References………………………………………………………………..21
II. PARTICLE DIFFUSIONAL LAYER THICKNESS IN A USP
DISSOLUTION APPARATUS II: A COMBINED FUNCTION OF
PARTICLE SIZE AND PADDLE SPEED……………………………27
Abstract…………………………………………………………………..27
Introduction………………………………………………………………28
v
Theoretical Section………………………………………………………31
Experimental Section…………………………………………………….34
Results…………………………………………………………………....37
Discussion………………………………………………………………..41
Conclusions………………………………………………………………51
References………………………………………………………………..63
III. SOLUBILIZATION AND DISSOLUTION OF INSOLUBLE WEAK
ACID, KETOPROFEN: EFFECTS OF PH COMBINED WITH
SURFACTANT…………………………………………………………66
Abstract…………………………………………………………………..66
Introduction………………………………………………………………67
Methods………………………………………………………………….69
Results and Discussion ………………………………………………….76
Conclusions………………………………………………………………83
References………………………………………………………………..93
IV. A COMPARISON OF PHOSPHATE AND BICARBONATE
BUFFERS: RELEVANCE TO IN VIVO DISSOLUTION………….96
Abstract…………………………………………………………………..96
Introduction………………………………………………………………97
Theoretical Section……………………………………………………..100
Experimental Section…………………………………………………...105
Results…………………………………………………………………..107
Discussion………………………………………………………………114
Conclusions……………………………………………………………..120
References………………………………………………………………131
V. SUMMARY……………………………………………………………134
vi

LIST OF TABLES
Table 1.1. Biopharmaceutical Classification System (BCS)………………………..17
Table 1.2. pH in the small intestine in healthy humans in the fasted state………….18
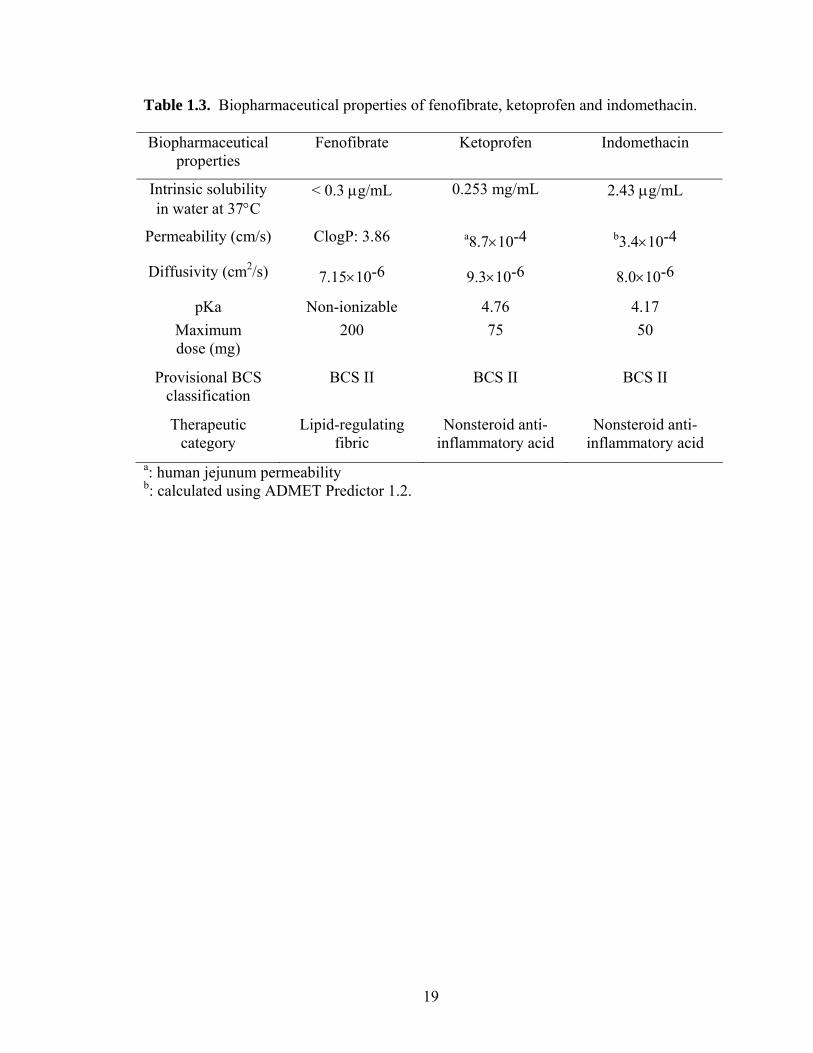
Table 1.3. Biopharmaceutical properties of fenofibrate, ketoprofen and
indomethacin……………………………………………………………………………..19
Table 2.1. Physical characteristics of various size fractions of fenofibrate powder...52
Table 2.2. Comparison of the relationship between happ and r in: Higuchi-
Hiestand’s work, Hintz-Johnson’s work and the current work in a USP dissolution
apparatus II………………………………………………………………………….……53
Table 2.3. Particle sizes and Re: comparison of fenofibrate powder dissolution in a
USP dissolution apparatus II and previous studies using the function form of Eq 2……54
Table 3.1. Equilibrium solubility (mg/mL S.D.) of ketoprofen at various pH and
SLS concentrations………………………………………………………………………85
Table 3.2. Solubilization power (CSN) of various pH and SLS concentrations on
ketoprofen………………………………………………………………………………..86
Table 3.3. The intrinsic dissolution rate
( × of ketoprofen at various pH and SLS
concentrations……………………………………………………………………………87
,/ 2/1J 4 2 1/ 2 1/ 210 / / / . .)mg cm s rad S D
Table 4.1. Commonly used pharmaceutical dissolution media/buffers for simulating
upper small intestine……………………………………………………………………121
Table 4.2. Parameters used in theoretical analysis…………………………………122
Table 4.3. Intrinsic flux of ketoprofen in the phosphate and in the bicarbonate buffer
systems, experimental and theoretical results…………………………………………..123
Table 4.4. Intrinsic flux ratios of indomethacin in the phosphate versus in the
bicarbonates, experimental and theoretical results……………………………………..124
vii

Table 4.5. Intrinsic dissolution rates of ketoprofen in 50mM pH 6.8 phosphate and
bicarbonate buffers……………………………………………………………………..125
Table 4.6-1. Drug flux ratio in USP 50 mM phosphate and 15mM bicarbonate buffers:
the impact of drug solubility and drug diffusion coefficient (drug pKa = 3)…………..126
Table 4.6-2. Drug flux ratio in USP 50 mM phosphate and 15 mM bicarbonate buffers:
the impact of drug solubility and drug diffusion coefficient (drug pKa = 5)…………..126
Table 4.7-1. Drug flux ratio in USP 50 mM phosphate and 15 mM bicarbonate buffers:
the impact of drug pKa and drug diffusion coefficient (drug solubility = 1×10⁻⁸
M)….127
Table 4.7-2. Drug flux ratio in USP 50mM phosphate and 15 mM bicarbonate buffers:
the impact of drug pKa and drug diffusion coefficient (drug solubility = 1×10⁻³
M)…..127
Table 4.8. Phosphate buffer as an equivalent substitute for 15 mM bicarbonate
buffer……………………………………………………………………………………128
Table 4.9. pKa values, maximum dose, and salt forms of some BCS II weak
acids.................................................................................................................................129
viii

LIST OF FIGURES
Figure 1.1. The chemical structures of fenofibrate, ketoprofen and
indomethacin……………………………………………………………………………..20
Figure 2.1a. DSC thermograms of the jet-milled fenofibrate…………………………..55
Figure 2.1b. DSC thermograms of fenofibrate “as received” from Sigma……………..55
Figure 2.2. PXRD patterns of fenofibrate “as received” and jet-milled……………...56
Figure 2.3. Particle size distribution of fenofibrate powders………………………...57
Figure 2.4. SEM picture of a typical fenofibrate powder (63-75 m)………………..58
Figure 2.5. Dissolution profiles of various size fractions of fenofibrate powder at 50
rpm and 100 rpm. (Error bars represent the standard deviation of a mean of three
experiments.)…………………………………………………………………………….59
Figure 2.6. Bifunctional analysis of the dependence of diffusional layer thickness
on particle sizes under different hydrodynamics in a USP dissolution apparatus II (n =
3)……………………………………………………………………………………….60
apph
Figure 2.7. Dependence of on square root of particle sizes under different
hydrodynamics in a USP dissolution apparatus II (n = 3)………………………………61
apph
Figure 2.8. Dimensionless analysis of the dependence of diffusional layer thickness
on particle sizes and hydrodynamics in a USP dissolution apparatus II (n = 3)…..62 apph
Figure 3.1. Chemical Structure of ketoprofen………………………………………88
Figure 3.2. Total solubility as function of pH and SLS…………………………….90
Figure 3.3. Intrinsic dissolution curves of ketoprofen at various SLS concentrations
pH 4.0 buffers…………………………………………………………………………..91
Figure 3.4. The intrinsic dissolution rate as function of pH and SLS………………92
ix

Figure 4.1. Dependence of drug flux ratio in the USP 50 mM phosphate buffer versus
15 mM bicarbonate buffer on drug pKa and solubility…………………………………130
x

ABSTRACT
TOWARD AN IN VITRO BIOEQUIVALENCE TEST
by
Jie Sheng
Chair: Gordon L. Amidon
Oral absorption of Biopharmaceutics Classification System (BCS) II drugs is
limited by in vivo dissolution. The current pharmacopeial in vitro dissolution
methodologies are designed for quality control, and do not reflect in vivo performance
criteria. This project is an investigation into the key in vitro dissolution parameters:
hydrodynamics, pH, surfactants/bile salts, and buffer species that are important to in vivo
dissolution. Hydrodynamics, i.e., the convective contributor to dissolution, was
examined through the stagnant diffusional layer thickness, happ, of fenofibrate in a USP
dissolution apparatus II. These results demonstrate that happ has different functional
dependences depending on particle sizes and the paddle speed. At 50 rpm, happ is linear
with square root of particle size ( ) within the range of 6.8-106 m. In contrast,
at 100 rpm a transitional particle radius exists at 23.7 m, above which the relationship
becomes constant. Further, the effect of particle size and paddle speed on h
2 0.98R
app can be
combined using dimensional analysis.
xi

In addition, key components of GI fluids such as pH, bile salts and buffer species
were also investigated. The effects of pH and surfactants on ketoprofen (a BCS II weak
acid) were investigated. The dramatic enhancement of in vitro solubility/dissolution
attributable to an increase of pH and presence of SLS mimics the in vivo
solubilization/dissolution behavior of ketoprofen, when the pH increases from 1 to 2 in
the stomach to 5 to 6 in the duodenum. Further, even at the same pH and buffer
concentration, the importance of buffer species was demonstrated by a) 50-200% faster
intrinsic dissolution rates of ketoprofen and indomethacin in USP SIF, FaSSIF
phosphates than in various concentrations of bicarbonates more reflective of in vivo; and
b) the dependence of buffer differential on biopharmaceutical properties, e.g., drug pKa,
solubility and diffusivity. Finally, simple phosphate buffers are recommended: at pH 6.5,
ketoprofen and indomethacin require 13 -14 mM and 3-4 mM phosphate buffer to match
85% and 108% of the dissolution rates in 15 mM bicarbonate buffer, respectively.
In summary, this research demonstrates that to establish a meaningful in vitro
bioequivalence method, both the hydrodynamics and the GI fluids composition should be
carefully considered.
xii

1
CHAPTER I.
INFLUENCE OF FASTED STATE GASTROENTEROLOGICAL FACTORS ON IN VIVO DISSOLUTION OF POORLY SOLUBLE DRUGS
Introduction
Orally administered drug products are the most dominant dosage forms. However,
predicting oral drug absorption remains a challenge due to the variety of
biopharmaceutical properties of the drug and drug products, as well as the complexity of
gastrointestinal (GI) physiology.
Gastrointestinal tract presents a complex environment for orally administered drugs.
In healthy humans at fasted state, there are two important physiological factors impacting
on drug dissolution and the subsequent absorption: 1). the hydrodynamics of GI tract; and
2) the components of GI fluids. The hydrodynamics of GI tract is intimately related to GI
motility, which emcompasses gastric emptying, migrating motility complex (MMC), and
the frequency and intensity of small intestine movement, while the critical GI fluid
components are pH, bile salts and buffer species, volume, enzymes, osmolarity and
calcium contents may be also important. In addition, GI transit time and splanchnic
blood flow may also play indirect roles in drug absorption. All of these GI physiological
factors are dynamically interacting with each other, which is further complicated by high
variability within and between individuals.

2
Biopharmaceutical properties of the active pharmaceutical ingredient (API) are the
inherent nature of a drug molecule, which determines the rate of drug dissolution and
extent of drug absorption. The biopharmaceutical classification system (BCS) proposed
by Amidon et. al. has established the foundation for correlating the biopharmaceutical
properties of an API with its in vivo performance. The four BCS classes, based on drug
solubility and permeability 1, are listed in Table 1.1. BCS II drugs exhibit high
permeability and low solubility, and their oral absorption is rate-limited by in vivo
dissolution. In light of the reality that more and more BCS II drugs are being discovered,
investigating the correlation of in vitro dissolution of BCS II drugs with their in vivo
performance, and gaining a mechanistic understanding of IVIVC warrants more research
efforts.
The objective of this project is to investigate the in vitro dissolution factors
reflecting the in vivo dissolution GI physiological factors such as motility, pH, surfactants
and buffer species under fasted state, focusing on BCS II drugs. These four
aforementioned GI physiological determinants, and their impact on dissolution of BCS II
drugs, are reviewed in the following sections.
Gastrointestinal factors
Motility
The GI hydrodynamic conditions are highly dependant on food intake and highly
variable among individuals 2-4. The gastrointestinal motility that impacts on drug
dissolution and absorption includes gastric emptying 2,5, and the mixing, segmental
contractions and propulsive movement in the small intestine 6-8. The gastric emptying is

3
affected by a number of factors, including the intake volume, calories, viscosity, particle
size, pH, osmolarity and temperature 2,3,5,9. Generally, the emptying time is shorter for
content with characteristics of large volume (≥ 200 mL), low calorie, iso-osmotic, low
viscosity and higher pH, compared to content with small volume (≤ 50 mL), high calorie,
hyper- or hypotonic, high viscosity and low pH 2,10. It was also demonstrated that young
normal premenopausal women have slower gastric emptying rate relative to age-matched
men, which is due to a decreased antral contractility as supported by both dynamic antral
scintigraphy and antroduodenal manometry 11. The gastric emptying is further
complicated by the fasted-state migrating motility complexes (MMC). MMCs exist and
cycle through three phases, which are motor quiescent period (Phase I, no contraction),
intermittent contractions (Phase II, slow waves and low intensity) and strong contractions
(Phase III, house keeping wave) 2,12,13. The MMC phase III begins in the stomach, and
propagates to the pylorus, and then increases slowly down through the small intestine at
fasting state 6.
The hydrodynamics of the small intestine is more consistent compared to the
stomach in terms of movement pattern and flow rates. The dominant motility patterns in
the small intestine are the circumferential and longitudinal contractions. The
circumferential movement mixes the GI contents in radical direction, and the longitudinal
movement moves the GI contents in the distal direction. The segmental amplitude
oscillates between a minimal mean of 9.7 mm to a maximum mean of 20.5 mm for the
cross section diameter14. Intestinal motility is regulated by neurological,
endocrinological and gastrointestinal mechanisms, in addition to food intake 15-17. In
fasted state, the flow rate stays mostly between 0 and 2.0 mL/min, with a net average of

4
0.73 mL/min in the jejunum and 0.43 mL/min in the ileum 18. In the fed states, the flow
rate increases to a range of 0 - 7.0 mL/min, with an average of 3.0 mL/min and 2.0
mL/min, respectively 18.
pH
In fasted state, the gastric pH is highly variable with a range of pH 1.2 – 8.38 4,19-21.
It was reported that young Caucasians have gastric pH below 3 under 90% of the fasted
state, and 25-75% of them within pH range 1.4 to 2.1 22. In comparison, about 10-20% of
the same ethnic groups over the age of 65 years have a gastric pH value of 6 or higher,
and the percentage seems to be even higher for Japanese subjects 23.
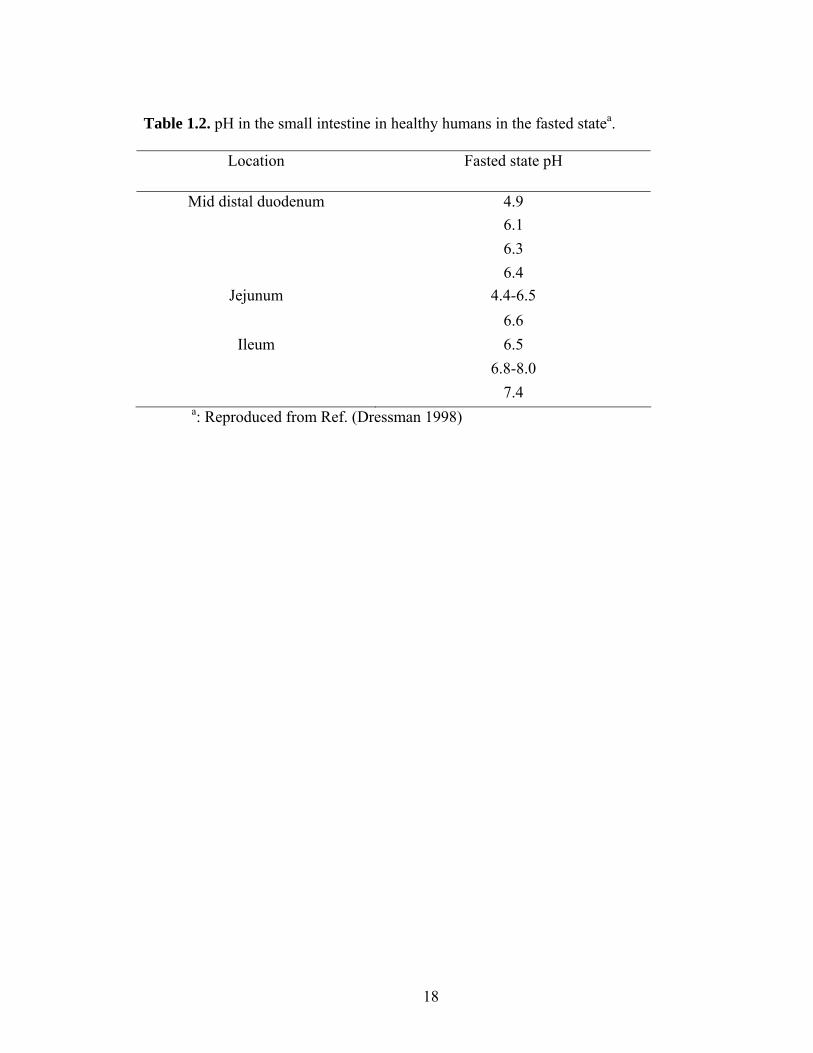
In general, the pH values in the small intestine are higher than in the stomach 24.
While the pH value in the small intestine is more consistent and much less dependent on
fasted and fed states, there is an upward pH gradient from the duodenum towards the
ileum, covering a range of 6.0 - 7.5 25, as shown in Table 1.2. This pH range is consistent
with the recent findings from duodenal aspirates. For example, the median duodenum pH
value was reported to be 6.2 from twenty healthy human duodenal aspirates 19, and in
another paper the pH value from twelve pooled human intestinal fluid collected at the
fourth part of the duodenum at fasted state was found to be 6.7 26. In jejunum, the pH
shifts to higher values. It has been reported that the average jejunum pH values are 6.8 27,
7.1 21and 7.5 28, at fasted state.
Bile Salts
A detailed review of the physical chemistry of bile as it pertains to the physiology
of GI tract has been published in 1980s 29. The dominant bile salts are cholate,
deoxycholate, chenodeoxycholate, and their corresponding tauro- and glycol-conjugated
5
forms 27,30. The total concentration of bile salts in fasted state stomach is generally low.
In radiolabeled pool sample, the average bile salts is 80 µM 31. Gastric fluids collected
from 36 healthy volunteers showed a range of 0.0 – 2.5 mM, an average value of 0.2 mM,
with a standard derivation of 0.5 mM 21. Other researchers reported an average value of
0.275 mM, while 50% of their samples were not detected with bile salt concentration 32.
In a most recent study, it was reported that the gastric bile salts concentration at fasted
state is below the quantification limit, i.e., less than 0.5 mM 19. These results indicate
that large variability exists for the gastric bile salt concentrations, partially due to variable
duodenal reflux among individuals.
In upper small intestine, the bile salt concentration is generally higher than that in
stomach. For example, in earlier studies the average bile salt concentration at fasted state
was reported to be 4.5-6.4 mM in duodenum, and 5-6 mM in jejunum 33-35. Later,
Lindahl et. al. reported a slightly lower average bile salt concentration in jejunal fluids
was 2.9 mM, with a standard derivation of 2.9 mM 21. This value is consistent with
recent studies, such as 2.00 ± 1.92 mM 36, 2.0 ± 0.2 mM 28, 2.6 mM 19, 3.5 ± 1.6 mM 27,
and 2.82 mM 26, in fasting jejunal fluids. The literature data indicates that bile
concentration along the GI tract is generally low at the fasting state.
An indirect indication of the bile salt contents is surface tension. The surface
tension is significantly lower than that of water, i.e., in the range of 33 – 46 mNm-1 in
fasting stomach, and 28 – 33.6 mNm-1 in upper small intestine 4,19,27,28. It should be noted
that a total bile salt concentration of 10 mM may present variation in surface tension
measurement because of the various compositions of di- or trihydroxy- species in the bile
salts 37.

6
Buffer Species
The dominant buffer species in human body fluids, including the gastrointestinal
fluids, are bicarbonates. Gastroduodenal bicarbonate has long been known as the main
buffer system to create a pH gradient along the gastrointestinal lumen 38-41. It was also
known that endogenous bicarbonate is mainly transported into the lumen by Na-HCO3
cotransporters (NBC) through cystic fibrosis transmembrane regulator (CFTR) pathway,
and partially by paracellular migration depending on intestinal transmucosal hydrostatic
pressure and motility. The secretion of bicarbonate into mucus gel provides a near-
neutral pH at the epithelial surfaces in the stomach and duodenum, neutralizing luminal
acids 42-44. Bicarbonate concentrations in human GI fluids have been reported to be
within a dynamic range, depending on the fasted and fed states as well as local regions
along the GI tract 39,45-47. For example, as early as 1935, the bicarbonate concentration
was measured directly from the fasted human duodenum using titration method, and the
values were reported in the range of 4-21 mM 38,40, with an average of 15 mM 47. More
recently, the 2COP in the human duodenum was measured using
2COP electrode in situ with
perfusion of 154 mM NaCl at 2 mL/min, and then the HCO3- concentration was
calculated to be mean value of 6.7 ± 0.34 mM at pH 7.22 using the Henderson-
Hasselbalch equation 48. In the literature of pharmaceutical field, the bicarbonate
concentration has been expressed indirectly using buffer capacity. For example, Person
et. al. 28 showed that the mean value of the buffer capacity of human jejunum at fasted
state is 2.4-2.8 mmolL-1pH-1, which corresponds to 18.1 mM of bicarbonate
concentration at pH 7.5 assuming that the buffer capacity is solely attributed by the
bicarbonate buffer species. Recently, Kalantizi et al.19 reported the range of buffer
7
capacity for distal duodenum of fasted human, which is equivalent to 4.35 – 21.6 mM of
HCO3- at pH 6.2. It should be noted that the buffer capacity of the fasting intestinal
fluids is contributed by not only bicarbonates, but also a very small amount of phosphates
(0.4 – 1.8 mM from 4 volunteers) 49 as well as endogenous enzymes and amino acids.
Nonetheless, even though bicarbonate buffer is the obvious choice, it has been rarely
employed in drug dissolution testing.
Other Gastrointestinal Factors
In addition to GI motility, pH, bile salts and buffer species, the transit time along
small intestine 50-53, the fluid volume 54-56 and splanchnic blood flow 57-59, also impact on
drug dissolution and/or drug absorption process. These factors are frequently further
complicated by liquid or solid intake.
Effects of GI Factors on BCS II Drugs
BCS II class drugs exhibit characteristics of high permeability and low solubility,
and their drug solubility or dissolution rate is the rate limiting step in drug absorption.
This class of drugs includes non-ionizable compounds such as carbamazepine,
fenofibrate and griseofulvin, and ionizable compounds such as ibuprofen (acid) and
diazepam (base).
For non-ionizable compounds, the pH changes along the GI tract would not have an
impact on drug solubilization or dissolution, whereas the contents of bile salts would
significantly increase the solubilization thus enhancing its dissolution rate. Examples are
griseofulvin 60 and fenofibrate 61. In the case of griseofulvin, its solubility increased 107-
fold, 31-fold, fourfold, and threefold in the presence of SDS, CTAB, Tween 80, and

8
Cremophor EL. Dissolution into SDS and CTAB were markedly enhanced as well, with
about one-third as much as solubility enhancement 60. The less significantly increased
dissolution rate relative to solubility is due to a smaller diffusion coefficient of the drug-
loaded micelles 60. For fenofibrate, its solubility was enhanced approximately 2000-fold,
and intrinsic dissolution rate was improved about 500-fold, in a pH 6.8 buffer containing
2% (w/v) sodium lauryl sulfate compared to that in buffer alone 61. At fasted state, the
concentrations of bile salts are low, in the range of 2.0-6.0 mM, reported by many
researchers. Thus, compared with the fed state, the impact of bile salts on poorly soluble
non-ionizable drugs is far less significant in fasted state.
For BCS II weak bases such as dipyridamole (pKa: 5.7-6.4) 62,63 and ketoconazole
(pKa: 2.94 and 6.51) 64,65, their in vivo solubility and dissolution are more complex
compared with the weak acids. BCS II weak bases, with pKb values that could lead to
ionizing greatly in the gastric acidic environment, would dissolve quickly in stomach.
Once they enter the duodenum, the extent of ionization is significantly reduced due to
elevated pH 26,66. It is very likely that the ionized base form would precipitate at the
upper small intestine. The rate and extent of precipitation, and the size and the
polymorphic form of the precipitates, are controlled by a number of factors such as the
extent of supersatuartion and solid form of the weak base, and the pH, fluid volume,
viscosity and bile salts concentration of the duodenum. The gastric pH appeared to be a
primary determinant in dipyridamole absorption in the elderly 67. In 11 healthy subjects,
the low fasting gastric group was pretreated with or without 40 mg of famotidine, and the
high fasting gastric group (pH > 5) was pretreated with or without 1360 mg of glutamic
acid hydrochloride. In both groups, an elevated gastric pH is responsible for not only a

9
decreased absorption in terms of Cmax and AUC, but also a slower Tmax, in
dipyridamole 67. In a recent study, the in vitro dissolution rate and in vivo dog absorption
of two weak bases, i.e., ketoconazole and dipyridamole, were demonstrated to be pH-
dependant 68. Particularly, the AUC increased significantly when the gastric pH is
lowered by pentagastrin pH of 2-3, whereas AUC decreased markedly with an elevated
gastric pH to 5-7.5 by famotidine treatment. For ketoconozloe, a 30-fold difference was
observed between the pengastrin and famotidine groups, and for dipyridamole the
difference was 9-fold 68.
For very weak acids with high pKa values such as phenytoin (pKa: 8.06) 69, its
ionization would be very limited in the stomach as well as along the small intestine, thus
resulting in the unionized free acid as the dominant form in the GI tract. For BCS II
weak acids such as ibuprofen and ketoprofen, with respective pKa values of 4.2 and 4.5,
which are in the GI physiological range, extensive ionization of these compounds at
upper small intestine is expected. This is because the average pH in upper small intestine
is around 5.8 - 6.5, which is at least 1 unit higher than the drug pKa, increasing the
apparent solubility of the weak acid by 10 - 100 fold. Thus, their in vivo solubility and
subsequent dissolution would be high, presumably behaving more likely as a BCS I
compound. However, the combined effects of pH and surfactants on the solubilization
and dissolution of weak acid drugs has received little attention, especially in view of
reflecting an in vivo change of pH and surfactant along the gastrointestinal tract using an
in vitro model. Therefore, it is important to investigate the effects of pH combined with
surfactant on the solubility and dissolution of BCS II water-poorly soluble weak acids in
an in vitro environment.

10
In addition to pH and bile salts, the buffer species, namely, the bicarbonate, is a
critical factor that significantly impact on dissolution of ionizble drugs, but has been
overlooked in the past. As stated previously, bicarbonate is the dominant physiological
buffer species along the GI tract. Further, buffer concentration and species have been
shown to impact on the dissolution of ionizable drugs such as naproxefen. The intrinsic
dissolution rate of naproxen increase with the escalation of buffer concentration, which
was demonstrated consistently in three buffers including phosphate, citrate and acetate 70.
More interestingly, the work also showed that naproxen demonstrated a decreased
dissolution rate in the following buffer species: phosphate > citrate > acetate, despite all
the buffers were maintained at the same buffer concentration and same pH value 70.
Therefore, it is important to investigate the impact of bicarbonate species, and to evaluate
the difference between bicarbonate and pharmaceutically commonly used buffer such as
phosphate, on ionizable drug dissolution.
It should be noted that the same active species could be synthesized as different salt
forms, or crystallized as different crystal forms (polymorphs), solvates (pseudo-
polymorphs) and amorphous form. All of these chemical and physical transformations of
same active species could have an impact on drug dissolution and absorption, particularly
for the BCS II drugs. However, in pharmaceutical industries their development is more
likely due to the need of creating feasible processes for bulk and formulation
manufacturing, fulfilling regulatory requirements and extending exclusive marketing
right via patent. The API should be distinguished from its drug products. In the content
of immediate-release dosage forms, the drug dissolution can still be modified
significantly by the excipients and/or manufacturing conditions during the formulation

11
processes. To name a few, manufacturing variables could have an impact on dissolution
because they could induce changes in crystal forms, surface characteristics, particle size,
porosity of API and /or drug products 71-74. For example, particle size reduction is
frequently used in processing API as well as intermediate drug products to enhance drug
dissolution/absorption and/or manufacturing feasibility. It has been reported that the
diffusional layer thickness is a function of drug particle sizes, which subsequently would
impact on the drug dissolution rate 74-76. The dependence of diffusional layer thickness
on the hydrodynamic conditions that is pharmaceutically relevant such as in a USP
device or under normal GI motility, however, has been largely ignored. Furthermore, the
combined effects of particle size and fluid velocity on diffusional layer thickness have yet
to be addressed.
Selection of Model Compounds
The model compounds employed in this thesis are fenofibrate, ketoprofen and
indomethacin. The chemical structures and the biopharmaceutical properties of these
three compounds are showed in Figure 1.1 and Table 1.3, respectively.
Fenofibrate was selected to investigate the combined effects of particle size and
fluid velocity on diffusional layer thickness for its non-ionizable and poorly soluble
nature, and its existence as a single polymorph. Ketoprofen was chosen to investigate the
combined effects of pH and surfactants simulating upper small intestine for its pKa value
within GI physiological range and its poor solubility. Ketoprofen and indomethacin were
employed to investigate the effects of buffer species, i.e., bicarbonates versus phosphates,
owing to their pKa value within GI physiological range and its poor solubility.

12
Implications of GI Factors in Establishing a Bioequivalence Dissolution
Methodology
The purposes of developing a dissolution methodology are to serve quality control
(QC) or bioequivalence (BE) evaluation 77-79. The routinely used dissolution testing
aimed for QC is to ensure that the drug products meet dissolution specifications, comply
with regulatory requirements, and detect manufacture reproducibility. The focus of a BE
dissolution testing is shifted to provide the in vivo performance of a drug product. Its
primary goal is to predict in vivo dissolution, and potentially in vivo absorption for highly
permeable drugs 80. Therefore, the design of these two dissolution testing are quite
different. Ideally, the QC dissolution should be the same or very similar to the BE
dissolution testing, thus the in vitro dissolution would reflect the in vivo situation,
because assuring the in vivo quality is the ultimate goal of a drug product.
Most of the dissolution related literature addresses the needs of QC, and only
limited research has been invested to design BE dissolution methods. In establishing a
meaningful BE dissolution methodology, two very important aspects must be considered:
the hydrodynamic conditions along the GI tract and the complex contents of the GI fluids.
The interplay between the GI hydrodynamics and GI fluids present the most challenging
environment in designing a biorelevant dissolution test.
The dynamic and heterogeneous fluid velocity of the GI tract induced by GI
motility remains an obstacle for an accurate simulation of in vivo hydrodynamic
conditions, despite of several attempts 81-83. Meanwhile, investigation of the
pharmacopeial type of dissolution apparatus demonstrates the complexity of fluid
13
velocity profiles in either basket or paddle device 84-87. Further, a comparison of these
two results clearly reveals a remarkable gap between the pharmacopeial apparatus
hydrodynamics and the in vivo physiological hydrodynamics. The geometric, kinematic
and dynamic factors in the pharmacopeial apparatus are very different from those along
the in vivo GI tract. Therefore, the USP apparatus such as the type II paddle apparatus is
suitable for QC purpose monitoring the mass transport of API from the dosage forms.
However, it is much less relevant in assessing the in vivo performance of a drug product.
Even though the USP dissolution apparatus II has been most widely employed in
checking the release profiles of drug products, fundamental understanding of how the
drug particles and fluid velocities are combined to impact on drug dissolution has yet to
be explored. For example, in the original Noyes-Whitney equation
( )s tdM D A C Cdt h
= − − , the dependence of h on drug particle size and paddle speeds
have never been investigated quantitatively in a USP dissolution apparatus II. Many
dissolution models assume h to be a constant, or comparable with particle radius. This
simple assumption is convenient; however, it has not been supported by any direct
experimental data. In addition, such an assumption is contradictory to a basic fluid
dynamic principle, i.e., the apparent diffusional layer thickness is altered by
hydrodynamics. Even though a USP dissolution apparatus II is well-defined, the fluid
velocity is clearly changing with the paddle speeds. Thus, a changing apparent h with
paddle speeds is foreseeable and an alternation of h therefore reciprocally affects the
dissolution rate.
The equally important consideration in designing a BE dissolution test is the
selection of appropriate dissolution medium. Dissolution media mimicking the in vivo GI

14
fluids has attracted numerous interests and achieved significant progress in the past
decade. The earliest proposal is found in the paper discussing pH-partition hypothesis to
estimate drug absorption by Dressman et al. in 1985 88. Later, the historical paper by
Amidon et al. enabled further enhancement of biorelevant media under the frame of
Biopharmaceutics Classification System (BCS) 1. In 1997 characterization of fluids from
stomach and upper jejunum in healthy fasted-state volunteers was conducted 21. In 1998
based on human GI physiology, the milestone paper by Dressman et al. provided the
insightful and comprehensive initiatives in designing dissolution medium mimicking in
vivo GI fluids 4. More recently, solubility and dissolution of neutral and ionizable weak
acids and bases were investigated in human, canine, and simulated fluids. The major aim
of these studies is to investigate how drugs with various properties would dissolve under
normal GI conditions, in human, dog and simulated biorelevant media 19,26-28,36,89.
Almost all these studies focused on pH, osmolality and bile acids. However, the
intuitively physiological buffer, i.e., bicarbonate buffer, as well as its impact on drug
dissolution, has been rarely investigated 90. Gastroduodenal bicarbonate has long been
known as the main buffer system maintaining a pH gradient along the gastrointestinal
lumen 41. As a predominant buffer in human gastrointestinal physiology, bicarbonate has
been overlooked in drug dissolution testing. Most published studies use phosphate or
acetate buffers instead, creating a disconnect between the physiological buffer species
and the buffer species used in in vitro dissolution studies, including the simulated GI
fluids. To this date, there has been few experimental data or theoretical derivation
pertaining to bicarbonate buffer as a dissolution medium. In literature, it has been
reported that the concentration and buffer species significantly impact on dissolution

15
rates of ionizable drugs even at the same pH value 70,91,92. Thus there is a need to
characterize the dissolution properties of bicarbonate buffer and compare them with those
of the more often–used buffer systems. In order to mimic the in vivo source of
bicarbonate, an external supply of CO2 is necessary to maintain the bicarbonate in the in
vitro dissolution media. For example, this can be achieved using purging CO2 gas into
the dissolution media sustaining a partial CO2 pressure through the testing.
Summary
In summary, the two essential aspects that must be considered in order to mimic in
vivo situation and to design meaningful BE dissolution, are the GI hydrodynamics and GI
fluid contents. The GI motility determines how fast the drug is entering the duodenum
and jejunum, how long the drug is staying in the small intestine, and how dynamic a drug
particle is interacting with the GI fluids. Chapter 2 of this thesis deals with the combined
effects of drug particle size and paddle speed on diffusional layer thickness of a poorly
soluble drug, fenofibrate, in a USP dissolution apparatus II. The GI fluid contents not
only determine the drug solubility but also the drug dissolution rate along the GI tract.
Among various GI fluid factors, chapter 3 focuses on the combined effects of pH and
surfactants on a poorly soluble and ionizable weak acid, ketoprofen, under normal
conditions in the upper small intestine. Further, chapter 4 examines the impact of buffer
species, particularly the physiological bicarbonates versus pharmaceutical phosphates, on
weak BCS II acids such as ketoprofen and indomethacin.

16
Specific Aims: (1). To determine the combined effects of particle size and fluid
hydrodynamics on diffusional layer thickness of a poorly soluble drug, fenofibrate. (2).
To investigate the solubilization and dissolution of a poorly soluble and weakly acid,
ketoprofen, under the conditions mimicing the pH and surfactants along small intestine.
(3). To compare the pharmaceutical phosphate buffers with physiological bicarbonates in
dissolution of BCS II weak acids, ketoprofen and indomethacin.

17
Table 1.1. Biopharmaceutical Classification System (BCS).
BCS class I: High solubility
High Permeability
BCS class II: Low solubility
High Permeability
BCS class III: High solubility
Low Permeability
BCS class IV: Low solubility
Low Permeability
18
Table 1.2. pH in the small intestine in healthy humans in the fasted statea.
Location Fasted state pH
Mid distal duodenum 4.9 6.1 6.3 6.4
Jejunum 4.4-6.5 6.6
Ileum 6.5 6.8-8.0 7.4
a: Reproduced from Ref. (Dressman 1998)
19
Table 1.3. Biopharmaceutical properties of fenofibrate, ketoprofen and indomethacin.
Biopharmaceutical properties
Fenofibrate Ketoprofen Indomethacin
Intrinsic solubility in water at 37°C
< 0.3 µg/mL 0.253 mg/mL 2.43 µg/mL
Permeability (cm/s) ClogP: 3.86 a8.7×10-4 b3.4×10-4
Diffusivity (cm2/s) 7.15×10⁻⁶ 9.3×10⁻⁶ 8.0×10⁻⁶
pKa Non-ionizable 4.76 4.17 Maximum dose (mg)
200 75 50
Provisional BCS classification
BCS II BCS II BCS II
Therapeutic category
Lipid-regulating fibric
Nonsteroid anti-inflammatory acid
Nonsteroid anti-inflammatory acid
a: human jejunum permeability b: calculated using ADMET Predictor 1.2.

20
Fenofibrate
Ketoprofen
Indomethacin
Figure 1.1. The chemical structures of fenofibrate, ketoprofen and indomethacin.
O
COOH
CH3
OO CH3
O CH3
H3C CH3
O
Cl
N
CH3O
H3C
COOH
O
Cl

21
References. 1. Amidon GL, Lennernas H, Shah VP, Crison JR. 1995. A theoretical basis for a biopharmaceutic drug classification: The correlation of in vitro drug product dissolution and in vivo bioavailability. Pharm Res 12:413-420. 2. Oberle RL, Chen TS, Lloyd C, Barnett JL, Owyang C, Meyer J, Amidon GL. 1990. The influence of the interdigestive migrating myoelectric complex on the gastric emptying of liquids. Gastroenterology 99:1275-1282. 3. Maughan RJ, Leiper JB. 1996. Methods for the assessment of gastric emptying in humans: An overview. Diabet Med 13:S6-10. 4. Dressman JB, Amidon GL, Reppas C, Shah VP. 1998. Dissolution testing as a prognostic tool for oral drug absorption: Immediate release dosage forms. Pharm Res 15:11-22. 5. Chaudhuri TK, Fink S. 1990. Update: Pharmaceuticals and gastric emptying. Am J Gastroenterol 85:223-230. 6. Hansen MB. 2002. Small intestinal manometry. Physiol Res 51:541-556. 7. Jones MP, Wessinger S. 2005. Small intestinal motility. Curr Opin Gastroenterol 21:141-146. 8. Smout AJ. 2006. Recent developments in gastrointestinal motility. Scand J Gastroenterol Suppl:25-31. 9. Medhus A, Sandstad O, Bredesen J, Husebye E. 1995. The migrating motor complex modulates intestinal motility response and rate of gastric emptying of caloric meals. Neurogastroenterol Motil 7:1-8. 10. Hausken T, Mundt M, Samsom M. 2002. Low antroduodenal pressure gradients are responsible for gastric emptying of a low-caloric liquid meal in humans. Neurogastroenterol Motil 14:97-105. 11. Knight LC, Parkman HP, Brown KL, Miller MA, Trate DM, Maurer AH, Fisher RS. 1997. Delayed gastric emptying and decreased antral contractility in normal premenopausal women compared with men. Am J Gastroenterol 92:968-975. 12. Coupe AJ, Davis SS, Evans DF, Wilding IR. 1991. Correlation of the gastric emptying of nondisintegrating tablets with gastrointestinal motility. Pharm Res 8:1281-1285. 13. Luiking YC, van der Reijden AC, van Berge Henegouwen GP, Akkermans LM. 1998. Migrating motor complex cycle duration is determined by gastric or duodenal origin of phase iii. Am J Physiol 275:G1246-1251. 14. Froehlich JM, Patak MA, von Weymarn C, Juli CF, Zollikofer CL, Wentz KU. 2005. Small bowel motility assessment with magnetic resonance imaging. J Magn Reson Imaging 21:370-375. 15. Kerlin P, Phillips S. 1982. Variability of motility of the ileum and jejunum in healthy humans. Gastroenterology 82:694-700. 16. Husebye E. 1999. The patterns of small bowel motility: Physiology and implications in organic disease and functional disorders. Neurogastroenterol Motil 11:141-161. 17. Thomson AB, Keelan M, Thiesen A, Clandinin MT, Ropeleski M, Wild GE. 2001. Small bowel review: Normal physiology part 2. Dig Dis Sci 46:2588-2607. 18. Kerlin P, Zinsmeister A, Phillips S. 1982. Relationship of motility to flow of contents in the human small intestine. Gastroenterology 82:701-706.

22
19. Kalantzi L, Goumas K, Kalioras V, Abrahamsson B, Dressman JB, Reppas C. 2006. Characterization of the human upper gastrointestinal contents under conditions simulating bioavailability/bioequivalence studies. Pharm Res 23:165-176. 20. Altman PL, Katz DD. 1961. Blood and other body fluids. Biological handbooks, ed., Washington: Federation of American Societies for Experimental Biology. p xvii, 540 p. 21. Lindahl A, Ungell AL, Knutson L, Lennernas H. 1997. Characterization of fluids from the stomach and proximal jejunum in men and women. Pharm Res 14:497-502. 22. Dressman JB, Berardi RR, Dermentzoglou LC, Russell TL, Schmaltz SP, Barnett JL, Jarvenpaa KM. 1990. Upper gastrointestinal (gi) ph in young, healthy men and women. Pharm Res 7:756-761. 23. Ogata H, Aoyagi N, Kaniwa N, Ejima A, Suzuki K, Ishioka T, Morishita M, Ohta K, Takagishi Y, Doi Y, et al. 1984. Development and evaluation of a new peroral test agent ga-test for assessment of gastric acidity. J Pharmacobiodyn 7:656-664. 24. Davis SS, Hardy JG, Fara JW. 1986. Transit of pharmaceutical dosage forms through the small intestine. Gut 27:886-892. 25. Coupe AJ, Davis SS, Wilding IR. 1991. Variation in gastrointestinal transit of pharmaceutical dosage forms in healthy subjects. Pharm Res 8:360-364. 26. Kalantzi L, Persson E, Polentarutti B, Abrahamsson B, Goumas K, Dressman JB, Reppas C. 2006. Canine intestinal contents vs. Simulated media for the assessment of solubility of two weak bases in the human small intestinal contents. Pharm Res 23:1373-1381. 27. Perez de la Cruz Moreno M, Oth M, Deferme S, Lammert F, Tack J, Dressman J, Augustijns P. 2006. Characterization of fasted-state human intestinal fluids collected from duodenum and jejunum. J Pharm Pharmacol 58:1079-1089. 28. Persson EM, Gustafsson AS, Carlsson AS, Nilsson RG, Knutson L, Forsell P, Hanisch G, Lennernas H, Abrahamsson B. 2005. The effects of food on the dissolution of poorly soluble drugs in human and in model small intestinal fluids. Pharm Res 22:2141-2151. 29. Schultz SG, Rauner BB, Wood JD, American Physiological Society (1887-). 1989. The gastrointestinal system. ed., Bethesda, Md.: American Physiological Society. p v.621-661. 30. Wiedmann TS, Kamel L. 2002. Examination of the solubilization of drugs by bile salt micelles. J Pharm Sci 91:1743-1764. 31. Rhodes J, Barnardo DE, Phillips SF, Rovelstad RA, Hofmann AF. 1969. Increased reflux of bile into the stomach in patients with gastric ulcer. Gastroenterology 57:241-252. 32. Efentakis M, Dressman JB. 1998. Gastric juice as a dissolution medium: Surface tension and ph. Eur J Drug Metab Pharmacokinet 23:97-102. 33. van Berge Henegouwen GP, Hofmann AF. 1978. Nocturnal gallbladder storage and emptying in gallstone patients and healthy subjects. Gastroenterology 75:879-885. 34. Tangerman A, van Schaik A, van der Hoek EW. 1986. Analysis of conjugated and unconjugated bile acids in serum and jejunal fluid of normal subjects. Clin Chim Acta 159:123-132.
23
35. Marzio L, Neri M, Capone F, Di Felice F, De Angelis C, Mezzetti A, Cuccurullo F. 1988. Gallbladder contraction and its relationship to interdigestive duodenal motor activity in normal human subjects. Dig Dis Sci 33:540-544. 36. Pedersen BL, Brondsted H, Lennernas H, Christensen FN, Mullertz A, Kristensen HG. 2000. Dissolution of hydrocortisone in human and simulated intestinal fluids. Pharm Res 17:183-189. 37. Luner PE. 2000. Wetting properties of bile salt solutions and dissolution media. J Pharm Sci 89:382-395. 38. Karr WG, Abbott WO, Sample AB. 1935. Intubation studies of the human small intestine. Iv. Chemical characteristics of the intestinal contents in the fasting state and as influenced by the administration of acids, of alkalies and of water. J Clin Invest 14:893-900. 39. Rees WD, Botham D, Turnberg LA. 1982. A demonstration of bicarbonate production by the normal human stomach in vivo. Dig Dis Sci 27:961-966. 40. Tietz NW. 1995. Clinical guide to laboratory tests. 3rd ed., Philadelphia: W.B. Saunders Co. p xxxix, 1064 p. 41. Allen A, Flemstrom G. 2005. Gastroduodenal mucus bicarbonate barrier: Protection against acid and pepsin. Am J Physiol Cell Physiol 288:C1-19. 42. Johnson LR. 1994. Physiology of the gastrointestinal tract. 3rd ed., New York: Raven Press. 43. Konturek PC, Konturek SJ, Ochmanski W. 2004. Neuroendocrinology of gastric h+ and duodenal hco3- secretion: The role of brain-gut axis. Eur J Pharmacol 499:15-27. 44. Konturek SJ, Konturek PC, Pawlik T, Sliwowski Z, Ochmanski W, Hahn EG. 2004. Duodenal mucosal protection by bicarbonate secretion and its mechanisms. J Physiol Pharmacol 55 Suppl 2:5-17. 45. Rune SJ. 1972. Acid-base parameters of duodenal contents in man. Gastroenterology 62:533-539. 46. Kristensen M. 1975. Titration curves for gastric secretion. A study on duodenal ulcer and gastric ulcer with particular reference to the effect of glycopyrronium. Scand J Gastroenterol Suppl 32:11-144. 47. Goodman LS, Hardman JG, Limbird LE, Gilman AG. 2001. Goodman and gilman's the pharmacological basis of therapeutics. 10th ed., New York: McGraw-Hill, Medical Publishing Division. p xxvii, 2148 p. [2141] leaf of fold. plates. 48. Repishti M, Hogan DL, Pratha V, Davydova L, Donowitz M, Tse CM, Isenberg JI. 2001. Human duodenal mucosal brush border na(+)/h(+) exchangers nhe2 and nhe3 alter net bicarbonate movement. Am J Physiol Gastrointest Liver Physiol 281:G159-163. 49. Brouwers J, Augustijns P. GPEN 2006, Lawrence, Kansas, 2006. 50. Amidon GL, DeBrincat GA, Najib N. 1991. Effects of gravity on gastric emptying, intestinal transit, and drug absorption. J Clin Pharmacol 31:968-973. 51. Moes AJ. 1993. Gastroretentive dosage forms. Crit Rev Ther Drug Carrier Syst 10:143-195. 52. Kimura T, Higaki K. 2002. Gastrointestinal transit and drug absorption. Biol Pharm Bull 25:149-164. 53. Soffer EE. 2000. Small bowel motility: Ready for prime time? Curr Gastroenterol Rep 2:364-369.

24
54. Gisolfi CV, Summers RW, Lambert GP, Xia T. 1998. Effect of beverage osmolality on intestinal fluid absorption during exercise. J Appl Physiol 85:1941-1948. 55. Ryan AJ, Lambert GP, Shi X, Chang RT, Summers RW, Gisolfi CV. 1998. Effect of hypohydration on gastric emptying and intestinal absorption during exercise. J Appl Physiol 84:1581-1588. 56. Schneeman BO. 2002. Gastrointestinal physiology and functions. Br J Nutr 88 Suppl 2:S159-163. 57. Sieber C, Beglinger C, Jager K, Stalder GA. 1992. Intestinal phase of superior mesenteric artery blood flow in man. Gut 33:497-501. 58. Oosterhuis B, Jonkman JH. 1993. Pharmacokinetic studies in healthy volunteers in the context of in vitro/in vivo correlations. Eur J Drug Metab Pharmacokinet 18:19-30. 59. Matheson PJ, Wilson MA, Garrison RN. 2000. Regulation of intestinal blood flow. J Surg Res 93:182-196. 60. Balakrishnan A, Rege BD, Amidon GL, Polli JE. 2004. Surfactant-mediated dissolution: Contributions of solubility enhancement and relatively low micelle diffusivity. J Pharm Sci 93:2064-2075. 61. Granero GE, Ramachandran C, Amidon GL. 2005. Dissolution and solubility behavior of fenofibrate in sodium lauryl sulfate solutions. Drug Dev Ind Pharm 31:917-922. 62. Gu CH, Rao D, Gandhi RB, Hilden J, Raghavan K. 2005. Using a novel multicompartment dissolution system to predict the effect of gastric ph on the oral absorption of weak bases with poor intrinsic solubility. J Pharm Sci 94:199-208. 63. Tabak M, Borisevitch IE. 1992. Interaction of dipyridamole with micelles of lysophosphatidylcholine and with bovine serum albumin: Fluorescence studies. Biochim Biophys Acta 1116:241-249. 64. Carlson JA, Mann HJ, Canafax DM. 1983. Effect of ph on disintegration and dissolution of ketoconazole tablets. Am J Hosp Pharm 40:1334-1336. 65. Hoeschele JD, Roy AK, Pecoraro VL, Carver PL. 1994. In vitro analysis of the interaction between sucralfate and ketoconazole. Antimicrob Agents Chemother 38:319-325. 66. Galia E, Nicolaides E, Horter D, Lobenberg R, Reppas C, Dressman JB. 1998. Evaluation of various dissolution media for predicting in vivo performance of class i and ii drugs. Pharm Res 15:698-705. 67. Russell TL, Berardi RR, Barnett JL, O'Sullivan TL, Wagner JG, Dressman JB. 1994. Ph-related changes in the absorption of dipyridamole in the elderly. Pharm Res 11:136-143. 68. Zhou R, Moench P, Heran C, Lu X, Mathias N, Faria TN, Wall DA, Hussain MA, Smith RL, Sun D. 2005. Ph-dependent dissolution in vitro and absorption in vivo of weakly basic drugs: Development of a canine model. Pharm Res 22:188-192. 69. Schwartz PA, Rhodes CT, Cooper JW, Jr. 1977. Solubility and ionization characteristics of phenytoin. J Pharm Sci 66:994-997. 70. McNamara DP, Amidon GL. 1988. Reaction plane approach for estimating the effects of buffers on the dissolution rate of acidic drugs. J Pharm Sci 77:511-517. 71. Airaksinen S, Luukkonen P, Jorgensen A, Karjalainen M, Rantanen J, Yliruusi J. 2003. Effects of excipients on hydrate formation in wet masses containing theophylline. J Pharm Sci 92:516-528.

25
72. Santos H, Veiga F, Pina ME, Sousa JJ. 2004. Compaction, compression and drug release characteristics of xanthan gum pellets of different compositions. Eur J Pharm Sci 21:271-281. 73. Crowley MM, Schroeder B, Fredersdorf A, Obara S, Talarico M, Kucera S, McGinity JW. 2004. Physicochemical properties and mechanism of drug release from ethyl cellulose matrix tablets prepared by direct compression and hot-melt extrusion. INT J PHARM 269:509-522. 74. Jinno J, Kamada N, Miyake M, Yamada K, Mukai T, Odomi M, Toguchi H, Liversidge GG, Higaki K, Kimura T. 2006. Effect of particle size reduction on dissolution and oral absorption of a poorly water-soluble drug, cilostazol, in beagle dogs. J Control Release 111:56-64. 75. Bisrat M, Nystrom C. 1988. Physicochemical aspects of drug release.8. The relation between particle-size and surface specific dissolution rate in agitated suspensions. Int J Pharm 47:223-231. 76. deAlmeida LP, Simoes S, Brito P, Portugal A, Figueiredo M. 1997. Modeling dissolution of sparingly soluble multisized powders. J Pharm Sci 86:726-732. 77. Dokoumetzidis A, Macheras P. 2006. A century of dissolution research: From noyes and whitney to the biopharmaceutics classification system. INT J PHARM 321:1-11. 78. Graffner C. 2006. Regulatory aspects of drug dissolution from a european perspective. Eur J Pharm Sci 29:288-293. 79. Azarmi S, Roa W, Lobenberg R. 2007. Current perspectives in dissolution testing of conventional and novel dosage forms. INT J PHARM 328:12-21. 80. Dressman J. 2004. Future directions for academic research in dissolution testing. Dissolution Technology 11:8-9. 81. Pal A, Indireshkumar K, Schwizer W, Abrahamsson B, Fried M, Brasseur JG. 2004. Gastric flow and mixing studied using computer simulation. Proc Biol Sci 271:2587-2594. 82. Kwiatek MA, Steingoetter A, Pal A, Menne D, Brasseur JG, Hebbard GS, Boesiger P, Thumshirn M, Fried M, Schwizer W. 2006. Quantification of distal antral contractile motility in healthy human stomach with magnetic resonance imaging. J Magn Reson Imaging 24:1101-1109. 83. Pal A, Brasseur JG, Abrahamsson B. 2007. A stomach road or "magenstrasse" for gastric emptying. J Biomech 40:1202-1210. 84. Healy AM, McCarthy LG, Gallagher KM, Corrigan OI. 2002. Sensitivity of dissolution rate to location in the paddle dissolution apparatus. J Pharm Pharmacol 54:441-444. 85. Kukura J, Arratia PE, Szalai ES, Muzzio FJ. 2003. Engineering tools for understanding the hydrodynamics of dissolution tests. Drug Dev Ind Pharm 29:231-239. 86. McCarthy LG, Bradley G, Sexton JC, Corrigan OI, Healy AM. 2004. Computational fluid dynamics modeling of the paddle dissolution apparatus: Agitation rate, mixing patterns, and fluid velocities. AAPS Pharm Sci Tech 5:e31. 87. McCarthy LG, Kosiol C, Healy AM, Bradley G, Sexton JC, Corrigan OI. 2003. Simulating the hydrodynamic conditions in the united states pharmacopeia paddle dissolution apparatus. AAPS Pharm Sci Tech 4:E22.
26
88. Dressman JB, Amidon GL, Fleisher D. 1985. Absorption potential: Estimating the fraction absorbed for orally administered compounds. J Pharm Sci 74:588-589. 89. Vertzoni M, Fotaki N, Kostewicz E, Stippler E, Leuner C, Nicolaides E, Dressman J, Reppas C. 2004. Dissolution media simulating the intralumenal composition of the small intestine: Physiological issues and practical aspects. J Pharm Pharmacol 56:453-462. 90. McNamara DP, Whitney KM, Goss SL. 2003. Use of a physiologic bicarbonate buffer system for dissolution characterization of ionizable drugs. Pharm Res 20:1641-1646. 91. Mooney KG, Mintun MA, Himmelstein KJ, Stella VJ. 1981. Dissolution kinetics of carboxylic acids i: Effect of ph under unbuffered conditions. J Pharm Sci 70:13-22. 92. Mooney KG, Mintun MA, Himmelstein KJ, Stella VJ. 1981. Dissolution kinetics of carboxylic acids ii: Effect of buffers. J Pharm Sci 70:22-32.

CHAPTER II
PARTICLE DIFFUSIONAL LAYER THICKNESS IN A USP DISSOLUTIONAPPARATUS II: A COMBINED FUNCTION OF PARTICLE SIZE AND
PADDLE SPEED
Abstract
This work was to investigate the effects of particle size and paddle speed on the
particle diffuisonal layer thickness happ in a USP dissolution apparatus II. After the
determination of the powder dissolution rates of five size fractions of fenofibrate,
including < 20, 20-32, 32-45, 63-75 and 90-106 m, the present work shows that the
dependence of happ on particle size follows different functions in accordance with the
paddle speed. At 50 rpm, the function of happ is best described by a linear plot of
9.91 23.31apph d ( ) throughout the particle size range of 6.8-106 m. In
contrast, at 100 rpm a transitional particle radius of 23.7 m exists, under which linear
relationship ( ) occurs, but above which h
2 0.98R
1.59apph r 2 0.98R app becomes a constant of
43.5 m. Thus, happ changes not only with particle size, but also with the hydrodynamics
under standard USP configurations, which has been overlooked in the past. Further, the
effect of particle size and paddle speed on happ was combined using dimensionless
analysis. Within certain fluid velocity/particle regime, linear correlation of apphd
with the
27

square-root of Reynolds number 1/ 2( )d , i.e., 4 11.5207 9.25 10 ( )apph dd
/ 2
( ), was observed.2 0.9875R
Introduction
The Biopharmaceutics Classification System (BCS) categorizes drugs into four
classes according to their solubility and permeability.1 The BCS II class of compounds
exhibits high permeability and low solubility relative to the administered dose. For a
BCS II drug formulated into an immediate release (IR) dosage form, the combination of
high drug permeability and adequate GI transit time will lead to a rate and extent of oral
absorption that is controlled by the in vivo process of drug dissolution.1,2
Mechanistically, one of the fundamental issues in modeling and understanding
dissolution is to determine the relationship between the diffusional layer thickness (happ)
and particle size under a defined set of hydrodynamic conditions. In the past, the Noyes-
Whitney equation ( )s tdM D A C Cdt h
has been widely used to describe drug particle
dissolution,3 where h is a thin static liquid layer at the solid surface under steady state
conditions. For the past half century, the Noyes-Whitney equation has served as the
theoretical basis for many classical dissolution models that assumed various relationships
between the drug particle size and happ. For example, happ was assumed to be a constant
by Hixson and Crowell,4 while Higuchi and Hiestand5-7 proposed that it was
approximately equal to the radius of the particle, and Niebergall et al.8 determined it to be
equal to the square root of the particle radius. All of these assumptions imply that the
correlation between happ and particle size is applicable to all particle size ranges. In
28
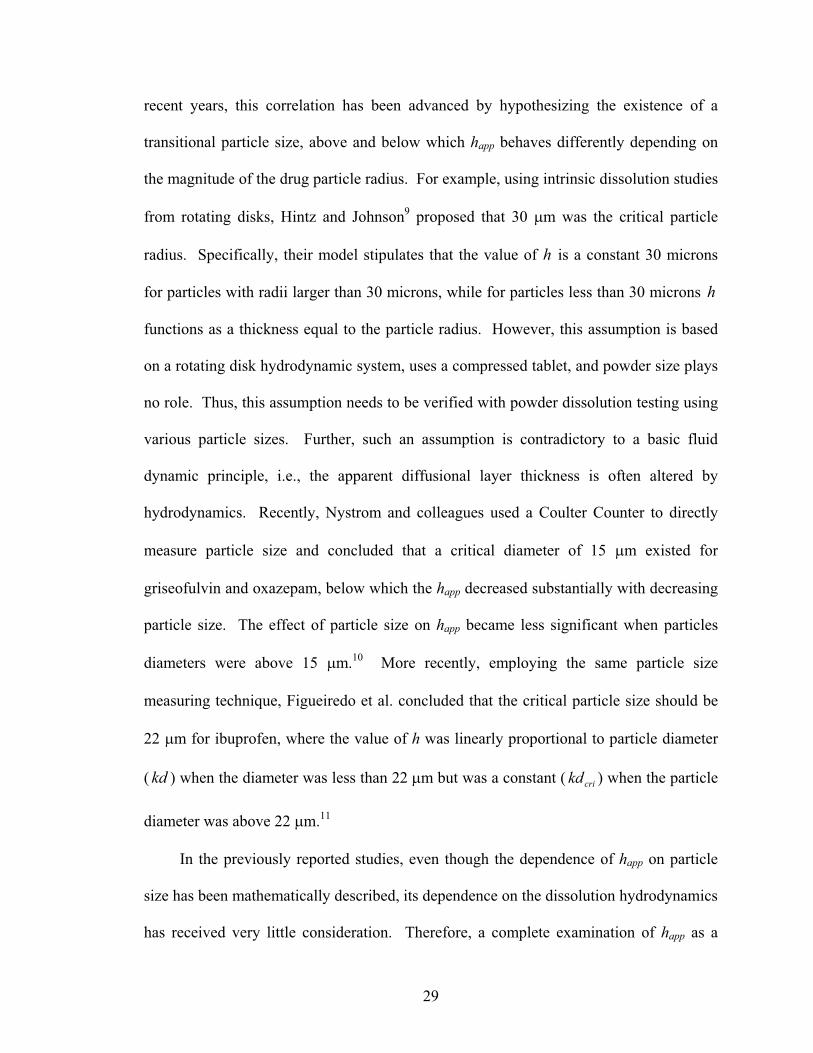
recent years, this correlation has been advanced by hypothesizing the existence of a
transitional particle size, above and below which happ behaves differently depending on
the magnitude of the drug particle radius. For example, using intrinsic dissolution studies
from rotating disks, Hintz and Johnson9 proposed that 30 m was the critical particle
radius. Specifically, their model stipulates that the value of h is a constant 30 microns
for particles with radii larger than 30 microns, while for particles less than 30 microns h
functions as a thickness equal to the particle radius. However, this assumption is based
on a rotating disk hydrodynamic system, uses a compressed tablet, and powder size plays
no role. Thus, this assumption needs to be verified with powder dissolution testing using
various particle sizes. Further, such an assumption is contradictory to a basic fluid
dynamic principle, i.e., the apparent diffusional layer thickness is often altered by
hydrodynamics. Recently, Nystrom and colleagues used a Coulter Counter to directly
measure particle size and concluded that a critical diameter of 15 m existed for
griseofulvin and oxazepam, below which the happ decreased substantially with decreasing
particle size. The effect of particle size on happ became less significant when particles
diameters were above 15 m.10 More recently, employing the same particle size
measuring technique, Figueiredo et al. concluded that the critical particle size should be
22 m for ibuprofen, where the value of h was linearly proportional to particle diameter
( ) when the diameter was less than 22 m but was a constant ( ) when the particle
diameter was above 22 m.
kd crikd
11
In the previously reported studies, even though the dependence of happ on particle
size has been mathematically described, its dependence on the dissolution hydrodynamics
has received very little consideration. Therefore, a complete examination of happ as a
29

function of particle size and pharmaceutically relevant hydrodynamics is theoretically
and practically significant. In this paper, we employed Equation 1 to do so.
01/ 2( )apph dva b
d (1)
where is the drug particle diameter, is the linear velocity of fluid in cm/s,d 0v is the
kinematic viscosity (cm2/sec) of the fluid, a and are parameters that can be estimated
through experimental data. Mathematically, Eq 1 is similar to Equation 2,
b
3/12/10
)()(6.00.2D
dDkd
(2)
where is mass transfer rate cm/s, and D is the diffusion coefficient of the drug
molecule cm
k
2/s. As early as 1952, Eq 2 was theoretically derived and experimentally
validated by Ranz & Marshall to describe the rate of evaporation of pure liquid drops and
water drops containing dissolved and suspended solids, such as in spray-drying
operations.12,13 In a subsequent article published in the same year, Ranz extrapolated his
theory to mass transfer of single particles and packed beads.14 In 1954, F.H. Garner and
his colleagues applied this theory to dissolution from a fixed solid sphere in fluid flow.15
Specifically, they found that the dissolution of benzoic acid in a stream of water was
correlated with another equation of similar functional form to the Ranz-Marshall equation
(Eq 2), 3/12/10
)()(48.044D
dDkd . In 1960, Bird elaborated the Ranz-Marshall
equation to describe simultaneous heat and mass transfer of a liquid or solid sphere under
forced convection.16 In 1962, Harriott applied Eq 2 for depicting mass transfer of
benzoic acid, boric acid, zinc and lead sulfate particles suspended in agitated and baffled
tanks.17 More recently, Fogler et al. employed Eq 2 to study the dissolution of poly-
30

dispersed particles.18 Drug powders dissolved in a USP dissolution apparatus II would
encounter a similar hydrodynamic environment to that investigated in Harriott and
Fogler’s studies: that is, mass transfer from solid spheres under forced convection.
In this paper, fenofibrate was selected to serve as a model BCS II drug. Selection
of USP II conditions is pharmaceutically relevant and of particular importance from a
regulatory perspective. Moreover, five size fractions were utilized in the current study to
further characterize and understand the impact of particle size on happ. The focus of this
work is to: 1) determine the diffusion layer thickness happ for a BCS II model drug,
fenofibrate, in a USP dissolution apparatus II; and 2) illustrate the dependence of happ on
particle size and hydrodynamics using function form0
1/ 2( )apph dva bd
.
Theoretical Section
Calculation of Diffusional Layer Thickness happ
The diffusion layer thickness happ of drug particles in a USP dissolution apparatus II
can be calculated based on their dissolution rates. At dissolution time zero, the initial
weight of a single drug particle is 30
43 v0,M r . At any time t afterwards, the particle
weight is 3,
43t t vM r , where and are the volume particle radius at time zero and
t, respectively.
0,vr ,t vr
0M and tM can be brought together by the mass balance of the drug
particle, namely,
0( )t
tC VM MN
(3)
where is the total number of particles, is the drug concentration at time t, and V is
the dissolution volume. In addition, the Noyes-Whitney equation was originally derived
N tC
31

in the slab coordinate. When it is applied to a spherical particle using spherical
coordinate, it can be rewritten as 19,20:
1 1( )(S tapp
dM DA C Cdt r h
) (4)
Eq 4 can be simplified to the following:
( ) 1 1(t S t
t app
dr D C Cdt r h
) (5)
where is the density of drug particles, is the drug solubility in the dissolution
medium, and h
SC
app is the apparent diffusion layer thickness. Thus, with known parameters
including , ,SC tC , , and , the relationship between and can be
established, the derivative of which is connected to through Eq 5.
V D N tr t
apph
For a system that is approximately spherical, Eq 4 is still valid. However, in the
case of non-spherical shape, the particle mass M should be related to the particle volume
radius , and the particle surface area vr A should be related to the particle surface radius
sr . The volume radius can be measured directly by Coulter Counter method. The
surface particle radius is calculated using equation , where the surface area
vr
24 srA A is
determined by BET methodology. Therefore, Eq 4 can now be written as follows:
2, , 2
,,
4 1 14 ( )(t v t vt s S t
t s app
r drD r C C
dt r h) (6)
Further, if the ratio of v
s
rr
is assumed to be constant, then equation (6) can be simplified
in the following:
32

,
,
1 1[( ) ] ( )( )t v s sS t
v app t v v
dr r rD C Cdt r h r r
(7)
The ratio between the surface radius and volume radius, i.e. s
v
rr
, is defined as the shape
factor. This ratio is a fundamental property related to the particle dissolution rate in
addition to drug solubility and diffusivity that are the essential factors dictating the
diffusion and convection within the solid-liquid interface. The dissolution of an
individual particle presumably proceeds in an isometric manner at the initial stage of the
dissolution test. Therefore, the shape factor could be assumed as a constant in calculating
the values. Eqs 3 and 7 are employed in calculating .apph apph
Dependence of happ on Particle Size and Fluid Velocity
The diffusion layer thickness for drug particles in a particular geometry is a
function of drug properties including particle diameter d and diffusivity , and fluid
properties of fluid velocity
apph
D
0 and kinematic viscosity .21
0( , ; , )apph f d D (8)
Therefore we have variables for of drug particle dissolution in a USP vessel.
These variables are built up from
5n apph
5n 2k independent dimensions that are: length L
(cm) and time T (s). According to the -theorem, the variables 5n can be reduced to 3
independent dimensionless numbers, which are defined as apphd
, Reynolds number
0
Re d and Schmidt number ChSD
. Then, Eq 8 can be expressed as:
33
(Re, )appCh
hf S
d (9)
Most of previous work, both theoretical and practical,12-15,17,18,22 suggested the form of:
1/ 2 1/3a b (Re) ( )appCh
hS
d (10)
In the current case, the kinematic viscosity of dissolution medium and drug diffusivity
of fenofibrate are constant, thus equation 1 arrives.D
01/ 2 1/ 2a+b (Re) ( )apph dva b
d (1)
where and are constants and can be determined using regression analysis of the
experimental data such as and .
a b
apph d
Experimental Section
Materials and Preparation
Fenofibrate (> 99% purity), sodium lauryl sulfate and all other chemicals were of
analytical grade and were purchased from Sigma Chemical Company (St. Louis, MO).
Distilled, deionized and filtered water was prepared in house and used for all
experiments. Fenofibrate “as received” from Sigma had a broad size distribution, with
which four size fractions, i.e., 20-32, 32-45, 63-75 and 90-106 m were obtained by
sieving. In brief, the bulk material was initially dry sieved through the USA standard test
sieves (Newark Wire Cloth Company, Clifton, NJ). Then, 300 mg of the dry sieved
fractions were well suspended into 60 mL of 0.9% NaCl solution containing 0.05% SLS,
34

and the suspensions were wet sieved through the same standard sieves. The wet sieved
fractions on the sieve were rinsed with 0.9% NaCl solution containing 0.05% SLS and
subsequently with water, and then they were dried overnight in a vacuum oven at 30 C.
The < 20 m size fraction was achieved by jet-milling the bulk material as received from
Sigma. About 100 g of fenofibrate bulk material was jet-milled through a lab scale size
fluid energy grinder (Sturtevant Inc., Hanover, MA) that was operated using compressed
nitrogen, with an approximate yield of 95%. The milling air setting was 60 – 70 PSIG,
and the feed air pressure was operated between 90 – 100 PSIG. The crystal form of the
jet-milled fenofibrate was also characterized using powder X-ray diffraction (PXRD) and
differential scanning calorimetry (DSC) to confirm the absence of amorphous material
and process induced changes in crystal form. All the five fractions of particles were fully
characterized with regards to their specific surface area, particle volume diameter,
number diameter, and density. The USP pH 6.8 50 mM phosphate buffer without
pancreatin was prepared following standard procedures.23 Piecewise regression analysis
and parameter estimations were performed using Sigmaplot 10.0 (SPSS Inc., Chicago,
IL).
Powder X-ray Diffraction (PXRD)
Powder diffraction patterns of jet-milled and “as received” fenofibrate were
recorded with a Scintag X-ray diffractometer (Franklin, MA) using CuK radiation ( =
1.54 Å), tube voltage of 40 kV, and tube current of 20 mA. The intensities were
measured at 2-theta values from 5° to 40° at a continuous scan rate of 5° /min.
Differential Scanning Calorimetry (DSC)
35

The thermal behavior of jet-milled and “as received” fenofibrate were studied using
a TA Instruments 2920 modulated DSC (TA Instruments, New Castle, DE) with
refrigerated cooling system (RCS) in standard mode. Approximately 5-10 mg samples
were weighed into aluminum DSC pans, crimped, equilibrated to -80°C and then heated
up to 100°C at speed of 5.0°C/min, with nitrogen purge at 110 mL/min.
Particle Size Determination
The mean volume particle size diameters for all size fractions were determined
using the Coulter Counter (non-laser light scattering) method. The jet-milled material
was first suspended in the 0.9% NaCl solution containing 0.25% SLS, saturated with
fenofibrate. Then the suspension was quickly transferred into the 0.9% NaCl solution
containing 0.1% SLS and saturated with fenofibrate, which served as the suspending
medium and testing electrolyte for all samples during particle size measurement. It
should be emphasized that the diameter given by the Coulter is a volume equivalent
diameter, namely, , where v is the particle volume directly measured by
the Coulter.
3/1)/6( vdv
Specific Surface Area Measurement
The specific surface area of fenofibrate powders was determined at liquid nitrogen
temperature using BET methodology employing nitrogen as the adsorbate. The surface
area was used to calculate the particle surface radius by equation 24 sA r .24
Solubility Measurement
The aqueous solubility of fenofibrate was measured at 37ºC in 0.25% SLS pH 6.8
phosphate buffer, instead of water. Since SLS has a CMC of 0.25% (w/v) in water, it
serves as a reasonable surrogate of the in vivo surfactant properties provided by bile salts
36

and provides the necessary enhancement in solubility and dissolution rate for fenofibrate
that is practically insoluble in water with a solubility of < 0.3 g/mL. Fenofibrate
solubility was determined by suspending excess fenofibrate powder in 5 mL buffer in a
screw-capped vial. The suspension was equilibrated by shaking in an orbital shaker
water bath (LABLINE Instruments, Inc., Melrose Park, IL). At suitable time intervals,
1.0 mL of aliquots were drawn and filtered through 0.45- m membrane, and then diluted
with an appropriate amount of phosphate buffer prior to the spectrophotometric assay at
= 292 nm using a UV spectrophotometer (Beckman Coulter DU 650, Fullerton, CA).
The equilibrium solubility of fenofibrate was established when the difference between
three consecutive measurements is within 1%, a process that may take up to 7 days.
Dissolution Profiles in USP Dissolution Apparatus II
The dissolution profiles of various size fractions of fenofibrate were measured in a
USP dissolution apparatus II at 37 C using pH 6.8 phosphate buffer containing 0.25%
SLS. For the jet-milled fenobibrate, 50 mg powder was weighted into a 1.0 mL of
eppendorf tube, then 0.5 mL of the dissolution medium were added, and then the
suspension was sonicated at low power for 5 seconds. The well dispersed jet-milled
suspension was then immediately transferred into the prepared dissolution vessel, and
rinsed with the dissolution medium three times 5 mL each. The four bigger size fractions
of fenofibrate powders (50 mg) were directly dropped into the 37ºC 500 mL dissolution
medium that was previously degassed. For the Dissolution experiments were conducted
in triplicate at both 50 rpm and 100 rpm for each particle size. Aliquots were drawn at
0.33 – 1 min intervals, filtered through 0.45- m membrane and diluted if necessary prior
to UV spectroscopic analysis at = 292 nm (BeckmanCoulter DU 650, Fullerton, CA).
37

Results
Characterization of Fenofibrate Particles
As evident from the DSC traces of the jet-milled and “as received” fenofibrate
(Figures 2.1a and 2.1b), a negligible glass transition occurs around -45 C with a very
small enthalpy of -0.0015 w/g, followed by the melting point around 79.5 C with an
enthalpy of fusion of approximate 95 J/g. This DSC result indicates that no significant
changes in crystal forms or amorphous content were introduced through the jet-milling
process. These results are further confirmed by PXRD (Figure 2.2) where the slightly
decreased peak intensities are consistent with a reduction in particle size.
The volume particle size distribution of each size fraction is shown in Figure 2.3,
and the surface area equivalent particle radius, shape factor and density for each size
fraction are summarized in Table 2.1. Visual observation via SEM shows the irregular
and multi-sided morphology of fenofibrate particles (Figure 2.4), suggesting that
fenofibrate particles would dissolve in a relatively isometric manner.
The diffusivity of fenofibrate was calculated as 7.4 10-6 cm2/s using the ADMET
PredictorTM 1.2.1 (Simulation Plus Co., Lancaster, CA), which used the Hayduk-Laudie
formula589.04.1
51026.13V
Dwater
.25 This value is consistent with the literature reported
experimental value of 7.15 10-6 cm2/s using the rotating disk method.26
Dissolution Profiles of Fenofibrate
The solubility of fenofibrate was determined to be 150.4 ± 1.4 g/mL in 0.25% SLS
50 mM pH 6.8 phosphate buffer. The dissolution profiles of fenofibrate particles at 50
rpm and 100 rpm are shown in Figure 2.5. Several elements can be drawn from these
38

dissolution profiles. First, as expected, the dissolution rates increase with decreasing
particle sizes in the following order: jet-milled material (< 20 micron) > 20-32 > 32-45 >
63-75 > 90-106 m size fractions. This observation is consistent with the larger surface
area per unit weight of the smaller particles. Secondly, the dissolution rates of the jet-
milled material are similar at the 50 rpm and 100 rpm. Finally, the four larger size
fractions of fenofibrate dissolve faster at a paddle speed of 100 rpm than at 50 rpm,
presumably due to the higher fluid velocities at 100 rpm that lead to thinning of and
subsequently more efficient mass transfer.
apph
Dependence of Diffusional Layer Thickness on Hydrodynamics and Particle Sizes
The dependence of on particle size and hydrodynamics/fluid velocity were
examined and illustrated in the two following ways. The first approach is bifunctional
analysis demonstrating as a function of r under different paddle speeds, as shown in
Figure 2.6. This approach determined the transitional particle size through which the
value of exhibits a different correlation with particle radius. Determination of
transitional particle size has been employed previously in the literature.
apph
apph
apph
9-11 The second
approach is dimensionless analysis using Eq 1, investigating the combined effects of
particle sizes and paddle speeds on .apph
Bifunctional analysis: The transitional particle size for fenofibrate in a USP
dissolution apparatus II is fluid velocity dependant. Using piecewise regression, the
transitional particle sizes are 37.7 ± 5.4 m ( ) and 23.7 ± 0.6 m
( ), under 50 and 100 rpm, respectively (Figure 2.6). For drug particles
smaller than the transitional sizes, the displays a linear relationship with the drug
2 0.9972R
2 0.9998R
apph
39

particle radius. The linear slopes vary with paddle speeds, and the values are 1.71 (R2 =
0.9872) and 1.59 (R2 = 0.9828), at 50 rpm and 100 rpm, respectively. In comparison, for
drug particles larger than the transitional sizes, at 100 rpm a constant was observed
with an approximate value of 43.5 m for any particles with radius larger than 23.7 m;
and at 50 rpm the value continues to increase with particle size but at a slower rate.
The bifunctional analysis also leads to the plot of versus
apph
apph
apph d , as shown in Figure 2.7.
Evidently, at 50 rpm demonstrates a linear correlation with apph d , i.e.,
9.91 23.31apph d , , throughout the tested particle size range 6.8-106 m
in this work. Whether this linear relationship applies to particles in near-micron or sub-
micron range needs further research, partially due to the complex microfluid dynamics
surrounding these very small particles. In comparison, at 100 rpm the linear relationship
transforms into plateau for larger particles. This dependence of on
2 0.9769R
apph d was then
further exploited in dimensional analysis.
Dimensionless analysis: According to Eq 1 0
1/ 2( )apph dva bd
, the Re number
0
(dv ) was calculated using drug particle diameter d (cm), linear fluid velocity
(cm/sec), and kinematic viscosity 0v of dissolution medium ( ) at
37ºC.
2 20.758 10 /cm s
27 The linear velocity of fluid/dissolution medium in an agitated USP vessel
depends on the rotational speeds of paddle and the location in the vessel. In addition, the
use of the linear velocity of the fluid is not convenient in practice, and the rotational
speed of the paddle is readily available and can be easily adjusted to the linear
40

velocity through paddle diameter d , i.e., 0 dv . It therefore lends to the
calculation of the Reynolds number using , i.e., dd . The relationship between
apphd
and d is proposed in equation 11:
1/ 2 1/ 2constant( ) ( )apph d da d a bd
(11)
where eR is calculated based on the following: is the particle diameter in m,d is the
rotational speed of paddle in rpm, is the kinematic viscosity of dissolution medium in
cm2/sec, and the diameter of the USP paddle ( d ) is included in the parameter (Eq 11).
Figure 2.8 demonstrates that the of suspended drug particles in the USP vessel can
be successfully described with the semi-theoretical equation (Eq 11). Here,
b
apph
apphd
exhibits
a two-regional dependence on particle Re, i.e., 1/ 2( )d . One region is linear, where the
particle Re is 592, and is described by 41.5207 9.25 10 ( )apph dd
1/ 2 . Assuming
the drug diffusivity is ,scm /1015.7 26 26 this regression corresponds to an
( ), and estimates the values of a = 1.5207 ± 0.0417 and b = -9.25 10
2 0.9875R
0.0001P -4 ±
4.66 10-5. The other region describes the relation for particles with smaller Re number
(either smaller particle size and/or slower paddle speeds), the relationship between apphd
and may be more complex.Re
Discussion
41
Calculation of Diffusion Layer Thickness happ
Due to its mathematical simplicity, a spherical shape is the best contour to select to
experimentally determine the value of happ, an approach that was elaborated by Wang and
Flanagan.19,20 Numerous attempts to prepare spherical and crystalline fenofibrate
particles for this study were unsuccessful because fenofibrate either forms amorphous
spheres or crystalline needles following recrystallization processes as confirmed by
polarized microscopy. Therefore, irregular shapes of fenofibrate particles were employed
here with consideration given to their shape factor; that is, the ratio of particle surface
radius to volume radius. Here, it is assumed that drug particles would dissolve in an
approximately isotropic manner, implying that the shape factor would remain unchanged.
This assumption has been used widely in the past, when the shape factors were
considered constant, as in the initial stages of the dissolution testing. Even in the case of
dissolving crystals with a high degree of non-isometricity sharp edges such as needles
and plates, the shape factor has been reported to change insignificantly until considerable
dissolution occurs.28,29 In addition to the shape factor, the quantity of amorphous content,
may also contribute to non-isometric dissolution. PXRD and DSC results confirmed the
absence of detectable amorphous form for the jet-milled material.
The thickness of a hydrodynamic boundary layer is often defined as the distance
from the surface of the solid to the point where the tangential velocity attains a value of
90% of the main stream.21 In general, this layer thickness is not easily evaluated from
experimental work except under well-defined hydrodynamic conditions as in the case of
the rotating-disk.21 In this work, the is calculated using Eq 7 to describe the distance
over which the diffusion process dominates the mass transfer. As such, it reveals the
apph
42
drug dissolution in terms of how resistance to mass transfer may occur in the solid-liquid
interface in a simple model. In addition, the diffusional thickness can often be used to
predict changes in mass transfer caused by factors such as chemical reactions.30,31 It is
important to note that the determined in a USP dissolution apparatus is an apparent
averaged value from all particles under specific hydrodynamic conditions, because the
local environment of fluid dynamics surrounding each individual drug particle is not the
same throughout the USP dissolution apparatus II vessel.
apph
32-36
Dependence of happ on Hydrodynamics and Particle Sizes
Bifunctional analysis with transitional particle sizes
Dissolution phenomena have been studied in a quantitative manner for more than a
century, during which various relationships between happ and particle size have been
proposed.5,8-11 Bifunctional analysis of fenofibrate dissolution data suggests that
Higuchi-Hiestand’s assumption5,6 and Hintz-Johnson’s hypothesis9 appear to be valid,
only if the powder dissolution occurs under specific hydrodynamic conditions.
Higuchi-Hiestand assumed that happ was equal to or greater than the particle radius,
and conducted their experiments with 2.2 mg of micronized methylprednisolone ( 25
m) in 100 mL of water in bottles that were rotated at 6 rpm at 25°C.5-7 In comparison
with their work (Table 2.2), the current study experimentally demonstrates that in a USP
dissolution apparatus II happ may be equal to or greater than particle radius r , only if the
specific hydrodynamic conditions are provided. The first observation is based on the data
that at paddle speed of 100 rpm, the particle radius r 44.6 ± 0.4 m is not significantly
different from the corresponding happ value of 43.5 ± 11.2 m. The second point was
observed at both paddle speeds. For example, at 50 rpm happ is equal to 1. , and the 71r
43
value of happ decreases to 1.59 at a higher paddle speed of 100 rpm, both suggesting that
h
r
app could be greater than particle radius.
The description of happ as a function of particle size under both paddle speeds was
compared with Hintz’s work as well, as shown in Table 2.2. Both sets of data
consistently demonstrate the existence of a transitional particle size Cr in the 30 m size
range, and a linear relationship between happ and r when particle size is below .
When particle size is above C
rC
r, a constant happ value, however, was observed at 100 rpm.
Further, despite the similar observations, it is evident that distinct differences exist
between the Hintz-Johnson’s assumption and our work in the following specific aspects:
1) the value of Cr; 2) the linear slope value between the happ and r ; and 3) the value of
constant happ. This difference is attributed to the differences in hydrodynamic conditions
under which the dissolution studies are conducted. In Hinz-Johnson work, the apph r
assumption was suggested based on a rotating disk system, where a planar constant
surface area pertains rather than a powder dissolution of spherical geometry where more
complex hydrodynamics pertains. For example, based on Levich’s equation
1/3 1/ 21.61( ) ( )Dh 21, a diffusivity of fenofibrate as 7.15 10-6 cm2/s and kinematic
viscosity of the dissolution medium as 7.58 10-3 cm2/s at 37 C, for fenofibrate, a
rotational speed of 21 rpm would give a h equals to 30 m. Clearly, the dissolution
hydrodynamics in these two systems are very different.
Dimensionless analysis
The key dissolution variables employed in Eq 1, particle size and Reynolds number
that is an indicator of the fluid dynamics, were compared to the previous utilization of the
44

Ranz-Marshall equation (Eq 2) as shown in Table 2.3, and the similarities and differences
are discussed as follows. In Ranz’s original work on mass transfer of single particles and
packed beds,14 the theory was applied to particle sizes in the range of 0.06 cm to 1.1 cm
and number ranging from 2 to as high as 10eR 5. In later studies, the particle size varied
from 15 to 1270 m, and the number ranged from 1 to 10eR 5 (Table 2.3). Comparably,
the number under standard USP dissolution conditions such as 50 and 100 rpm is
within the range tested in the original Ranz theory
eR
eR 12-14 and other work.15,17,18,22,37 The
number in a USP dissolution apparatus II encompass a considerable range from a
value of zero at the vessel wall to the highest value at the paddle tip. Using equation
eR
2
edR , the maximum numbers can be determined as 2.9×10eR 4 and 5.8×10⁴ at 50
rpm and 100 rpm, respectively,33 where is the rotational speed of the paddle, is the
diameter of the paddle, and
d
is the kinematic viscosity of the fluid. Although the mean
particle size in this work, 32 - 106 m, is generally smaller than that utilized by Ranz’s
and others, our results have shown that the theoretical diffusion layer thickness
01/ 2( )apph dva b
dcould be extrapolated with remarkable accuracy to the particle size
range beyond the Ranz’s.
Industrial Significance of apph
Dependence of on paddle speeds and particle sizeapph
Dimensionless analysis demonstrated a bipartite behavior of the dependence of
on paddle speeds and particle size, which may be contributed by several factors. First,
apph
45

crystal defects and roughness on the particle surface represent a larger percentage of the
crystal weight after milling, since the surface area to volume ratio is increased. These
effects were observed to have a significant impact on dissolution rate for particles with
diameters in the micron range. Second, at small particle sizes, turbulence in the form of
microeddies begins to play a more important role in the hydrodynamics near to the
dissolving surface, in other words a microenvironment different from the bulk
hydrodynamics is created.38-40 It is also thought that the effective eddy diffusivity of drug
molecule in the turbulent fluid may be very different from that in bulk fluid.41 Surface
roughness, crystal defects and microeddies would lead to a faster dissolution rate than
expected using surface area and the bulk fluid velocity. This region of small Re number
merits further research.
Eq 11, 1/ 2( )apph da bd
, was also applied to in vitro dissolution behavior of
other drugs including digoxin and oxazepam independently reported by Nyström et
al.10,42 In their studies, dissolution rates were measured with two different particle sizes
under three rotational speeds, i.e. 350, 500 and 800 rpm. Dissolution rate data for
digoxin fit the following the relationship:
1/ 222.17 0.012( )apph dd
with the 0.9403sqR ( 0.0052)P
For oxazepam, conforms to the following equation:apph
1/ 23.05 0.016( )apph dd
with the 0.9472sqR ( 0.0063P ) .
The successful fitting of digoxin and oxazepam dissolution data into the function form of
Eq 11 further supports the linear correlation between apphd
and 1/ 2( )d and its use to
46

estimate values for drug particles in the standard USP dissolution II apparatus, based
on the measured particle size and the rotational paddle speed
apph
d .
apph for poorly soluble drugs
Recent estimates suggest that the percentage of BCS II drugs in the top US 200 oral
IR products is greater than 25%.43 Probably as a result of the widespread application of
combinatorial chemistry and high-throughout screening activities during the drug
discovery process,44,45 this percentage will probably continue increase. To ensure
satisfactory oral absorption, particle size reduction has been widely used to increase the
surface to volume ratio and thus improve the dissolution rate of poorly soluble drugs.
The current work clearly reveals that the values generally decrease with decreasing
particle size (Figure 2.6). Therefore, an increase in the dissolution rate resulting from a
particle size reduction process is attributed not only to an increase in the surface area to
volume ratio, but also to a decrease in , an important contribution that is rarely
addressed in the literature.
apph
apph
In addition, since the layer thickness depends on the drug diffusivity D , the
corresponding for two drug substances with different D values would be expected
to be different. However, it is likely that the would only change slightly because: 1)
according to the Levich theory
apph
apph
apph
21, is only dependent to the one-third power on D i.e.apph
2/13/1 )()(61.1 Dh and 2) drug diffusivity of most small drug molecules is low and in
the range of 10-6-10-5 cm2/s.
47

Furthermore, the results in this paper suggest the following: 1). for drug particles
with radius in the range of 3.4- 23.7 m, is approximately 1.5-fold of particle radius
(Figure 2.6). 2). under the paddle speed of 50 rpm, the diffusional exhibits a linear
relationship with the square root of particle diameter, across the studied particle size
range (Figure 2.7).
apph
apph
Finally, Figure 2.6 suggests that for small drug particles, is not significantly
different under 50 and 100 rpm. The exact size range for the small particles, where
is independent of paddle speeds in a USP dissolution apparatus II, is yet to be determined.
In this work, the jet-milled fenofibrate with a mean of 3.4 m, demonstrates that its
is independent of fluid velocity. In the case of cilostazol, the size limit could be in
the low micron range, i.e., 13 m. Cilostazol is a poorly soluble compound with a water
solubility of 6.25 g/mL at 37 C. Three size fractions with mean particle sizes of 13, 2.4
and 0.22 m were prepared using techniques hammer-mill, jet-mill and spray-drying,
respectively. In vitro powder dissolution profiles of 5 mg of these cilostazol samples, in
900 mL of water, FaSSIF and FeSSIF at 37 C in USP apparatus II, were equivalent at the
paddle speeds of 50 and 200 rpm
apph
apph
vr
apph
46. This result indicates that the is independent of
paddle speeds when the cilostazol particles are smaller than 13 m. Both results suggest
that the hydrodynamic considerations are important for large particles, and very small
particles in micron range are less influenced by hydrodynamics.
apph
Relevance to In Vivo Conditions
The unique result, namely, is independent of fluid velocity for the very small
particles, suggests that the highly variable GI fluid velocity varying with GI motility
apph
48

phases may not impact on the of low micron range particles in in vivo. The
micronized powder of felodipine, with a median particle size of 8 m, may be an
example of such a drug. Felodipine is a poorly soluble, neutral and lipophilic drug, and
its oral absorption that is indicated by AUC does not appear to be affected by the in vivo
hydrodynamics in dog studies.
apph
47,48 The independence of on GI motility, for small
particles such as jet-milled material, imply that the in vivo variability would be
significantly reduced within subjects and between subjects. Therefore, reducing particle
size not only improves the dissolution rate and absorption fraction for poorly soluble
drugs, but also potentially minimizes the in vivo variability.
apph
However, it should be emphasized here that establishing in vitro dissolution
methodology reflecting in vivo scenario requires considerations in many aspects. For
example, pH and surfactants are critical in selecting an appropriate dissolution medium.
Additionally important factors include the fluid velocity and device geometry, which
combine to determine the dissolution hydrodynamics. One disparity between dissolution
testing and the in vivo situation is that the paddle speed remains unchanged during a
given dissolution test. By contrast, the GI tract regularly transitions through migrating
motility cycles and fasted or fed states. Hence, the GI fluid velocity varies considerably
along various regions of small intestine,49-52 which can lead to large inter- and intra-
subject variations in in vivo . To mimic the wide range of in vivo , it may be
more appropriate to vary the in vitro hydrodynamic conditions during a test e.g. paddle
speed (Type II tester), dip rate (Type III) and flow rates (Type IV). It is unrealistic to
assume that use of a single USP dissolution setting such as 50 rpm can reflect the
complete hydrodynamics of a full GI motility cycle. However, a single paddle speed
apph apph
49

might be used to represent one certain GI motility-fluid flow and particle size
combination.
Revision of the test apparatus design to better reflect the geometry of the intestinal
tract and its flow patterns should be considered. One particularly important aspect to
consider is the representation of oscillating flow, corresponding to the segmental mixing
in the fed state, which is unique in its effects on in vivo . Applying dimensional
principle, the in vivo is a function of:
apph
apph (Re, , )appch
hf S St
d, where Re and are
defined as previously, and St is the Strouhal number describing oscillatory fluid. St
number is calculated as
chS
0
flStv
, where is vortex shedding, l is the characteristic
length (hydraulic diameter), and
f
0 is the linear velocity of GI fluid.
Potentially, a dimensionless analysis of the in vitro hydrodynamics and the in vivo
GI motility using the rule of (Re, , )appch
hf S St
dwould be useful in improving accuracy
of predicting in vivo dissolution and absorption of drug products, enhancing correlation
between in vitro dissolution and in vivo response and developing in vitro bioequivalence
methods.
Conclusions
The diffusional layer thickness was determined through fenofibrate powder
dissolution testing in a USP apparatus II with various particle sizes and paddle speeds.
The dependence of on drug particle size and dissolution hydrodynamics, reveals that
at 100rpm the is approximate 1.5-fold of the particle radius or a constant, which
apph
apph
apph
50
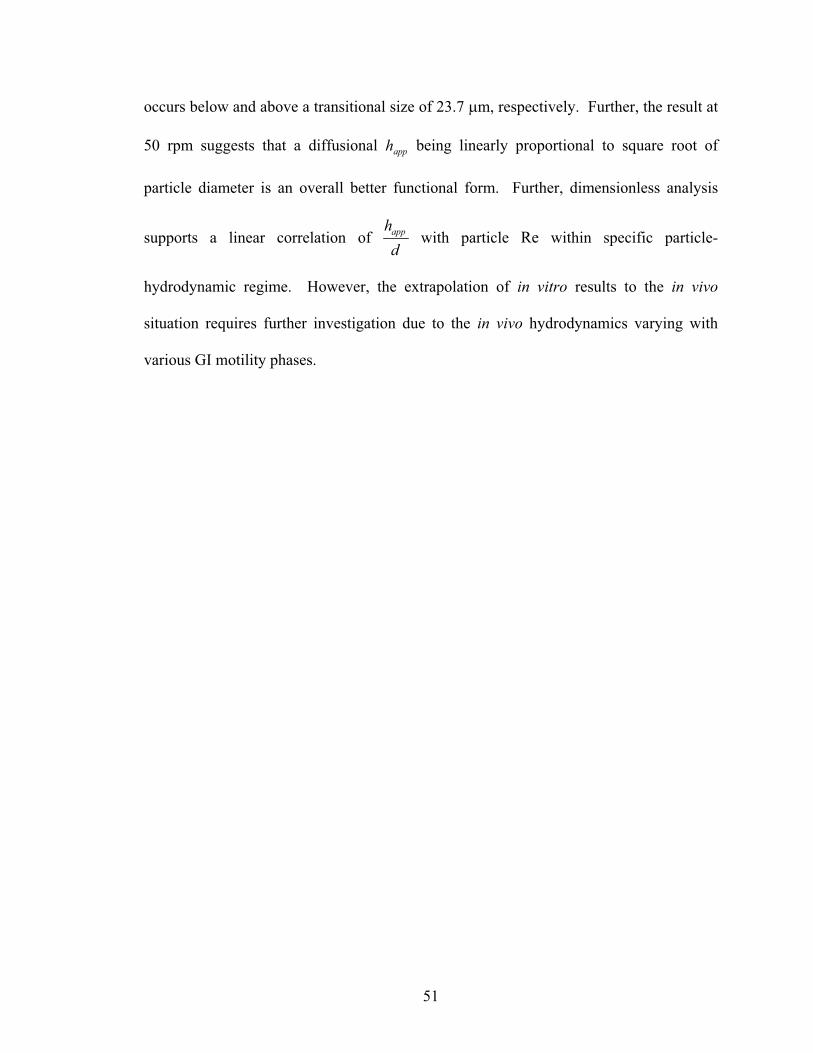
occurs below and above a transitional size of 23.7 m, respectively. Further, the result at
50 rpm suggests that a diffusional being linearly proportional to square root of
particle diameter is an overall better functional form. Further, dimensionless analysis
supports a linear correlation of
apph
apphd
with particle within specific particle-
hydrodynamic regime. However, the extrapolation of in vitro results to the in vivo
situation requires further investigation due to the in vivo hydrodynamics varying with
various GI motility phases.
Re
51

52
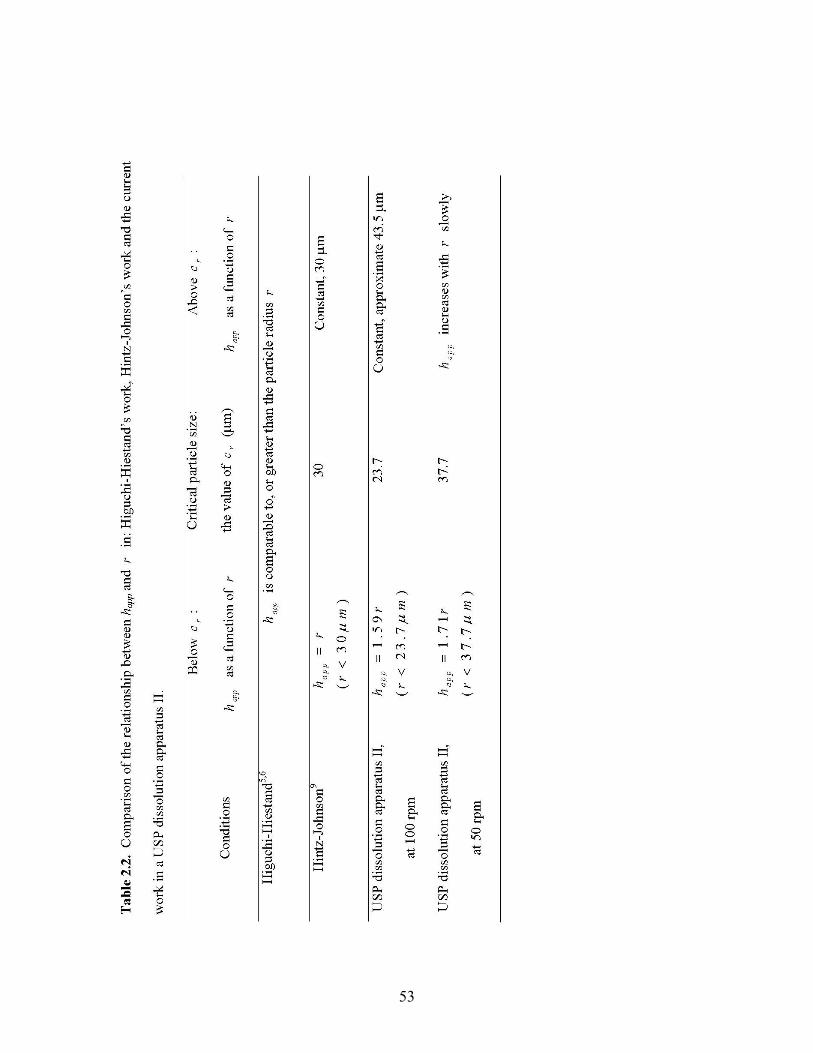
53
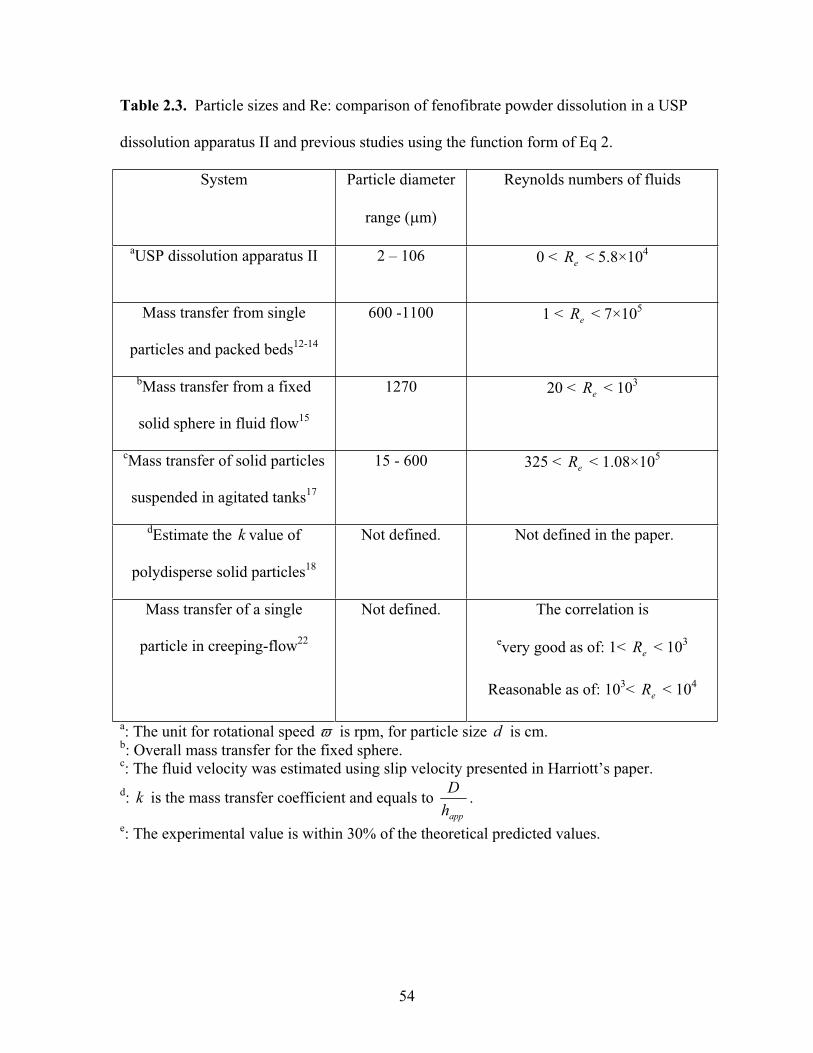
Table 2.3. Particle sizes and Re: comparison of fenofibrate powder dissolution in a USP
dissolution apparatus II and previous studies using the function form of Eq 2.
System Particle diameter
range ( m)
Reynolds numbers of fluids
aUSP dissolution apparatus II 2 – 106 0 < < 5.8×10eR 4
Mass transfer from single
particles and packed beds12-14
600 -1100 1 < < 7×10eR 5
bMass transfer from a fixed
solid sphere in fluid flow15
1270 20 < < 10eR 3
cMass transfer of solid particles
suspended in agitated tanks17
15 - 600 325 < < 1.08×10eR 5
dEstimate the k value of
polydisperse solid particles18
Not defined. Not defined in the paper.
Mass transfer of a single
particle in creeping-flow22
Not defined. The correlation is
every good as of: 1< < 10eR 3
Reasonable as of: 103< < 10eR 4
a: The unit for rotational speed is rpm, for particle size is cm.db: Overall mass transfer for the fixed sphere.c: The fluid velocity was estimated using slip velocity presented in Harriott’s paper.d: is the mass transfer coefficient and equals to k
apphD .
e: The experimental value is within 30% of the theoretical predicted values.
54

-2
0
2
4
6
Hea
t Flo
w (W
/g)
-45.02°C(I)0.005137W/g
79.90°C
79.53°C95.53J/gMethod Log:
1: Equilibrate at -80.00 °C2: Ramp 5.00 °C/min to 100.00 °C3: End of method
JET MILLED
-100 -50 0 50 100Temperature (°C)Exo Down Universal V3.8B TA Instruments
-55 -50 -45 -40 -35 -30 -25
0.106
0.108
0.110
0.112
0.114
0.116
Figure 2.1a. DSC thermograms of the jet-milled fenofibrate.
6
Figure 2.1b. DSC thermograms of fenofibrate “as received” from Sigma.
80.32°C
79.75°C95.06J/g
-44.74°C(I)0.005197W/g
Method Log:1: Equilibrate at -80.00 °C2: Ramp 5.00 °C/min to 100.00 °C3: End of method
SIGMA MATERIAL
-2
0
2
4
Hea
t Flo
w (W
/g)
0.120
0.115
0.125
-55 -50 -45 35 25-40 - -30 - -20
-50 0- 50 100100Exo Down Temperature (°C) Universal V3.8B TA Instruments
55

0
200
400
600
800
1000
1200
1400
1600
1800
20005
7.44
9.88
12.3
14.8
17.2
19.6
22.1
24.5 27
29.4
31.8
34.3
36.7
39.2
2 theta angle
Inte
nsity
as receivedJet-milled
Figure 2.2. PXRD patterns of fenofibrate “as received” and jet-milled.
56

0
20
40
60
80
100
0.1 1 10 100 1000Particle Diameter ( m)
Cum
ulat
ive
(%)
jet-milled
20-32
32-45
63-75
90-106
Figure 2.3. Particle size distribution of fenofibrate powders.
57

Figure 2.4. SEM picture of a typical fenofibrate powder (63-75 m).
58

0.00
0.20
0.40
0.60
0.80
1.00
0 5 10 15
Time (min)
Dis
solv
ed F
ract
ion
jet milled
20-32 um
32-45 um
63-75 um
90-106 um
Jet milled
20-32 um
32-45 um
63-75 um
90-106 um
blue: 100 rpmred: 50 rpm
Figure 2.5. Dissolution profiles of various size fractions of fenofibrate powder at 50 rpm and 100 rpm. (Error bars represent the standard deviation of a mean of three experiments.)
59
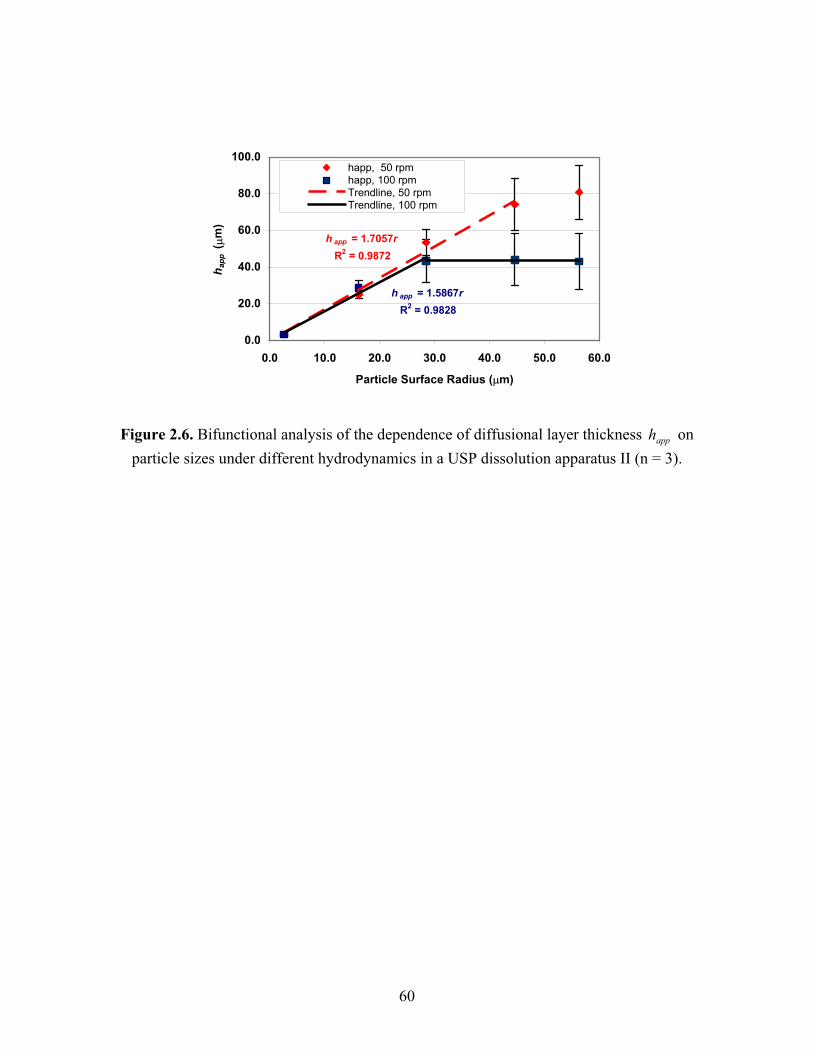
h app = 1.7057rR2 = 0.9872
h app = 1.5867rR2 = 0.9828
0.0
20.0
40.0
60.0
80.0
100.0
0.0 10.0 20.0 30.0 40.0 50.0 60.0
Particle Surface Radius ( m)
h app
(m
)
happ, 50 rpmhapp, 100 rpmTrendline, 50 rpmTrendline, 100 rpm
Figure 2.6. Bifunctional analysis of the dependence of diffusional layer thickness on particle sizes under different hydrodynamics in a USP dissolution apparatus II (n = 3).
apph
60

happ = 9.9121d1/2 - 23.307R2 = 0.9769
0.0
20.0
40.0
60.0
80.0
100.0
2.0 4.0 6.0 8.0 10.0 12.0
Sqrt of surface particle diameter ( m1/2)
h app
(m
)
50 rpm100 rpmlinear, 50 rpmTrendline, 100 rpmLi (S i 4)
Figure 2.7. Dependence of on square root of particle sizes under different hydrodynamics in a USP dissolution apparatus II (n = 3).
apph
61

0.20
0.40
0.60
0.80
1.00
1.20
0.0 250.0 500.0 750.0 1000.0 1250.0
Square root of Re
h app
/dExperimental
Simulated
4 1/ 2
2
1.5207 9.25 10 ( )
0.9875
apph dd
R
Figure 2.8. Dimensionless analysis of the dependence of diffusional layer thicknesson particle sizes and hydrodynamics in a USP dissolution apparatus II (n = 3).
apph
62

References.1. Amidon GL, Lennernas H, Shah VP, Crison JR. 1995. A theoretical basis for a biopharmaceutic drug classification: The correlation of in vitro drug product dissolutionand in vivo bioavailability. Pharm Res 12:413-420. 2. Lennernas H, Abrahamsson B. 2005. The use of biopharmaceutic classification of drugs in drug discovery and development: Current status and future extension. J Pharm Pharmacol 57:273-285. 3. Noyes AA, Whitney WR. 1897. J Am Chem Soc 19:930-934. 4. Martin AN, Bustamante P. 1993. Physical pharmacy: Physical chemical principles in the pharmaceutical sciences. 4th ed., Philadelphia: Lea & Febiger. p 333-334.5. Higuchi WI, Hiestand EN. 1963. Dissolution rates of finely divided drug powders. I. Effect of a distribution of particle sizes in a diffusion-controlled process. J Pharm Sci52:67-71.6. Higuchi WI, Hiestand EN, Rowe EL. 1963. Dissolution rates of finely divided drug powders. 2. Micronized methylprednisolone. J Pharm Sci 52:162-164. 7. Higuchi WI. 1967. Diffusional models useful in biopharmaceutics - drug release rate processes. J Pharm Sci 56:315-324. 8. Niebergall PJ, Milosovich G, Goyan JE. 1963. Dissolution rate studies. Ii. Dissolution of particles under conditions of rapid agitation. J Pharm Sci 52:236-241. 9. Hintz RJ, Johnson KC. 1989. The effect of particle-size distribution on dissolution rate and oral absorption. Int J Pharm 51:9-17. 10. Bistrat M, Anderberg EK, Barnett MI, Nystrom C. 1992. Physicochemical aspects of drug release.15. Investigation of diffusional transport in dissolution of suspended, sparingly soluble drugs. Int J Pharm 80:191-201. 11. deAlmeida LP, Simoes S, Brito P, Portugal A, Figueiredo M. 1997. Modeling dissolution of sparingly soluble multisized powders. J Pharm Sci 86:726-732. 12. Ranz WE, Marshall WR. 1952. Evaporation from drops.1. Chem Eng Pro48:141-146.13. Ranz WE, Marshall WR. 1952. Evaporation from drops.2. Chem Eng Pro48:173-180.14. Ranz WE. 1952. Friction and transfer coefficients for single particles and packed beds. Chem Eng Pro 48:247-253. 15. Garner FH, Grafton RW. 1954. Mass transfer in fluid flow from a solid sphere. Proc R Soc Lond A 224:64-81. 16. Bird RB. 1960. Transport phenomena. ed., New York: Wiley. p p. 409 & 647. 17. Harriott P. 1962. Mass transfer to particles.1. Suspended in agitated tanks. AICHE J 8:93-101. 18. Leblanc SE, Fogler HS. 1987. Population balance modeling of the dissolution of polydisperse solids - rate limiting regimes. AICHE J 33:54-63. 19. Wang J, Flanagan DR. 1999. General solution for diffusion-controlled dissolution of spherical particles. 1. Theory. J Pharm Sci 88:731-738. 20. Wang J, Flanagan DR. 2002. General solution for diffusion-controlled dissolution of spherical particles. 2. Evaluation of experimental data. J Pharm Sci 91:534-542. 21. Levich VG. 1962. Physicochemical hydrodynamics. ed., Englewood Cliffs, N.J.: Prentice-Hall. p 700.
63

22. Agarwal PK. 1988. Transport phenomena in multi-particle systems.2. Particle-fluid heat and mass-transfer. Chem Eng Sci 43:2501-2510. 23. USP. 2000. The united states pharmacopeia usp 24, the national formulary nf19. ed., Rockville, Maryland: United States Pharmacopeial Convention, Inc. p 2236. 24. Allen T. 1997. Particle size measurement. 5th ed., London; New York: Chapman& Hall. p 2 v. 25. Hayduk W, Laudie H. 1974. Prediction of diffusion-coefficients for nonelectrolytes in dilute aqueous-solutions. AICHE J 20:611-615. 26. Granero GE, Ramachandran C, Amidon GL. 2005. Dissolution and solubility behavior of fenofibrate in sodium lauryl sulfate solutions. Drug Dev Ind Pharm 31:917-922.27. Dean JA, Lange NA. 1999. Lange's handbook of chemistry. 15th ed., New York: McGraw-Hill. p 5.134. 28. Dali MV, Carstensen JT. 1996. Effect of change in shape factor of a single crystal on its dissolution behavior. Pharm Res 13:155-162. 29. Lai TYF, Carstensen JT. 1978. Effect of shape factor on cube root dissolution behavior. Int J Pharm 1:33-40.30. Mooney KG, Mintun MA, Himmelstein KJ, Stella VJ. 1981. Dissolution kinetics of carboxylic acids i: Effect of ph under unbuffered conditions. J Pharm Sci 70:13-22. 31. Mooney KG, Mintun MA, Himmelstein KJ, Stella VJ. 1981. Dissolution kinetics of carboxylic acids ii: Effect of buffers. J Pharm Sci 70:22-32. 32. Healy AM, McCarthy LG, Gallagher KM, Corrigan OI. 2002. Sensitivity of dissolution rate to location in the paddle dissolution apparatus. J Pharm Pharmacol54:441-444.33. Kukura J, Arratia PE, Szalai ES, Muzzio FJ. 2003. Engineering tools for understanding the hydrodynamics of dissolution tests. Drug Dev Ind Pharm 29:231-239. 34. McCarthy LG, Bradley G, Sexton JC, Corrigan OI, Healy AM. 2004.Computational fluid dynamics modeling of the paddle dissolution apparatus: Agitation rate, mixing patterns, and fluid velocities. AAPS Pharm Sci Tech 5:e31. 35. McCarthy LG, Kosiol C, Healy AM, Bradley G, Sexton JC, Corrigan OI. 2003.Simulating the hydrodynamic conditions in the united states pharmacopeia paddle dissolution apparatus. AAPS Pharm Sci Tech 4:E22. 36. Baxter JL, Kukura J, Muzzio FJ. 2005. Shear-induced variability in the united states pharmacopeia apparatus 2: Modifications to the existing system. AAPS J 7:E857-864.37. Devotta I, Ambeskar VD, Mandhare AB, Mashelkar RA. 1994. The life time of a dissolving polymeric particle. Chem Eng Sci 49:645-654. 38. Brian PLT, Hales HB, Sherwood TK. 1969. Transport of heat and mass between liquids and spherical particles in an agitated tank. AICHE J 15:727-732. 39. Sherwood TK, Pigford RL, Wilke CR. 1975. Mass transfer. ed., New York: McGraw-Hill. p ix, 677. 40. Diebold SM. 2000. Hydrodynamik und lösungsgeschwindigkeit: Untersuchungen zum einfluss der hydrodynamik auf die lösungsgeschwindigkeit schwer wasserlöslicher arzneistoffe. Institute for Pharmaceutical Technology, ed., Frankfurt: Johann WolfgangGoethe University.
64

41. Bird RB, Stewart WE, Lightfoot EN. 2002. Transport phenomena. 2nd ed., New York: J. Wiley. p xii, 895. 42. Bisrat M, Nystrom C. 1988. Physicochemical aspects of drug release.8. The relation between particle-size and surface specific dissolution rate in agitated suspensions.Int J Pharm 47:223-231. 43. Takagi T, Chandrasekharan, R., Bermejo, M., Yamashita, S., Amidon, G.L. Inpreparation. Provisional biopharmaceutical classification of the top united states, european and japanese drugs. 44. Lipinski CA, Lombardo F, Dominy BW, Feeney PJ. 1997. Experimental and computational approaches to estimate solubility and permeability in drug discovery anddevelopment settings. Adv Drug Deliver Rev 23:3-25. 45. Lipinski CA. 2000. Drug-like properties and the causes of poor solubility and poor permeability. J Pharmacol Toxicol Methods 44:235-249. 46. Jinno J, Kamada N, Miyake M, Yamada K, Mukai T, Odomi M, Toguchi H, Liversidge GG, Higaki K, Kimura T. 2006. Effect of particle size reduction on dissolution and oral absorption of a poorly water-soluble drug, cilostazol, in beagle dogs. J Control Release 111:56-64. 47. Scholz A, Kostewicz E, Abrahamsson B, Dressman JB. 2003. Can the usp paddle method be used to represent in-vivo hydrodynamics? J Pharm Pharmacol 55:443-451. 48. Scholz A, Abrahamsson B, Diebold SM, Kostewicz E, Polentarutti BI, Ungell AL, Dressman JB. 2002. Influence of hydrodynamics and particle size on the absorption of felodipine in labradors. Pharm Res 19:42-46. 49. Meyer JH, Dressman J, Amidon G. 1985. Hydrodynamic aspects of gastrointestinal (gi) transit. Nippon Heikatsukin Gakkai Zasshi 21 Suppl:99-100. 50. Meyer JH, Doty JE. 1988. Gi transit and absorption of solid food: Multiple effects of guar. Am J Clin Nutr 48:267-273. 51. Oberle RL, Chen TS, Lloyd C, Barnett JL, Owyang C, Meyer J, Amidon GL. 1990. The influence of the interdigestive migrating myoelectric complex on the gastric emptying of liquids. Gastroenterology 99:1275-1282. 52. Sirois PJ, Amidon GL, Meyer JH, Doty J, Dressman JB. 1990. Gastric emptying of nondigestible solids in dogs: A hydrodynamic correlation. Am J Physiol 258:G65-72.
65
CHAPTER III
SOLUBILIZATION AND DISSOLUTION OF INSOLUBLE WEAK ACID, KETOPROFEN: EFFECTS OF PH COMBINED WITH SURFACTANT
Abstract
This study investigated the combined effect of pH and surfactant on the solubility and
dissolution of ketoprofen (KP), a highly permeable and an ionizable and water-poorly
soluble drug in gastrointestinal tract. The equilibrium solubility of KP was determined
in buffers at the pH range from 4.0 to 6.8 and sodium lauryl sulfate (SLS) concentrations
from 0% to 2.0%. Its intrinsic dissolution rate was measured in the same media using a
rotating disk apparatus. A simple additive model accounting for the free unionized KP
and ionized KP forms, and their corresponding micellar forms was employed to study
the in-vitro solubility and dissolution behavior. Nonlinear regression analysis showed
that the proposed model agreed well with the experimental data, with 96.0Rsq
( ) for the solubility study, and 0001.0P 0.98Rsq ( 0001.0P ) for the intrinsic
dissolution rate measurement. The and values are estimated as 4.76 ± 0.00 and
0.253 ± 0.05 mg/mL, respectively, in good agreement with literature reports. The
micellar solubilization coefficient for the unionized is 757 ± 165 L/mol,
whereas the value for the ionized is 9.88 ± 6.70 L/mol. The diffusion
apK KPc
*k micelleKP][
**k micelleKP ][
66

coefficients of various species: , and , are 7.68 × 10, , [ ]micelleKP KP KP micelleKP ][ -6,
1.54 × 10⁻⁶, 2.32 × 10⁻⁷, and 2.13 × 10⁻²⁰ cm2/s, respectively. The maximum
enhancement of solubilization is approximately 232-fold, while the maximum dissolution
amplification is only 54-fold because of the smaller diffusivity of micellar species. The
dramatic enhancement of in-vitro solubility/dissolution attributable to an increase of pH
and presence of SLS mimics the in-vivo solubilization/dissolution behavior of KP along
the gastrointestinal tract, when the pH increases from 1-2 in the stomach to 5-6 in the
duodenum. The results suggest that the KP dissolves very rapidly in small intestine,
implying that its absorption will be predominantly controlled by gastric emptying, and
only minimally limited by the subsequent dissolution processes. This behavior is very
similar to BCS I drugs, thus KP may be considered for possible waivers of
bioequivalence.
Introduction
The Biopharmaceutics Classification System (BCS) categorizes drugs into four
classes according to their solubility and permeability 1. BCS I compounds can be waived
of the in-vivo bioequivalence study because of its high solubility and high permeability.
Whereas, the BCS II class of compounds exhibit high permeability and low solubility
relative to the administered dose. Solubility, one of the key parameters in BCS, as well as
dissolution rate are the most essential factors controlling the rate and extent of drug
absorption. The in-vivo drug solubilization and dissolution processes are complicated by
a number of physiological processes and factors in the gastroenterological tract, such as
gastrointestinal motility 2,3, pH, bile salts, buffer capacity, ionic strength, food intake and
67

viscosity 4. Among them, pH and surfactant reflect the gastrointestinal pH change and
the presence of bile salts. They are also the major physiochemical determinants of drug
dissolution. Both surfactant and pH effects are important when considering ionizable
drugs, particularly those with the pKa values in the gastrointestinal pH range.
The individual effect of pH and surfactants on the solubility and dissolution of
drugs has been studied previously. As early as 1960’s, Olander proposed both the film
theory and the surface-renewal theory of simple mass transfer in conjunction with various
equilibrium reactions 5. Monney et al applied the film model to studying the pH effect on
drug dissolution 6,7. Other researchers studied the effect of surfactant on solubilization
and dissolution of drugs. For example, Rippie et al investigated the solubilization effect
of polysorbate 80 on weakly acidic and basic drugs 8; and Elworthy et al analyzed the
effect of four different nonionic surfactants on the dissolution of poorly soluble drug,
griseofulvin 9. During the late 1970’s and early 1980’s, research on the effects of pH 10,11
and surfactant 12,13 on drug solubilization and dissolution focused on disintegration and
dissolution of traditional tablets. Later, the dissolution theory was further advanced with
the establishment of the convective diffusion model. This model was first developed by
McNamara and Amidon 14 and followed by others 15,16 to describe the effects of
ionization at the solid-liquid surface and irreversible reaction of the dissolved species in
the hydrodynamic boundary layer. In the last decade, drug solubilization/dissolution
research has evolved to the stage of investigating the pH or surfactant effects on
controlled-release dosage forms 17 in polymeric matrix, studying their combination
effects with food uptake 18, and working with poorly water-soluble drugs 19,20.
However, the combined effects of pH and surfactants on the solubilization and
dissolution of weak acid drugs has received little attention, especially in view of
68

reflecting an in-vivo change of pH and surfactant along the gastrointestinal tract using an
in-vitro model. The purpose of this paper is to investigate the effects of pH combined
with surfactant on the solubility and dissolution of BCS II water-poorly soluble weak
acids in an in-vitro environment. In this paper ketoprofen is selected as a model
compound for its desirable biopharmaceutical properties, including an approximate pKa
of 4.6 which is in physiological range and high permeability of 8.7×10⁻⁶ cm/s in human
jejunum.
Methods
Theoretical Basis
Solubilization by pH combined with Surfactant – an Equilibrium Model
The equilibrium model, as shown in Scheme 1, was established by Jinno et al 21. It
is employed here to describe the effects of pH and surfactant on the equilibria of KP in
aqueous solutions. In the scheme, the pH effect is associated with an ionization
equilibrium and the surfactant effect includes two solubilization equilibria.
The pH effect is described as an ionization process, shown as the following:
KPKPa cHcK /])[( (1)
where is hydrogen ion concentration, is the dissociation constant of ketoprofen,
and and are the concentrations of unionized and ionized ketoprofen,
respectively. The surfactant effect exerts its micellar impact not only on the unionized
drug molecules but also on the ionized drug molecules. These effects are expressed in the
following equations:
][H aK
KPc KPc
micelleKPmKP ccck ][][ /))((* (2)
69

micelleKPmKPccck
][][/))((** (3)
cmcccm surfactant (4)
where k* and k** are the equilibrium constants for micellar solubilization of unionized
drug and ionized drug, whereas and are the concentrations of
unionized and ionized drugs in the micelle, and is the concentration of micellar
surfactant. The value of is determined using eq 4, and the critical micelle
concentration (CMC) of sodium lauryl sulfate is taken from literature
micelleKPc ][ micelleKPc ][
mc
mc
22,23 as 0.008 M
that is equivalent to 0.25% (w/v).
Total Solubility
The total solubility of a weak acid or a weak base in surfactant-containing buffers
was discussed previously in literature 8,24. For ketoprofen, its total solubility can
be expressed as a sum of the solubility values of individual
totalc
KP relevant species:
micelleKPmicelleKPKPKPtotal ccccc ][][ (5)
Substituting in eq 5 with eqs 1, 2 and 3 gives eq 6:[ ] [ ], ,
micelle micelleKPKP KP
c c c
KPmaa
total ccHK
kkHK
c ])][
***(][
1[ (6)
It is noticed that the value of , namely the intrinsic solubility of ketoprofen, is
constant for all tested experiments due to the existence of excess amount of in the
system. Therefore, a dimensionless solubility number, (equal to ), is
introduced to illustrate the extent of solubilization power.
KPc
solidKP
SPc KPtotal cc /
70

Furthermore, eq 6 can be transformed into eqs 7 and 8 that clearly reveal how
changes according to the pH and surfactant, respectively. Eq 7 consists of two
components, each of which comprises both the free solute form and the micelle-
solubilized form, and respectively represents the solubility of unionized drug in the
term and that of ionized drug in
totalc
)*1( mck][
)**1(HKck a
m . The solubility of the
ionized drug rather than the unionized drug is the component influenced by the pH effect.
For a given surfactant concentration , eq 7 suggests that the total solubility of KP
increases reciprocally with concentration and thus exhibits a positive log-linear
relationship with pH. In addition, eq 7 also suggests that higher values of would lead
to greater sensitivity of the total solubility relative to pH changes. This is primarily due
to the contribution of the micelle solubilized ionized-drug, which is expressed in
expression of
mc
][H
mc
)]][
1([)**1(H
Kckcc amKPtotal. For a given concentration or
pH, eq 8 shows that would increase linearly with the micellar concentration .
Certainly, this linear relationship is well described using a constant intercept of
][H
SPc mc
)][
1(HK a and a fixed slope of )
][***(
HKkk a . The value of the intercept is determined
by the pH of the solution. In comparison, the slope is determined not only by the pH but
also by the drug-micelle association constants. For a weak acid drug, a higher value of
pH would lead to a decreased , and consequently increase the solubilization power
.
][H
SPc
)**1(][
)*1( ma
mKP
totalSP ck
HKck
ccc (7)
71

maa
KP
totalSP c
HKkk
HK
ccc )
][***()
][1( (8)
Total Dissolution
The general equation describing one-dimensional mass transport in a fluid 25 is
composed of the diffusive, convective, and reactive contributions and is shown as
follows:
2 2/ / /i i i Z ic t D d c dz dc dz Ri (9)
where , and are the diffusion coefficient, the molar concentration, and the rate of
reaction per volume of species i , is the fluid velocity, and
iD ic iR
v t is the time. Assuming an
instantaneously irreversible reaction at the solid-liquid surface, mass transfer in the
rotating disk system at steady state can be simplified to
2 2/ / /i i i Z ic t D d c dz dc dz 0 (10)
where is the axial velocity of fluid toward the disk. Levich solved the equation to
derive the flux of the solute from the rotating disk as
Zv
02/16/13/262.0 ii cvDJ (11)
where is the flux, v is the kinematic viscosity, is the diffusivity of species i , is
the concentration of species i at the disk surface, and
JiD 0iC
is the angular velocity of the
disk. Eq 11 is applicable for the micelle-facilitating dissolution of KP from a rotating
disk and gives:
)(62.0 03/22/16/1
iitotal cDvJ (12)
where is the total flux of the drug, which is a sum flux of four KP related species
and expressed as
totalJ
72
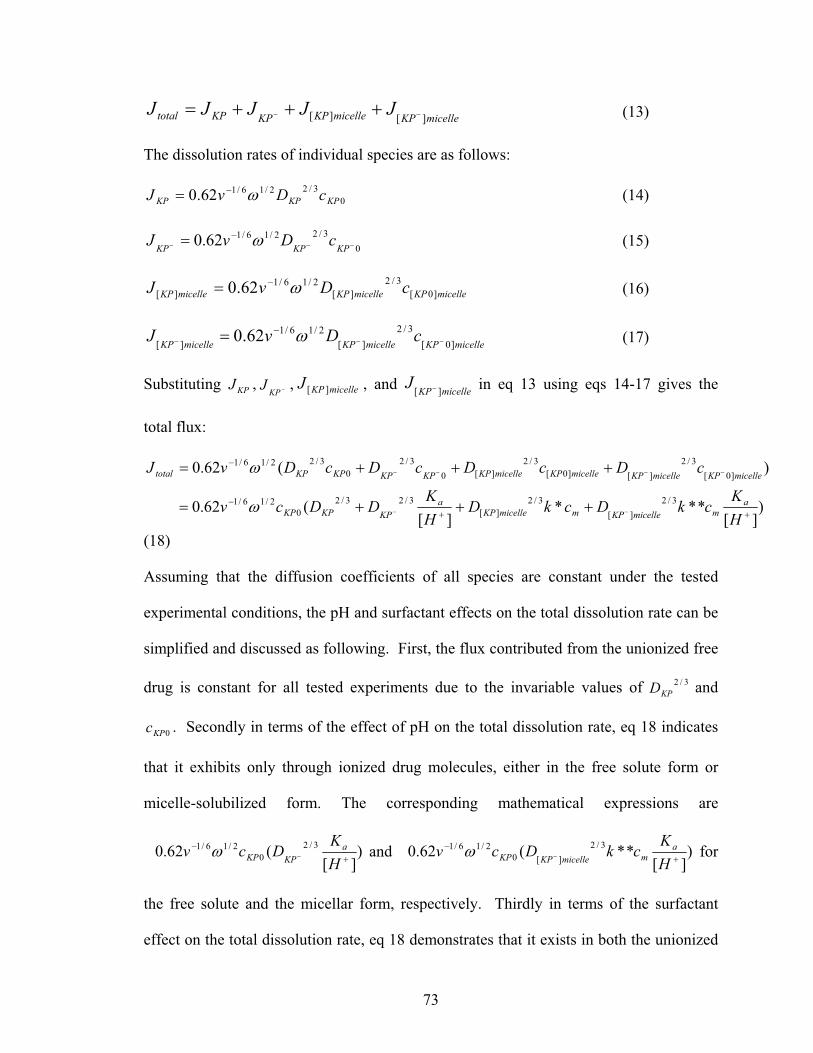
micelleKPmicelleKPKPKPtotal JJJJJ][][ (13)
The dissolution rates of individual species are as follows:
03/22/16/162.0 KPKPKP cDvJ (14)
03/22/16/162.0 KPKPKPcDvJ (15)
micelleKPmicelleKPmicelleKP cDvJ ]0[3/2
][2/16/1
][ 62.0 (16)
micelleKPmicelleKPmicelleKPcDvJ ]0[
3/2
][2/16/1
][ 62.0 (17)
Substituting , , , and in eq 13 using eqs 14-17 gives the
total flux:
KPJKP
J micelleKPJ ][ micelleKPJ ][
)][
***][
(62.0
)(62.0
3/2
][3/2
][3/23/2
02/16/1
]0[3/2
][]0[3/2
][03/2
03/22/16/1
HK
ckDckDHK
DDcv
cDcDcDcDvJ
ammicelleKPmmicelleKP
aKPKPKP
micelleKPmicelleKPmicelleKPmicelleKPKPKPKPKPtotal
(18)
Assuming that the diffusion coefficients of all species are constant under the tested
experimental conditions, the pH and surfactant effects on the total dissolution rate can be
simplified and discussed as following. First, the flux contributed from the unionized free
drug is constant for all tested experiments due to the invariable values of and
. Secondly in terms of the effect of pH on the total dissolution rate, eq 18 indicates
that it exhibits only through ionized drug molecules, either in the free solute form or
micelle-solubilized form. The corresponding mathematical expressions are
3/2
KPD
0KPc
)][
(62.0 3/2
02/16/1
HK
Dcv aKPKP and )
][**(62.0 3/2
][02/16/1
HKckDcv a
mmicelleKPKP for
the free solute and the micellar form, respectively. Thirdly in terms of the surfactant
effect on the total dissolution rate, eq 18 demonstrates that it exists in both the unionized
73

and ionized form, whereas the unionized form may contribute more significantly. This
premise is resulted mainly from some previous observations 21,26,27 that the micelle
association constant for the unionized form is much larger than that of the ionized form.
Materials and Data Analysis
Ketoprofen (KP) and sodium lauryl sulfate (SLS, > 99% purity) were purchased
from Sigma Chemical Company (St. Louis, MO). HPLC grade acetonitrile was
purchased from Fisher Scientific Company (Fair Lawn, NJ). All other chemicals were of
analytical grade from Sigma Chemical Company (St. Louis, MO). Distilled, deionized
and filtered water was prepared in house and used for all experiments. Model fitting and
parameter estimations were performed with nonlinear regression analysis by Sigmaplot
8.0 (SPSS Inc., Chicago, IL). The regression analysis for the dissolution data was
weighted by reciprocal values of square of the standard deviation.
Media Preparation
A series of McIlvaine buffers were prepared at pH 4.0, 4.6, 6.0 and 6.8 by mixing
appropriate volumes of 0.1M citric acid and 0.2 M disodium phosphate solutions. SLS
was dissolved with the buffers at the concentrations of 0.5, 1.0, and 2.0% w/v. All media
were deaerated by stirring under vacuum prior to use.
Solubility Determination
An excess amount of ketoprofen powder (5-1000 mg) was shaken in screw-capped
vials containing 5 mL of tested buffers at 37ºC in an orbital shaker water bath (LABLINE
Instruments, Inc., Melrose Park, IL). The final pH of the testing solutions were checked
and adjusted to the original values by adding 0.5 M disodium phosphate solution. At
suitable time intervals, 1.0 mL of samples were collected and filtered through 0.45 mm
membrane, and then diluted with appropriate amount of buffers prior to the HPLC
74

analysis. The equilibrium solubility of ketoprofen in various buffers was established as
the difference between three consecutive measurements is within 1%. The HPLC was
equipped with a pump (Model 510, Waters Associates, Milford, MA) operated at 1
mL/min, a sample processor (WISP Model 712, Waters Associates, Milford, MA), a
variable wavelength UV detector (Spectroflow 783 Absorbance detector, Kratos
analytical Instruments, Ramsy, NJ) set at 254 nm and connected to an integrator (HP
3396 Series II, HP Company, Avondale, PA). The mobile phase consisted of water (pH
3.2): acetonitrile (35/65 v/v). The analytical column used was a LiChroCART column
(250 x 4 mm I.D.) packed with LiChroCART 100 RP-18, 5µm particle size (EM
Science, Gibbstown,NJ) preceded by a LiChroCART guard column (4 x 4 mm) of the
same packing material. The retention time of ketoprofen under these conditions was
about 5 minutes.
Intrinsic Dissolution Measurements
The intrinsic dissolution rates of ketoprofen in various buffers were measured using
rotating disk method. Ketorpofen powder (150 mg) was compressed to form a circular
compact, with a radius of 0.55 cm, in the rotating disk die at 1,000 lbs for 1 minute using
a hydraulic laboratory press (Fred Carver, Inc., Summit, NJ). The die containing the
compact was mounted onto a Plexiglass shaft attached to an overhead synchronous motor
(Cole-Parmer Scientific, Niles, IL). The die was rotated at 50, 100, and 200 rpm, which
was calibrated with a digital tachometer (Cole-Parmer Scientific, Niles, IL). The single
face of the compact was exposed to 150 mL of the dissolution media in a jacketed beaker
maintained at 37 C 1 C through the circulating water heated with a water bath
circulator (Isotemp Constant Temperature Circulator Model 8000, Fisher Scientific,
Pittsburgh, PA). The dissolution medium was continuously circulated through ultraviolet
75

(UV) spectrophotometer flow cells at 8 mL/min using a peristaltic pump (Masterflex,
Cole-Parmer Instrument Co., Chicago, IL). UV absorption at 258 nm was recorded at
0.25-1 min intervals using a UV spectrophotometer (Perkin-Elmer Lambda 3B UV/VIS
Spectrophotometer, Oak Brook, IL). Dissolved amounts of ketoprofen was maintained at
less than 10% of the solubility over the entire experiment ensuring sink condition.
Results and Discussion
Total Solubility
The equilibrium solubility of ketoprofen in various buffers containing 0-2% (w/v)
SLS is shown in Table 3.1. Eq 6 was selected to fit the measured solubility values by
nonlinear regression analysis. Figure 3.2 illustrates the 3D mesh plot with the observed
values as functions of pH and SLS concentrations ( 0001.0,96.0 PRsq ). The
, , , and values were estimated as 0.253 ± 0.05 mg/mL, 4.76 ± 0.00, 757
± 165 L/mol, and 9.88 ± 6.70 L/mol, respectively. The estimated and values
agree well with the reported data
KPc apK *k **k
KPc apK
28,29. The smaller value relative to is
suggestive that the micellar solubilization of ionized drug is fairly insignificant
presumably as a result of the anionic nature of SLS.
**k *k
Using the estimated number (i.e., 0.253 mg/mL), the corresponding
solubilization power values were calculated based on eqs 7 and 8 are listed in Table 3.2.
The results indicate that the total solubility increases positively with pH for any
given SLS concentration, as expected. In the absence of SLS, the maximal solubilization
power is obtained at pH 6.8 with a value of 142. In the presence of SLS, the combined
solubilization power of pH and surfactant is enhanced even further than just single pH
KPc
tatalc
76

effect. At pH 6.8 with 2.0% SLS, in particular, an exceptionally high solubilization
power value of approximately 205 is observed. This observation is consistent with eq 7.
As previously discussed, eq 7 expects an increased solubilization of both the unionized
drug and the ionized drug at a higher , expressed as mc )*1( mck and
)**1(][ m
a ckHK , respectively. In addition, the fractional solubility from the unionized
drug and the corresponding micelles, or that from the ionized drug and its micelles, is pH
dependant. This is resulted from the interplay of pH and SLS on the ionizable drugs. For
instance, at pH << , the solubility contribution from the ionized drug and its micelles
is small relative to that of the unionized drug mainly because the value of is much
smaller compared with the . On the other hand, at pH >> , the solubility
contribution from the ionized drug and the micelles becomes more significant.
Furthermore, it appears that KP solubility is more sensitive to pH change than to the SLS
changes. This is can be simply derived from Table 3.2 that pH could be enhance
solubility in the range of 4-160 fold, while SLS could only increase 2-50 fold within the
conducted experimental conditions.
apK
**k
*k apK
The solubility results also indicated that the total solubility increased proportionally
with SLS concentration for any given pH value, as showed in Table 3.2 that all the
corresponding linear regression analysis had Rsq > 0.98. This observation is indeed
theoretically expected from eq 8 that demonstrates an intercept of )][
1(HK a and a slope
of )][
***(HK
kk a . Furthermore, eq 8 also suggests that at higher pH the total
solubility is more responsive to a change because the contribution from micellartotalc mc
77

ionized drug )][
**(HKk a becomes greater. This contribution, however, is quite limited
on account of the very small value of .**k
Intrinsic Dissolution Rate
A typical intrinsic dissolution rate as a function of the square root of the rotational
speed is illustrated in Figure 3.3. The intrinsic dissolution rates were normalized to
with the unit of by multiplying the volume of
media (150 mL) divided by the surface area of the compact (0.95 cm
2/1/J 2/12/124 ///10 radscmmg
2) using linear
regression assuming zero intercept. Similarly, the dissolution flux increases with pH and
addition of SLS. The dissolution flux is found to be linear with SLS concentration at all
pH values (Rsq: 0.93-0.99). The intrinsic dissolution rates of ketoprofen in various
buffers containing 0-2% (w/v) SLS are presented in Table 3.3. Using the estimated
values of , , , and obtained from the solubility study, the measured
intrinsic dissolution rate data were fitted to eq 18 by nonlinear regression analysis.
Figure 3.4 illustrates the dissolution rate result ( ) of the fitted surface plot with
the experimental data as functions of pH and SLS concentrations
( ). The estimated diffusivity values for species
, and are 7.68 × 10
KPc apK *k **k
2/1/J
0.98, 0.0001Rsq P
, , [ ]micelleKP KP KP micelleKP ][ -6, 1.54 × 10⁻⁶, 2.32 × 10⁻⁷, and 2.13 ×
10-20 cm2/s, respectively. It is apparent that the diffusivity value of is trivial.
Thus, the flux contribution from the micellar form is negligible. Then, eq 18 can be
simplified as the following:
micelleKP ][
1/ 6 1/ 2 2 / 3 2 /3 2 /30 [0.62 ( * )
[ ] micelle
atotal KP KP KP mKP
KJ v c D D D kH ] c (19)
78

In eq 19, it becomes evident that the flux is composed of three fractions. One fraction is
the constant flux from the unionized drug KP . The second fraction is the pH-influenced
flux from the ionized drug KP . And the third fraction is the surfactant-controlled flux
from the unionized micelles . As a result, the most significant dissolution
enhancement should be achieved at maximum pH and SLS concentration. In fact, the
maximal dissolution enhancement is about 50-fold at pH 6.8 with 2.0% SLS.
micelleKP][
Interestingly, the effect of pH and surfactant on the intrinsic dissolution rate are
independent and additive, which are reflected respectively in the expressions of
][62.0 3/2
02/16/1
HK
Dcv aKPKP and . For example, if
the pH value is low, especially when pH << pKa, the
mmicelleKPKP ckDcv *62.0 3/2
][02/16/1
][3/2
HK
D aKP
contribution would
be small. Accordingly, the surfactant effect would appear to be more significant. On the
other hand, if pH increases until it is much larger than pKa, the fractional input from
][3/2
HK
D aKP
becomes more substantial compared with . Hence, the
effect of pH would be more dominant in the KP dissolution. This phenomenon was
observed in the study as shown in Table 3.3. In particular, at pH 4.0, the enhancement of
flux with 2.0% SLS is about 42.5-fold, whereas at pH 6.8, the corresponding flux
enhancement is only about 1.2-fold.
mmicelleKP ckD *3/2
][
The overall dissolution amplification is moderate in contrast to the solubility
enhancement owing to the much smaller diffusivity of micellar species. In fact, the
diffusivity of the micellar is in essence zero. Additionally, the value
is about 33 times lower than the value presumably by reason of a much higher
micelleKP ][micelleKPD ][
KPD
79

molecular weight of the micelle form. This ratio is much higher than the ratio of 9.0
observed with the carbamazepine-SLS system 30 and the 1.7 observed with the
piroxicam-SLS system 21. The rather low diffusivity of in turn may be on
account of an inherent higher micellar solubilization equilibrium coefficient (k*) relative
to the reported values of approximate 300 L/mol for carbamazepine
micelleKP ][
30 and 348 mol/L for
piroxicam 21. The absolute diffusivity values of free KP and the forms, however,
are within the same numerical range as those of carbamazepine
KP
30, piroxicam 21 and
benzoic acid 31.
Regulatory significance: potential waiver of in vivo bioequivalence
Recently, a Guidance for Industry was published in the Federal Register that
proposed a waiver of in vivo bioavailability and bioequivalence studies for immediate
release solid oral dosage forms containing Class I active moieties/active ingredients of
the biopharmaceutics classification system 32. This guidance pertains to highly water-
soluble and highly permeable drugs that satisfy the following major conditions:
a. the highest dose strength is soluble in 250 mL of water or less over the pH range 1-
7.5;
b. the extent of absorption in humans is determined to be 90% or more of an
administered dose based on mass balance or compared to an intravenous reference
dose;
c. 85% or more of the labeled amount of drug substance dissolves within 30 minutes
using USP apparatus I at 100 rpm or apparatus II at 50 rpm in a volume of 900 mL or
less of the following media;
80

1) acidic media such as 0.1 N HCl or simulated gastric fluid USP without enzymes; 2) a
pH 4.5 buffer; and 3) a pH 6.8 buffer or simulated intestinal fluid USP without
enzymes.
Class II drugs in the biopharmaceutics classification system possess low water
solubility but are highly permeable. Thus, these drugs would not satisfy all the Class I
waiver requirements, in particular with the solubility and dissolution requirements.
However, Class II weakly acidic drugs with pKa in GI physiological range such as
ketoprofen that may be completely ionized and thus highly soluble and rapidly dissolving
in an intestinal milieu with an average pH of ~6.5, may be considered for the possible
waivers of in vivo bioequivalence.
“Highly soluble” requirement
Ketoprofen, like many other drugs, is mainly absorbed in the small intestinal region
where an average pH of ~6.5 and containing total concentrations of bile salts and lecithin
around 7 mM in the fasted state, or a pH of around 5-6 and a total bile salts and lecithin
concentration of about 19 mM in the fed state 33-35. As a carboxylic acid drug, it has been
shown previously that increase of pH would enhance its solubility and consequently the
dissolution rate, particularly at pH > pKa of the acid. In addition, the bile salts are
present in the small intestine. Previous studies have demonstrated that bile salts improve
the in-vivo solubilization of many drugs. Thus, their dissolution and absorption are
enhanced accordingly. This seems to be working with ketoprofen, as shown by the
present study that SLS could serve as a bile salt improving its solubility and intrinsic
dissolution. As ketoprofen is taken orally, it would have minimal solubility/dissolution
in the acidic stomach in consequence of the local low pH (1-2) environment.
Immediately after the drug is emptied into the upper small intestine, the
81

solubility/dissolution of ketoprofen would increase very quickly. This is mainly due to
two factors: the dramatic increase of pH and the presence of bile salts in small intestine.
From the model in the present paper, KP would have the solubility of at least 0.7 mg/mL
at pH 5-6, even in the absence of any bile salts or surfactants. Consider an example of KP
product with the maximum dose of 75 mg (Orudis , Wyeth-Ayerst Pharmaceuticals,
PA), the required dissolving volume for complete solubilization of KP would be less than
110 mL. This volume is much smaller than the 250 mL dissolving volume, which is
currently used by FDA 32 for defining “highly soluble” drugs to classify a BCS I
compound. Therefore, results in this paper suggest that KP can be defined as “highly
soluble” drug at pH > 5-6. Nonetheless, this “highly soluble” definition does not hold
true over the entire pH 1.2-7.4 range, in particular for the low pH end. With the
consideration of high permeability of KP, it leads to support the hypothesis that the
absorption behavior of KP could exhibit very similarly to that of BCS I compound in the
local absorption region in the intestine.
“Rapidly dissolving” requirement
In addition to the drug, it is of importance to consider the drug products that are
formulated and manufactured in rapidly dissolving solid immediate release dosage forms.
For any KP immediate release products that dissolve very rapidly, the absorption kinetics
from GI tract would be governed by the gastric emptying, rather than by the dissolution
rate. Therefore, the absorption rate will be essentially controlled by the gastric emptying
rate and no correlation with the solubility or dissolution rate is expected. Thus,
appropriate in vitro dissolution testing procedures may be established specifically for
BCS II acidic drugs in the future for the assurance of a waiver of in vivo bioequivalence.
82
Conclusions
In conclusion, we suggest KP, which possesses highly permeability, and is a weakly
acidic drug with pKa in GI physiological range and thus exhibits pH enhanced solubility
and dissolution rate in the absorption region, as a candidate for waivers of in vivo
bioequivalence. The significance of the present study may be applicable to other weakly
acidic drugs with high permeability. For these drugs, their solubility measurement may
be conducted around pH 5-6 with appropriate SLS and their dissolution testing under
aforementioned conditions for KP, which represents more biopharmaceutically and
physiologically relevant pH. Interestingly, it has been advocated by other researchers
that the current FDA definition of “high solubility” may be too restrict for 15 acidic
drugs 36, including ibuprofen, piroxicam, naproxen and indomethacin. These drugs are
all weak acids exhibiting pKa values ranging from 4.2-5.3 and log P (octanol-water)
values between 1 (ketoprofen) to 3.8 (indomethacin) 29. An example of a weak acid
NSAID that does not conform to this general trend is mefenamic acid. It has been
reported that the enhancement of mefenamic acid upon ionization, though substantial is
not sufficient to satisfy dose volume requirement 37. Hence, the absorption and
bioavailability of mefenamic acid would be dissolution rate-limited. A more general
conclusion, therefore, for Class II weakly acidic drugs should stipulate that a) the drug
should be highly permeable (> 90% absorption in humans; Peff ~ 2.5 103 cm/s;
absorption half-time ~ 1h); b) that it be substantially ionized at a pH of 6.5 and/or c) that
it satisfy high solubility requirements at pH 6.5. Under these circumstances, such Class
II drugs would be essentially similar to Class I drugs and could be considered for waivers
of in vivo bioequivalence testing.
83

In summary, the solubility and intrinsic dissolution rate behavior of ketoprofen is
well characterized by the additive model described in this paper. Even though the in-vivo
case is complicated with gastric emptying and other physiological factors, the
solubility/dissolution enhancement due to an increase of pH and the presence of SLS
could reflect the in-vivo solubility/dissolution behavior along the gastrointestinal tract.
The study supports the possibility for ketoprofen and other BCSII weak acids that
dissolve rapidly and completely in small intestine, to be waived of in vivo
bioequivalence.
84

Table 3.1. Equilibrium solubility (mg/mL S.D.) of ketoprofen at various pH and SLS
concentrations.
SLS concentration (%, w/v)
pH 0.0 % 0.5 % 1.0 % 2.0 %
4.0 0.28 ± 0.01 2.23 ± 0.03 4.70 ± 0.04 13.09 ± 0.04
4.6 0.49 ± 0.00 2.62 ± 0.02 5.61 ± 0.11 14.90 ± 0.50
6.0 3.68 ± 0.13 6.11 ± 0.12 9.26 ± 0.13 19.73 ± 0.46
6.8 40.76 ± 0.01 44.25 ± 0.00 49.63 ± 0.01 58.80 ± 0.01
85

Table 3.2. Solubilization power (CSN) of various pH and SLS concentrations on
Ketoprofen.
SLS concentration (%, w/v)
pH 0.0 % 0.5 % 1.0 % 2.0 % Slope1 Rsq1
4.0 1.24 8.82 18.58 51.76 822.84 0.990
4.6 2.17 10.36 22.18 58.92 927.04 0.992
6.0 16.33 24.16 36.62 78.02 1013.45 0.987
6.8 161.17 174.97 196.24 232.50 1151.86 0.996
1: indicate the linear regression of Ctotal vs SLS for a given pH.
86

Table 3.3. The intrinsic dissolution rate ( × of
ketoprofen at various pH and SLS concentrations.
,/ 2/1J 4 2 1/ 2 1/ 210 / / / . .)mg cm s rad S D
SLS concentration (%, w/v)
pH 0.0 % 0.5 % 1.0 % 2.0 %
4.0 1.68 ± 0.03 4.15 ± 0.03 6.05 ± 0.09 9.20 ± 0.16
4.6 3.05 ± 0.04 6.18 ± 0.05 8.30 ± 0.16 11.35 ± 0.11
6.0 14.61 ± 0.15 17.38 ± 0.09 20.32 ± 0.13 21.90 ± 0.32
6.8 71.38 ± 4.41 75.36 ± 1.30 79.93 ± 6.49 84.69 ± 2.89
87

O
COOH
CH3
Figure 3.1. Chemical Structure of Ketoprofen.
88

Ksp
KPsolution
Ka
H+
+ k**KP-
k*[KP]micelle
KPsolid
[KP-]micelle
Scheme 3.1. Equilibrium model of ketoprofen in surfactant containing buffers. KPsolid:
solid-state drug molecules; KP: dissolved and unionized free drug; KP-: free ionized
drug; [KP]micelle: unionized drug micelles; and [KP-]micelle: ionized drug micelles.
89

0.1
1
10
100
4.04.5
5.05.5
6.06.5
7.0
0.000.01
0.020.03
0.040.05
0.06
Cto
tal(m
g/m
L)
pH
SLS Concentration (M)
Figure 3.2. Total solubility as function of pH and SLS.
90

0
5
10
15
20
25
30
35
40
45
50
0 1 2 3 4 5 6
Rotational Speed1/2 (rad/sec)
Flux
X 1
04(m
g/cm
2 /sec
)
0%SLS
0.5%SLS
1%SLS
2%SLS
Figure 3.3. Intrinsic dissolution curves of ketoprofen at various SLS concentrations pH
4.0 buffers.
91

0.0001
0.001
0.01
0.1
4.0
4.5
5.0
5.5
6.06.57.0
0.000.01
0.020.03
0.040.05
J total
(J/
1/2 ,m
g/cm
2 /s1/2 /ra
d1/2 )
pH
SLS concentration (M)
Figure 3.4. The intrinsic dissolution rate as function of pH and SLS.
92

References.
1. Amidon GL, Lennernas H, Shah VP, Crison JR. 1995. A theoretical basis for a biopharmaceutic drug classification - the correlation of in-vitro drug product dissolution and in-vivo bioavailability. Pharmaceutical Research 12:413-420. 2. Tarling MM, Toner CC, Withington PS, Baxter MK, Whelpton R, Goldhill DR. 1997. A model of gastric emptying using paracetamol absorption in intensive care patients. Intensive Care Med 23:256-260. 3. Macdonald IA. 1996. Physiological regulation of gastric emptying and glucose absorption. Diabet Med 13:S11-15. 4. Li LY, Stewart BH, Fleisher D. 2000. Oral delivery of hiv-protease inhibitors. Crit Rev Ther Drug Carrier Syst 17:73-99. 5. Olander DR. 1960. Simultaneous mass transfer and equilibrium chemicalreaction. Aiche Journal 6:233-239. 6. Mooney KG, Mintun MA, Himmelstein KJ, Stella VJ. 1981. Dissolution kinetics of carboxylic acids i: Effect of ph under unbuffered conditions. J Pharm Sci 70:13-22. 7. Mooney KG, Mintun MA, Himmelstein KJ, Stella VJ. 1981. Dissolution kinetics of carboxylic acids ii: Effect of buffers. J Pharm Sci 70:22-32. 8. Rippie EG, Lamb DJ, Romig PW. 1964. Solubilization of weakly acidic and basic drugs by aqueous solutions of polysorbate 80. J Pharm Sci 53:1346-1348. 9. Elworthy P, Lipscomb F. 1968. Effect of some nonionic surfactants and a polyoxyethylene glycol on the dissolution rate of griseofulvin. Journal of Pharmacy and Pharmacology 20:923-933. 10. Carlson JA, Mann HJ, Canafax DM. 1983. Effect of ph on disintegration and dissolution of ketoconazole tablets. Am J Hosp Pharm 40:1334-1336. 11. Sakr A, Aboutaleb A, Kassem A, Khidr S. 1980. Study on the dissolution and bioavailability of directly compressed salicylamide tablets. Pharmazeutische Industrie42:412-415.12. Schott H, Kwan LC, Feldman S. 1982. The role of surfactants in the release of very slightly soluble drugs from tablets. J Pharm Sci 71:1038-1045. 13. Samaligy M, Szantmiklosi P. 1978. Effect of surfactants on the release of a hydrophobic liquid drug from its tablet form. Pharmazeutische Industrie 40:274-277. 14. McNamara DP, Amidon GL. 1986. Dissolution of acidic and basic compoundsfrom the rotating disk: Influence of convective diffusion and reaction. J Pharm Sci75:858-868.15. Nelson KG, Shah AC. 1987. Mass transport in dissolution kinetics. I: Convective diffusion to assess the role of fluid viscosity under forced flow conditions. J Pharm Sci76:799-802.16. Shah AC, Nelson KG. 1987. Mass transport in dissolution kinetics. Ii: Convective diffusion to assess role of viscosity under conditions of gravitational flow. J Pharm Sci76:910-913.17. Holte O, Onsoyen E, Myrvold R, Karlsen J. 2003. Sustained release of water-soluble drug from directly compressed alginate tablets. Eur J Pharm Sci 20:403-407. 18. Mu X, Tobyn MJ, Staniforth JN. 2003. Development and evaluation of bio-dissolution systems capable of detecting the food effect on a polysaccharide-based matrixsystem. J Control Release 93:309-318.
93

19. Rodriguez-Hornedo N, Murphy D. 2004. Surfactant-facilitated crystallization ofdihydrate carbamazepine during dissolution of anhydrous polymorph. J Pharm Sci93:449-460.20. Abdoh AA, Zughul MB, Badwan AA. 2002. Solubilization of terfenadine, riboflavin, and sudan iii by aqueous multi-basic organic acids. Journal of Dispersion Science and Technology 23:759-768. 21. Jinno J, Oh D, Crison JR, Amidon GL. 2000. Dissolution of ionizable water-insoluble drugs: The combined effect of ph and surfactant. J Pharm Sci 89:268-274. 22. Amidon GE, Higuchi WI, Ho NF. 1982. Theoretical and experimental studies of transport of micelle-solubilized solutes. J Pharm Sci 71:77-84. 23. Mukerjee P, Mysels KJ. Critical micelle concentrations of aqueous surfactant systems. ed.: U.S. Dept. of Commerce: NSRDSNBS. p 51. 24. Yalkowsky SH. 1999. Solubility and solubilization in aqueous media. ed.: OxfordUniversity Press: Cambridge. p 119, 261. 25. Cussler EL. 1997. Diffusion: Mass transfer in fluid systems. ed., New York: Cambridge University Press. p 65-67. 26. Dyer DL. 1959. The effect of ph on the solubilization of weak acids and bases. Journal of Colloid Science 14:640-645. 27. Collett JH, Koo L. 1975. Interaction of substituted benzoic acids with polysorbate 20 micelles. J Pharm Sci 64:1253-1255. 28. He Y, Yalkowsky SH. 2003. Handbook of aqueous solubility data. ed.: CRC press. p 1036. 29. Beetge E, du Plessis J, Muller DG, Goosen C, van Rensburg FJ. 2000. The influence of the physicochemical characteristics and pharmacokinetic properties of selected nsaid's on their transdermal absorption. Int J Pharm 193:261-264. 30. Crison JR, Shah VP, Skelly JP, Amidon GL. 1996. Drug dissolution into micellarsolutions: Development of a convective diffusion model and comparison to the filmequilibrium model with application to surfactant-facilitated dissolution of carbamazepine.J Pharm Sci 85:1005-1011. 31. Yang X, Matthews MA. 2000. Diffusion coefficients of three organic solutes in aqueous sodium dodecyl sulfate solutions. J Colloid Interface Sci 229:53-61. 32. FDA. 2000. Guidance for industry, waiver of in vivo bioavailability and bioequivalence studies for immediate release solid oral dosage forms based on a biopharmaceutics classification system. ed.: CDER/FDA. 33. Dressman JB, Amidon GL, Reppas C, Shah VP. 1998. Dissolution testing as a prognostic tool for oral drug absorption: Immediate release dosage forms. Pharm Res15:11-22.34. Charman WN, Porter CJ, Mithani S, Dressman JB. 1997. Physiochemical and physiological mechanisms for the effects of food on drug absorption: The role of lipids and ph. J Pharm Sci 86:269-282. 35. Horter D, Dressman JB. 2001. Influence of physicochemical properties on dissolution of drugs in the gastrointestinal tract. Adv Drug Deliv Rev 46:75-87. 36. Yazdanian M, Briggs K, Jankovsky C, Hawi A. 2004. The "high solubility" definition of the current fda guidance on biopharmaceutical classification system may be too strict for acidic drugs. Pharm Res 21:293-299. 37. TenHoor CN, Bakatselou V, Dressman J. 1991. Solubility of mefenamic acid under simulated fed- and fasted-state conditions. Pharm Res 8:1203-1205.
94

95
96
CHAPTER IV
A COMPARISON OF PHOSPHATE AND BICARBONATE BUFFERS:RELEVANCE TO IN VIVO DISSOLUTION
Abstract
To evaluate the difference between the pharmaceutical phospha te buffers and the
gastrointestinal bicarbonates in dissolution of ketoprofen and indomethacin, to illustrate
the dependence of buffer differential on biopharmaceutical properties of BCS II weak
acids, and to recommend phosphate buffers equivalent to bicarbonates. The intrinsic
dissolution rates of, ketoprofen and indomethacin, were experimentally measured using
rotating disk method at 37°C in USP SIF/FaSSIF and various concentrations of
bicarbonates, and also theoretically forecasted using a reaction plane model that was
improved in this work. Experimental results shows that the intrinsic dissolution rates of
ketoprofen and indomethacin, in USP and FaSSIF phosphate buffers are 1.5-3.0 folds of
that in the 15 mM bicarbonates, which is in good agreement with the theoretical analysis.
Theoretical analysis demonstrates that the buffer differential is largely dependant on the
drug pKa and solubility, and weakly dependant on the drug diffusivity. Further, in
accordance with the drug pK, solubility and diffusivity, simple phosphate surrogate was
proposed to match an average bicarbonate value (15 mM) at the upper gastrointestinal
region. Specifically, surrogate phosphate buffer of 13-15 mM and 3-4 mM were
recommended for ketoprofen and indomethacin, respectively, whose dissolution
demonstrated high satisfaction with respective 85% and 104% equivalence in the 15 mM
97
bicarbonate buffer. This work highlights the substantial difference between
pharmaceutical phosphates and physiological bicarbonates in determining the drug
intrinsic dissolution rates of BCS II weak acids, such as ketoprofen and indomethacin.
Based on both theoretical analysis and experimental confirmation, surrogate phosphates
were recommended in order to closely reflect the in vivo dissolution of ketoprofen and
indomethacin in gastrointestinal bicarbonates.
Introduction
Drug dissolution is the prerequisite to drug absorption and the subsequent clinical
response for almost all drugs administered orally. For Biopharmaceutics Classification
System (BCS) Class II drugs with high permeability and low solubility, the ir drug
absorption is rate limited by in vivo drug dissolution. Thus, a correlation between an in
vitro dissolution and in vivo performance is expected if the in vitro dissolution rate is
similar to the in vivo dissolution rate 1. To achieve this objective, the in vitro dissolution
testing should be reflective of the in vivo situation. However, various components of the
GI tract, such as transit time, hydrodynamics and fluid contents, present a complex nature
of in vivo gastrointestinal fluids in upper small intestine 2-7. Particularly, the dissolution
media whose contents should mimic GI fluids, including pH, buffer species and
concentration, bile salts, electrolytes, enzymes and a wide range of lipids, are important.
In the past, developing biorelevant in vitro dissolution medium has attracted numerous
interests 4,8-12, resulting in several widely used in vitro dissolution media. For example,
the most dominant media include the USP simulated intestinal fluids (SIFs) 13 and fasted-
state simulated small intestine fluids (FaSSIF) 4,8,14, as shown in Table 4.1. However,
98
their focus has been on simulating the gastrointestinal (GI) pH and bile salts. Further, the
buffer species in these two media is phosphate. One seemingly very obvious choice,
however, the GI buffer species, namely the bicarbonates, has been overlooked.
The principle physiological buffer along the human GI tract is not phosphate, rather
the bicarbonate. Gastroduodenal bicarbonate has long been known as the main buffer
system maintaining a pH gradient along the gastrointestinal lumen 15. Bicarbonate is a
ubiquitous component in human secreted fluids and is actively secreted by the pancreas
to neutralize gastric secretion in the GI lumen. It has also been shown that epithelial cells
of the duodenum secrete bicarbonate, which is an important mechanism to protect the
duodenal epithelium against acid discharged from stomach 16-21. Bicarbonate
concentrations in human GI fluids have been reported to be within a dynamic range,
depending on the fasted and fed states as well as local regions along the GI tract 17,19,22,23.
For example, as early as in 1935, the bicarbonate concentration was measured directly
from the fasted human duodenum using titration method, and the values were reported in
the range of 4-21 mM 24,25, with an average of 15 mM 23. In 2001, Repishti et al.
measured the pH and 2COP in human duodenum, and used the Henderson-Hasselbalch
equation to calculate that the bicarbonate HCO3- in fasted-state duodenum has a mean
value of 6.7 ± 0.34 mM at pH 7.22 26. Person et al. 5 showed that the mean value of the
buffer capacity of human jejunum at fasted state is 2.4-2.8 mmolL-1pH-1, which
corresponds to 18.1 mM of bicarbonate concentration at pH 7.5 assuming that the buffer
capacity is solely attributed by the buffer species. Recently, Kalantizi et al.6 reported the
range of buffer capacity for distal duodenum of fasted human, which is equivalent to 4.35
– 21.6 mM of HCO3- at pH 6.2.

99
Bicarbonate is the prevailing buffer in human gastrointestinal GI tract, however, it has
rarely been used 27 mainly due to the inconvenience of maintaining a constant pH and
HCO3- concentration in the dissolution medium through continuous CO2 gas purging.
Almost all pharmaceutical dissolution studies rather use phosphate or acetate buffers,
subsequently creating a disconnection with the buffer species between the in vitro and the
physiological GI in vivo situation. This disconnect should be closely evaluated, because,
not only buffer concentration but also buffer species can significantly impact dissolution
rates of ionizable drugs, even if the pH of buffers is held constant 28-30. It was shown that
the intrinsic dissolution rates of naproxen increase with the escalation of buffer
concentration, which was demonstrated consistently in three buffers including phosphate,
citrate and acetate 30. More interestingly, the work also showed that naproxen
demonstrated a decreased dissolution rate in the following buffer species: phosphate >
citrate > acetate, despite all the buffers were maintained at the same buffer concentration
and same pH value 30. Therefore, it is important to compare the bicarbonate buffer with
the commonly used USP SIF/FaSSIF phosphate buffers, in the perspective of
investigating their impact on dissolution rates of BCS II acidic drugs. This work is to
focus on investigating the impact of GI buffer species and concentration on the
dissolution of poorly soluble and ionizable acidic drugs.
Using model BCS II weak acids, such as ketoprofen and indomethacin, we not only
demonstrated the dissolution difference between phosphates and bicarbonates
experimentally, but also provided a mechanistic understanding of the buffer differential
theoretically. In doing so, we illustrated the dependence of buffer differential on

100
biopharmaceutical properties of drugs, thus ultimately recommending simple phosphate
buffer surrogate to be equivalent to in vivo bicarbonates.
Theoretical Section
Reaction plane model
The reaction plane model was initially developed for describing chemical reactions
on a rotating disk 31, and it was extended to the pharmaceutical situations by Amidon et
al. 30,32. In the current paper, the reaction plane model was further improved to better
predict the drug flux.
The general equation describing one-dimensional mass transport in a fluid 33 is
composed of the diffusive, convective, and reactive contributions and is shown as the
following:
2 2/ / /i i i Z i i
c t D d c dz dc dz Rυ∂ ∂ = − + (1)
where iD , i
c and iR are the diffusion coefficient, the molar concentration, and the rate
of reaction per volume of species i ( 3/mol cm s⋅ ), ν is the fluid velocity ( 2 /cm s ), and
t is the time (s). The overall mass transport includes the acid-base reactions and
convective diffusion, which is fast and slow process, respectively. The continuity Eq 1
can then be simplified by recognizing that slow processes control the overall mass
transport.
Assuming instantaneous reactions at the solid- liquid surface, mass transport in a
rotating disk system at steady state is simplified as:
2 2/ / / 0i i i Z ic t D d c dz dc dzυ∂ ∂ = − = (2)
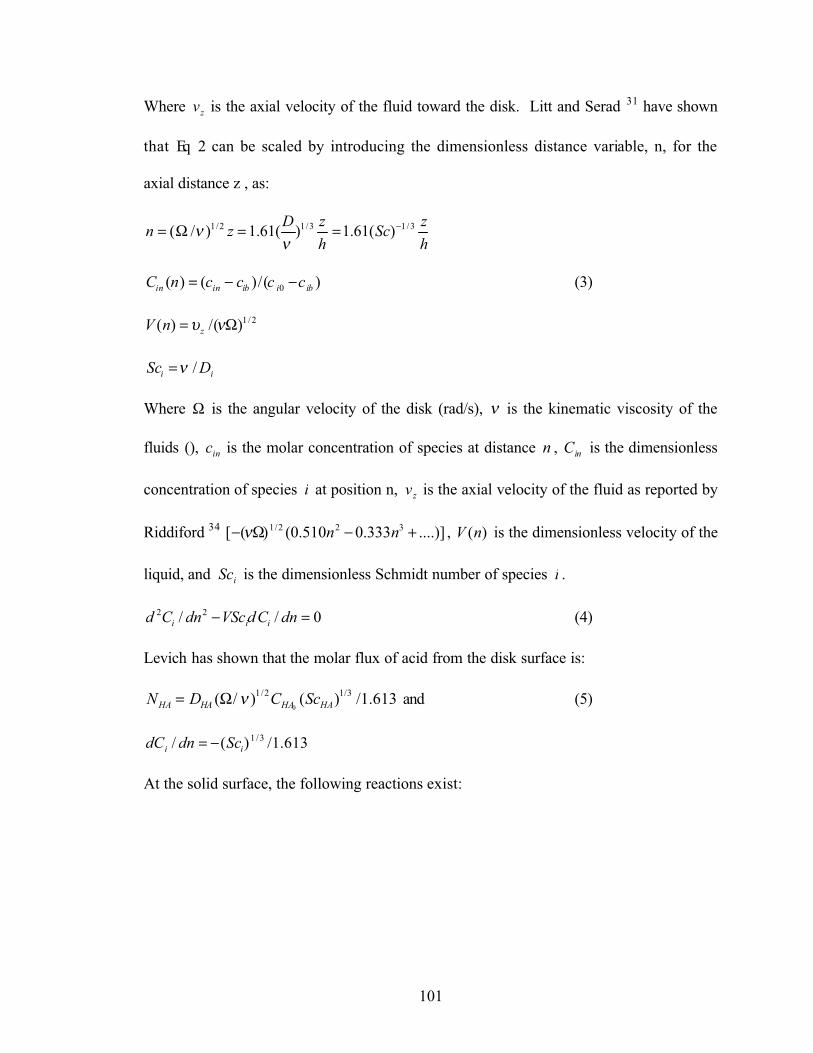
101
Where zv is the axial velocity of the fluid toward the disk. Litt and Serad 31 have shown
that Eq 2 can be scaled by introducing the dimensionless distance variable, n, for the
axial distance z , as:
1/2 1/3 1 /3( / ) 1.61( ) 1.61( )D z zn z Sch h
νν
−= Ω = =
0( ) ( )/( )in in ib i ibC n c c c c= − − (3)
1/2( ) /( )zV n υ ν= Ω
/i iSc Dν=
Where Ω is the angular velocity of the disk (rad/s), ν is the kinematic viscosity of the
fluids (), inc is the molar concentration of species at distance n , inC is the dimensionless
concentration of species i at position n, zv is the axial velocity of the fluid as reported by
Riddiford 34 1/2 2 3[ ( ) (0.510 0.333 ....)]n nν− Ω − + , ( )V n is the dimensionless velocity of the
liquid, and iSc is the dimensionless Schmidt number of species i .
2 2/ / 0i i id C dn VSc d C dn− = (4)
Levich has shown that the molar flux of acid from the disk surface is:
0
1/2 1/3( / ) ( ) /1.613HA HA HA HAN D C Scν= Ω and (5)
1/3/ ( ) /1.613i idC dn Sc= −
At the solid surface, the following reactions exist:

102
2
2
2
H O H OHHA H A
HB H BHA B HB A
HA OH H O A
HB OH H O B
+ −
+ −
+ −
− −
− −
− −
+++
+ +
+ ++ +
(6)
After identifying various chemical reactions at the reaction plane, a set of mass balance
equations accounting for all reacting species were established. When the flux of one
species changes due to a chemical reaction at the reaction plane, it must be reflected by
the flux of the corresponding reactants or products as defined in the aforementioned
reactions (Eq 6). Therefore at steady state, the following flux condition must hold at the
solid- liquid interface:
HA HBH OH A BN N N N N N+ − − −+ + = + + (7)
where +HN , HAN , HBN , −OHN , −AN and −BN individually denote the molar flux of ,H +
,HA ,HB ,OH − A− and B− . It should be noticed that the flux of species of A− and B−
have different signs because they are supplied from opposite directions, i.e., from the
solid surface or from the medium bulk to the reaction plane, respectively. Thus, the
electrical neutrality is maintained in Eq 7.
Combined with equations 5 and 7, boundary cond itions at the surface (n = 0):
11
11
HA
A
H
HB
CC
CC
−
+
==
==
and boundary conditions in the bulk solution (n = ∞):
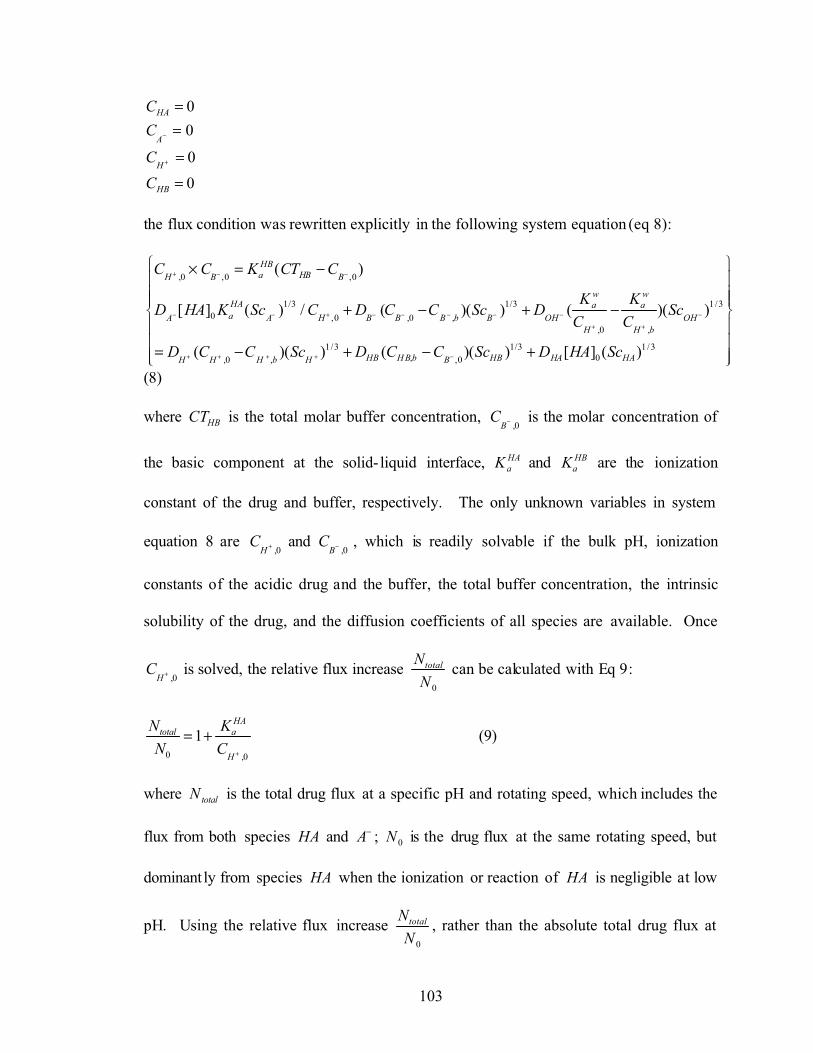
103
00
00
HA
A
H
HB
CC
CC
−
+
==
==
the flux condition was rewritten explicitly in the following system equation (eq 8):
,0 ,0 ,0
1/3 1/3 1/30 ,0 ,0 ,
,0 ,
1/3 1/3 1/3, 0,0 , ,0
( )
[ ] ( ) / ( )( ) ( )( )
( )( ) ( )( ) [ ] ( )
HBa HBH B B
w wHA a aaA A H B B B b B OH OH
H H b
HB H B b HB HA HAH H H b H B
C C K CT C
K KD HA K Sc C D C C Sc D Sc
C C
D C C Sc D C C Sc D HA Sc
+ − −
− − + − − − − − −
+ +
+ + + + −
⎧ ⎫× = −⎪ ⎪⎪ ⎪⎪ ⎪+ − + −⎨ ⎬⎪⎪= − + − +⎪⎩ ⎭
⎪⎪⎪
(8)
where HBCT is the total molar buffer concentration, ,0B
C − is the molar concentration of
the basic component at the solid- liquid interface, HA
aK and HBaK are the ionization
constant of the drug and buffer, respectively. The only unknown variables in system
equation 8 are ,0H
C + and ,0B
C − , which is readily solvable if the bulk pH, ionization
constants of the acidic drug and the buffer, the total buffer concentration, the intrinsic
solubility of the drug, and the diffusion coefficients of all species are available. Once
,0HC + is solved, the relative flux increase
0
totalN
Ncan be calculated with Eq 9:
0 ,0
1HA
total a
H
N KN C +
= + (9)
where totalN is the total drug flux at a specific pH and rotating speed, which includes the
flux from both species HA and A− ; 0N is the drug flux at the same rotating speed, but
dominant ly from species HA when the ionization or reaction of HA is negligible at low
pH. Using the relative flux increase0
totalN
N, rather than the absolute total drug flux at
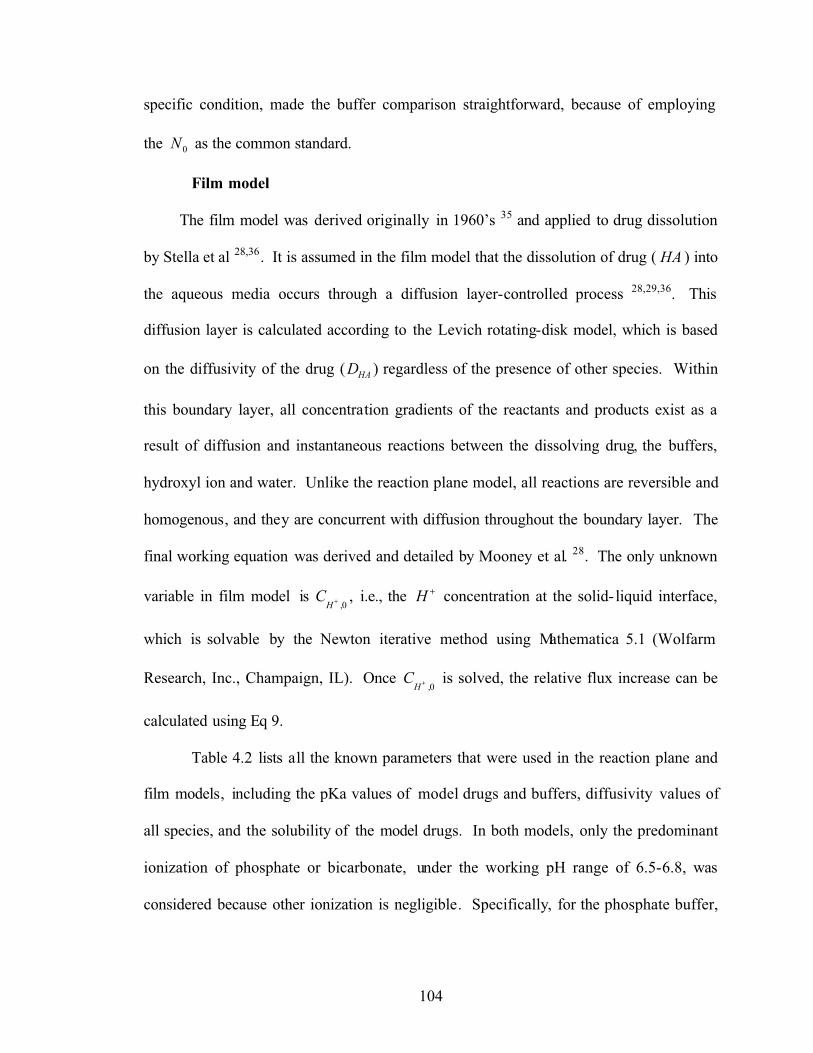
104
specific condition, made the buffer comparison straightforward, because of employing
the 0N as the common standard.
Film model
The film model was derived originally in 1960’s 35 and applied to drug dissolution
by Stella et al 28,36. It is assumed in the film model that the dissolution of drug ( HA ) into
the aqueous media occurs through a diffusion layer-controlled process 28,29,36. This
diffusion layer is calculated according to the Levich rotating-disk model, which is based
on the diffusivity of the drug ( HAD ) regardless of the presence of other species. Within
this boundary layer, all concentration gradients of the reactants and products exist as a
result of diffusion and instantaneous reactions between the dissolving drug, the buffers,
hydroxyl ion and water. Unlike the reaction plane model, all reactions are reversible and
homogenous, and they are concurrent with diffusion throughout the boundary layer. The
final working equation was derived and detailed by Mooney et al. 28. The only unknown
variable in film model is,0H
C + , i.e., the H + concentration at the solid- liquid interface,
which is solvable by the Newton iterative method using Mathematica 5.1 (Wolfarm
Research, Inc., Champaign, IL). Once,0H
C + is solved, the relative flux increase can be
calculated using Eq 9.
Table 4.2 lists all the known parameters that were used in the reaction plane and
film models, including the pKa values of model drugs and buffers, diffusivity values of
all species, and the solubility of the model drugs. In both models, only the predominant
ionization of phosphate or bicarbonate, under the working pH range of 6.5-6.8, was
considered because other ionization is negligible. Specifically, for the phosphate buffer,

105
only the ,2apK of H2PO4- was utilized; and for the bicarbonate, the ,1apK of H2CO3 was
considered.
Experimental Section
Materials and Dissolution Media Preparation
Ketoprofen, indomethacin (> 99% purity), carbonic anhydrase, and all other
chemicals were of analytical grade and were purchased from Sigma (St. Louis, MO).
Distilled, deionized and filtered water was prepared in house and used for all
experiments. Dried and compressed 100% CO2 was purchased from LifeGas (Ann
Arbor, MI). All 3-D plots were generated using Sigmaplot 10.0 (SPSS Inc., Chicago,
IL).
The USP SIF pH 6.8, 50 mM phosphate buffer without pancreatin 13 and fasted-
state simulated intestinal fluid (FaSSIF, 29 mM pH 6.5 phosphate buffer) without bile
salts 4 were prepared following standard procedures. Sodium phosphate was used instead
of potassium phosphate because the principle cationic species in fasted small intestine is
sodium 2,37,38. Previous study conducted by Reppas et al. 4 has demonstrated that
substituting sodium for potassium in standard USP and International Pharmacopeia buffer
systems has no practical effects on the dissolution process of weak acids. The 15 mM
bicarbonate buffer was established by initially preparing a 15 mM of sodium carbonate
solution, and then the solution was continuously purged with CO2 (g) until pH was
reduced to 6.8 or 6.5. To ensure the bicarbonate buffer was equilibrating, both the pH
and the total 2 3 3/H CO HCO − (aq) content in the bicarbonate buffer was monitored. The
pH was continuously monitored with a standard pH meter and electrode (PHI™40,

106
Beckman Coulter, Inc., Fullerton, CA), and the 2 3 3/H CO HCO − (aq) content was checked
periodically using methods described previously 39-41 with a standard CO2 assay kit
purchased from Sigma. After the CO2 (aq) and the pH of the bicarbonate buffer reach an
equilibrium, which takes 30-40 minutes at 37°C, only pH is followed through the
intrinsic dissolution testing. To maintain a steady CO2 (aq) concentration and pH in the
bicarbonate buffer at 37°C, a continuous CO2 (g) purge with a flow rate ~50 mL/min was
generally required. Prior to dissolution testing, all buffers were adjusted to be isotonic to
normal saline with NaCl.
Intrinsic Dissolution Measurement
The intrinsic dissolution rates of ketoprofen and indomethacin in various buffers
were measured using a rotating disk system. Ketoprofen and indomethacin powder of
150 mg was compressed under 2000 LBs and 5000 LBs, respectively, for 60 seconds to
form a circular compact with a radius of 0.45 cm using a hydraulic laboratory press (Fred
Carver, Inc., Summit, NJ). The die containing the compact was mounted onto a
Plexiglass shaft attached to an overhead synchronous motor (Cole-Parmer Scientific,
Niles, IL). The die was rotated at 100 rpm, which was calibrated with a digital
tachometer (Cole-Parmer Scientific, Niles, IL). The single face of the compact was
exposed to 150 mL of the dissolution media in a jacketed beaker maintained at 37 ± 1°C
through the circulating water heated with a water bath circulator (Isotemp Constant
Temperature Circulator Model 8000, Fisher Scientific, Pittsburgh, PA). At pre-
determined time points, 1.0 mL of dissolution sample was withdrawn and same amount
of blank dissolution medium was refilled. The ketoprofen and indomethacin
concentration in the dissolution media samples were measured using UV absorption at

107
258 nm and 265 nm, respectively, using a UV spectrophotometer (Beckman Coulter DU
650, Fullerton, CA). To ensure sink conditions, the concentrations of ketoprofen or
indomethacin in the dissolution media were maintained less than 10% of their solubility
for the entire experiment. Dissolution flux (mass/time/area) of ketoprofen and
indomethacin were calculated as the multiplication of the slope of the concentration vs.
time plot, volume of dissolution medium (150 mL), and area of the exposed disk
(0.63585 cm2). Individual dissolution experiments typically were carried out from 10
minutes for ketoprofen and up to several hours for indomethacin.
For comparative purposes, dissolution flux of ketoprofen and indomethacin in the
following isotonic media were determined: pH 6.8 USP SIF 50 mM phosphate buffer
without pancreatin, pH 6.5 FaSSIF containing 29 mM phosphate buffer without sodium
taurocholate or lecithin, and pH 6.5 various concentrations of bicarbonate buffers that
covers a normal range of bicarbonate concentrations along the fasted human duodenum.
Buffers without any enzymes or bile salts were used to distinctively reveal the effects of
buffer species. The final pH values of the dissolution media using phosphates were
checked at the end of the dissolution experiments to assure that a constant pH has
maintained throughout the dissolution testing.
Results
Dissolution of Ketoprofen and Indomethacin in Phosphate and Bicarbonate
Buffers
The aim was to evaluate the dissolution difference of ketoprofen and indomethacin
in bicarbonates and in the commonly used phosphate buffers. Table 4.3 lists the intrinsic

108
dissolution rates of ketoprofen in two phosphates (USP and FaSSIF), and three
bicarbonate buffers with concentrations of 5, 15 and 20 mM, and Table 4.4 lists the flux
ratio of indomethacin in phosphates versus in bicarbonates with concentrations of ranging
6.4 – 25.8 mM. As expected, the higher concentration of bicarbonate, the faster drug flux
of indomethacin or ketoprofen to exhibit in the dissolution media. This is because a
greater driving force for the reaction between the weakly acidic drug and species 3HCO− ,
as shown in Eq 10, exists with the presence of higher bicarbonate concentration.
3 2 3( )HA HCO A H CO aq− −+ + (10)
More importantly, the intrinsic dissolution rates in the USP SIF buffer and in the FaSSIF
are higher than in all bicarbonate buffers. For example, the respective dissolution rate of
ketoprofen in the USP SIF and FaSSIF is at least 200% and 50% faster than that in the 15
mM bicarbonate, an average value in fasted duodenum. Again, the intrinsic dissolution
rate of indomethacin in phosphate buffer is higher, showing about 30 - 150% of flux
increase compared with that in various concentrations of bicarbonate buffers.
In Tables 4.3 and 4.4, the main differences between the phosphates and
bicarbonates exhibit in pH (6.8 versus 6.5), buffer concentration and buffer species,
which all could contribute to the observed dissolution rate difference. To distinctively
reveal the effects of buffer species, intrinsic dissolution rates of ketoprofen were
measured in phosphate and bicarbonate with the same pH, i.e., 6.8, and the same buffer
concentration, i.e., 50 mM. The results in Table 4.5 showed the ketoprofen flux in this
phosphate was still 2-fold of that in the bicarbonate. This experimental result supports
the hypothesis that even if at the same pH and the same buffer concentration, in
dissolution of ketoprofen, phosphate and bicarbonates are inherently distinctive from

109
each other. The distinction lie in the natural differences between phosphate and
bicarbonate, namely, the pKa and the diffusion coefficient.
First of all, the pKa plays an important role in the driving force for the reaction
between the acidic drug and the basic buffer species. At the solid- liquid interface, the
essential chemical reaction driving the drug dissolution is the following:
,f
r
HAkf a
HBk r a
k KHA B HB A Kk K
− −+ + = = (11)
Eq 11 clearly indicates that a basic buffer with a higher pKa value translates into a
smaller HBaK , which yields a larger equilibrium constant K for the reaction. Consistent
with the experimental results, at 37°C phosphate buffer with an effective pKa of 6.533
provides greater driving force for the acidic drug–buffer reaction than that of bicarbonate
with a pKa of 6.31 (shown in Table 4.2), thus leading to faster dissolution rate for
ketoprofen and indomethacin.
Secondly, the pKa difference in these two buffer species also results in different
buffer capacity at the solid-liquid interface. For a system the same pH and the same
buffer concentration, phosphate buffer has about 23% higher buffer capacity relative to
the bicarbonate, according to Eq 12.
2
[ ]2.303
( [ ])
HBa
HBa
K HCK H
β+
+=+
(12)
where β is the buffer capacity. In general, the ,0H
C + concentration at the solid- liquid
interface is lower than that in the bulk due to the ionization of acidic drug molecule.
Within the boundary layer or at the solid- liquid interface, the buffer capacity is controlled
not only by the extent of acidic drug disassociation but also the buffer capacity. The

110
higher buffer capacity of phosphate maintains the pH at the solid- liquid interface lower
than, but closer, to the basic environment of the bulk, in relative to the bicarbonate
system. Thus, a greater extent ionization of acidic drugs and the subsequent increase of
drug dissolution in the phosphates are present.
Thirdly, the diffusion coefficient of buffer species may also have an indirect impact
on drug dissolution rates through diffusional layer thickness. The Levich equation 42
indicates that the diffusional layer thickness 1/3 1/6 1 /21.612h D υ ϖ −= is accounted for one
species, generally the drug molecule. In reality, there are a number of species involved in
drug dissolution using the rotating disk. Therefore, it may be logical to consider the
boundary layer thickness is an average value composed of all of the species involved in
the dissolution. Thus, the species include not only the drug molecules but also the
conjugate buffers HB and B− , and OH − and H + . It is apparent that a smaller diffusion
coefficient D would produce a thinner boundary layer thickness, which implies less
resistant during mass transport. Specifically, the diffusivity for 2
2 4 4/H PO HPO− − is
11.5×10⁻⁶cm2/s, which implies a thinner diffusional layer thickness and a subsequent
faster drug flux, in relative to 2 3H CO and 3HCO− with respective diffusivity values of
12.3×10⁻⁶cm2/s and 19.5×10⁻⁶ cm2/s.
The relative drug flux increase of ketoprofen and indomethacin was forecasted
using the reaction plane and film models, which was summarized in Tables 4.3 and 4.4.
For ketoprofen, the reaction plane model excellently predicts its dissolution flux increase
in phosphate buffer. For example, the reaction plane model predicts the relative drug flux
increase in USP SIF buffer is 35-fold, which is very close to the experimental result of
35.8-fold. However, the reaction plane model appears to overestimate the ketoprofen

111
flux increase in the bicarbonate buffer, i.e., the model calculates a 16.5-fold, despite of an
experimental value of 10.5-fold. In the case of indomethacin, both the reaction plane
model and film model appear to underestimate the flux ratio of indomethacin in
phosphates versus in bicarbonates (Table 4.4). Nevertheless, it should be recognized that
even though neither of the models predicts the experimental results exactly, they both
reasonably/quantitatively demonstrates the trend of drug flux increase depending on
buffer concentration and species. The trend is that the dissolution rate of ketorpofen and
indomethacin is up to 2- fold higher, in the studied phosphates, than that in the
bicarbonates. Thus, both models are suitable for assessment of phosphate and
bicarbonate buffer effects, at least semi-quantitatively.
Dependence of Buffer Differential on Biopharmaceutical Properties of Drugs
Experimentally, this work has showed that ketoprofen and indomethacin
demonstrated up to 200% dissolution rate increase in USP SIF and FaSSIF phosphate
than in the 15 mM bicarbonate buffer. Theoretically, the buffer differential can be
forecasted reasonably well using reaction plane model and film model. The question is:
for a given new drug entity, what is the magnitude of the buffer differential? To answer
this question, three key parameters including drug pKa, solubility and diffusion
coefficient, which are used in the theoretical analysis, are investigated to determine their
importance on the buffer species effects.
The buffer differential effects were indicated by the drug flux ratio in the USP SIF
to that in the 15 mM bicarbonate. Theoretical analysis indicated that drug pKa has a
profound impact on buffer differential, as shown in Figure 4.1. For weak acids with pKa
values of 7 or higher, the drug flux ratios in these two tested buffers were close to 1. This

112
result is reasonable because the ionization difference of these drugs in pH 6.8 USP SIF
and pH 6.5 bicarbonate is limited. The observed drug flux is essentially contributed from
the unionized form and thus determined by the intrinsic solubility of the unionized form,
which should not differ appreciably in various buffers. In comparison, for weakly acidic
drugs with pKa values of 6.5 or less, their intrinsic dissolution rates is about 50-200%
higher in the USP SIF than that in the 15 mM bicarbonate buffer (Figure 4.1). Thus, the
magnitude of buffer differential depends strongly on drug pKa whose value is in the
regions of < 6.5, and very weakly in regions of drug pKa > 7.0. It should be noticed that
this theoretical calculation underestimates the flux ratio in these two tested buffers. For
example, the film model and reaction model predicted that the flux ratio of ketoprofen in
these two buffers was 1.77 and 2.12, respectively, which was lower than the experimental
ratio of 3.33. A similar result was seen with indomethacin, as shown in Table 4.4, i.e.,
the flux ratio forecasted theoretically was less than the experimental value.
It is also evident from Figure 4.1 that the buffer differential is more sensitive to the
changes of drug pKa but less to the drug solubility. This high dependence of drug flux
ratio on drug pKa is hypothesized by the following. It is the drug pKa, rather than the
drug solubility, predominantly controls the extent of ionization of drug molecules at the
solid- liquid interface. As a result, mainly depending on drug pKa, the amount of ionized
drug species varies, as reacting with buffer components and thus demonstrating the buffer
differential.
In addition to drug pKa, drug solubility also plays an important role in considering
buffer effects in drug dissolution due to its self-buffering capability. Therefore, based on
Eq 9 0 ,0
1HA
total a
H
N KN C +
= + , acidic high-solubility drug increases the,0H
C + at the solid- liquid

113
interface, leading to an increase of absolute drug flux totalN but a decrease of the relative
drug flux 0
totalN
N. Further, the ratio of the relative drug flux in two buffers, i.e., the buffer
differential, is much weakly dependant on drug solubility, due to a similar magnitude
change of relative drug flux in two buffers. Tables 4.6-1 and 4.6-2 showed that the buffer
different ial vary insignificantly with drug solubility variation. In addition to drug pKa
and solubility, drug diffusivity has a negligible impact on the buffer differential, as
shown in Tables 4.7-1 and 4.7-2. In summary, the importance of drug properties on the
magnitude of buffer differential decreases in the following order: drug pKa > drug
solubility ˜ drug diffusivity.
Surrogate Buffer Equivalent to the Bicarbonate
As demonstrated evident ly in this work, ketoprofen and indomethacin show higher
intrinsic dissolution rates in the commonly accepted USP SIF and FaSSIF phosphate
buffer than in the physiological 15 mM bicarbonate buffer. Even though bicarbonate is
the prevailing human physiological buffer, it is rarely used as an in-vitro dissolution
media. The decision to not use bicarbonate is mainly due to its inconvenience because
maintaining a stable bicarbonate buffer system requires an equilibrium between PCO2 (g)
and the dissolution media at a given pH, which is generally achieved by continuous
purging CO2 (g) into the media to compensate the fast loss of CO2 to the atmosphere at
37ºC. Practical considerations lead to the alternative using a simple buffer such as
phosphate buffer, as a surrogate for the bicarbonate. The ideal surrogate buffer should
behave similarly to the physiological bicarbonates, exhibit almost the same dissolution
rates for the same drug, and preferably be easily prepared and maintained. In this work,
phosphate buffer surrogates for ketoprofen and indomethacin were initially forecasted

114
using both the reaction plane model and film model, and then were confirmed using
intrinsic dissolution measurement. For ketoprofen, the reaction plane model and film
model predicted that 12-14 mM phosphate buffer at pH 6.5 is equivalent to the 15 mM
bicarbonate, and experimentally 13.0 mM phosphate was selected, as shown in Table 4.8.
The intrinsic dissolution rate of ketoprofen in 13.0 mM phosphate buffer is 0.198
mg/cm2/min, which is 85% of 0.231 mg/cm2/min, the dissolution rate in the 15 mM
bicarbonate. Similarly, for indomethacin, theoretical analysis predicted that ~3-4 mM
phosphate buffer is suitable as the bicarbonate surrogate. Then, a 3.5 mM phosphate was
used, in which the indomethacin intrinsic dissolution rate was 26.0 µg/cm2/min. This
drug flux is equivalent to 108% of the intrinsic dissolution rate in the bicarbonate. Here,
theoretical analysis is useful to recommend a suitable phosphate concentration that is
replaceable for the bicarbonate. Further, the theoretical approach is supported by the
experimental results. It is also apparent in Table 4.8 that the surrogate phosphate buffer
is not one single universal medium for all drug molecules, but rather it should be
individualized according to the unique properties of drug molecules including pKa,
solubility and diffusivity.
Discussion
Significance of Investigating Bicarbonate Buffer
Our work showed that even with FaSSIF, a phosphate buffer with much lower
concentration of 29 mM at pH 6.5, the dissolution of ketoprofen and indomethacin still
demonstrated higher rate in the FaSSIF than in the bicarbonate. Thus, an in-vitro
dissolution testing in either USP SIF or FaSSIF is generally overestimating the true

115
dissolution rates of ketoprofen and indomethacin in vivo. This overestimation, suggested
by theoretical analysis, is extrapolated to other BCS II weak acids particularly for those
with pKa values less than 6.5. Therefore, although the pH value of USP SIF buffer and
FaSSIF may mimic small intestine fluids, the buffer composition and concentration also
have significant impacts on weakly acidic BCS II drugs. It is concluded here that not
only the pH, but also perhaps more importantly, the buffer species and concentrations
should be considered in composing the in-vitro dissolution media to closely reflect the in
vivo dissolution fluids.
To constitute an ideal in vitro dissolution medium, buffer species and concentration,
pH, bile salts and viscosity of the GI fluids should all be considered. This work was to
seek the significance of physiological buffer species and concentration, without inclusion
of any bile salts, in dissolution of BCS II acidic drugs. The rationale is the following.
Firstly, studying a buffer system without including any other variables such as bile salts
would distinctively reveal the buffer effects. Secondly, bile salts at fasting stage may not
be important, due to its low concentration rage of 3-5 mM, with an average value of 4.3
mM 8. A more recent study reported that the bile salt level in fasted human intestinal
fluids was 2 ± 0.2 mM 5. Thirdly, even though bile salts contribute significantly on
solubilization and dissolution of low-solubility drugs, their effects on ionizable drugs
become minimal if pH change is present. This is particularly true for drugs with pKa
values within the pH range of proximal small intestine. Here, the two model compounds
ketoprofen and indomethacin have pKa values of 4.76 and 4.18, respectively. If the pH
in proximal small intestine is around 6.5, their solubility would be increased
approximately 100-fold. In comparison, their solubility enhancement from a low

116
concentration of 2-5 mM bile salt would be negligible. Our previous studies have
demonstrated that buffer/pH effects appear to be more important than surfactant effects in
the case of BCS II acids such as piroxicam 11 and ketoprofen 43.
For neutral drugs such as fenofibrate, the difference between the USP SIF and
FaSSIF phosphate buffer, from bicarbonates, is significant because no ionization of drug
molecules would occur at the solid- liquid interface. The neutral drug would not react
with the ionic species from the bulk buffer, and the drug dissolution is essentially
controlled by the intrinsic solubility of the drug. Thus, buffer species or concentration
has no impact on the drug dissolution rate. For BCS II weakly basic drugs, the buffer
differential between the phosphate and bicarbonate should depend on the drug pKa. For
a weak base with pKa values close to or higher than the pH range in the small intestine,
its significant ionization is expected. As a result, the ionized form and the free base form
react with the buffer components, and the buffer differential effects will be observed. In
comparison, for weak bases with pKa lower than the pH range, and subsequently with
negligible disassociation, in upper small intestine, a difference between the phosphate
and bicarbonate is trivial. Dipyridamole is an example of such drug. Dipyridamole is a
weak base with pKa value of 6.05 - 6.10, with low solubility of 5.8 µg/mL at 25°C. At
pH 6.8, dipyridamole intrinsic flux is independent of the buffer species or concentration,
where USP SIF, FaSSIF and bicarbonate buffer were employed 27.
Marketed BCS II Weak Acids
Evidently, the magnitude of the buffer effects depends on the biopharmaceutical
properties of the drug molecule. Table 4.9 lists almost all BCS II weak acidic drugs
currently on the market in US and foreign countries. All of the listed drugs have pKa

117
values less than 5.5. As demonstrated in this work, significant buffer differetnial between
USP SIF and FaSSIF, and the bicarbonates, should be expected for any BCS II weak
acids with a pKa less than 5.5. Specifically, only considering the effect of buffer species,
the dissolution rates of these weak acids in the USP SIF and FaSSIF are very likely to be
overestimated 50-200% fold of the true values in vivo.
Table 4.9 listed that several BCS II weak acids are marketed as sodium, potassium
and calcium salts. In general, the salt forms would have a faster dissolution rate than the
corresponding acid in the upper small intestine. We hypothesized that the salt forms, if
they belong to BCS II class, should also demonstrate differential dissolution rates in USP
SIF and FaSSIF relative to the bicarbonate buffers. This is because at upper small
intestine the salt form of weak acids generally disassociate to a greater extent than the
weak acids, and then the ionized acidic component behave similarly to the weak acid
form. Even with very low-solubility salt form such as atorvastatin calcium, which is
insoluble in aqueous solution at pH equal or below 4.0, and is very slightly soluble in
distilled water at 37°C 44, the impacts of buffer differential may be similar to the case of
indomethacin. The extent of buffer differential, however, on the salt forms requires
further research.
Surrogates for Bicarbonate Buffer
It is evident that the bicarbonates are the best buffer system representing the in vivo
GI situation. Practical considerations, however, lead to the use of easily prepared buffer
systems, such as phosphate buffers to surrogate the bicarbonates. Further, the
concentrations of surrogate phosphate vary significantly depending on the drug pKa and
solubility. For drugs with high pKa values such as above pH 7.0, the drug dissolution
118
rate is only weakly influenced by buffer species and concentration. In this scenario, the
commonly used USP SIF or FaSSIF behaves similarly to the bicarbonates. In contrast,
BCS II weak acids with pKa values lower than 5.5, which prevails the current market,
would show a drug flux in USP SIF that is about 50-200% fold of that in the bicarbonates
(Figure 4.1). To minimize the discrepancy between USP SIF and bicarbonates, a lower
concentration of phosphate is required to match the drug flux in the bicarbonates at pH
6.5, as suggested experimentally as well as theoretically in our work. Furthermore, this
work showed that a low-solubility drug may require a lower phosphate buffer to mimic
the bicarbonates than a relative high-solubility drug with similar pKa. For example,
ketorpfen with an intrinsic solubility of 9.95×10⁻⁴ M requires 13-15 mM of phosphate to
mimic the bicarbonates, whereas 3-4 mM of phosphate appears to be sufficient for a
lower solubility drug such as indomethacin with solubility of 9.58×10⁻⁶ M. The effect of
drug solubility on the surrogate phosphate concentration may result from the self-
buffering effect of drug molecules at the solid- liquid interface. As the drug molecules
dissolve and then disassociate into the ionized acid-base pairs, which maintains the
microenvironmental pH within the boundary layer and functions as self-buffering species
in contact with the incoming bulk buffers. A weak acid with high solubility has a higher
concentration of the acid-base pair within the boundary layer, which leads to a higher
self-buffering capacity and less susceptibility to the changes of bulk buffer.
Dissolution for QC or Bioequivalence
Dissolution tests are used to achieve two major objectives during drug product
development: 1). to serve as quality control (QC) specification checking the
reproducibility of manufacturing processes and products; and 2). to forecast the in vivo

119
performance of drug products. The experimental test conditions for QC are designed to
detect manufacturing variables and stability changes on storage, whereas test conditions
for BE should discriminate adequately among products/batches with different in vivo
release behavior. For the QC testing of BCS II weak acids, the USP 13 suggests a wide
range of dissolution media. For example, the media used in the USP monograph for
indomethacin is 20% pH 7.2 phosphate and 80% water, for etodolac (pKa = 4.7) is pH
6.8 phosphate, and for sulindac (pKa = 4.5) is 0.1 M pH 7.2 phosphate. However, none
of these pharmacopeial monograph phosphate buffers is physiologically relevant. They
are primarily useful in checking reproducibility of products during manufacturing
procedures to meet regulatory requirements, and they poorly predict the in vivo
performance of a drug product. Therefore, an in vitro bioequivalence (BE) dissolution
testing methodology, with which physiologically relevant conditions in the GI tract can
be better reflected and the in vivo drug product dissolution can be better estimated, needs
to be developed.
In addition, as demonstrated experimentally and theoretically in this work, the
dissolution profiles for drugs with pKa < 5.5 are expected to show large differences in the
monograph phosphate buffer from the physiological bicarbonates. The gap between the
USP phosphate buffers and physiological bicarbonates may contribute largely to the
dissolution discrepancy between the in vitro testing and the in vivo situation.
Consequently, when in vivo dissolution is the rate limiting step to absorption of a BCS II
drug, an expected IVIVC may not be observed. Across the industry, a lack of success has
been seen in successfully developing an IVIVC for numerous BCS II immediate-release
oral dosage forms. Additionally, if a dissolution medium is designed in order to reach
120
maximum or even 100% of release within the duration of the test, it may satisfy the
dissolution specification of a product, but generally do not represent the in vivo condition
and therefore may not be suitable for BE dissolution purposes. In a typical QC
dissolution testing, more than 75-80% of the drug release has dissolved at the final
evaluation time point. In contrast, a BE or biorelevant dissolution test for BCS II drugs
should be aimed to reflect the extent of an in vivo dissolution.
Conclusions
In summary, this work has highlighted the importance of using physiological
buffers when determining the drug intrinsic dissolution rates, particularly for BCS II
weakly acidic drugs. Based on drug pKa, solubility and diffusivity, and buffer
characteristics, theoretical analysis has successfully forecasted the drug flux in various
phosphates and bicarbonates at least semi-quantitatively. Practical consideration leads to
the utilization of surrogate buffers such as phosphate to mimic physiological bicarbonates.
It is expected that the bicarbonate surrogate should better reflect the in vivo dissolution
fluid, thus further improving the in vitro dissolution with the in vivo performance, in
relative to FaSSIF or USP SIF.

121
Table 4.1. Commonly used pharmaceutical dissolution media/buffers for simulatingupper small intestine.
Dissolution media pH Buffer components
USP SIF 6.8 Phosphate: 50 mM
1% pancreatin
FaSSIF 6.5 Phosphate buffer: 29 mM
Sodium taurocholate: 3 mM
Lecithin: 0.75 mM
NaOH: adjust pH to 6.5
NaCl: adjust to isotonic
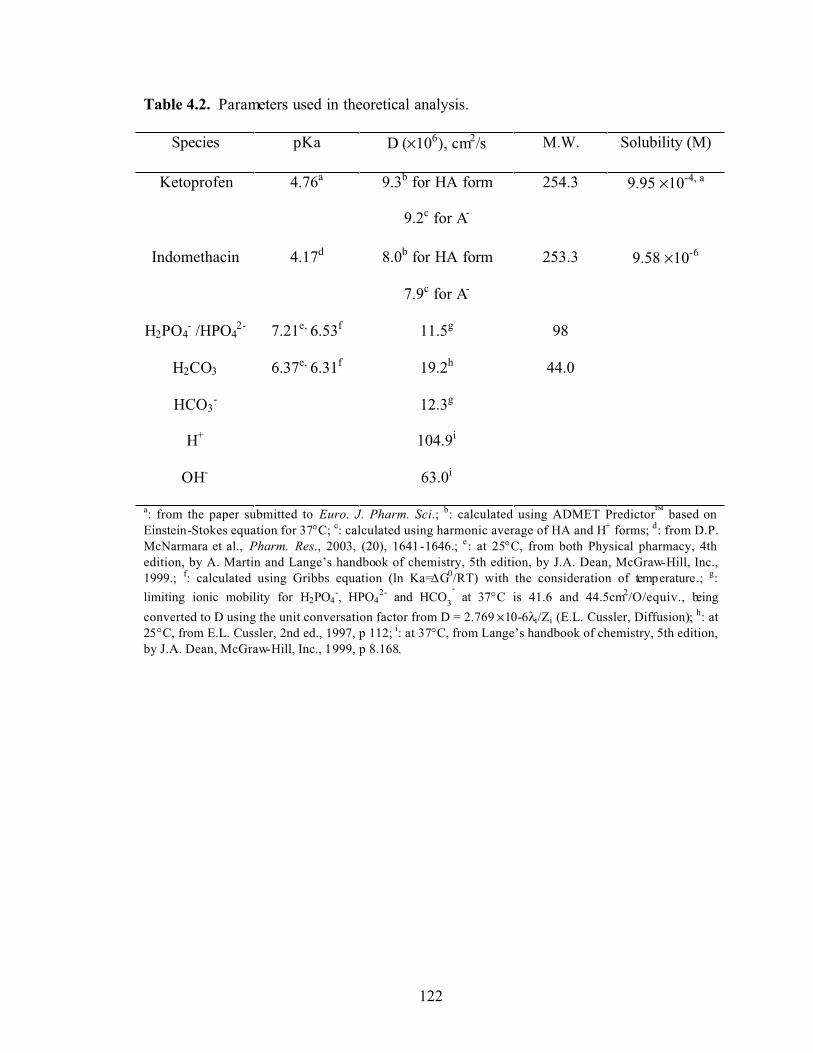
122
Table 4.2. Parameters used in theoretical analysis.
Species pKa D (×106), cm2/s M.W. Solubility (M)
Ketoprofen 4.76a 9.3b for HA form
9.2c for A-
254.3 9.95 ×10⁻⁴, a
Indomethacin 4.17d 8.0b for HA form
7.9c for A-
253.3 9.58 ×10⁻⁶
H2PO4- /HPO4
2- 7.21e, 6.53f 11.5g 98
H2CO3 6.37e, 6.31f 19.2h 44.0
HCO3- 12.3g
H+ 104.9i
OH- 63.0i
a: from the paper submitted to Euro. J. Pharm. Sci.; b: calculated using ADMET Predictor™ based on Einstein-Stokes equation for 37°C; c: calculated using harmonic average of HA and H+ forms; d: from D.P. McNarmara et al., Pharm. Res., 2003, (20), 1641-1646.; e: at 25°C, from both Physical pharmacy, 4th edition, by A. Martin and Lange’s handbook of chemistry, 5th edition, by J.A. Dean, McGraw-Hill, Inc., 1999.; f: calculated using Gribbs equation (ln Ka=∆G0/RT) with the consideration of temperature.; g:limiting ionic mobility for H2PO4
-, HPO42- and HCO3
- at 37°C is 41.6 and 44.5cm2/O/equiv., being
converted to D using the unit conversation factor from D = 2.769 ××10-6λi/Zi (E.L. Cussler, Diffusion));; h: at 25°C, from E.L. Cussler, 2nd ed., 1997, p 112; i: at 37°C, from Lange’s handbook of chemistry, 5th edition, by J.A. Dean, McGraw-Hill, Inc., 1999, p 8.168..
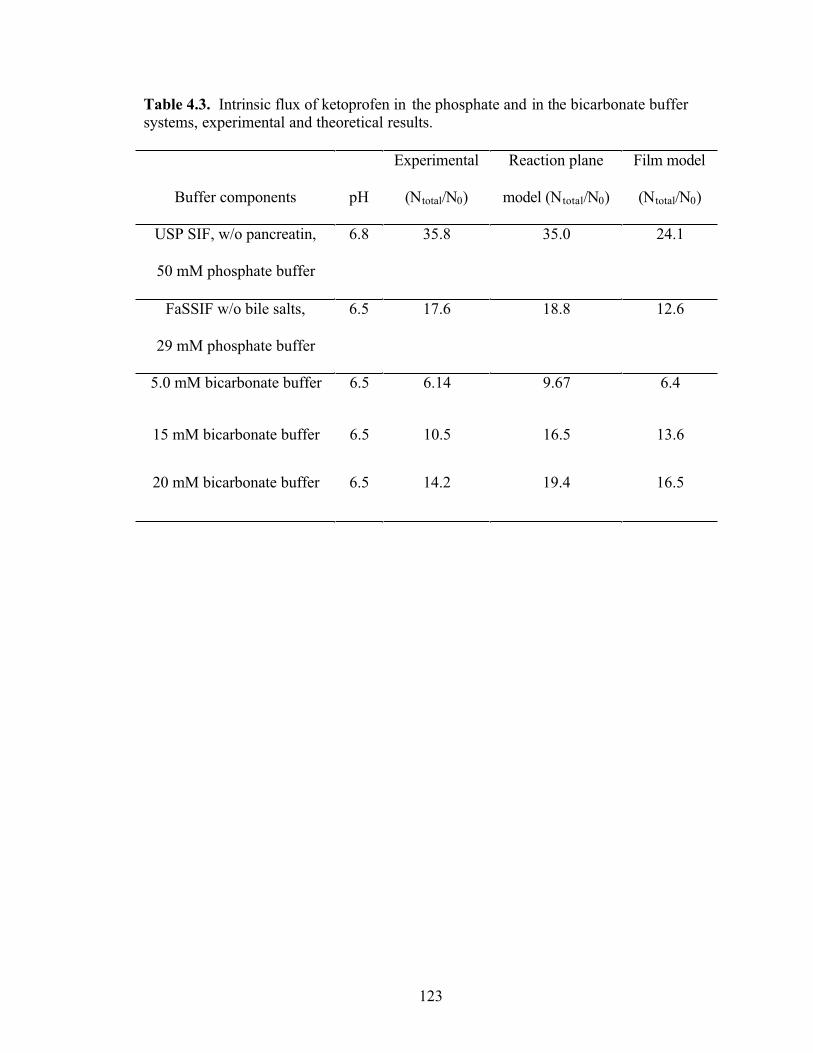
123
Table 4.3. Intrinsic flux of ketoprofen in the phosphate and in the bicarbonate buffer systems, experimental and theoretical results.
Buffer components pH
Experimental
(Ntotal/N0)
Reaction plane
model (Ntotal/N0)
Film model
(Ntotal/N0)
USP SIF, w/o pancreatin,
50 mM phosphate buffer
6.8 35.8 35.0 24.1
FaSSIF w/o bile salts,
29 mM phosphate buffer
6.5 17.6 18.8 12.6
5.0 mM bicarbonate buffer 6.5 6.14 9.67 6.4
15 mM bicarbonate buffer 6.5 10.5 16.5 13.6
20 mM bicarbonate buffer 6.5 14.2 19.4 16.5
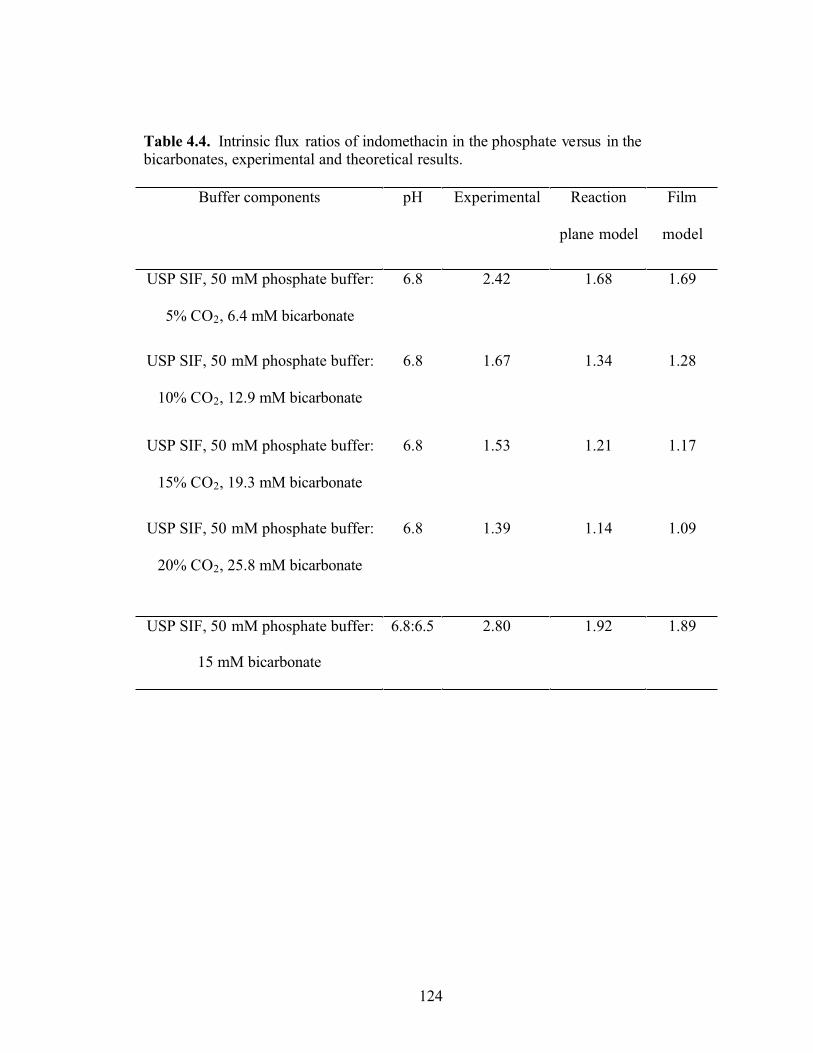
124
Table 4.4. Intrinsic flux ratios of indomethacin in the phosphate versus in the bicarbonates, experimental and theoretical results.
Buffer components pH Experimental Reaction
plane model
Film
model
USP SIF, 50 mM phosphate buffer:
5% CO2, 6.4 mM bicarbonate
6.8 2.42 1.68 1.69
USP SIF, 50 mM phosphate buffer:
10% CO2, 12.9 mM bicarbonate
6.8 1.67 1.34 1.28
USP SIF, 50 mM phosphate buffer:
15% CO2, 19.3 mM bicarbonate
6.8 1.53 1.21 1.17
USP SIF, 50 mM phosphate buffer:
20% CO2, 25.8 mM bicarbonate
6.8 1.39 1.14 1.09
USP SIF, 50 mM phosphate buffer:
15 mM bicarbonate
6.8:6.5 2.80 1.92 1.89

125
Table 4.5. Intrinsic dissolution rates of ketoprofen in 50mM pH 6.8 phosphate and bicarbonate buffers.
Buffer components pH Mean flux (mg/cm2/min)
(n = 3, S.D.)
Experimental
(Ntotal/N0)
USP SIF, 50 mM
phosphate buffer
6.8 0.783 (0.010) 35.8
50 mM bicarbonate
buffer
6.8 0.352 (0.003) 16.1
SGF, 0.1 N HCl 1.2 0.022 (0.001) 1.0

126
Table 4.6-1. Drug flux ratio in USP 50 mM phosphate and 15mM bicarbonate buffers:the impact of drug solubility and drug diffusion coefficient (drug pKa = 3).
Drug diffusion coefficient (×10-5 cm2/s)Drug Solubility (M) 0.1 0.5 1.0 5.0
1×10⁻⁸ 2.0 2.0 1.99 1.981×10⁻⁷ 1.99 1.99 1.95 1.92
1×10⁻⁶ 1.98 1.90 1.85 1.791×10⁻⁵ 1.85 1.79 1.81 1.901×10⁻⁴ 1.81 1.94 1.99 2.031×10⁻³ 1.99 2.02 1.99 1.81
Table 4.6-2. Drug flux ratio in USP 50 mM phosphate and 15 mM bicarbonate buffers:the impact of drug solubility and drug diffusion coefficient (drug pKa = 5).
Drug Solubility (M) Drug diffusion coefficient (×10-5 cm2/s)0.1 0.5 1.0 5.0
1×10⁻⁸ 1.97 1.97 1.97 1.971×10⁻⁷ 1.97 1.99 1.97 1.971×10⁻⁶ 1.97 1.97 1.96 1.951×10⁻⁵ 1.96 1.96 1.93 1.881×10⁻⁴ 1.95 1.87 1.82 1.751×10⁻³ 1.82 1.74 1.74 1.73
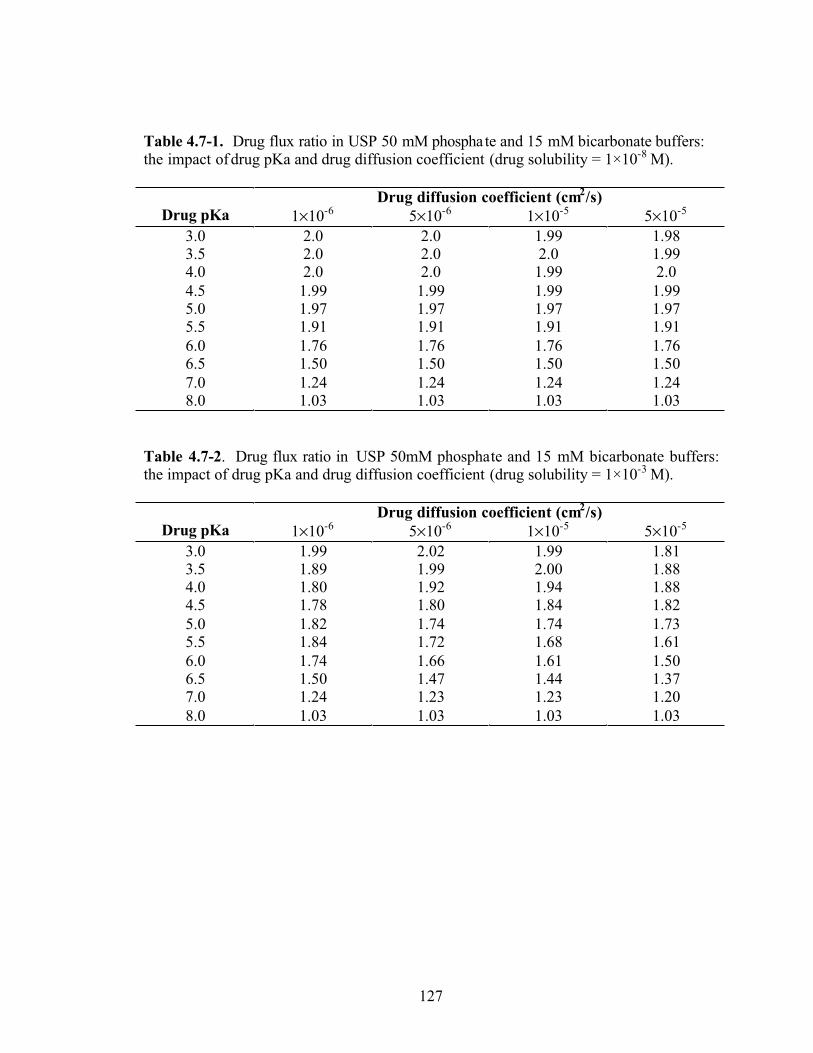
127
Table 4.7-1. Drug flux ratio in USP 50 mM phosphate and 15 mM bicarbonate buffers: the impact of drug pKa and drug diffusion coefficient (drug solubility = 1×10⁻⁸ M).
Drug diffusion coefficient (cm2/s)Drug pKa 1×10⁻⁶ 5×10⁻⁶ 1×10⁻⁵ 5×10⁻⁵
3.0 2.0 2.0 1.99 1.983.5 2.0 2.0 2.0 1.994.0 2.0 2.0 1.99 2.04.5 1.99 1.99 1.99 1.995.0 1.97 1.97 1.97 1.975.5 1.91 1.91 1.91 1.916.0 1.76 1.76 1.76 1.766.5 1.50 1.50 1.50 1.507.0 1.24 1.24 1.24 1.248.0 1.03 1.03 1.03 1.03
Table 4.7-2. Drug flux ratio in USP 50mM phosphate and 15 mM bicarbonate buffers:the impact of drug pKa and drug diffusion coefficient (drug solubility = 1×10⁻³ M).
Drug diffusion coefficient (cm2/s)Drug pKa 1×10⁻⁶ 5×10⁻⁶ 1×10⁻⁵ 5×10⁻⁵
3.0 1.99 2.02 1.99 1.813.5 1.89 1.99 2.00 1.884.0 1.80 1.92 1.94 1.884.5 1.78 1.80 1.84 1.82
5.0 1.82 1.74 1.74 1.735.5 1.84 1.72 1.68 1.616.0 1.74 1.66 1.61 1.506.5 1.50 1.47 1.44 1.377.0 1.24 1.23 1.23 1.208.0 1.03 1.03 1.03 1.03

128
Table 4.8. Phosphate buffer as an equivalent substitute for 15 mM bicarbonate buffer.
Buffer components (pH 6.5) Ketoprofen Indomethacin
Exp. Drug flux (S.D) (mg/cm2 /min)
Exp. Drug flux (S.D.) (µg/cm2/min)
29 mM phosphate 0.386 (0.010) 40.0 (3.5)
15 mM bicarbonate 0.231 (0.002) 24.0 (4.8)
Theoretical analysis Theoretical phosphate concentration (mM)
Reaction plane model 12.0 < 3.0
Film model 13.7 ~ 4.0
Exp. phosphate 13.0 3.5
Exp. drug flux (S.D.) using the bicarbonate substitute
0.198 (0.004) 26.0 (0.3)
Proficiency to bicarbonate 86% 108%

129
Table 4.9. pKa values, maximum dose, and salt forms of some BCS II weak acids.
Compound pKavalues
Maximumdose (mg)
Acid/salt form Provisional BCS classification
Acetyl-salicylic acid
3.5 45 975 Free acid BCS I or III
Atorvastatin 4.46 45 80 Calcium salt BCS II 46
Diacerein 4.74* 50 Free acid non-us marketed drugDiclofenac 4.2 47 50 K and Na salts BCS IIDiflunisal 3.0 45 500 Free acid BCS IIEtodolac 4.7 45 400 Free acid BCS IIEpalrestat 3.2* 50 Free acid non-us drugFenoprofen 4.5 47 600 Calcium salt BCS IIFlurbiprofen 4.3 47 100 Free acid BCS IIFluvastatin 4.76* 40 Na salt BCS IIFurosemide 3.88,
9.37* 80 Free acid BCS II
Ibuprofen 4.4 47 800 Free acid BCS IIIndomethacin 4.5 47 50 Free acid BCS IIKetoprofen 4.76 47 75 Free acid BCS IIKetorolac
3.5 47 20Tromethamine
saltSalt form: BCS I
Mefenamicacid 4.2 45 250 Free acid BCS II
Meloxicam 1.1, 4.2 48 15 Free acid BCS IINaproxen
4.2 47500500
Free acidNa salt
Acid: BCS II 49
Na salt: BCS I 50
Oxaprozin 4.3 48 600 Free acid BCS IIPiroxicam 1.8, 5.1 48 20 Free acid BCS IISalicylic acid 3.0 45 750 Free acid BCS ISulindac 4.5 47 200 Free acid BCS IITriflusal 4.15* 300 Free acid non-us drugTolmetin 51 3.5 47 600 Na salt BCS IIZaltoprofen 4.44* 80 Free acid non-us drugWarfarin 5.35* 10 Na salt 52 BCS I*: calculated using Program ADMET version 1.2.3,


131
References.
1. Amidon GL, Lennernas H, Shah VP, Crison JR. 1995. A theoretical basis for a biopharmaceutic drug classification: The correlation of in vitro drug product dissolution and in vivo bioavailability. Pharm Res 12:413-420.2. Lindahl A, Ungell AL, Knutson L, Lennernas H. 1997. Characterization of fluids from the stomach and proximal jejunum in men and women. Pharm Res 14:497-502.3. Pedersen BL, Brondsted H, Lennernas H, Christensen FN, Mullertz A, Kristensen HG. 2000. Dissolution of hydrocortisone in human and simulated intestinal fluids. Pharm Res 17:183-189.4. Vertzoni M, Fotaki N, Kostewicz E, Stippler E, Leuner C, Nicolaides E, Dressman J, Reppas C. 2004. Dissolution media simulating the intralumenal composition of the small intestine: Physiological issues and practical aspects. J Pharm Pharmacol56:453-462.5. Persson EM, Gustafsson AS, Carlsson AS, Nilsson RG, Knutson L, Forsell P, Hanisch G, Lennernas H, Abrahamsson B. 2005. The effects of food on the dissolution of poorly soluble drugs in human and in model small intestinal fluids. Pharm Res 22:2141-2151.6. Kalantzi L, Goumas K, Kalioras V, Abrahamsson B, Dressman JB, Reppas C. 2006. Characterization of the human upper gastrointestinal contents under conditions simulating bioavailability/bioequivalence studies. Pharm Res 23:165-176.7. Kalantzi L, Persson E, Polentarutti B, Abrahamsson B, Goumas K, Dressman JB, Reppas C. 2006. Canine intestinal contents vs. Simulated media for the assessment of solubility of two weak bases in the human small intestinal contents. Pharm Res 23:1373-1381.8. Dressman JB, Amidon GL, Reppas C, Shah VP. 1998. Dissolution testing as a prognostic tool for oral drug absorption: Immediate release dosage forms. Pharm Res15:11-22.9. Sheng JJ, Kasim NA, Chandrasekharan R, Amidon GL. 2005. Solubilization and dissolution of insoluble weak acid, ketoprofen: Effects of ph combined with surfactant. European Jounral of Pharmaceutical Sciences sumbitted.10. Balakrishnan A, Rege BD, Amidon GL, Polli JE. 2004. Surfactant-mediateddissolution: Contributions of solubility enhancement and relatively low micelle diffusivity. J Pharm Sci 93:2064-2075.11. Jinno J, Oh D, Crison JR, Amidon GL. 2000. Dissolution of ionizable water-insoluble drugs: The combined effect of ph and surfactant. J Pharm Sci 89:268-274.12. Ozturk SS, Palsson BO, Dressman JB. 1988. Dissolution of ionizable drugs in buffered and unbuffered solutions. Pharm Res 5:272-282.13. USP. 2000. The united states pharmacopeia usp 24, the national formulary nf19. ed., Rockville, Maryland: United States Pharmacopeial Convention, Inc. p 2236.14. Lobenberg R, Kramer J, Shah VP, Amidon GL, Dressman JB. 2000. Dissolution testing as a prognostic tool for oral drug absorption: Dissolution behavior of glibenclamide. Pharm Res 17:439-444.15. Allen A, Flemstrom G. 2005. Gastroduodenal mucus bicarbonate barrier: Protection against acid and pepsin. Am J Physiol Cell Physiol 288:C1-19.
132
16. Rune SJ. 1972. The duodenal pco2 in duodenal ulcer patients and normal subjects. Acta Hepatogastroenterol (Stuttg) 19:386-387.17. Rune SJ. 1972. Acid-base parameters of duodenal contents in man. Gastroenterology 62:533-539.18. Flemstrom G. 1994. Gastric and duodenal mucosal secretion of bicarbonate. 3rd ed., New York: Raven Press. p 1285-1309.19. Rees WD, Botham D, Turnberg LA. 1982. A demonstration of bicarbonate production by the normal human stomach in vivo. Dig Dis Sci 27:961-966.20. Isenberg JI, Hogan DL, Thomas FJ. 1986. Duodenal mucosal bicarbonate secretion in humans: A brief review. Scand J Gastroenterol Suppl 125:106-109.21. Hogan DL, Isenberg JI. 1988. Gastroduodenal bicarbonate production. Adv Intern Med 33:385-408.22. Kristensen M. 1975. Titration curves for gastric secretion. A study on duodenal ulcer and gastric ulcer with particular reference to the effect of glycopyrronium. Scand J Gastroenterol Suppl 32:11-144.23. Goodman LS, Hardman JG, Limbird LE, Gilman AG. 2001. Goodman and gilman's the pharmacological basis of therapeutics. 10th ed., New York: McGraw-Hill,Medical Publishing Division. p xxvii, 2148 p. [2141] leaf of fold. plates.24. Tietz NW. 1995. Clinical guide to laboratory tests. 3rd ed., Philadelphia: W.B. Saunders Co. p xxxix, 1064 p.25. Karr WG, Abbott WO, Sample AB. 1935. Intubation studies of the human smallintestine. Iv. Chemical characteristics of the intestinal contents in the fasting state and as influenced by the administration of acids, of alkalies and of water. J Clin Invest 14:893-900.26. Repishti M, Hogan DL, Pratha V, Davydova L, Donowitz M, Tse CM, Isenberg JI. 2001. Human duodenal mucosal brush border na(+)/h(+) exchangers nhe2 and nhe3 alter net bicarbonate movement. Am J Physiol Gastrointest Liver Physiol 281:G159-163.27. McNamara DP, Whitney KM, Goss SL. 2003. Use of a physiologic bicarbonatebuffer system for dissolution characterization of ionizable drugs. Pharm Res 20:1641-1646.28. Mooney KG, Mintun MA, Himmelstein KJ, Stella VJ. 1981. Dissolution kinetics of carboxylic acids ii: Effect of buffers. J Pharm Sci 70:22-32.29. Aunins JG, Southard MZ, Myers RA, Himmelstein KJ, Stella VJ. 1985.Dissolution of carboxylic acids. Iii: The effect of polyionizable buffers. J Pharm Sci74:1305-1316.30. McNamara DP, Amidon GL. 1988. Reaction plane approach for estimating the effects of buffers on the dissolution rate of acidic drugs. J Pharm Sci 77:511-517.31. Litt M, Serad G. 1964. Chemical reactions on a rotating disk. Chemical Engineering Science 19:867-884.32. McNamara DP, Amidon GL. 1986. Dissolution of acidic and basic compounds from the rotating disk: Influence of convective diffusion and reaction. J Pharm Sci75:858-868.33. Cussler EL. 1997. Diffusion: Mass transfer in fluid systems. ed., New York: Cambridge University Press. p 65-67.34. Riddiford AC. 1966. Advances in electrochemistry and electrochemical engineering. ed., New York: Interscience. p 47-116.

133
35. Olander DR. 1960. Simultaneous mass transfer and equilibrium chemical reaction. Aiche Journal 6:233-239.36. Mooney KG, Mintun MA, Himmelstein KJ, Stella VJ. 1981. Dissolution kinetics of carboxylic acids i: Effect of ph under unbuffered conditions. J Pharm Sci 70:13-22.37. Banwell JG, Gorbach SL, Pierce NF, Mitra R, Mondal A. 1971. Acute undifferentiated human diarrhea in the tropics. Ii. Alterations in intestinal fluid andelectrolyte movements. J Clin Invest 50:890-900.38. Davenport HW. 1982. Physiology of the digestive tract: An introductory text. 5th ed., Chicago: Year Book Medical Publishers. p 201.39. AOAC. 1995. Methods of analysis of the association of official analyticalchemists. 18th ed., Washington. p 1.46.40. Caputi A, Ueda M, Walter P, Brown T. 1970. Titrimetric determination of carbon dioxide in wine. American Journal of Enology and Viticulture 21:140-&.41. Caputi A, Walker DR. 1987. Titrimetric determination of carbon-dioxide in wine - collaborative study. Journal of the Association of Official Analytical Chemists70:1060-1062.42. Levich VG. 1962. Physicochemical hydrodynamics. ed., Englewood Cliffs, N.J.: Prentice-Hall. p 700 p.43. Sheng JJ, Kasim NA, Chandrasekharan R, Amidon GL. 2006. Solubilization and dissolution of insoluble weak acid, ketoprofen: Effects of ph combined with surfactant. Eur J Pharm Sci 29:306-314.44. AHFS. 2005. Ahfs drug information. ed.: Copyright 2005 by the American Society of Health-System Pharmacists, Inc. p 24:06.08.45. O'Neil MJ, Merck & Co. 2001. The merck index: An encyclopedia of chemicals, drugs, and biologicals. 13th ed., Whitehouse Station, NJ: Published by Merck Research Laboratories Division of Merck. p 1 v. (various pagings).46. Kearney AS, Crawford LF, Mehta SC, Radebaugh GW. 1993. The interconversion kinetics, equilibrium, and solubilities of the lactone and hydroxyacid forms of the hmg-coa reductase inhibitor, ci-981. Pharm Res 10:1461-1465.47. Jack DB. 1992. Handbook of clinical pharmacokinetic data. ed., Basingstoke, Hants: Macmillan.48. Medical Economics Company. 1995. Pdr medical dictionary. ed., Montvale, N.J.: Medical Economics. p v.49. Avdeef A, Berger CM, Brownell C. 2000. Ph-metric solubility. 2: Correlation between the acid-base titration and the saturation shake-flask solubility-ph methods. Pharm Res 17:85-89.50. Kim YS, Mendez del Rio JR, Rousseau RW. 2005. Solubility and prediction of the heat of solution of sodium naproxen in aqueous solutions. J Pharm Sci 94:1941-1948.51. Wishart DS, Knox C, Guo AC, Shrivastava S, Hassanali M, Stothard P, Chang Z, Woolsey J. 2006. Drugbank: A comprehensive resource for in silico drug discovery and exploration. Nucleic Acids Res 34:D668-672.52. Zingone G, Rubessa F. 2005. Preformulation study of the inclusion complex warfarin-beta-cyclodextrin. Int J Pharm 291:3-10.

CHAPTER V
SUMMARY
So far, dissolution testing is one of the most widely employed quality control
criteria for oral drug products. Using the current dissolution methods as a predictive tool
for the in vivo performance of a drug product, however, is very difficult if not impossible.
has been frequently encountered in pharmaceutical product development, with
pharmacopeia dissolution testing often either over- or under- discriminating the in vivo
dissolution behavior for an immediate drug product. Evidently, the gap between in vitro
dissolution results and in vivo dissolution are largely caused by the discrepancy between
in vitro dissolution design and in vivo GI environment. project was thus to focus on
mechanistically investigating key in vitro dissolution parameters that can closely reflect
in vivo drug dissolution, with the ultimate goal to design a bioequivalent dissolution
methodology.
To achieve this goal we started investigating the effect of particle size and paddle
speeds on the diffusional layer thickness in a USP dissolution apparatus II.
Fenofibrate, a neutral and poorly soluble drug with a single polymorph, was selected as
the model compound. In the literature, the dependence of on particle size assumes
various relationships. Popular among them includes
apph
apph
apph r or as a constant based
on a rotating disk system, and comparable to or larger than r in a
apph
apph
134

rotating bottle. One immediate goal of this work is to examine how is related to
particle radius r in a pharmaceutically relevant system such as a USP dissolution vessel.
It is surprising that even with global usage of the USP paddle device, this relationship has
not been experimentally determined through powder dissolution testing. It is well known
that is a function of fluid velocity. Unfortunately, the dependence of on paddle
speeds or fluid velocity has been largely ignored in pharmaceutical field. This work
demonstrated that the dependence of h
apph
apph apph
app on particle size follows different functions in
accordance with the paddle speed. At 50 rpm, the function of happ is best described by a
linear plot of 9.91 23.31apph d ( ) throughout the particle size range of 6.8-
106 m. In contrast, at 100 rpm a transitional particle radius of 23.7 m exists, under
which a linear relationship of
2 0.98R
1.59apph r ( ) manifests, but above which h2 0.98R app
becomes a constant of 43.5 m. Further, the effect of particle size and paddle speed on
happ was combined using dimensionless analysis. Within certain fluid velocity/particle
size regime, linear correlation of apphd
with the square-root of Reynolds number 1/ 2( )d ,
i.e., 4 1/ 21.5207 9.25 10 ( )apph dd
2 0.9875R ( ), was observed. One unique finding
of work is the independence of diffusional layer thickness on fluid velocity for the drug
particles in micron range. certainly merits further investigation considering the current
technological trend of micronizing and nanonizing. In addition, the application of
apparent diffusion layer thickness to the real drug powder namely polydispersed
powder, should be investigated in the future. Further, in this work a non-ionized
compound was used. Examination of the dependence of on particle size and paddle
apph
apph
135
speed for ionizable BCS II drugs such as weak acids and bases is yet to be conducted.
Conceivably, in addition to diffusion and convection, the reaction term can be included
into the apparent .apph
The other objective of this work is to design in vitro dissolution media closely
reflecting in vivo GI fluids. To accomplish goal, two research investigations were
conducted: 1). The combined effects of pH and surfactants in solubilization and
dissolution of a BCS II acid ketoprofen; 2). The buffer differential between bicarbonate
and phosphate in dissolution of ketoprofen and indomethacin. A lot of attention has been
paid to the pH of dissolution media so that they match the pH changes along GI tract.
Surfactants as economic substitute for bile salts have been examined by several
investigators recently. When the effects of pH and surfactants were combined and
compared, work revealed that pH is the far more important factor than surfactants (bile
salts) in solubilization and dissolution of a BCS II weak acid with a pKa value within the
GI pH range, mainly because pH has the log-scale effect whereas surfactant has a linear
effect on ionizable drug dissolution. Surfactants are still important in constituting
dissolution media especially for non-ionizable low-solubility drugs. Further, even at the
same pH and with the same buffer concentration, BCS II weak acids still exhibit different
dissolution rates depending on the buffer species. Therefore, bicarbonate as a key buffer
species in dissolution medium was investigated. work demonstrated the buffer
differential between bicarbonates and phosphates both experimentally using rotating disk
method and theoretically using reaction plane model and film model. Specifically, the
intrinsic dissolution rates of ketoprofen and indomethacin in USP and FaSSIF phosphate
buffers are 50-200% faster than those in 15 mM bicarbonates, which is in good
136
agreement with the theoretical trendline. Using theoretical approach, the buffer
differential was demonstrated to depend on the biopharmaceutical properties of API in
the following decreasing order: drug pKa > drug solubility drug diffusivity. The
significance of this finding is that for a given new drug candidate, the effects of buffer
species can be forecasted and then appropriate buffer can be selected in dissolution
testing. Even though bicarbonate is in vivo buffer system, its utilization in practice is
inconvenient due to difficulty of maintaining CO2 concentration in aqueous phase.
Therefore, through theoretical prediction and experimental results a simple buffer such as
phosphate buffer can be recommended, in which the dissolution rates of an API is
equivalent to that in the bicarbonates. Specifically, in this work I showed that at pH 6.5
ketoprofen and indomethacin require 13 -14 mM and 3-4 mM phosphate buffer to match
85% and 108% of the dissolution rates in 15 mM bicarbonate buffer, respectively. Both
phosphate concentrations are far below than the USP SIF and FaSSIF, suggesting that the
current phosphates are very likely overestimate the true dissolution rates in vivo. Much
work remains in designing the optimal dissolution media to mimic in vivo fluids. is
because in vivo fluids inevitably change along the GI tract and vary among individuals.
Therefore, one single dissolution medium can not possibly reflect the complexity and
dynamic of GI fluids. I trust that this work will at least lead the colleagues’ attention to
and stimulate interest in bicarbonates or its surrogates when constituting a BE dissolution
medium.
In the future, in order to establish a meaningful bioequivalent methodology,
hydrodynamics, choice of dissolution media, and interplay between these two should be
all carefully considered.
137