toward a complete definition of relatedness in mergers and...
TRANSCRIPT

Toward a Complete Definition of Relatedness in Mergers and Acquisitions
(A Comparison between SIC-based and FIC-based Identification of
Relatedness in M&A Analyses)
March 06, 2015
Yasser Alhenawi
University of Evansville


Relatedness between the acquirer and the target is widely recognized in academia and in
practice as a source of synergy and value creation in merger and acquisition transactions. However,
despite its intuitive appeal, relatedness neither has a universal definition nor it has a standardized
measuring instrument. This paper supplies both theoretical and empirical investigation of
relatedness in M&A transactions, compares existing methodologies, and proposes a few
alternatives.
The most straightforward approach to capture relatedness is the simple SIC code matching
procedure which results in a binary indicator of relatedness. Palepu (1985) developed a continuous
SIC-based measure that captures the level of relatedness. SIC-based measures capture similarities
in the regulatory environments but they overlook several other important aspects such as supply
chain integrations (Fan and Lang (2000), geographical proximity (Kang and Kim, 2008), and
operational and marketing similarities (Hoberg and Phillips 2010, 2014)1. In this paper I theorize
that a single-dimensional measure of relatedness cannot capture relatedness completely and
accurately because relatedness is multidimensional.
The empirical analyses support this view. Using a sample of 14,398 U.S. mergers
completed between 1998 and 2014, I show that only a small fraction of deals can be appropriately
labelled by a single-dimensional metric (e.g. only a few deals are pure vertical merger). I employ
create double-sorted portfolios based on all possible pairs of relatedness measures and show that
none of the analyzed measures is sufficient to explains variations in the acquirers’ abnormal returns
and Tobin’s Q. Then, I employ multivariate regression analysis and show that each relatedness
measure contains unique valuation information that is not captured by other measures. Finally,
1 Several other measures are also considered in this paper.
following Baker and Wurgler (2006), I convert the underlying relatedness proxies into a composite
relatedness index (a set of linearly uncorrelated principal components) that overcomes the inherent
limitations of its original components.
The contribution of this paper is three-fold. First, it provides a side-by-side theoretical and
empirical comparison of relatedness measures2 and urges researchers toward a more inclusive
definition of relatedness. Second, and more importantly, this research shows that existing
relatedness instruments are not mutually exclusive; and they are complements, not substitutes, of
each other. This suggests that relatedness is multidimensional and sheds doubt on a few stylized
facts that emerged from previous work. Third, I this paper introduces a composite relatedness
index and concludes that relatedness is a multidimensional concept and, accordingly, a single-
dimensional approach leads to misleading conclusions. This should improve future academic
research and help managers and practitioners better understand and adapt to the increasingly
complex nature of corporate-transforming strategies.
I. Literature Review and Hypotheses Development
1. SIC Code-matching Approach
The vast majority of research in mergers and acquisitions literature uses predefined
industry coding systems such as the Standard Industry Classification (SIC) to distinguish between
related and unrelated merger and acquisition deals. For instance, a deal is considered related if the
2 Alhenawi and Krishnaswami (2014) use simple SIC classification and the continuous measure developed by
Palepu (1985). In a robustness check, they applied Hoberg and Phillips (2010, 2014) classification in a study that
focuses on value creation and performance of related and unrelated mergers. Their work does not focus on
measuring relatedness or the comparison of its masseurs. Further, their work does not incorporate Fan and Lang
(2000) supply chain overlapping measure or Kang and Kim (2008) geographical proximity measure.
bidder and the target are in the same two-digit SIC code (e.g. Berger and Ofek, 1995 and Comment
and Jarrell, 1995) or four-digit SIC code (Agrawal, Jaffe, and Mandelker, 1992 and Eckbo, 1992).
SIC codes are four-digit numerical codes established by the U.S. Government’s Office of
Management and Budget to classify enterprises into industries based on their primary economic
activities. SIC codes date back about 80 years and had been updated numerous times until 1987.
SIC codes are the standard used by SEC when sorting company filings and they appear in a
company’s disseminated EDGAR filings. They are also used in the SEC Division of Corporation
Finance as a basis for assigning review responsibility for the company’s filings. The IRS uses SIC
codes in taxation and auditing firms use them when comparing ratios of companies in similar
industries. They are also used in determining eligibility for government contracts. Federal and state
agencies use SIC codes in reporting statistical data and for legislative issues (e.g. the Department
of Revenue uses the codes to inform taxpayers within a certain industry of law changes that may
affect them)3 4.
Despite its simplicity and intuitive appeal, the SIC code approach has been criticized by
several authors and several alternatives have been developed.
For multi-division entities, the primary SIC code is the one that generates the highest
revenue for that enterprise in the past year. This creates a conflict between four-digit and three-
and two-digit classification. Clarke (1989) provides a good example. If a firm has 40% of its
revenues in SIC 3211, and 30% in both SICs 2842 and 2845, the firm will be assigned SIC code
3 For more details see www.siccode.com and www.secinfo.com. 4 The North American Industry Classification System (NAICS) is a newer standard. The most recent NAICS was
developed in 2007 under the auspices of the U.S. Office of Management and Budget (OMB) to replace SIC [1987].
The main objective is to allow for comparability in business statistics among the NAFTA countries (U.S., Canada
and Mexico). In the U.S., government agencies (e.g. the SEC and the IRS) do not use NAICS. Since this research is
concerned with U.S. M&As, I do not consider NAICS in my analyses.
3211 which implies a three-digit SIC of 321 and a two-digit SIC of 32. However, 60% of the firm's
revenues are in the 284 three-digit SIC and the 28 two-digit SIC.
King (1966) and Meyers (1973) use principal component analysis on market returns of 2-
digit industries. They find that about 10% of the variance in rate of return could be explained by
the industry codes. Using a similar methodology, Fertuck (1975) tests SIC codes power of
predicting returns across pseudo industries formed on return correlations. He finds that three-digit
SIC groupings are moderately powerful (explain about 11% of variation in returns) while two- and
one-digit SIC grouping are extremely weak (explain about 3% of variations in returns). Clarke
(1989) tests SIC system power in creating groups of firms with similar characteristics. He finds
that SIC system cannot identify homogeneous economic markets and, in contrast to Fertuck, he
reports that coarse grouping (one-digit) is more effective than finer three- and four-digit grouping.
Kahle and Walkling (1996) find that SIC classifications for the same firm differ between
CRSP and Compustat by 21% at the one-digit level, 36% at the two-digit level, 50% at the three-
digit lever, and 79% at the four-digit level. They state that these discrepancies suggest that research
results and significance levels could differ because of the database chosen, irrespective of the
underlying economics of the problem being analyzed. This is consistent with an earlier concern
raised by Guenther and Rosman (1994). Further, Kahle and Walkling (1996) find that CRSP and
Compustat disagree substantially on classification of mergers. 65% of the horizontal mergers
identified by Compustat would have been reversed by CRSP and 35% of the CRSP horizontal
mergers would have been reversed by Compustat. This finding is disturbing because it implies that
when a researcher uses Compustat (CRSP) SIC codes to identify related deals, there is a 65%
(35%) chance that the identification will be reversed if the study is replicated with CRSP
(Compustat) SIC codes. These probabilities of misclassification are too high by almost any
standard.
2. Alternative Approaches
Palepu (1985) argues that a simple SIC matching procedure is too coarse because it does
not recognize the degree of relatedness. Accordingly, he employs an entropy measure of firm
focus5 and Alhenawi and Krishnaswami (2014) define relatedness as the difference between the
pre-merger and post-merger values of the entropy measure6.
Fan and Lang (2000) argues that SIC-based measures are unsatisfactory in several aspects.
First, they do not reveal relatedness type (vertically vs. horizontally). Second, they are discrete not
continuous. Third, they are subject to classification error. They suggested a measure of relatedness
that employs commodity flow data in U.S. input-output tables (provided by the Bureau of
Economic Analysis). They construct two variables that capture vertical relatedness (one firm’s
output can be used as the other’s input) and complementarity (the two firms purchase from a
homogenous set of sellers and/or sell to a homogenous set of buyers) between industries7.
Kang and Kim (2008) examine the importance of geographic proximity. They argue that
in-state acquirers may realize several advantages over out-of-state acquirers because the former
have better access to relevant information on local markets, targets’ performance, earning
forecasts, and state regulations. In addition, they argue that an in-state acquirer enjoys lower
monitoring and transportation costs than an out-of-state acquirer after completion of the merger.
5 The measure was originally developed by Jacquemin and Berry (1979). 6 Caves, Porter, and Spence (1980) and Wernerfelt and Montgomery (1988) use SIC codes to construct a concentric
index measure of relatedness. Their measure is very similar to Palepu’s continuous measure; but the latter is more
sophisticated. 7 Several authors [e.g. Matsusaka (1996), and Fan and Goyal (2006)] have employed this approach.

Using state identifiers (a binary indicator of in-state mergers) and a topological distance measure
they find that in-state and local mergers experience both higher abnormal announcement returns
and better post-acquisition operating performance than those of out-of-state and remote mergers.
They also report that block acquirers exhibit a strong preference for in-state and local targets.
Hoberg and Phillips (2010, 2014) introduce a text-based analysis where relatedness is
measured in the marketplace. Specifically, relatedness is defined as high ex-ante similarity in
product description between the acquirer and the target as well as high ex-ante differentiation in
product description between the target and the acquirer’s rivals. They scanned about 50,000 10K
product descriptions from the SEC Edgar website to construct spatial representation of relatedness.
They argue that their measure captures asset complementarities and the ability to introduce
differentiated products. Specifically, complementarity allows for operational integration and
differentiation creates market power.
3. Hypothesis Development:
The literature cited above indicates that scholars have used the term “relatedness” to
describe a wide range of similarities and potential integrations between merging firms. The simple
SIC code matching measure and Palepu’s continuous measure focus on the similarity in legislative
and regulatory environment. Fan and Lang (2000) define relatedness in terms of vertical and
horizontal integrations in supply chain. The geographical distance measure developed by Kang
and Kim (2008) captures familiarity with local markets and laws, access to relevant information,
and lower monitoring costs. Hoberg and Phillips (2010, 2014) define relatedness in terms of asset
marketing and operational integration.

These variations in defining and capturing relatedness beg the question: is relatedness
single-dimensional or multi-dimensional? Each measure of relatedness discussed above has its
own merits and limitations. However, given the complex nature of M&A transactions, it is hard to
believe that any of these measures can, alone, capture relatedness accurately and completely. For
instance, a merger between multi-segment entities can be vertically- and horizontally-related at the
same time. A horizontally- or vertically-related merger may witness additional benefits from
geographical proximity, market power, or operational integration.
Illustrative example:
Consider firm A which is made of two segments: A1 and A2 where A1 produces rubber
and A2 produces tennis balls. Firm B produces basket balls and therefore it belongs to the same
industry – sports products - as A2. If firms A and B merge to form a new entity AB, the merger
would be correctly labelled as vertical and horizontal. Furthermore, the product description of firm
A may emphasize A1’s product, rubber, and the transaction, therefore, will be classified as weakly
related. If the product description of firm A emphasizes A2’s product, tennis balls, the transaction
will be classified as strongly related. Either way, vertical relatedness goes under the radar of the
text-based measures. If firms A and B were geographically close, additional value may be created
through lower monitoring costs and familiarity with local markets and regulations.
This research presents and tests a hypothesis that relatedness is multi-dimensional. One
testable implication is that extant relatedness measures are complements; not substitutes. More
importantly, each measure contains valuation information not captured by other measures. Several
by-products of the main hypothesis are also explored. For instance, I explore the notion that the
composition of relatedness varies over time and across industries. I also employ statistical model-
building techniques to synthesize a unified measure of relatedness. Finally, I re-visit the
relationship between relatedness and wealth creation using the deductions developed in this paper.
II. Sample and Variable Construction
1. Data and Sample
I use Securities Data Company (SDC) database to obtain a list of U.S. M&A deals
completed between 19988 and 2014. Following extant literature, I require that the value of the deal
is greater than $20 million and the sample excludes acquirers or targets listed in the financial
services industry (SIC 6000 – 6999) or regulated utilities (SIC 4900 – 4999). These restrictions
result in a final sample of 14389 mergers.
2. Variable Construction
1. SIC-based and Other Dichotomous Measures of Relatedness
Following the literature, simple SIC-based measures are constructed. For each transaction
𝑑, I compute four dichotomous variables 𝑅𝑒𝑙𝑑,𝑆𝐼𝐶4, 𝑅𝑒𝑙𝑑,𝑆𝐼𝐶3, 𝑅𝑒𝑙𝑑,𝑆𝐼𝐶2, and 𝑅𝑒𝑙𝑑,𝑆𝐼𝐶1, based on 4-
SIC, 3-SIC, 2-SIC, and 1-SIC matching procedures; respectively.
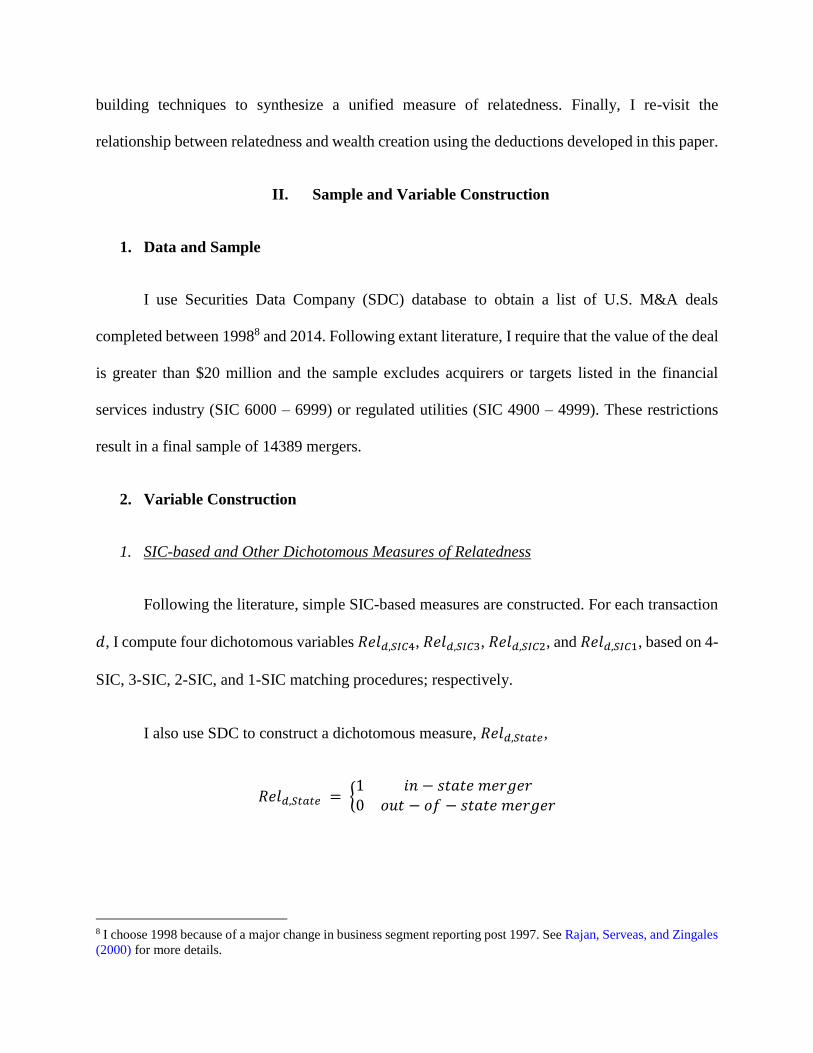
I also use SDC to construct a dichotomous measure, 𝑅𝑒𝑙𝑑,𝑆𝑡𝑎𝑡𝑒,
𝑅𝑒𝑙𝑑,𝑆𝑡𝑎𝑡𝑒 = {1 𝑖𝑛 − 𝑠𝑡𝑎𝑡𝑒 𝑚𝑒𝑟𝑔𝑒𝑟0 𝑜𝑢𝑡 − 𝑜𝑓 − 𝑠𝑡𝑎𝑡𝑒 𝑚𝑒𝑟𝑔𝑒𝑟
8 I choose 1998 because of a major change in business segment reporting post 1997. See Rajan, Serveas, and Zingales
(2000) for more details.

I also use FIC classification developed by Hoberg and Phillips (2010, 2014). First, they
calculate firm-by-firm pairwise similarity scores by parsing the product descriptions from the
firms’ product description included in the 10Ks. Next, they use the product similarity scores to
develop clusters of FIC-500, FIC-400, FIC-300, FIC-200, FIC-100, and FIC-50 related industries.
The classification is updated annually and is obtainable from Hoberg-Phillips Industry
Classification Library9. Using this database, I compute six dichotomous variables 𝑅𝑒𝑙𝑑,𝐹𝐼𝐶500,
𝑅𝑒𝑙𝑑,𝐹𝐼𝐶400, 𝑅𝑒𝑙𝑑,𝐹𝐼𝐶300, 𝑅𝑒𝑙𝑑,𝐹𝐼𝐶200, 𝑅𝑒𝑙𝑑,𝐹𝐼𝐶100, and 𝑅𝑒𝑙𝑑,𝐹𝐼𝐶50. Each variables equals 1 if the
merging firms belong to the same cluster; 0 otherwise.
2. Change in Focus
In a certain year, the 𝑁 segments (𝑖=1,2,…,N) of each multi-segment firm d are classified
into 𝑀 related industry groups (𝑗=1,2,…,M) based on their 2-digit SIC code. Let 𝐾𝑗 be the number
of segments within group 𝑗 and let 𝐷𝑅𝑗 be the relatedness of the 𝑗th industry group computed as
𝐷𝑅𝑗 = ∑ 𝑃𝑖
𝐾𝑗
𝑖=1
ln (𝑃𝑖)
where 𝑃𝑖 is the share of the 𝑖th segment assets in the assets of the industry group 𝑗. 𝐷𝑅𝑗 captures
the concentration within each related industry group. Second, the assets-based entropy measure of
relatedness of the multi-segment firm, in a certain year 𝑡, is defined as
𝐴𝐸𝑀𝑅𝑑,𝑡 = ∑ 𝐷𝑅𝑗
𝑀
𝑗=1
𝑃𝑗
9 http://alex2.umd.edu/industrydata/industryclass.htm

where 𝑃𝑗 is the share of the 𝑗th industry group assets in the assets of the firm 𝑑. 𝐴𝐸𝑀𝑅𝑑,𝑡 captures
the differentiation or diversification across the different industry groups of the firm in year 𝑡.
Then, the relatedness of a merger by firm 𝑑 is defined as
𝑅𝑒𝑙𝑑,𝐴𝑠𝑠𝑒𝑡 = 𝐴𝐸𝑀𝑅𝑑,𝑡=0 − 𝐴𝐸𝑀𝑅𝑑,𝑡=1
where 𝐴𝐸𝑀𝑅𝑑,𝑡=0 is computed at the end of the year prior to the merger completion and
𝐴𝐸𝑀𝑅𝑑,𝑡=1 is computed at the end of the year of the merger completion. A positive (negative)
𝑅𝑒𝑙𝐸𝑛𝑡𝑟𝑜𝑝𝑦 indicates a related (unrelated) merger. The magnitude of the difference captures the
level of relatedness (or unrelatedness).
In an analogous manner, a sales-based entropy measure of relatedness 𝑆𝐸𝑀𝑅𝑑 is also
computed and the following variable is calculated:
𝑅𝑒𝑙𝑑,𝑆𝑎𝑙𝑒𝑠 = 𝑆𝐸𝑀𝑅𝑑,𝑡=0 − 𝑆𝐸𝑀𝑅𝑑,𝑡=1
3. U.S. Input-Output Table:
I follow Fan and Lang (2000) who uses U.S. Input-Output Tables to define vertical
relatedness and complementarity between industries. I use 2007 purchaser prices after redefinition
table10. I use the “Use Table” which, according to the Bureau of Economic Analysis, is the most
frequently used table because of its applications to the estimates of GDP11. The Input-output
accounts show how industries interact; specifically, they show how industries provide input to,
10 Fan and Lang (2000) use tables 1982, 1987, 1992. The tables are updated every 5 years. At the time this paper
was written (late 2014), the most recent table was 2007 which was released Nov 13, 2014. 11 This is the table used by Fan and Lang (2000).

and use output from, each other to produce Gross Domestic Product (GDP). In other words, they
show the flows of the goods and services amongst industries.
For each pair of industries, the table reports 𝑎𝑖𝑗 which is the dollar value of industry 𝑖’s
output used by industry 𝑗. Let us use 𝑄𝑖 and 𝑄𝑗 to denote the dollar value of industry 𝑖 and 𝑗 total
output. Then I calculate:
𝑣𝑖𝑗 =𝑎𝑖𝑗
𝑄𝑖 , 𝑣𝑗𝑖 =
𝑎𝑗𝑖
𝑄𝑗 , 𝑉𝑖𝑗 =
𝑣𝑖𝑗 + 𝑣𝑗𝑖
2
𝑉𝑖𝑗 represents the vertical relatedness between the two industries12.
Next, I compute 𝑏𝑖𝑘 which represent the percentage of industry 𝑖’s output supplied to each
intermediate industry 𝑘. I also compute 𝑏𝑗𝑘 in analogous manner. Then the correlation between 𝑏𝑖𝑘
and 𝑏𝑗𝑘 across all 𝑘s (except for 𝑖 and 𝑗) represents the overlap between the markets to which
industries 𝑖 and 𝑗 sell.
𝑣𝑖𝑘 and 𝑣𝑗𝑘 are computed in a similar manner as the percentage of industries 𝑖’s and 𝑗’s
inputs procured from each intermediate industry k. Thus the correlation between 𝑣𝑖𝑘 and 𝑣𝑗𝑘
across all 𝑘s (except for 𝑖 and 𝑗) represents the overlap in the sectors from which industries 𝑖 and
𝑗 buy.
Next, the complementarity coefficient is defined as:
𝐶𝑖𝑗 =𝐶𝑜𝑟𝑟(𝑏𝑖𝑘 , 𝑏𝑗𝑘) + 𝐶𝑜𝑟𝑟(𝑣𝑖𝑘 , 𝑣𝑗𝑘)
2
12 Fan and Goyal (2006) follow the same procedure but take the maximum, not the average, of 𝑣𝑖𝑗 and 𝑣𝑗𝑖 .

I assign a vertical relatedness coefficient 𝑉𝑖𝑗 and a complementarity coefficient 𝐶𝑖𝑗 to each
pair of merging firms in my sample. To do that, I apply a text-based matching procedure similar
to that employed by Hoberg and Phillips (2010, 2014)13. Specifically, I match the “Industry Sector”
and “Short Business Description” fields from SDC with the U.S. Input-Output Tables. First, I use
“Industry Sector” to form word vectors for each firm in SDC. In a similar manner, I use
“Commodity/industry” description to form word vectors for each industry in the U.S. Input-Output
Tables. Vectors are then used to compute continuous measures of similarity for every pair of firm-
industry. Each score is a real number in the interval [0, 1] that describes how similar the words are
in two sectors. If the score is greater than 0.5, the firm is assigned to the corresponding industry.
If not, I repeat the procedure with work vectors created by “Short Business Description” field from
SDC14. Once the two databases have been linked, the vertical relatedness and complementarity of
an industry pair in the U.S. Input-Output Tables are assigned to the merger transaction in SDC.
Accordingly, I obtain two variables 𝑅𝑒𝑙𝑑,𝑉𝑒𝑟 and 𝑅𝑒𝑙𝑑,𝐶𝑜𝑚 which represent vertical relatedness
and complementarity of a deal 𝑑; respectively15.
4. Geographical Proximity
In M&A context, the difference in zip codes is more informative than physical distance
because zip codes reflect population density and often local regulations. I use Compustat to obtain
the addresses of acquirers and targets in my sample then I define geographical proximity as
13 They compute similarity in product description of the acquirer and the merger. Their text-based measures are also
used in this paper. 14 The algorithm I use does control for possible mismatch caused by negating expressions (e.g. except, excluding …
etc.), uninformative words (e.g. the, industry, firm, company … etc.), and word repetition (in a statement like
“computers and computer parts” the word computer is counted only once). 15 Fan and Lang (2000) use SIC code to match the two databases. I use a more complex text-matching procedure.
This approach ensures are more accurate classification and avoids the repeated use of SIC codes.

𝑅𝑒𝑙𝑑,𝑍𝐼𝑃 = −|𝑍𝐼𝑃𝐴 − 𝑍𝐼𝑃𝑇|
where 𝑍𝐼𝑃𝐴 and 𝑍𝐼𝑃𝑇 are the zip codes of the acquirer and the target. The negative sign
ensures appropriate interpretation of the difference i.e. it has a maximum value of zero indicating
that the two merging firms are located in the same zip code area.
III. Empirical Analysis
1. Descriptive Statistics and Initial Observations
2. Sorted Portfolio Tests
3. Relatedness over Time and across Industries
4. Principal Component Analysis – A Multi-factor Index of Relatedness