tourism wa: perth entertainment precincts library/research and... · 26% 27% inner suburbs western...
TRANSCRIPT

© 2017 Faster Horses. All rights reserved. Contains Faster Horses’ Confidential and Proprietary information and may not be disclosed or reproduced without the prior written consent of Faster Horses.
Faster Horses
Prepared by: Kristy Felton, Victoria Wager,
Veronica Mayne & Craig Blatch
Tourism WA:Perth Entertainment Precincts
1/06/2017

2
The need for research
2
Specific informational objectives included:• Past/intended visitation of
precincts and different licensed venue types within them
• Motivations and barriers to visit precincts/venue types
• Expectations and perceptions of precincts/venue types
• Impact of different licensed venue types on perceptions of the wider precinct
• Importance of access to public transport, taxis, Uber
• Differences by purpose of visit, travel party, demographics, etc.
Entertainment precincts of interest:
• Perth CBD
• Elizabeth Quay
• Northbridge
• Fremantle
• Scarborough
• Beaufort Street
• Subiaco
• Victoria Park
• Leederville
3
Quantitative research was undertaken via an online survey sent to the WA general public.
There were n=606 fully completed surveys. This included: • n=445 Perth metro residents • n=161 Regional residents
(South West, Great Southern, Peel, Kalgoorlie-Boulder, Wheatbelt and Mid-West regions only)
Regional respondents were screened to ensure they had visited Perth for leisure in the last 2 years.
The fieldwork was conducted between 28 April and 8 May 2017.
The data is post weighted to reflect ABS age and gender figures.
Research methodology
This document presents the findings of the research undertaken by Faster Horses.
Western Australia

26%
41%
32%
2%
Young single/couple - no kids
Family with kids at home
Older single/couple - no kids
Prefer not to say
4
Gender Metro & Regional (% of total sample)Age
4
Household TypeEmployment Status Time Lived in WA
Metro Regional
Base: Total sample n=606
50%
50%
Male
Female
4%
6%
3%
4%
29%
53%
5 years or less
6 to 10 years
11 to 15 years
16 to 20 years
More than 20 years
My whole life
46%
17%
8%
5%
18%
5%
1%
Working f/t
Working p/t
Looking after home
Studying f/t
Retired
Other
Prefer not to say
Who we spoke to
4%
5%
6%
7%
26%
27%
Inner suburbs
Western suburbs
Eastern suburbs
Perth hills
Southern suburbs
Northern suburbs
3%
4%
17%
Kalgoorlie-Boulder /
Wheatbelt
Mid-West
South West /Great Southern/
Peel34%
36%
30%
55+ yrs
35-54 yrs
18-34 yrs

5
Perth’s Entertainment Precincts: Visitation Drivers/Barriers& Overall Perceptions

74
%
52
%
51
%
48
%
38
%
38
%
32
%
30
%
28
%
56
%
43
%
28
% 32
%
24
%
25
%
20
%
22
%
16
%
Perth CBD Fremantle ElizabethQuay
Northbridge Subiaco Leederville Beaufort St VictoriaPark
Scarborough
Visited in last 6 months Will definitely visit in next 6 months
6
Insights
The larger precincts of Perth CBD and Fremantle are the most popular.
Elizabeth Quay is at a high level of popularity given its newness and the relative slimness of offer – proving that ‘if you build it they will come’.
Hopefully this means that Scarborough will liven up once the current redevelopment works are complete.
Under-35s were more likely than older age groups to have recently visited – and intend to visit – most precincts.
Over-55s were the least likely age group to have visited any precinct (except Fremantle).
Visitation was higher amongst metrothan regional residents.
Perth CBD is the most visited entertainment precinct
Base: Total sample n=606
Q: Which of the following statements best describes your involvement with each of these precincts for leisure or entertainment purposes?Q: And thinking now about the near future, how likely are you to visit each of these precincts for leisure in the next 6 months?
Recent & Planned Visitation of Entertainment Precincts(for leisure/entertainment purposes)

7
Insights
Meals are generally the largest driver of visitation (especially in Vic Park).
Elizabeth Quay is obviously still establishing itself and may be more of a tourist attraction in itself as it doesn’t dominate on any one activity.
Perth CBD clearly attracts due to its retail mix, and Northbridge on nightclubs and alcohol.
Subiaco is all about events at Subiaco Oval.
Q: What did you do when you visited? Select all that apply. (If you have visited more than once, just think about your last visit)
Reason for Last Visit (amongst visitors in last 6 months)(multiple response, adds to more than 100%)
Base: Visitors to each precinct in last 6 months: Perth CBD n=442; Fremantle n=314; Elizabeth Quay n=301; Northbridge n=283; Leederville n=226;
Subiaco n=228; Beaufort St n=184; Vic Park n=181; Scarborough n=166
Perth CBD FremantleElizabeth
QuayNorthbridge Leederville Subiaco Beaufort St Victoria Park Scarborough
Meal 49% 65% 32% 56% 61% 43% 60% 73% 50%
Coffee 26% 35% 23% 19% 36% 35% 34% 25% 29%
Shopping 53% 28% 4% 8% 15% 23% 14% 22% 8%
Drink (alcohol)
31% 24% 23% 42% 26% 13% 22% 14% 27%
Event 23% 18% 22% 20% 12% 33% 11% 6% 7%
Nightclub 6% 4% 4% 22% 7% 1% 4% 0% 2%
Lowest scoring precinct per activity
Highest scoring precinct per activity
While meals are the largest driver of visitation, each precinct attracts visitors for different reasons

Leederville Visitation Behaviour (% from each region who visited in last 6 months & plan to visit in the next 6 months)
Leederville
Southern suburbs
36% recently visited
17% intend to visit
Hills/Eastern suburbs
23% recently visited
8% intend to visit
Northern suburbs
62% recently visited
46% intend to visit
Inner/ Western suburbs
66% recently visited
45% intend to visit
Base: Total sample n=606; Inner/Western suburbs n=49; South of river n=155; North of river n=158; Hills/Eastern suburbs n=83; Regional n=161
Regional
13% recently visited
12% intend to visit
Overall
38% recently visited
25% intend to visit
Geographic proximity to a precinct is also a driver of visitation
Results that were significantly higher/lower than overall results at the 95% significance level are indicated by

Why Not? (Top 3 Reasons)
9
Insights
It is clear that geographic distance to a precinct limits visitation.
There are a few exceptions to this where barriers also include other factors.
Northbridge has safety issues and is not considered family friendly. And Elizabeth Quay is still developing.
Fremantle has accessibility issues for a small proportion of potential visitors.
Base: Total sample n=606; Definitely will not visit in next 6 months: Scarborough n=175; Beaufort St n=161; Vic Park n=154; Leederville n=127; Northbridge n=126;
Subiaco n=112; Elizabeth Quay n=87; Fremantle n=43; Perth CBD n=33
Q: And thinking now about the near future, how likely are you to visit each of these precincts for leisure in the next 6 months? Q: You mentioned you definitely won’t visit these precincts in the next 6 months. Why is that? Select all that apply.
5%7%14%
19%20%20%25%26%28%
Definitely won’t visit in next 6 months
Too far away 61%
Prefer another area 42%
Too far away 47%
Prefer another area 44%
Precinct isn’t safe 39%
Prefer another area 41%
Prefer another area 33%
Too far away 72%
Prefer another area 40%
Prefer another area 33%
Too far away 34%
Prefer another area 39%
Too far away 36%
Prefer another area 35%
Too far away 38%
No suitable venues 25%
Prefer another area 32%
No suitable venues 27%
No suitable venues 26%
No suitable venues 25%
No suitable venues 22%
No suitable venues 22%
Not family friendly 25%
No suitable venues 22%
Not big enough range of venues / entertainment
24%
Not accessible by public
transport 14%
Too far away 19%
Scarborough Beaufort St Victoria Park Leederville Northbridge Subiaco Elizabeth Quay
Fremantle Perth CBD
And conversely, distance is a key barrier to visitation of most precincts
10
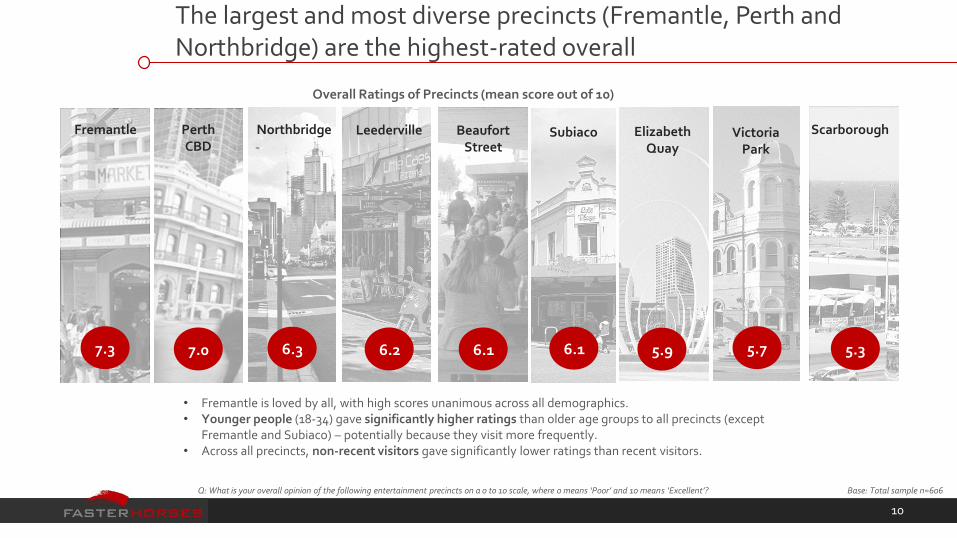
Overall Ratings of Precincts (mean score out of 10)
7.3 7.0
Fremantle Perth CBD
6.3
Northbridge
6.2
Leederville
6.1
Beaufort Street
6.1
Subiaco Elizabeth Quay
5.9
Victoria Park
5.7
Scarborough
5.3
• Fremantle is loved by all, with high scores unanimous across all demographics.• Younger people (18-34) gave significantly higher ratings than older age groups to all precincts (except
Fremantle and Subiaco) – potentially because they visit more frequently.• Across all precincts, non-recent visitors gave significantly lower ratings than recent visitors.
The largest and most diverse precincts (Fremantle, Perth and Northbridge) are the highest-rated overall
Base: Total sample n=606Q: What is your overall opinion of the following entertainment precincts on a 0 to 10 scale, where 0 means ‘Poor’ and 10 means ‘Excellent’?

11
Perth CBD, Fremantle and Northbridge also perform most strongly across the perceptual attributes
Base: Total sample n=606Q: Would you describe the following precincts as…? Select all that you think this applies to.
Perth CBD
Elizabeth Quay
Northbridge
Fremantle
Scarborough
Beaufort St
Subiaco
Victoria Park
Leederville
A place I enjoy visiting
Safe
Vibrant/lively
Good range of suitable venues & mix of activities
Easily accessible bypublic transport
Taxi/Uber readily available

12
How do precinct perceptions drive behaviour & attitudes?
Vibrant
Good range of venues & activities
Safe
Accessible by public transport
Taxis / Ubers are readily available
P6M Visitation Drivers
24
22
19
22
14
Delight Drivers
BEHAVIOURAL
Share of impact on visitation. [R2 18%]
36
35
9
12
8
Hygiene Factors
ATTITUDINAL (Overall Opinion)
22
39
21
8
9
Poor performance on these attributes drives low overall opinion (0-4/10). [R2 12%]
Strong performance on these attributes drives high overall opinion (8-10/10). [R2 17%]
• Vibrancy is primarily a driver of delight. Although its absence will frustrate people to some extent, offering a lively precinct is the most prominent way to delight people.
• Offering a good range of venues & activities is the key at all levels – fundamentally this gives people a reason to visit and is the attribute most influential in shaping precinct attitudes.
• Safety is a hygiene factor – Its absence frustrates, its presence does not act as a delighter, rather it just eliminates any frustration.
• Precinct access (by public transport/taxi/Uber) is primarily a visitation enabler. It has relatively little impact on the overall opinion of a precinct.
The range of venues and activities on offer is the most critical factor driving both precinct visitation and overall opinion.
They are fundamentally the call to action.
Catering to this need will have a natural flow-on effect with regards to vibrancy and accessibility (i.e. increased transport demand).
Entertainment Precinct Profiles
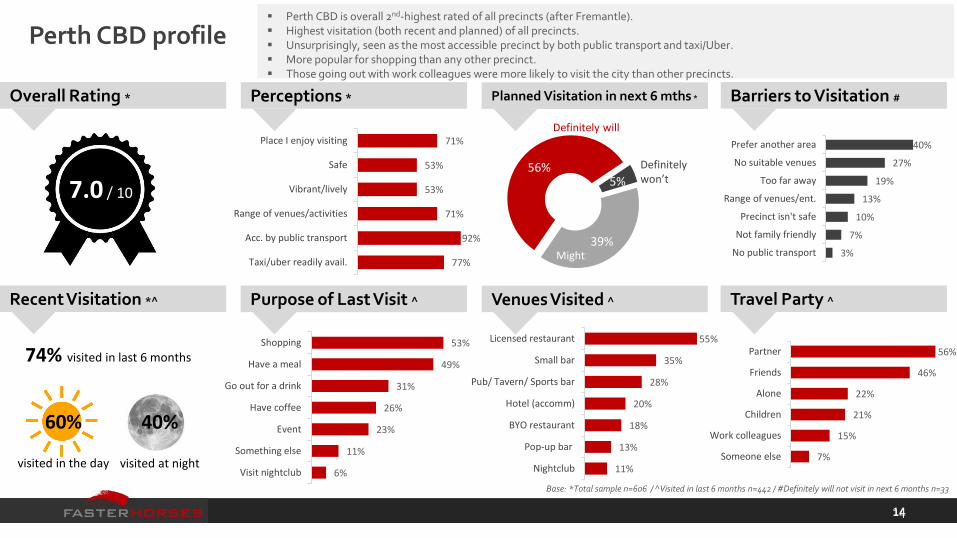
53%
49%
31%
26%
23%
11%
6%
Shopping
Have a meal
Go out for a drink
Have coffee
Event
Something else
Visit nightclub
55%
35%
28%
20%
18%
13%
11%
Licensed restaurant
Small bar
Pub/ Tavern/ Sports bar
Hotel (accomm)
BYO restaurant
Pop-up bar
Nightclub
56%
46%
22%
21%
15%
7%
Partner
Friends
Alone
Children
Work colleagues
Someone else
1414
71%
53%
53%
71%
92%
77%
Place I enjoy visiting
Safe
Vibrant/lively
Range of venues/activities
Acc. by public transport
Taxi/uber readily avail.
Base: *Total sample n=606 / ^Visited in last 6 months n=442 / #Definitely will not visit in next 6 months n=33
Perth CBD profile
40%
27%
19%
13%
10%
7%
3%
Prefer another area
No suitable venues
Too far away
Range of venues/ent.
Precinct isn't safe
Not family friendly
No public transport
7.0 / 10
74% visited in last 6 months
5%
39%
56%
Might
Definitely won’t
60%
visited in the day
40%
visited at night
Perth CBD is overall 2nd-highest rated of all precincts (after Fremantle). Highest visitation (both recent and planned) of all precincts. Unsurprisingly, seen as the most accessible precinct by both public transport and taxi/Uber. More popular for shopping than any other precinct. Those going out with work colleagues were more likely to visit the city than other precincts.
Recent Visitation *^ Purpose of Last Visit ^ Venues Visited ^ Travel Party ^
Overall Rating * Perceptions * Planned Visitation in next 6 mths * Barriers to Visitation #
Definitely will
32%
32%
23%
23%
22%
4%
4%
Have a meal
Something else
Have coffee
Go out for a drink
Event
Shopping
Visit nightclub
35%
24%
15%
9%
7%
1%
1%
Pop-up bar
Licensed restaurant
Small bar
BYO restaurant
Pub/ Tavern/ Sports bar
Hotel (accomm)
Nightclub
57%
40%
27%
13%
10%
8%
Partner
Friends
Children
Alone
Work colleagues
Someone else
1515
48%
60%
44%
33%
70%
50%
Place I enjoy visiting
Safe
Vibrant/lively
Range of venues/activities
Acc. by public transport
Taxi/uber readily avail.
Base: *Total sample n=606 / ^Visited in last 6 months n=301 / #Definitely will not visit in next 6 months n=87
Elizabeth Quay profile
33%
25%
24%
18%
12%
5%
5%
Prefer another area
No suitable venues
Range of venues/ent.
Too far away
No public transport
Not family friendly
Precinct isn't safe
5.9 / 10
51% visited in last 6 months
14%
58%
28%
Might
Definitely won’t
Definitely will
62%
visited in the day
38%
visited at night
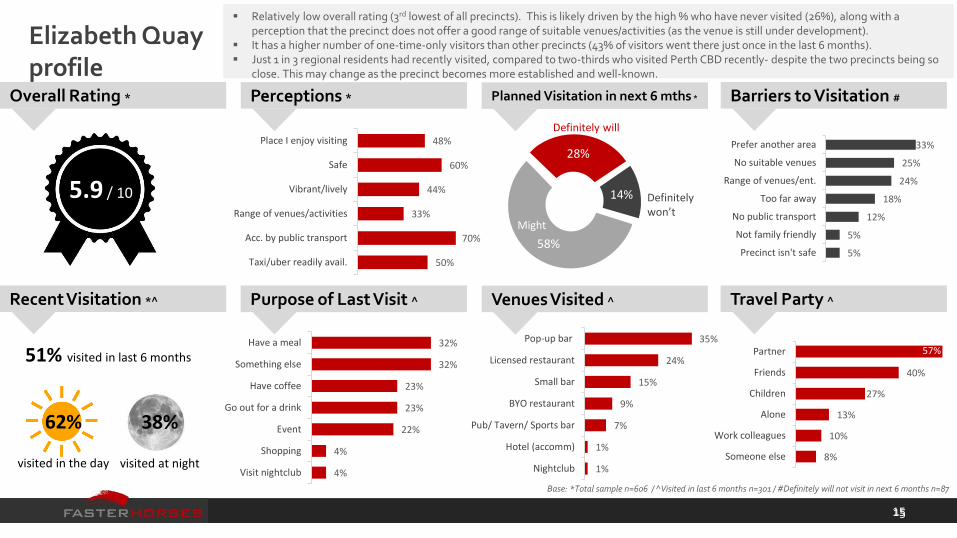
Relatively low overall rating (3rd lowest of all precincts). This is likely driven by the high % who have never visited (26%), along with a perception that the precinct does not offer a good range of suitable venues/activities (as the venue is still under development).
It has a higher number of one-time-only visitors than other precincts (43% of visitors went there just once in the last 6 months). Just 1 in 3 regional residents had recently visited, compared to two-thirds who visited Perth CBD recently- despite the two precincts being so
close. This may change as the precinct becomes more established and well-known.
Recent Visitation *^ Purpose of Last Visit ^ Venues Visited ^ Travel Party ^
Overall Rating * Perceptions * Planned Visitation in next 6 mths * Barriers to Visitation #
56%
42%
22%
20%
19%
8%
7%
Have a meal
Go out for a drink
Visit nightclub
Event
Have coffee
Shopping
Something else
46%
38%
30%
28%
27%
21%
6%
Licensed restaurant
Small bar
BYO restaurant
Pub/ Tavern/ Sports bar
Nightclub
Pop-up bar
Hotel (accomm)
55%
54%
15%
14%
11%
5%
Friends
Partner
Children
Alone
Work colleagues
Someone else
1616
42%
18%
68%
60%
68%
67%
Place I enjoy visiting
Safe
Vibrant/lively
Range of venues/activities
Acc. by public transport
Taxi/uber readily avail.
Base: *Total sample n=606 / ^Visited in last 6 months n=283 / #Definitely will not visit in next 6 months n=126
Northbridge profile
39%
35%
25%
23%
20%
3%
3%
Precinct isn't safe
Prefer another area
Not family friendly
No suitable venues
Too far away
No public transport
Range of venues/ent.
6.3 / 10
48% visited in last 6 months
20%
48%
32%
Might
Definitely won’t
Definitely will
31%
visited in the day
69%
visited at night
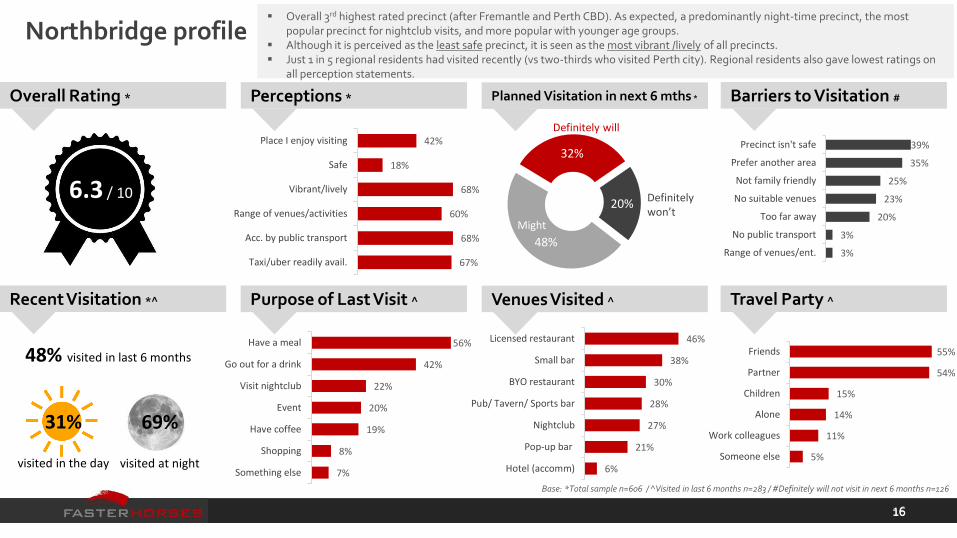
Overall 3rd highest rated precinct (after Fremantle and Perth CBD). As expected, a predominantly night-time precinct, the most popular precinct for nightclub visits, and more popular with younger age groups.
Although it is perceived as the least safe precinct, it is seen as the most vibrant /lively of all precincts. Just 1 in 5 regional residents had visited recently (vs two-thirds who visited Perth city). Regional residents also gave lowest ratings on
all perception statements.
Recent Visitation *^ Purpose of Last Visit ^ Venues Visited ^ Travel Party ^
Overall Rating * Perceptions * Planned Visitation in next 6 mths * Barriers to Visitation #

65%
35%
28%
24%
18%
12%
4%
Have a meal
Have coffee
Shopping
Go out for a drink
Event
Something else
Visit nightclub
57%
33%
27%
26%
11%
7%
7%
Licensed restaurant
Pub/ Tavern/ Sports bar
BYO restaurant
Small bar
Pop-up bar
Hotel (accomm)
Nightclub
53%
44%
24%
14%
8%
4%
Partner
Friends
Children
Alone
Someone else
Work colleagues
1717
74%
58%
67%
78%
73%
64%
Place I enjoy visiting
Safe
Vibrant/lively
Range of venues/activities
Acc. by public transport
Taxi/uber readily avail.
Base: *Total sample n=606 / ^Visited in last 6 months n=324 / #Definitely will not visit in next 6 months n=43
Fremantle profile
72%
32%
14%
7%
6%
5%
0%
Too far away
Prefer another area
No public transport
Precinct isn't safe
Range of venues/ent.
No suitable venues
Not family friendly
7.3 / 10
52% visited in last 6 months
7%
50%
43%
Might
Definitely won’t
Definitely will
73%
visited in the day
27%
visited at night
Overall the highest-rated precinct, and the most enjoyable precinct to visit. High ratings are consistent across all age groups. Visitation rates (both recent and planned) are very high, second only to Perth CBD. Most likely of all precincts to be seen as offering a good range of suitable venues/mix of activities – driving the high visitation rates.
Recent Visitation *^ Purpose of Last Visit ^ Venues Visited ^ Travel Party ^
Overall Rating * Perceptions * Planned Visitation in next 6 mths * Barriers to Visitation #
50%
29%
27%
23%
8%
7%
2%
Have a meal
Have coffee
Go out for a drink
Something else
Shopping
Event
Visit nightclub
48%
21%
16%
16%
15%
6%
1%
Licensed restaurant
Small bar
Pub/ Tavern/ Sports bar
Hotel (accomm)
BYO restaurant
Pop-up bar
Nightclub
50%
44%
24%
14%
4%
3%
Partner
Friends
Children
Alone
Someone else
Work colleagues
1818
34%
41%
20%
21%
17%
43%
Place I enjoy visiting
Safe
Vibrant/lively
Range of venues/activities
Acc. by public transport
Taxi/uber readily avail.
Base: *Total sample n=606 / ^Visited in last 6 months n=166 / #Definitely will not visit in next 6 months n=175
Scarborough profile
61%
33%
26%
14%
11%
5%
5%
Too far away
Prefer another area
No suitable venues
Range of venues/ent.
No public transport
Not family friendly
Precinct isn't safe
5.3 / 10
28% visited in last 6 months
28%56%
16%
MightDefinitely won’t
Definitely will
76%
visited in the day
24%
visited at night
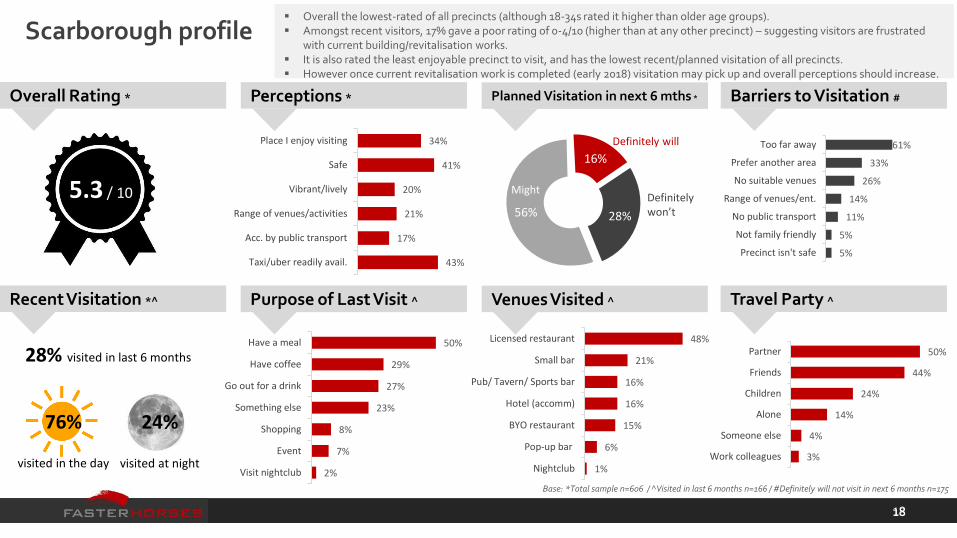
Overall the lowest-rated of all precincts (although 18-34s rated it higher than older age groups). Amongst recent visitors, 17% gave a poor rating of 0-4/10 (higher than at any other precinct) – suggesting visitors are frustrated
with current building/revitalisation works. It is also rated the least enjoyable precinct to visit, and has the lowest recent/planned visitation of all precincts. However once current revitalisation work is completed (early 2018) visitation may pick up and overall perceptions should increase.
Recent Visitation *^ Purpose of Last Visit ^ Venues Visited ^ Travel Party ^
Overall Rating * Perceptions * Planned Visitation in next 6 mths * Barriers to Visitation #

60%
34%
22%
14%
11%
7%
4%
Have a meal
Have coffee
Go out for a drink
Shopping
Event
Something else
Visit nightclub
50%
35%
29%
25%
8%
6%
2%
Licensed restaurant
Small bar
BYO restaurant
Pub/ Tavern/ Sports bar
Pop-up bar
Nightclub
Hotel (accomm)
53%
45%
17%
16%
11%
8%
Partner
Friends
Alone
Children
Work colleagues
Someone else
1919
37%
48%
37%
33%
28%
50%
Place I enjoy visiting
Safe
Vibrant/lively
Range of venues/activities
Acc. by public transport
Taxi/uber readily avail.
Base: *Total sample n=606 / ^Visited in last 6 months n=184 / #Definitely will not visit in next 6 months n=161
Beaufort Street profile
42%
34%
25%
8%
6%
6%
5%
Prefer another area
Too far away
No suitable venues
No public transport
Not family friendly
Range of venues/ent.
Precinct isn't safe
6.1 / 10
32% visited in last 6 months
26%54%
20%
MightDefinitely won’t
Definitely will
51%
visited in the day
49%
visited at night
One of the 3 least-visited precincts (after Scarborough and Victoria Park) – just one-third had visited in the last 6 months. Proximity to the area plays a big part in visitation. Those living closest (inner/western suburbs) are most likely to have visited
recently (60%), compared to just 25% from the southern suburbs. Few SOR residents believe the precinct is vibrant/lively or has a good range of venues/activities – likely contributing to their low visitation.
Recent Visitation *^ Purpose of Last Visit ^ Venues Visited ^ Travel Party ^
Overall Rating * Perceptions * Planned Visitation in next 6 mths * Barriers to Visitation #
43%
35%
33%
23%
13%
10%
1%
Have a meal
Have coffee
Event
Shopping
Go out for a drink
Something else
Visit nightclub
42%
24%
23%
15%
5%
4%
3%
Licensed restaurant
Pub/ Tavern/ Sports bar
BYO restaurant
Small bar
Hotel (accomm)
Pop-up bar
Nightclub
52%
36%
22%
17%
8%
5%
Partner
Friends
Alone
Children
Someone else
Work colleagues
2020
43%
62%
35%
40%
58%
56%
Place I enjoy visiting
Safe
Vibrant/lively
Range of venues/activities
Acc. by public transport
Taxi/uber readily avail.
Base: *Total sample n=606 / ^Visited in last 6 months n=228 / #Definitely will not visit in next 6 months n=112
Subiaco profile
41%
38%
22%
10%
5%
5%
1%
Prefer another area
Too far away
No suitable venues
Range of venues/ent.
Not family friendly
No public transport
Precinct isn't safe
6.1 / 10
38% visited in last 6 months
19%
57%
24%
Might
Definitely won’t
Definitely will
61%
visited in the day
39%
visited at night
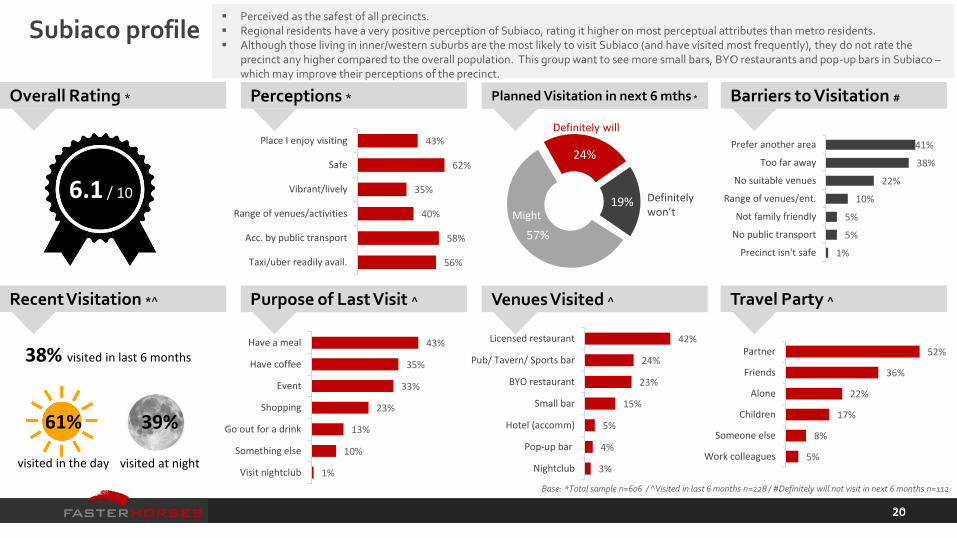
Perceived as the safest of all precincts. Regional residents have a very positive perception of Subiaco, rating it higher on most perceptual attributes than metro residents. Although those living in inner/western suburbs are the most likely to visit Subiaco (and have visited most frequently), they do not rate the
precinct any higher compared to the overall population. This group want to see more small bars, BYO restaurants and pop-up bars in Subiaco –which may improve their perceptions of the precinct.
Recent Visitation *^ Purpose of Last Visit ^ Venues Visited ^ Travel Party ^
Overall Rating * Perceptions * Planned Visitation in next 6 mths * Barriers to Visitation #

73%
25%
22%
14%
9%
6%
0%
Have a meal
Have coffee
Shopping
Go out for a drink
Something else
Event
Visit nightclub
50%
45%
27%
10%
6%
2%
0%
BYO restaurant
Licensed restaurant
Pub/ Tavern/ Sports bar
Small bar
Pop-up bar
Hotel (accomm)
Nightclub
48%
48%
22%
16%
11%
8%
Partner
Friends
Children
Alone
Someone else
Work colleagues
2121
34%
45%
27%
29%
34%
49%
Place I enjoy visiting
Safe
Vibrant/lively
Range of venues/activities
Acc. by public transport
Taxi/uber readily avail.
Base: *Total sample n=606 / ^Visited in last 6 months n=181 / #Definitely will not visit in next 6 months n=154
Victoria Park profile
47%
39%
22%
13%
5%
4%
3%
Too far away
Prefer another area
No suitable venues
Range of venues/ent.
Precinct isn't safe
No public transport
Not family friendly
5.7 / 10
30% visited in last 6 months
25%53%
22%
MightDefinitely won’t
Definitely will
47%
visited in the day
53%
visited at night
Overall the 2nd-lowest rated precinct (after Scarborough) and equal least enjoyable place to visit (with Scarborough) . This is likely driven by perceived lack of vibrancy/liveliness, limited range of venues/activities, and simply being too far away. Three-quarters of visitors had a meal there (more than at any other precinct). SOR suburbs are the biggest draw area for Victoria Park, with this group giving the most positive ratings to the precinct.
Overall Rating * Perceptions * Planned Visitation in next 6 mths * Barriers to Visitation #
Recent Visitation *^ Purpose of Last Visit ^ Venues Visited ^ Travel Party ^

56%
32%
29%
22%
9%
7%
1%
Licensed restaurant
BYO restaurant
Small bar
Pub/ Tavern/ Sports bar
Nightclub
Pop-up bar
Hotel (accomm)
61%
36%
26%
15%
12%
9%
7%
Have a meal
Have coffee
Go out for a drink
Shopping
Event
Something else
Visit nightclub
51%
47%
20%
19%
8%
4%
Friends
Partner
Alone
Children
Work colleague
Someone else
2222
Recent Visitation *^
42%
53%
47%
42%
52%
58%
Place I enjoy visiting
Safe
Vibrant/lively
Range of venues/activities
Acc. by public transport
Taxi/uber readily avail.
Base: *Total sample n=606 / ^Visited in last 6 months n=226 / #Definitely will not visit in next 6 months n=127
Leederville profile
44%
36%
22%
6%
6%
5%
4%
Prefer another area
Too far away
No suitable venues
Precinct isn't safe
No public transport
Range of venues/ent.
Not family friendly
6.2 / 10
38% visited in last 6 months
20%
55%
25%
Might
Definitely won’t
Definitely will
50%
visited in the day
50%
visited at night
Although it has a reasonable overall rating, just 4 in 10 say they enjoy visiting. Those living closest to Leederville (NOR and inner/western suburbs) are the most frequent visitors. 22% of regional residents have never visited (vs just 7% of metro residents). They appear to have a low opinion of the precinct (giving
very low ratings on all perception statements). A perceived limited range of venues/activities appears to be the key barrier to visitation for this group.
Purpose of Last Visit ^ Venues Visited ^ Travel Party ^
Overall Rating * Perceptions * Planned Visitation in next 6 mths * Barriers to Visitation #

Venue Types:Choice Drivers, Visitation & Overall Perceptions

24
Insights
Safety is more of a concern to women (71%) than men (60%).
Good reviews are more important to women (41%) than to men (29%)
Alcohol is a much bigger consideration for men than women –both whether it is served, and the type served.
Those aged 35-54 are more likely than other ages to say “caters well to children” is very important.
Q: How important are these considerations for you when deciding which type of venue to visit within one of the Perth entertainment precincts?
Importance of Different Factors When Choosing a Venue
Base: Total sample n=606
69%
65%
52%
51%
35%
26%
21%
20%
16%
16%
5%
Value for money
Safety of the venue
The venue’s atmosphere
Whether food is served
Good reviews/popular
Whether alcohol is served
The type of alcohol served
Opening hours (e.g. is open late)
Live music or other live ent.
Caters well to children
A brand new venue
% very important
Value for money, safety and atmosphere are the strongest drivers of venue choice

66
%
45%
43%
43%
29
%
21%
18%
50%
28
% 34%
31%
17%
18%
11%
Licensedrestaurant
Pub/ Tavern/Sports bar
BYO restaurant Small bar Pop-up bar orseasonal venue
Hotel (withaccom)
Nightclub
Visited in last 6 months Will definitely visit in next 6 months
25
Insights
Once again visitation was highest amongst those aged 18-34.
And as we would expect, visitation (both recent and planned) was higher for metro residents compared to regional residents.
Licensed restaurants are the most popular of all venue types
Base: Total sample n=606
Q: How many times did you visit each type of venue across all precincts in the last 6 months? Q: In the next 6 months, how likely are you to visit these venue types within one of the Perth entertainment precincts?
Recent & Planned Visitation of Venues (across all precincts)
Bar

20%
30%30%
40%43%
46%46%
NightclubPub/ Tavern/Sports bar
Hotel (withaccomm)
Licensedrestaurant
BYO restaurantSmall barPop-up bar orseasonal venue
26
Insights
Across all entertainment precincts, people most want to see more pop-up bars and small bars. There is strongest desire to see more of both of these venue types in Elizabeth Quay, Perth CBD and Fremantle.
This is on trend for entertainment precincts nationally – a more informal culture, with a move from the traditional hotel, tavern and nightclub.
Which Venues do People Want to See More of in Perth’s Entertainment Precincts?(net figure across all precincts)
Q: Are there any venue types you’d like to see more of in these entertainment precincts? Base: Total sample n=606
But there is a desire for more pop-up and small bars
Bar

27
Insights
Women are significantly more likely than men to say pop-up bars add vibrancy to a precinct and makes them more likely to visit a precinct.
On the other hand, men are significantly more likely than women to say a pub/tavern/sports bar adds vibrancy and makes them more likely to visit.
And different venues would encourage each age group to visit a precinct – pop-up bars for under-35s, licensed restaurants for 35-54s, and BYO restaurants for over-55s.
This clearly showcases the importance of creating precincts with a range of venue types to cater to all demographics.
And pop-up/small bars add vibrancy to an entertainment precinct
Base: Total sample n=606Q: Would you describe the following precincts as…? Select all that you think this applies to.
Licensed restaurant
BYO restaurant
Small bar
Pop-up bar orseasonal venue
Pub/ Tavern/ Sportsbar
Hotel (on-siteaccomm)
Nightclub
The kind of venue I enjoy visiting
Adds to the vibrancy of an entertainment precinct
Makes me more likely to visit an entertainment precinct

$55 $57 $57 $60 $66
$81
$95
Small barPub/ Tavern/Sports bar
Pop-up bar orseasonal venue
BYO restaurantNightclubLicensedrestaurant
Hotel (withaccomm)
28
Insights
Spend was lowest at small bars, likely because they are typically a drinks-only venue and people tend to visit prior to going elsewhere for a meal or more drinks.
Average Spend During Last Visit
Q: Approximately how much did you spend during your visit?
Spend was highest at hotels and licensed restaurants
Bar
Base: Visitors to each venue type in last 6 months: Pop-up bar n=169; Nightclub n=98; Hotel n=128; Pub/tavern n=261; Small bar n=250; Licensed restaurant n=392; BYO restaurant n=263

29
• Venue visitation is highest amongst this age group (both recent and planned).
In particular they are significantly more likely than older age groups to have visited small bars, pubs, pop-up bars andnightclubs.
And significantly more likely to intend to visit any venue type (except BYO restaurants and hotels).
• Their most-commonly visited venues in the last 6 months:
licensed restaurants (74% visited)
small bars (62%)
pubs/taverns/sports bars (61%).
• They were the biggest spenders at pubs, small bars and pop-up bars.
• Their most important considerations when choosing a venue:
value for money
atmosphere (different to other age groups)
safety.
• They are more likely than older age groups to consider live music, late opening hours and whether alcohol is served as very important.
Venue visitation patterns differ significantly by age group. Amongst those aged 18-34 years…

30
• The most likely age group to visit precincts with children (particularly Elizabeth Quay and Fremantle) and to visit venues with children (mainly BYO and licensed restaurants).
• Accordingly, they are more likely than other age groups to consider “caters well to children” important when choosing a venue.
• Their most-commonly visited venues in the last 6 months:
licensed restaurants (66% visited)
pubs/taverns/sports bars (43%)
small bars (42%)
• Their most important considerations when choosing a venue to visit:
value for money
safety
whether food is served.
Amongst those aged 35-54 years…

31
• Least likely age group to have recently visited any precinct (except Fremantle) or venue type (except BYO restaurants and hotels).
• Their most-commonly visited venues in the last 6 months:
licensed restaurants (55% visited)
BYO restaurants (45%)
pubs/taverns/sports bars (30%)
• They were the biggest spenders at licensed restaurants, BYO restaurants and hotels.
• Their most important considerations when choosing a venue to visit were the same as for 35-54s:
value for money
safety
whether food is served
And amongst those aged 55+ years…
Venue Profiles

0%
4%
19%
21%
25%
26%
6%
Nothing
$25 or less
$26-$50
$51-$75
$76-$100
Over $100
Don't know
69%
56%
24%
11%
6%
5%
Partner
Friends
Children
Work colleagues
Someone else
Alone
78%
61%
58%
Venue I enjoy visiting
Adds to vibrancy of aprecinct
Makes me more likely tovisit a precinct
17%18%18%18%19%19%19%20%27%
40%
33
Support More of This Venue at Each Precinct * Planned Visitation in Next 6 mths *
33
Base: *Total sample n=606 / ^Visited in last 6 months n=397 / #Definitely will not visit in next 6 months n=35
Licensed restaurants profile
Barriers to Visitation #
40%
27%
24%
5%
Not interested in this typeof venue
Does not suit my needs
Won’t get a chance to visit in that time
Not available in theprecinct I like to go to
66% visited in last 6 months
6%
44%
50%
Might
Definitely won’t
Definitely will
Highest recent/planned visitation of all venue types, and rated most enjoyable venue type to visit. Also the most-frequently visited venue type (most likely to have been visited 4+ times in the last 6 months). The venue type most likely to encourage precinct visitation. 18-34s in particular support more licensed restaurants (across all precincts).
Perceptions * Recent Visitation * Spend During Last Visit ^ Travel Party ^

0%
14%
32%
26%
15%
10%
4%
Nothing
$25 or less
$26-$50
$51-$75
$76-$100
Over $100
Don't know
62%
54%
24%
9%
8%
7%
Partner
Friends
Children
Work colleagues
Alone
Someone else
70%
56%
57%
Venue I enjoy visiting
Adds to vibrancy of aprecinct
Makes me more likely tovisit a precinct
20%22%23%23%23%24%24%24%29%43%
34
Support More of This Venue at Each Precinct * Planned Visitation in Next 6 mths *
34
Base: *Total sample n=606 / ^Visited in last 6 months n=262 / #Definitely will not visit in next 6 months n=61
BYO restaurants profile
Barriers to Visitation #
44%
33%
17%
12%
Not interested in this typeof venue
Does not suit my needs
Won’t get a chance to visit in that time
Not available in theprecinct I like to go to
43% visited in last 6 months
10%
56%
34%
Might
Definitely won’t
Definitely will
There is slightly higher support for more BYO restaurants at Elizabeth Quay compared to other precincts. Recent and planned visitation was similar across all age groups. After licensed restaurants, they are the 2nd most likely venue type to encourage precinct visitation, and 2nd most enjoyable
venue type to visit.
Perceptions * Recent Visitation * Spend During Last Visit ^ Travel Party ^
1%
23%
35%
15%
10%
8%
8%
Nothing
$25 or less
$26-$50
$51-$75
$76-$100
Over $100
Don't know
62%
58%
20%
14%
10%
7%
Friends
Partner
Children
Work colleagues
Alone
Someone else
54%
71%
53%
Venue I enjoy visiting
Adds to vibrancy of aprecinct
Makes me more likely tovisit a precinct
20%21%21%22%22%22%27%28%
33%
46%
35
Support More of This Venue at Each Precinct * Planned Visitation in Next 6 mths *
35
Base: *Total sample n=606 / ^Visited in last 6 months n=177 / #Definitely will not visit in next 6 months n=150
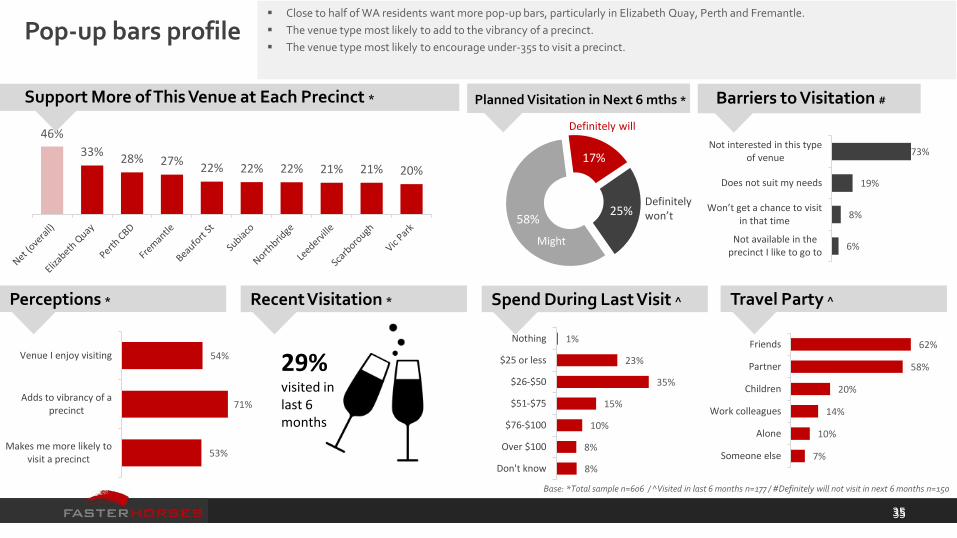
Pop-up bars profile
Barriers to Visitation #
73%
19%
8%
6%
Not interested in this typeof venue
Does not suit my needs
Won’t get a chance to visit in that time
Not available in theprecinct I like to go to
29% visited in last 6 months
25%58%
17%
Might
Definitely won’t
Definitely will
Close to half of WA residents want more pop-up bars, particularly in Elizabeth Quay, Perth and Fremantle.
The venue type most likely to add to the vibrancy of a precinct.
The venue type most likely to encourage under-35s to visit a precinct.
Perceptions * Recent Visitation * Spend During Last Visit ^ Travel Party ^

1%
17%
36%
21%
10%
9%
8%
Nothing
$25 or less
$26-$50
$51-$75
$76-$100
Over $100
Don't know
68%
52%
18%
6%
4%
4%
Friends
Partner
Work colleagues
Children
Alone
Someone else
56%
69%
49%
Venue I enjoy visiting
Adds to vibrancy of aprecinct
Makes me more likely tovisit a precinct
21%21%22%22%22%22%23%24%28%
46%
36
Support More of This Venue at Each Precinct * Planned Visitation in Next 6 mths *
36
Base: *Total sample n=606 / ^Visited in last 6 months n=263 / #Definitely will not visit in next 6 months n=132
Small bars profile
Barriers to Visitation #
75%
26%
7%
4%
Not interested in this typeof venue
Does not suit my needs
Won’t get a chance to visit in that time
Not available in theprecinct I like to go to
43% visited in last 6 months
22%
47%
31%
Might
Definitely won’t
Definitely will
18-34s particularly strong supporters of more small bars in Perth CBD (33%), Northbridge (29%), and Leederville (28%). After pop-up bars, the 2nd most likely venue type to add to a precinct’s vibrancy. The most common venue type to visit with work colleagues.
Perceptions * Recent Visitation * Spend During Last Visit ^ Travel Party ^

1%
17%
29%
27%
11%
10%
4%
Nothing
$25 or less
$26-$50
$51-$75
$76-$100
Over $100
Don't know
68%
50%
16%
10%
7%
5%
Friends
Partner
Work colleagues
Children
Alone
Someone else
45%
44%
32%
Venue I enjoy visiting
Adds to vibrancy of aprecinct
Makes me more likely tovisit a precinct
10%11%13%13%13%14%14%14%15%
30%
37
Support More of This Venue at Each Precinct * Planned Visitation in Next 6 mths *
37
Base: *Total sample n=606 / ^Visited in last 6 months n=273 / #Definitely will not visit in next 6 months n=154
Pub/Tavern/Sports Bar profile
Barriers to Visitation #
77%
28%
7%
2%
Not interested in this typeof venue
Does not suit my needs
Won’t get a chance to visit in that time
Not available in theprecinct I like to go to
45% visited in last 6 months
26%
46%
28%
Might
Definitely won’t
Definitely will
2nd-most visited venue type (after licensed restaurants). Men are more likely than women to have visited pubs (51% vs 39%), to support more pubs across all precincts, and to
say pubs encourage them to visit a precinct/add to a precinct’s vibrancy.
Perceptions * Recent Visitation * Spend During Last Visit ^ Travel Party ^
5%
4%
9%
13%
11%
52%
6%
Nothing
$25 or less
$26-$50
$51-$75
$76-$100
Over $100
Don't know
68%
30%
17%
10%
7%
6%
Partner
Friends
Children
Work colleagues
Alone
Someone else
32%
28%
18%
Venue I enjoy visiting
Adds to vibrancy of aprecinct
Makes me more likely tovisit a precinct
7%7%8%9%10%12%14%14%15%
30%
38
Support More of This Venue at Each Precinct * Planned Visitation in Next 6 mths *
38
Base: *Total sample n=606 / ^Visited in last 6 months n=130 / #Definitely will not visit in next 6 months n=221
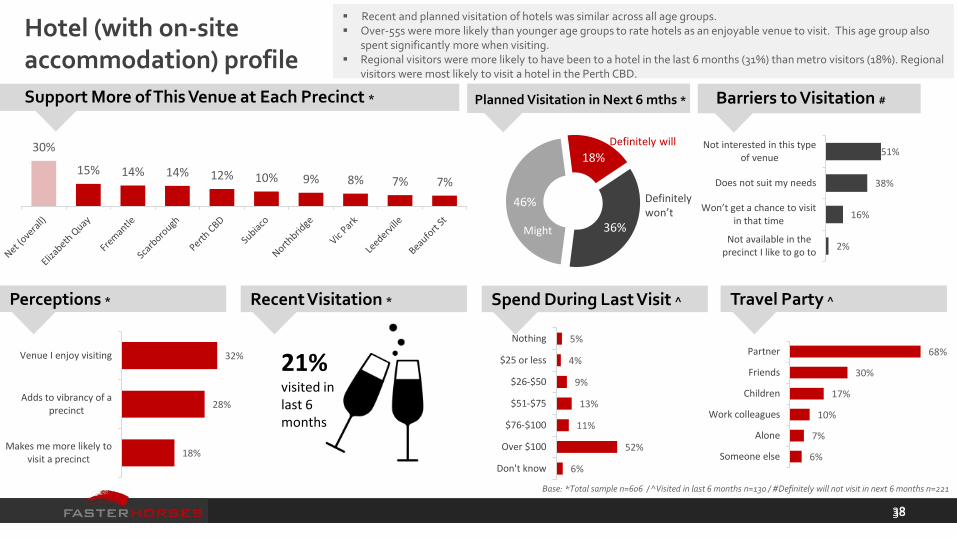
Hotel (with on-site accommodation) profile
Barriers to Visitation #
51%
38%
16%
2%
Not interested in this typeof venue
Does not suit my needs
Won’t get a chance to visit in that time
Not available in theprecinct I like to go to
21% visited in last 6 months
36%
46%
18%
Might
Definitely won’t
Definitely will
Recent and planned visitation of hotels was similar across all age groups. Over-55s were more likely than younger age groups to rate hotels as an enjoyable venue to visit. This age group also
spent significantly more when visiting. Regional visitors were more likely to have been to a hotel in the last 6 months (31%) than metro visitors (18%). Regional
visitors were most likely to visit a hotel in the Perth CBD.
Perceptions * Recent Visitation * Spend During Last Visit ^ Travel Party ^

1%
18%
26%
14%
18%
18%
5%
Nothing
$25 or less
$26-$50
$51-$75
$76-$100
Over $100
Don't know
83%
35%
14%
8%
6%
Friends
Partner
Work colleagues
Someone else
Alone
Children
14%
27%
9%
Venue I enjoy visiting
Adds to vibrancy of aprecinct
Makes me more likely tovisit a precinct
5%6%6%7%8%8%9%9%10%
20%
39
Support More of This Venue at Each Precinct * Planned Visitation in Next 6 mths *
39
Base: *Total sample n=606 / ^Visited in last 6 months n=110 / #Definitely will not visit in next 6 months n=392
Nightclubs profile
Barriers to Visitation #
86%
19%
4%
0%
Not interested in this typeof venue
Does not suit my needs
Won’t get a chance to visit in that time
Not available in theprecinct I like to go to
18% visited in last 6 months
65%
24% 11%
Might
Definitely won’t
Definitely will
There is very low support for seeing more nightclubs at any Perth entertainment precinct. Lowest visitation of all venue types (both recent and planned). 18-34s were the most likely age group to say nightclubs are enjoyable to visit.
Perceptions * Recent Visitation * Spend During Last Visit ^ Travel Party ^

Key Findings

41
Key findings
• Offering a good range of venues and activities is the most critical factor driving both precinct visitation and overall opinion. Fundamentally this gives people a reason to visit and is the attribute most influential in shaping precinct attitudes. This is the call to action.
• Vibrancy is primarily a driver of delight. Although its absence will frustrate people to some extent, offering a lively precinct is the most prominent way to delight people.
• Safety is a hygiene factor – Its absence frustrates, its presence does not act as a delighter, rather it just eliminates any frustration.
• Precinct access is primarily a visitation enabler (public transport/ taxi/Uber). It has relatively little impact on the overall opinion of a precinct.
Overall opinion and visitation of precincts are driven by having a good range of venues & activities – while vibrancy is a driver of delight

42
Key findings
• Specific venues are most likely to encourage different age groups to visit an entertainment precinct:
pop-up bars for under-35s,
licensed restaurants for 35-54s
BYO restaurants for over-55s
• Over-55s are also the biggest spenders at BYO (and licensed) restaurants – making it well and truly worthwhile to encourage their patronage!
• Pop-up bars appeal more to women than men – while pubsappeal more to men.
Including a range of venue types within an entertainment precinct will also ensure visitation across all demographic groups
43
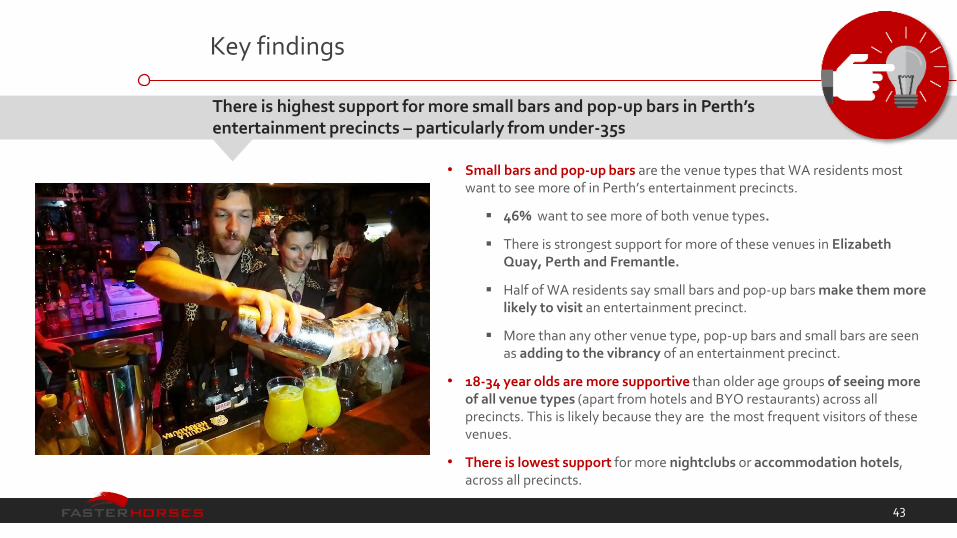
Key findings
• Small bars and pop-up bars are the venue types that WA residents most want to see more of in Perth’s entertainment precincts.
46% want to see more of both venue types.
There is strongest support for more of these venues in Elizabeth Quay, Perth and Fremantle.
Half of WA residents say small bars and pop-up bars make them more likely to visit an entertainment precinct.
More than any other venue type, pop-up bars and small bars are seen as adding to the vibrancy of an entertainment precinct.
• 18-34 year olds are more supportive than older age groups of seeing more of all venue types (apart from hotels and BYO restaurants) across all precincts. This is likely because they are the most frequent visitors of these venues.
• There is lowest support for more nightclubs or accommodation hotels, across all precincts.
There is highest support for more small bars and pop-up bars in Perth’s entertainment precincts – particularly from under-35s
Appendix:Precinct Perceptions:
Differences by Locals & Non-Locals

Perth CBD Visitation Behaviour (% from each region who visited in last 6 months & plan to visit in the next 6 months)
Perth CBD
Southern suburbs
77% recently visited
55% intend to visit
Hills/Eastern suburbs
66% recently visited
42% intend to visit
Northern suburbs
81% recently visited
59% intend to visit
Inner/ Western suburbs
87% recently visited
69% intend to visit
Base: Total sample n=606; Inner/Western suburbs n=49; South of river n=155; North of river n=158; Hills/Eastern suburbs n=83; Regional n=161
Regional
64% recently visited
54% intend to visit
Overall
74% recently visited
56% intend to visit

46
Perth CBD profile
Overall Rating Top Barriers to Visitation
Perceptions
77%66%
54%
80%93%
83%71%
51% 56%67%
92%76%
67%52% 55%
74%
94%79%
62%50%
41%
61%
85%70%
78%
56% 54%
75%91%
77%71%
53% 53%
71%
92%77%
Place I enjoy visiting Safe Vibrant/Lively Range of venues/activities Accessible by publictransport
Taxi/Uber readily available
7.4 6.9 6.8 6.67.3 7.0
Although visitation of Perth CBD is high across residents of all regions, inner/western suburbs residents are most likely to visit, and have also visited most frequently (62% visited 4+ times in the last 6 months).
Inner/western and regional residents are the most likely to say Perth is a place they enjoy visiting, and give the highest overall ratings. Hills/eastern suburbs residents – who live furthest from the city – are least likely to intend to visit, and rate Perth CBD lowest on all
perceptual statements – giving particularly low ratings to 'vibrancy/liveliness'.
Base: Total sample n=606; Inner/Western suburbs n=49; South of river n=155; North of river n=158; Hills/Eastern suburbs n=83; Regional n=161
Inner/Western suburbs South of river North of river Hills/Eastern suburbs OverallRegional
(n=1) (n=9) (n=12) (n=8) (n=2)
• Prefer another area• Not family friendly
• Too far away• Prefer another area• Not big enough
range of venues/ entertainment
• No suitable venues• Prefer another area• Too far away
• Prefer another area• Isn't safe• No suitable venues
• Too far away• Prefer another area• Isn't safe

Elizabeth Quay Visitation Behaviour (% from each region who visited in last 6 months & plan to visit in the next 6 months)
Elizabeth Quay
Southern suburbs
60% recently visited
31% intend to visit
Hills/Eastern suburbs
44% recently visited
21% intend to visit
Northern suburbs
56% recently visited
26% intend to visit
Inner/ Western suburbs
69% recently visited
38% intend to visit
Base: Total sample n=606; Inner/Western suburbs n=49; South of river n=155; North of river n=158; Hills/Eastern suburbs n=83; Regional n=161
Regional
33% recently visited
27% intend to visit
Overall
51% recently visited
28% intend to visit

48
Elizabeth Quay profile
Overall Rating
Perceptions
43%
65%
25% 25%
68%59%54% 57% 50%
37%
73%
49%46%60%
48%33%
80%
50%43%
61%
32% 26%
60%47%48%
61%46%
36%
61%48%48%
60%44%
33%
70%
50%
Place I enjoy visiting Safe Vibrant/Lively Range of venues/activities Accessible by publictransport
Taxi/Uber readily available
6 6.25.6 5.1
6.4 5.9
Just 33% of regional residents had recently visited Elizabeth Quay. In comparison, 64% had visited Perth CBD recently. Clearly, Elizabeth Quay isn't currently attracting regional residents who visit the city, despite the two precincts being so close. This may change as the precinct becomes more established and well-known.
Inner/Western suburbs South of river North of river Hills/Eastern suburbs OverallRegional
Base: Total sample n=606; Inner/Western suburbs n=49; South of river n=155; North of river n=158; Hills/Eastern suburbs n=83; Regional n=161
Top Barriers to Visitation
(n=3) (n=18) (n=27) (n=17) (n=20)
• Not big enough range of venues/ entertainment
• No suitable venues
• No suitable venues• Prefer another area• Too far away
• Prefer another area• Not big enough
range of venues/ entertainment
• No suitable venues
• No suitable venues• Prefer another area• Not big enough
range of venues/ entertainment
• Prefer another area• Too far away• No suitable venues
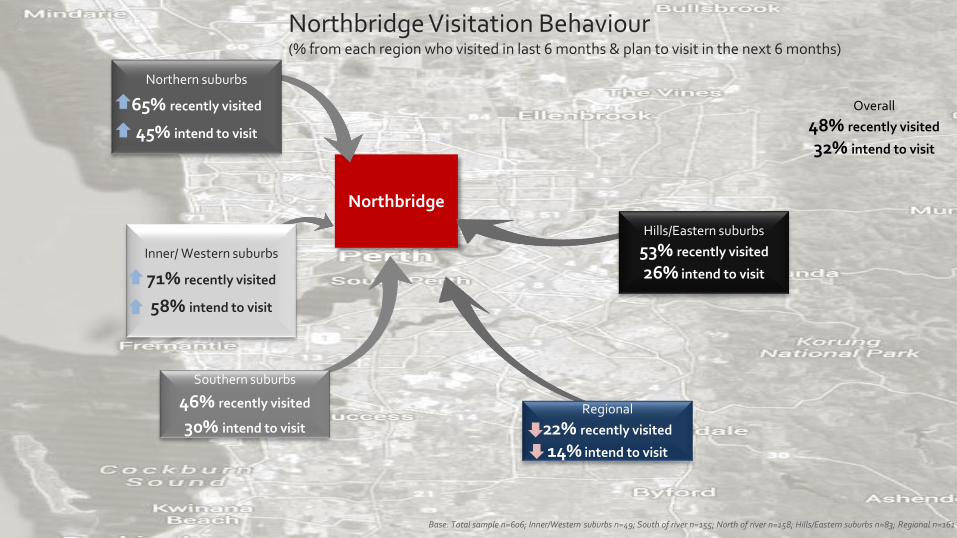
Northbridge Visitation Behaviour (% from each region who visited in last 6 months & plan to visit in the next 6 months)
Northbridge
Southern suburbs
46% recently visited
30% intend to visit
Hills/Eastern suburbs
53% recently visited
26% intend to visit
Northern suburbs
65% recently visited
45% intend to visit
Inner/ Western suburbs
71% recently visited
58% intend to visit
Base: Total sample n=606; Inner/Western suburbs n=49; South of river n=155; North of river n=158; Hills/Eastern suburbs n=83; Regional n=161
Regional
22% recently visited
14% intend to visit
Overall
48% recently visited
32% intend to visit
50
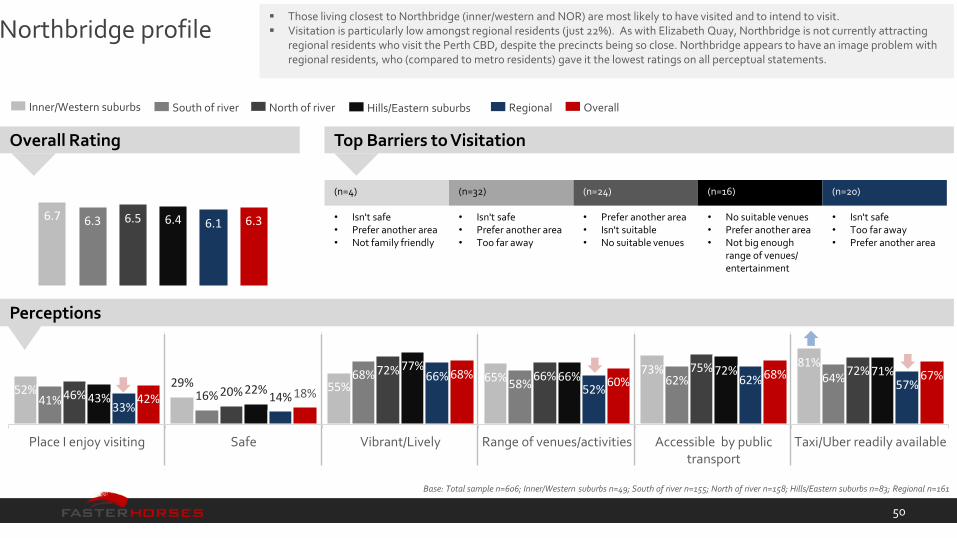
Northbridge profile
Overall Rating
Perceptions
52%29% 55%
65%73%
81%
41% 16%
68%58% 62% 64%
46% 20%
72% 66%75% 72%
43%22%
77%66% 72% 71%
33%14%
66%52%
62% 57%42% 18%
68%60%
68% 67%
Place I enjoy visiting Safe Vibrant/Lively Range of venues/activities Accessible by publictransport
Taxi/Uber readily available
6.7 6.3 6.5 6.4 6.1 6.3
Those living closest to Northbridge (inner/western and NOR) are most likely to have visited and to intend to visit. Visitation is particularly low amongst regional residents (just 22%). As with Elizabeth Quay, Northbridge is not currently attracting
regional residents who visit the Perth CBD, despite the precincts being so close. Northbridge appears to have an image problem with regional residents, who (compared to metro residents) gave it the lowest ratings on all perceptual statements.
Inner/Western suburbs South of river North of river Hills/Eastern suburbs OverallRegional
Base: Total sample n=606; Inner/Western suburbs n=49; South of river n=155; North of river n=158; Hills/Eastern suburbs n=83; Regional n=161
Top Barriers to Visitation
(n=4) (n=32) (n=24) (n=16) (n=20)
• Isn't safe• Prefer another area• Not family friendly
• Isn't safe• Prefer another area• Too far away
• Prefer another area• Isn't suitable• No suitable venues
• No suitable venues• Prefer another area• Not big enough
range of venues/ entertainment
• Isn't safe• Too far away• Prefer another area

Fremantle Visitation Behaviour (% from each region who visited in last 6 months & plan to visit in the next 6 months)
Southern suburbs
74% recently visited
60% intend to visit
Base: Total sample n=606; Inner/Western suburbs n=49; South of river n=155; North of river n=158; Hills/Eastern suburbs n=83; Regional n=161
Fremantle
Northern suburbs
47% recently visited
34% intend to visit
Inner/ Western suburbs
52% recently visited
49% intend to visit
Hills/Eastern suburbs
48% recently visited
38% intend to visit
Regional
37% recently visited
34% intend to visit
Overall
52% recently visited
43% intend to visit

52
Fremantle profile
Overall Rating
Perceptions
59%44%
55% 58%68% 66%
82%
61%69%
86%71% 69%
61%53%
62%71% 71%
58%
79%
60%72%
88%
67% 62%
83%
64%73% 77% 81%
65%74%
58%67%
78% 73%64%
Place I enjoy visiting Safe Vibrant/Lively Range of venues/activities Accessible by publictransport
Taxi/Uber readily available
6.67.6
6.97.6 7.6 7.3
Those living nearest Fremantle (SOR residents) are significantly more likely to have visited compared to the overall population, and have also visited most frequently (46% visited 4+ times in the last 6 months).
Interestingly, inner/western residents rate Fremantle significantly lower than the overall population, and score the precinct low on having a good range of venues/activities. Only half have recently visited – a similar proportion to hills/eastern residents (who live much further away). Clearly, inner/western residents feel Fremantle has less on offer compared to other entertainment precincts.
Inner/Western suburbs South of river North of river Hills/Eastern suburbs OverallRegional
Base: Total sample n=606; Inner/Western suburbs n=49; South of river n=155; North of river n=158; Hills/Eastern suburbs n=83; Regional n=161
Top Barriers to Visitation
(n=5) (n=3) (n=18) (n=7) (n=10)
• Too far away• Not big enough
range of venues/ entertainment
• Isn't safe
• Prefer another area• Too far away• Isn't safe
• Too far away• Prefer another area• Not accessible –
lack of public transport
• Too far away• Not accessible –
lack of public transport
• Too far away• Prefer another area
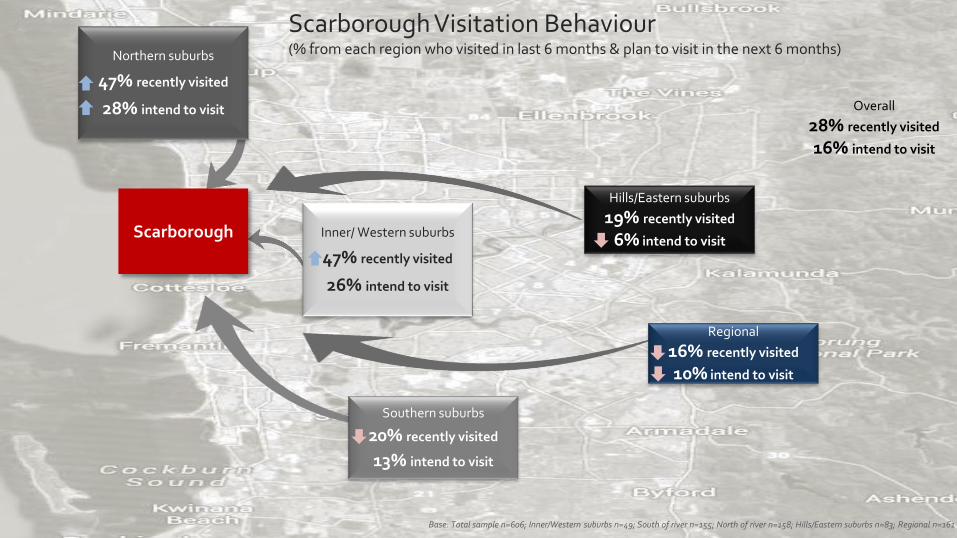
Scarborough Visitation Behaviour (% from each region who visited in last 6 months & plan to visit in the next 6 months)
Base: Total sample n=606; Inner/Western suburbs n=49; South of river n=155; North of river n=158; Hills/Eastern suburbs n=83; Regional n=161
Hills/Eastern suburbs
19% recently visited
6% intend to visit
Regional
16% recently visited
10% intend to visit
Scarborough
Southern suburbs
20% recently visited
13% intend to visit
Northern suburbs
47% recently visited
28% intend to visit
Inner/ Western suburbs
47% recently visited
26% intend to visit
Overall
28% recently visited
16% intend to visit

54
Scarborough profile
Overall Rating
Perceptions
29%37%
19% 20% 17%
46%
32%41%
17% 18% 12%
39%41%48%
25% 23%19%
49%
26%
38%
14% 17%8%
44%
32% 36%
22% 25% 26%
40%34%
41%
20% 21% 17%
43%
Place I enjoy visiting Safe Vibrant/Lively Range of venues/activities Accessible by publictransport
Taxi/Uber readily available
5.7 5.2 5.2 4.85.6 5.3
Those living closest to Scarborough (inner/western and NOR) are most likely to have visited recently. However few plan to visit again in the near future, or say it is a place they enjoy visiting, suggesting their recent visitation experience hasn’t been a positive one (likely due to current redevelopment works).
Compared to those in other regions, NOR residents in particular want to see more venues in Scarborough, especially restaurants, small bars, pop-up bars and pubs.
Inner/Western suburbs South of river North of river Hills/Eastern suburbs OverallRegional
Base: Total sample n=606; Inner/Western suburbs n=49; South of river n=155; North of river n=158; Hills/Eastern suburbs n=83; Regional n=161
Top Barriers to Visitation
(n=7) (n=61) (n=24) (n=32) (n=48)
• Prefer another area• No suitable venues• Too far away
• Too far away• Prefer another area• No suitable venues
• No suitable venues• Too far away• Prefer another area
• Too far away• No suitable venues• Prefer another area
• Too far away• Prefer another area• No suitable venues

Beaufort Street Visitation Behaviour (% from each region who visited in last 6 months & plan to visit in the next 6 months)
Beaufort Street
Southern suburbs
25% recently visited
11% intend to visit
Hills/Eastern suburbs
29% recently visited
19% intend to visit
Northern suburbs
48% recently visited
33% intend to visit
Inner/ Western suburbs
60% recently visited
40% intend to visit
Base: Total sample n=606; Inner/Western suburbs n=49; South of river n=155; North of river n=158; Hills/Eastern suburbs n=83; Regional n=161
Regional
12% recently visited
9% intend to visit
Overall
32% recently visited
20% intend to visit

56
Beaufort St profile
Overall Rating
Perceptions
49% 53%41%
49%
30%
62%
31%41%
30% 24%16%
43%48%63%
50%37%
29%
57%42%
58%
40% 45%29%
56%
25% 33% 29% 26%37% 42%37%
48%37% 33% 28%
50%
Place I enjoy visiting Safe Vibrant/Lively Range of venues/activities Accessible by publictransport
Taxi/Uber readily available
6.76.0 6.3 6.1 5.8 6.1
Those living closest to Beaufort Street - inner/western and NOR residents - are most likely to have visited recently, and give highest overall ratings.
Visitation is low amongst those living SOR and regionally, with few believing the precinct is vibrant/lively or has a good range of venues/activities.
Inner/Western suburbs South of river North of river Hills/Eastern suburbs OverallRegional
Base: Total sample n=606; Inner/Western suburbs n=49; South of river n=155; North of river n=158; Hills/Eastern suburbs n=83; Regional n=161
Top Barriers to Visitation
(n=6) (n=43) (n=30) (n=32) (n=60)
• Prefer another area• Too far away• Isn't safe
• Too far away• Prefer another area• No suitable venues
• No suitable venues• Too far away• Prefer another area
• Prefer another area• Too far away• No suitable venues
• Prefer another area• Too far away• No suitable venues
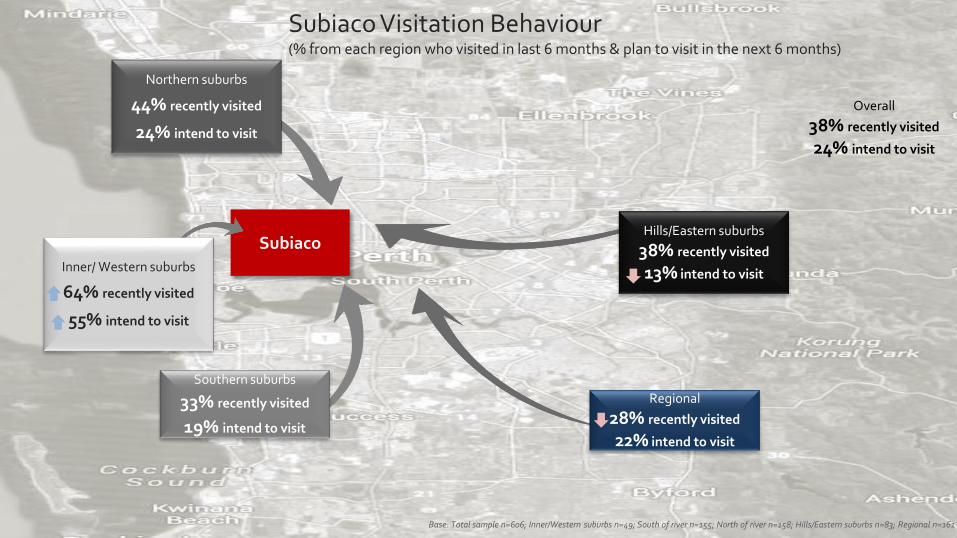
Subiaco Visitation Behaviour (% from each region who visited in last 6 months & plan to visit in the next 6 months)
Base: Total sample n=606; Inner/Western suburbs n=49; South of river n=155; North of river n=158; Hills/Eastern suburbs n=83; Regional n=161
Regional
28% recently visited
22% intend to visit
Subiaco
Northern suburbs
44% recently visited
24% intend to visit
Inner/ Western suburbs
64% recently visited
55% intend to visit
Southern suburbs
33% recently visited
19% intend to visit
Hills/Eastern suburbs
38% recently visited
13% intend to visit
Overall
38% recently visited
24% intend to visit

58
Subiaco profile
Overall Rating
Perceptions
51%63%
33% 40%
67% 63%
42%
62%
31% 37%50% 56%
40%
66%
34% 33%
54% 55%
33%
55%
25%39%
49% 56%52%62%
46% 53%
71%56%
43%
62%
35% 40%
58% 56%
Place I enjoy visiting Safe Vibrant/Lively Range of venues/activities Accessible by publictransport
Taxi/Uber readily available
6.2 6.1 5.8 5.76.4 6.1
Although those living in inner/western suburbs are the most likely to visit Subiaco (and have visited most frequently - 46% visited 4+ times in the last 6 months), they do not rate the precinct any higher compared to the overall population. This group would like to see more small bars, BYO restaurants and pop-up bars in Subiaco – which may improve their perceptions of the precinct.
Regional residents have a very positive perception of Subiaco, rating it higher on most perceptual attributes than metro residents.
Inner/Western suburbs South of river North of river Hills/Eastern suburbs OverallRegional
Base: Total sample n=606; Inner/Western suburbs n=49; South of river n=155; North of river n=158; Hills/Eastern suburbs n=83; Regional n=161
Top Barriers to Visitation
(n=6) (n=34) (n=25) (n=20) (n=29)
• Prefer another area• No suitable venues• Not big enough
range of venues/ entertainment
• Too far away• Prefer another area• No suitable venues
• Prefer another area• Too far away• No suitable venues
• Too far away• Prefer another area• No suitable venues
• Too far away• Prefer another area• No suitable venues

Victoria Park Visitation Behaviour (% from each region who visited in last 6 months & plan to visit in the next 6 months)
Base: Total sample n=606; Inner/Western suburbs n=49; South of river n=155; North of river n=158; Hills/Eastern suburbs n=83; Regional n=161
Regional
23% recently visited
18% intend to visit
Victoria Park
Hills/Eastern suburbs
32% recently visited
22% intend to visit
Southern suburbs
43% recently visited
33% intend to visit
Inner/ Western suburbs
33% recently visited
32% intend to visit
Northern suburbs
24% recently visited
12% intend to visitOverall
30% recently visited
22% intend to visit
60
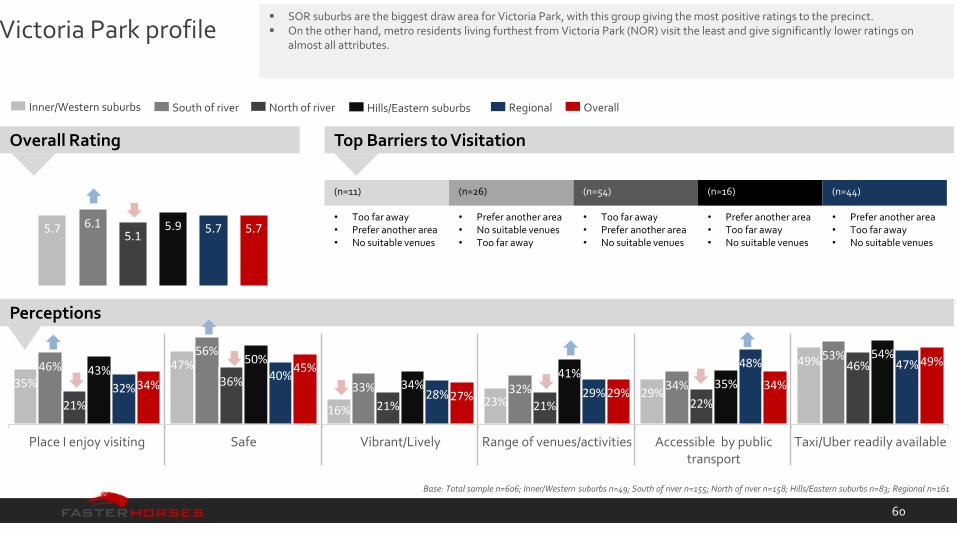
Victoria Park profile
Overall Rating
Perceptions
35%
47%
16%23%
29%
49%46%56%
33% 32% 34%
53%
21%
36%
21% 21% 22%
46%43%50%
34%41%
35%
54%
32%40%
28% 29%
48% 47%
34%
45%
27% 29%34%
49%
Place I enjoy visiting Safe Vibrant/Lively Range of venues/activities Accessible by publictransport
Taxi/Uber readily available
5.7 6.15.1
5.9 5.7 5.7
SOR suburbs are the biggest draw area for Victoria Park, with this group giving the most positive ratings to the precinct. On the other hand, metro residents living furthest from Victoria Park (NOR) visit the least and give significantly lower ratings on
almost all attributes.
Inner/Western suburbs South of river North of river Hills/Eastern suburbs OverallRegional
Base: Total sample n=606; Inner/Western suburbs n=49; South of river n=155; North of river n=158; Hills/Eastern suburbs n=83; Regional n=161
Top Barriers to Visitation
(n=11) (n=26) (n=54) (n=16) (n=44)
• Too far away• Prefer another area• No suitable venues
• Prefer another area• No suitable venues• Too far away
• Too far away• Prefer another area• No suitable venues
• Prefer another area• Too far away• No suitable venues
• Prefer another area• Too far away• No suitable venues
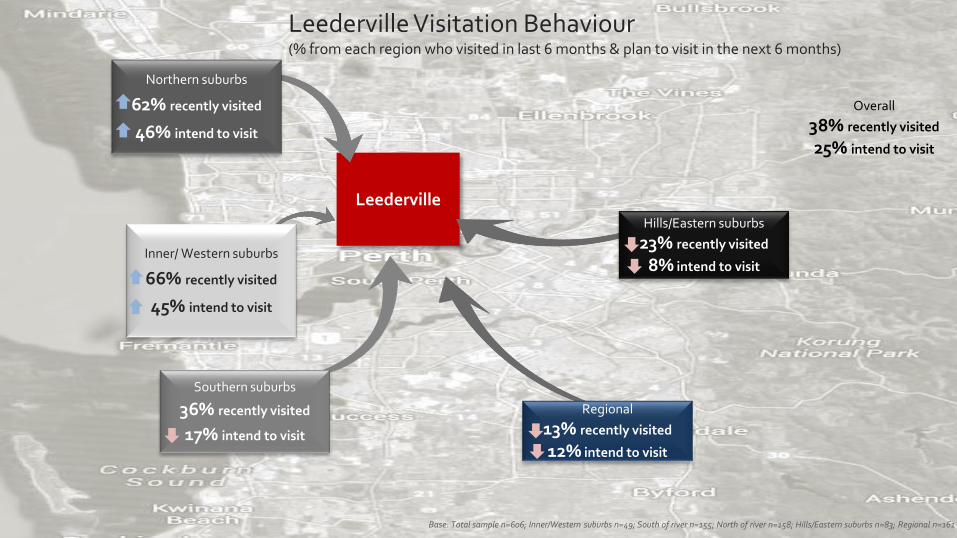
Leederville Visitation Behaviour (% from each region who visited in last 6 months & plan to visit in the next 6 months)
Leederville
Southern suburbs
36% recently visited
17% intend to visit
Hills/Eastern suburbs
23% recently visited
8% intend to visit
Northern suburbs
62% recently visited
46% intend to visit
Inner/ Western suburbs
66% recently visited
45% intend to visit
Base: Total sample n=606; Inner/Western suburbs n=49; South of river n=155; North of river n=158; Hills/Eastern suburbs n=83; Regional n=161
Regional
13% recently visited
12% intend to visit
Overall
38% recently visited
25% intend to visit
55% 57% 50% 49% 53%
73%
36%50%
42% 38%45%
53%64% 68% 62% 58%
68% 66%
30%
49% 48%41% 44%
60%
27%40%
33% 28%46% 48%42%
53% 47% 42%52% 58%
Place I enjoy visiting Safe Vibrant/Lively Range of venues/activities Accessible by publictransport
Taxi/Uber readily available
62
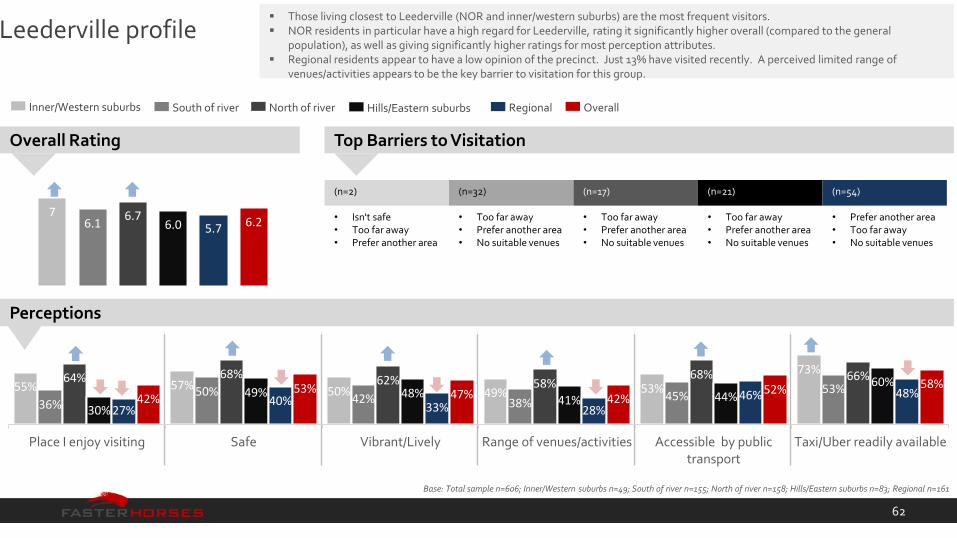
Leederville profile
Overall Rating
Perceptions
76.1
6.76.0 5.7 6.2
Those living closest to Leederville (NOR and inner/western suburbs) are the most frequent visitors. NOR residents in particular have a high regard for Leederville, rating it significantly higher overall (compared to the general
population), as well as giving significantly higher ratings for most perception attributes. Regional residents appear to have a low opinion of the precinct. Just 13% have visited recently. A perceived limited range of
venues/activities appears to be the key barrier to visitation for this group.
Inner/Western suburbs South of river North of river Hills/Eastern suburbs OverallRegional
Base: Total sample n=606; Inner/Western suburbs n=49; South of river n=155; North of river n=158; Hills/Eastern suburbs n=83; Regional n=161
Top Barriers to Visitation
(n=2) (n=32) (n=17) (n=21) (n=54)
• Isn't safe• Too far away• Prefer another area
• Too far away• Prefer another area• No suitable venues
• Too far away• Prefer another area• No suitable venues
• Too far away• Prefer another area• No suitable venues
• Prefer another area• Too far away• No suitable venues