total surface area in indoor environments
TRANSCRIPT

Total Surface Area in Indoor Environments
Journal: Environmental Science: Processes & Impacts
Manuscript ID EM-ART-04-2019-000157.R1
Article Type: Paper
Date Submitted by the Author: 19-Jun-2019
Complete List of Authors: Manuja, Archit; Virginia Polytechnic Institute and State University, Civil and Environmental EngineeringRitchie, Jenna; Virginia Polytechnic Institute and State University, Civil and Environmental EngineeringBuch, Khantil; Virginia Polytechnic Institute and State University, Civil and Environmental EngineeringWu, Yaoxing; Texas A&M University KingsvilleEichler, Clara M.A. ; Virginia Polytechnic Institute and State UniversityLittle, John ; Virginia Polytechnic Institute and State University, Civil and Environmental EngineeringMarr, Linsey; Virginia Polytechnic Institute and State University
Environmental Science: Processes & Impacts

Environmental Significance Statement
In a room containing objects, the surface area that is relevant for interactions with indoor air is
larger than that of the walls, floor, and ceiling alone. Objects such as furniture, window
coverings, books, and clothing contribute to surface area while subtracting from the volume of
air in the room. On average, the contents of bedrooms, kitchens, and offices increase their
surface area by 50% and decrease their volume by 10% compared to an empty room. The results
of this study can be used to improve understanding of the behavior of gases and particles in
indoor environments.
Page 1 of 28 Environmental Science: Processes & Impacts
123456789101112131415161718192021222324252627282930313233343536373839404142434445464748495051525354555657585960

1
1
2
3
4
5 Total Surface Area in Indoor Environments
6
7 Archit Manuja1, Jenna Ritchie1, Khantil Buch1, Yaoxing Wu2, Clara M. A. Eichler1, John C.
8 Little1, and Linsey C. Marr1
9
10 1Civil and Environmental Engineering, Virginia Tech, 1145 Perry Street, Blacksburg, VA, USA
11 2Environmental Engineering, Texas A&M University, Kingsville, TX, USA
12
13 Corresponding author e-mail address: [email protected]
14
15
Page 2 of 28Environmental Science: Processes & Impacts
123456789101112131415161718192021222324252627282930313233343536373839404142434445464748495051525354555657585960

2
16 Abstract
17 Certain processes in indoor air, such as deposition, partitioning, and heterogeneous reactions,
18 involve interactions with surfaces. To accurately describe the surface-area-to-volume ratio in a
19 room, we have characterized the surface area, volume, shape, and material of objects in 10
20 bedrooms, nine kitchens, and three offices. The resolution of the measurements was ~1 cm. The
21 ratio of surface area with contents to that without contents did not vary by type of room and
22 averaged 1.5 ± 0.3 (mean ± standard deviation) across all rooms. The ratio of the volume minus
23 contents to nominal volume averaged 0.9 ± 0.1 and was lower for kitchens compared to
24 bedrooms and offices. Ignoring contents, the surface-area-to-volume ratio was 1.8 ± 0.3 m-1;
25 accounting for contents, the ratio was 3.2 ± 1.2 m-1, or 78% higher. These two ratios did not vary
26 by type of room and were similar to those measured for 33 rooms in another study. Due to
27 substantial differences in the design and contents of kitchens, their ratios had the highest
28 variability among the three room types. The most common shape of surfaces was flat
29 rectangular, while each room also had many irregularly-shaped objects. Paint-covered surfaces
30 and stained wood were the two most common materials in each room, accounting for an average
31 of 42% and 22% of total surface area, respectively, although the distribution of materials varied
32 by room type. These findings have important implications for understanding the chemistry of
33 indoor environments, as the available surface area for deposition and reactions is higher and
34 more complex than assumed in simple models.
35
36 Key Words: surface, area, volume, built environment, indoor air, deposition
37
38
Page 3 of 28 Environmental Science: Processes & Impacts
123456789101112131415161718192021222324252627282930313233343536373839404142434445464748495051525354555657585960

3
39 Introduction
40 Since humans spend about 87% of their time indoors, on average,1 understanding indoor air
41 quality is essential for characterizing the relationship between health and the environment.
42 Conceptual and numerical models are important tools for understanding the transport,
43 transformation, and fate of gases and particles indoors. Among the inputs to such models are the
44 surface area and volume of the indoor setting, often combined as the surface-area-to-volume
45 ratio or the surface-to-volume ratio, yet researchers often assume that the surface area and
46 volume of a room are determined by the dimensions of its walls, floor, and ceiling while ignoring
47 the contribution of any contents of the room. There have been some exceptions that considered
48 real-world rooms and accounted for at least the major furnishings.2-4
49 For processes such as deposition, resuspension, partitioning, and heterogeneous reactions,
50 surface area plays a critical role. Deposition of gases and particles onto surfaces removes them
51 from the air, thus eliminating inhalation exposure to them. However, deposition on surfaces can
52 cause detrimental effects both directly, such as deterioration of materials5 and damage to
53 electrical equipment6 by particles, and indirectly, such as ozone-induced secondary emissions of
54 aldehydes from indoor surfaces.7 Resuspension is an important source of particles indoors, and it
55 depends on surface characteristics, including geometry.8, 9 Semi-volatile compounds partition
56 between the gas phase and the liquid phase, in which they are usually adsorbed on surfaces.10, 11
57 In addition, surfaces can be a source of emissions of gases and particles. Heterogeneous
58 reactions, such as between nitrous acid and nicotine to form carcinogenic nitrosamines,12 take
59 place at the gas-surface interface. At a gross level, these processes do not discriminate between
60 the surface area of walls and that of objects in the room.
Page 4 of 28Environmental Science: Processes & Impacts
123456789101112131415161718192021222324252627282930313233343536373839404142434445464748495051525354555657585960
4
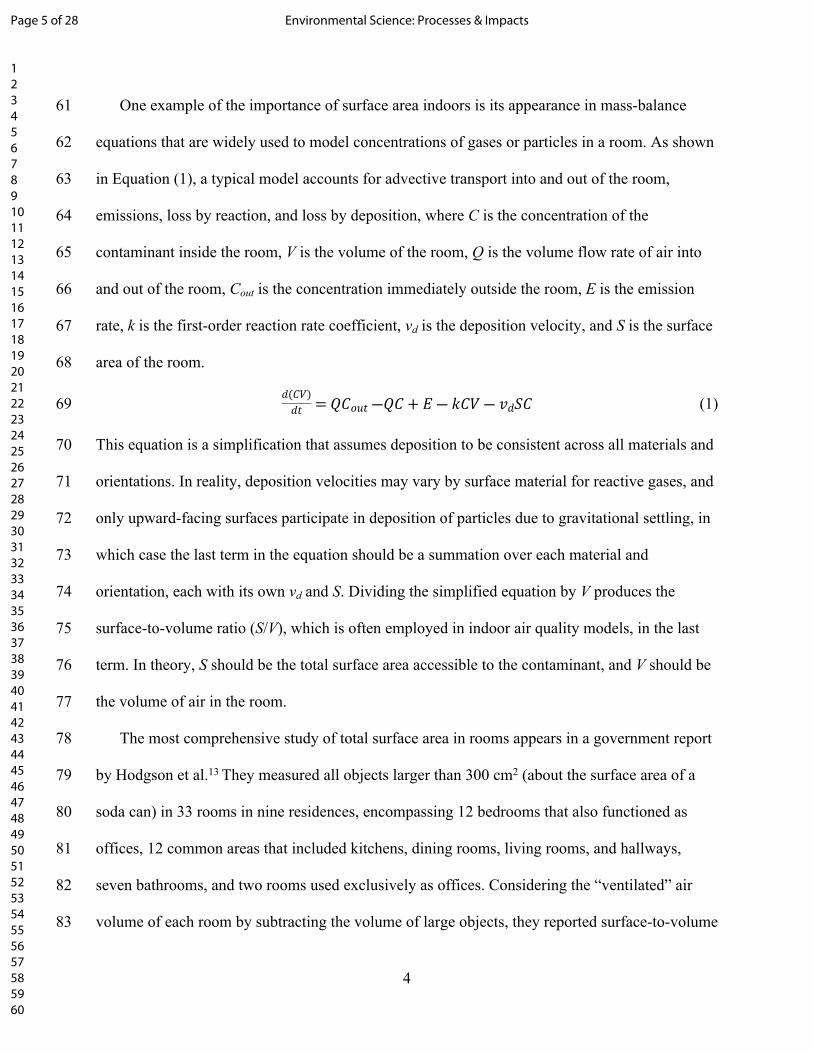
61 One example of the importance of surface area indoors is its appearance in mass-balance
62 equations that are widely used to model concentrations of gases or particles in a room. As shown
63 in Equation (1), a typical model accounts for advective transport into and out of the room,
64 emissions, loss by reaction, and loss by deposition, where C is the concentration of the
65 contaminant inside the room, V is the volume of the room, Q is the volume flow rate of air into
66 and out of the room, Cout is the concentration immediately outside the room, E is the emission
67 rate, k is the first-order reaction rate coefficient, vd is the deposition velocity, and S is the surface
68 area of the room.
69 (1)𝑑(𝐶𝑉)
𝑑𝑡 = 𝑄𝐶𝑜𝑢𝑡 ―𝑄𝐶 + 𝐸 ― 𝑘𝐶𝑉 ― 𝑣𝑑𝑆𝐶
70 This equation is a simplification that assumes deposition to be consistent across all materials and
71 orientations. In reality, deposition velocities may vary by surface material for reactive gases, and
72 only upward-facing surfaces participate in deposition of particles due to gravitational settling, in
73 which case the last term in the equation should be a summation over each material and
74 orientation, each with its own vd and S. Dividing the simplified equation by V produces the
75 surface-to-volume ratio (S/V), which is often employed in indoor air quality models, in the last
76 term. In theory, S should be the total surface area accessible to the contaminant, and V should be
77 the volume of air in the room.
78 The most comprehensive study of total surface area in rooms appears in a government report
79 by Hodgson et al.13 They measured all objects larger than 300 cm2 (about the surface area of a
80 soda can) in 33 rooms in nine residences, encompassing 12 bedrooms that also functioned as
81 offices, 12 common areas that included kitchens, dining rooms, living rooms, and hallways,
82 seven bathrooms, and two rooms used exclusively as offices. Considering the “ventilated” air
83 volume of each room by subtracting the volume of large objects, they reported surface-to-volume
Page 5 of 28 Environmental Science: Processes & Impacts
123456789101112131415161718192021222324252627282930313233343536373839404142434445464748495051525354555657585960

5
84 ratios of the rooms ranging from 2.3 to 5.7 m-1. The ratios for bathrooms and offices were higher,
85 on average, than for common areas and bedrooms. Mueller et al.4 calculated the surface-to-
86 volume ratio in four indoor environments: an aluminum odor test facility (5.3 m-1), metal test
87 rooms (stainless steel: 2.7 m-1, aluminum: 3.3 m-1), an office (2.8 m-1), and a home (3.3 m-1).
88 These ratios included the surface area of the contents in each indoor environment. In a critique of
89 the use of the deposition velocity in conceptual models, Nazaroff5 assumed a “typical” S/V value
90 of 2.8 m-1. Many subsequent studies have used either Mueller’s4 ratios or Nazaroff’s5 “typical”
91 value of S/V.
92 In addition to the surface area of the contents of a room, the type of material, dimensions, and
93 orientation of the contents may also be important for certain processes. For example, the
94 deposition velocity of a gas depends on its solubility in and reactivity with the surface.14 Models
95 of air flow dynamics may be used to understand indoor environmental quality, such as evaluating
96 the effectiveness of heating, cooling, and ventilation systems in a building15 or predicting
97 personal exposure to pollutants. Realistic simulations of air flow indoors require accounting for
98 the size, shape, and orientation of the objects in a room.
99 The objective of this research is to characterize the contents of three different types of
100 rooms—bedrooms and kitchens in residences and offices in a university building—in terms of
101 exposed surface area, volume, shape, and material composition. We select bedrooms and offices
102 for measurement because people spend large amounts of time in them, and we select kitchens
103 because they are the site of cooking-related emissions of gases and particles that can affect
104 indoor chemistry and health.11, 16-18 We calculate surface-to-volume ratios including and
105 excluding the contents present in the room. Although the roughness and porosity of indoor
106 surfaces mediate the rate and extent of gas and particle transfer between the surrounding air and
Page 6 of 28Environmental Science: Processes & Impacts
123456789101112131415161718192021222324252627282930313233343536373839404142434445464748495051525354555657585960

6
107 the surface, we simplify our measurements of surface area by excluding these two
108 characteristics, choosing to focus on the scale at which we are able to make measurements. We
109 do catalog the surface material so that future studies may concentrate on roughness and porosity
110 in more detail. Results of this study can be used to improve models of the transport,
111 transformation, and fate of gases and particles in indoor air.
112
113 Experimental
114 Indoor environments
115 We considered three different types of rooms that are frequently modeled in studies of indoor
116 environments: bedrooms, kitchens, and offices. Through a convenience sampling approach that
117 aimed to capture diversity in building style and age of residences, we selected for analysis 10
118 bedrooms and nine kitchens in nine residences in Blacksburg, Virginia, that were built between
119 1941 and 2003. Of the residences studied, one was in a structure with >20 units, one was in a
120 structure with 10-19 units, and seven were single-unit, detached structures. The distribution of
121 the sample in terms of year built and number of units in the structure was reasonably
122 representative of that in the American Housing Survey of 121 million housing units in 2017,19 as
123 shown in Fig. S1. We also measured three offices with different layouts in a university building
124 at Virginia Tech.
125 Experimental metrics
126 We defined the surface area of a room excluding its contents as S (i.e., walls, floor, and
127 ceiling only), the surface area with contents as S*, the nominal volume of the room as V, equal to
128 length (L) × width (W) × height (H) for rectangular cuboid rooms, and the volume minus the
129 contents of the room as V*. For irregularly shaped rooms and those with slanted ceilings, we
Page 7 of 28 Environmental Science: Processes & Impacts
123456789101112131415161718192021222324252627282930313233343536373839404142434445464748495051525354555657585960

7
130 subdivided the space into rectangular and triangular prisms, applied the appropriate geometric
131 equation to calculate the volume of each section, and summed the volumes. Using these
132 definitions, we calculated four metrics: (1) ratio of total surface area with contents to surface area
133 without contents (S*/S), ratio of volume minus contents to nominal volume (V*/V), (2) ratio of
134 surface area to volume without contents (S/V), and (4) ratio of surface area to volume with
135 contents (S*/V*). If the room has no contents, then S* equals S, and the ratio S*/S equals 1, and
136 likewise for V* and V. If the contents of the room have the same amount of surface area as the
137 walls, floor, and ceiling, then S*/S equals 2. As ceiling heights are usually similar across
138 different types of rooms, if no contents are present in a room, a smaller room (in length and
139 width) will have a larger S/V compared to a larger room.
140 Surface area can vary with measurement resolution. For example, we could measure the
141 surface area of a rectangular carpet as the projected L × W, but we could also consider the
142 surface area of each piece of yarn or even of each fiber making up the yarn. We employed a
143 resolution of ~1 cm in our measurements, or what could readily be discerned using a measuring
144 tape. While some processes of interest involve individual molecules, in which case nanoscale
145 resolution would be most appropriate, it is not feasible at this stage to measure surface area in a
146 room at this scale. Because smaller scale surface features will usually reside in the boundary
147 layer, they are not expected to impact air flow patterns in a room, but they could affect the
148 thickness of the boundary layer and thus impact gas and particle transfer between the bulk air
149 and the surface.
150 Measurement techniques
151 We measured the dimensions of walls, floors, ceilings, and individual contents of the room
152 using a measuring tape. Most of the kitchens were open on at least one side, where we defined
Page 8 of 28Environmental Science: Processes & Impacts
123456789101112131415161718192021222324252627282930313233343536373839404142434445464748495051525354555657585960

8
153 the boundary according to an architectural feature, such as a change in flooring or partial wall.
154 For rectangular prisms, we measured L, W, and H and used these to calculate surface area and
155 volume. For cylindrical, conical, and spherical objects, we measured the diameter as well and
156 used the appropriate equations to calculate surface area and volume. We applied the appropriate
157 geometric equations where possible for other shapes. For irregularly shaped objects, we
158 separated them into smaller 2D or 3D shapes, such as rectangles, triangles, or cones, applied the
159 appropriate geometric equation to estimate the surface area and volume of each part, and then
160 summed the parts. We only calculated the exposed surface area of objects, meaning the area
161 which was in direct contact with the bulk air in the room. For example, if a box was on the floor,
162 we did not calculate the surface area of the bottom of the box. We were unable to calculate the
163 volume of some small items with surface area less than ~100 cm2 (about the same as a billiard
164 ball), due to their highly irregular shapes.
165 We also recorded the shape and the material of all objects. For those consisting of more than
166 one material, we calculated the surface area of each different material separately. We categorized
167 the shapes as either cylinder, flat, open top container, rectangular prism, sphere, or irregular. We
168 categorized the materials as either cardboard, concrete, fabric or fiber, glass, metal, paint, paper,
169 plastic, wood (stained), or other. All the closets, drawers, and cabinets in the rooms were closed,
170 and thus, we did not measure the surface area of the objects inside them.
171 Statistical analysis
172 We compared S*/S, V*/V, S/V, and S*/V* among the three types of rooms using ANOVA. In
173 addition, we performed a Shapiro-Wilks test to verify that the data points were normally
174 distributed. We produced a normal quantile-quantile plot to visually evaluate the distribution of
175 the data. We used an alpha of 0.05 for all statistical tests.
Page 9 of 28 Environmental Science: Processes & Impacts
123456789101112131415161718192021222324252627282930313233343536373839404142434445464748495051525354555657585960

9
176
177 Results
178 We measured a total of 22 rooms listed in Table S1. These included 10 bedrooms and nine
179 kitchens in residences and three offices in a university building. The rooms contained 26 to 81
180 measureable objects, including walls, floor, and ceiling as one object each. Nine of the bedrooms
181 contained a bed consisting of a frame, mattress, linens, and pillows and a closet. The other
182 bedroom contained a futon instead of a bed and did not have a closet. Other typical bedroom
183 contents, such as tables, chairs, posters, cabinets, fans, storage boxes, and books, were present in
184 variable quantities among bedrooms. All bedrooms had at least one window.
185 All kitchens contained a sink, refrigerator, oven, stove, microwave oven, and cabinets. All
186 had a garbage can, which was located inside a cabinet or drawer in some cases. Some kitchens
187 contained an eating area with a counter or dining table and chairs, along with additional contents
188 such as stools, a pantry, and a toaster oven. The kitchens typically had only two or three walls
189 and were open to other rooms in the residence. Not all kitchens had windows.
190 All three offices contained desks, chairs, computers, multiple shelves, cabinets, books, and
191 common office supplies. Although all offices analyzed were located in the same building, they
192 varied in size and style. In two of the offices, one of the walls was composed primarily of
193 windows, while the third office did not have any windows. The third office was shared by three
194 people and had three desks, three chairs, and multiple shelves.
195 Among all rooms studied, the length and width ranged from 1.7 m, in the case of the smallest
196 kitchen, to 6.1 m, in the case of the largest bedroom, as shown in Table S1. The ceiling height
197 ranged from 1.4 (one side of an attic bedroom with a slanted ceiling) to 3.4 m (one side of a
198 kitchen with a vaulted ceiling) and was 2.4 or 2.7 m for most rooms. The volume of the rooms
Page 10 of 28Environmental Science: Processes & Impacts
123456789101112131415161718192021222324252627282930313233343536373839404142434445464748495051525354555657585960

10
199 ranged from 9 to 50 m3. On average, kitchens were smaller in volume than bedrooms and offices
200 but had the largest variability in volume. Among the three types of rooms, bedrooms had the
201 least variability in volume, with a relative standard deviation of 23% compared to 48% for
202 kitchens and 26% for offices.
203 Surface area without contents, S, ranged from 22 to 86 m2, as shown in Table S1. Typically,
204 rooms with larger volume had larger S, although this was not always true. The surface area with
205 contents, S*, ranged from 36 to 146 m2. In most cases, rooms with a larger S also had a larger S*.
206 While kitchens were only 6% smaller than bedrooms by volume V, on average, the difference in
207 surface area was greater: S and S* were 25 and 26% lower, on average, for kitchens. The lower
208 surface area of the kitchens in this study largely arose from their open floor plans, so they had
209 one or two fewer walls than did bedrooms, all of which were cuboidal with four walls and a
210 door.
211 Table 1 summarizes metrics of surface area and volume for different room types and for all
212 rooms combined. The ratios S*/S, S/V, and S*/V* were not significantly different by room type,
213 while the ratio V*/V was lower for kitchens compared to bedrooms and offices. S*/S averaged
214 across all rooms was 1.5 ± 0.3 (standard deviation). The ratio was more variable for kitchens than
215 for bedrooms, probably because some of the kitchens were partially open to the rest of the house,
216 with walls or parts of walls absent. The two smallest kitchens in terms of volume had the highest
217 ratio of S*/S. Their additional surface area beyond the walls, floor, and ceiling, or S* - S, fell
218 near the mean and near the upper end of the range for all kitchens. There was no correlation
219 between the amount of surface area of items in the kitchen and the room’s nominal volume (R2 =
220 0.03). Across all rooms, V*/V fell in the range 0.70 to 0.97. The ratio for kitchens was lower than
221 for other rooms because kitchens tended to have large cabinets and/or appliances. The ratio S/V
Page 11 of 28 Environmental Science: Processes & Impacts
123456789101112131415161718192021222324252627282930313233343536373839404142434445464748495051525354555657585960

11
222 ranged from 1.3 to 2.5 m-1, and the mean across all rooms was 1.8 m-1. As accounting for
223 contents increases the surface area and reduces the volume compared to an empty room, S*/V*
224 was larger, ranging from 2.0 to 6.8 m-1 with a mean of 3.2 m-1, which was 78% higher than the
225 ratio without contents.
226
227 Table 1. Surface area without (S) and with (S*) contents, volume without (V) and with (V*)
228 contents, and ratios for 10 bedrooms, nine kitchens, and three offices (average ± standard
229 deviation).
230
Surface Area (m2) Volume (m3) Surface Area-to-
Volume Ratio (m-1)
Room
S S* S*/S V V* V*/V S/V S*/V*
Bedrooms 60 ± 11 86 ± 17 1.4 ± 0.2 31 ± 7 29 ± 7 0.93 ± 0.03 2.0 ± 0.2 3.0 ± 0.4
Kitchens 45 ± 15 64 ± 20 1.4 ± 0.4 29 ± 14 25 ± 14 0.8 ± 0.1 1.7 ± 0.4 3.2 ± 1.8
Offices 70 ± 15 125 ± 22 1.8 ± 0.1 38 ± 10 35 ± 10 0.93 ± 0.03 1.9 ± 0.1 3.6 ± 0.4
All 56 ± 16 82 ± 27 1.5 ± 0.3 31 ± 11 28 ± 11 0.9 ± 0.1 1.8 ± 0.3 3.2 ± 1.2
231
232 Fig. 1 shows that in terms of shape, the majority of surface area in the rooms, except for three
233 of the kitchens, was a flat surface. Besides the walls, floor, and ceiling, other flat surfaces
234 included cabinets, closet doors, and windows. The second most common shape was a rectangular
235 prism, usually dominated in bedrooms by the bed, shelves, cabinets, and storage boxes. In
236 kitchens, the microwave, oven, and refrigerator were counted as rectangular prisms. In offices,
237 the majority of surfaces were also flat; however, more of the surface area was associated with
238 irregularly shaped objects than with rectangular prisms.
Page 12 of 28Environmental Science: Processes & Impacts
123456789101112131415161718192021222324252627282930313233343536373839404142434445464748495051525354555657585960

12
239
240
241 Fig. 1. Surface area by shape of all contents in each room.
242
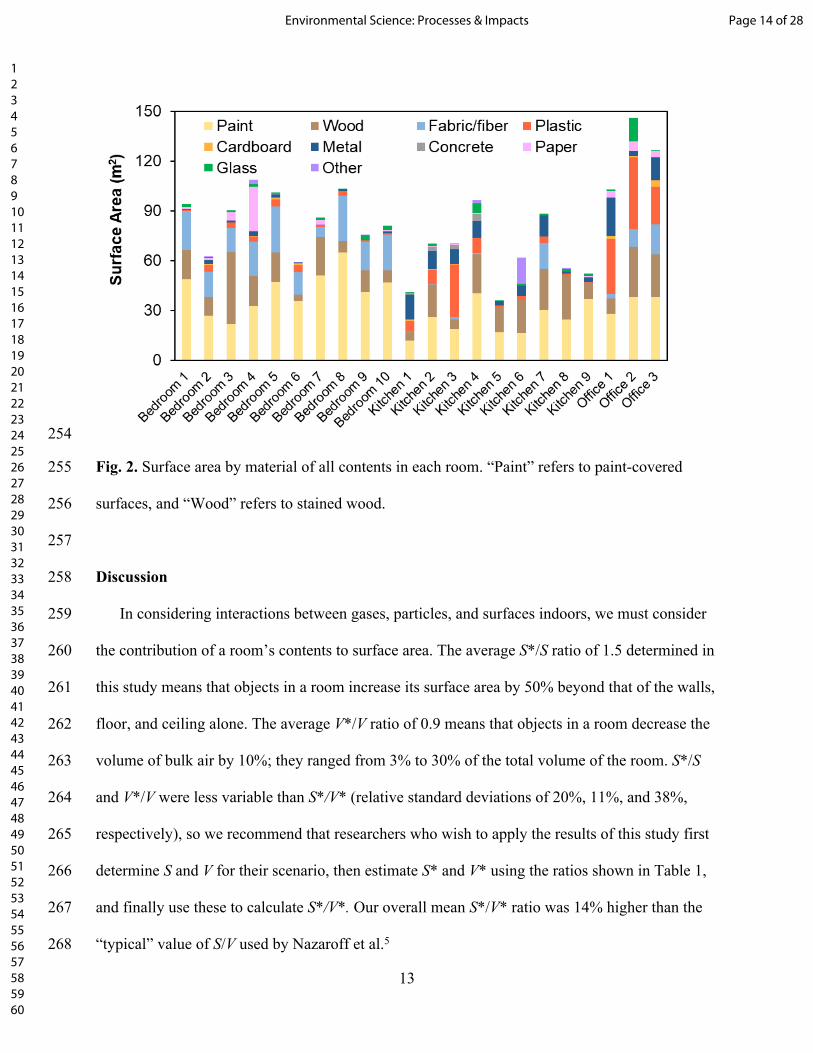
243 Paint-covered surfaces were typically the most common type of material present in the
244 rooms, as shown in Fig. 2, largely due to walls and ceilings. Painted surfaces accounted for 42 ±
245 14% of total surface area in a room. The floor was usually either made of fibrous material (i.e.,
246 carpet), stained wood, or plastic. In some cases, such as bedroom 3, stained wood was the most
247 common material, as parts of the walls and the ceiling had wood paneling. Averaged across all
248 rooms, stained wood was the second most common material, accounting for 22 ± 12% of total
249 surface area. Plastic and metal were more common in kitchens and offices than in bedrooms.
250 Many of the miscellaneous contents were comprised of plastic, glass, fabric, metal, or other
251 materials, although most of these contents were relatively small in size and did not significantly
252 influence the overall material composition.
253
Page 13 of 28 Environmental Science: Processes & Impacts
123456789101112131415161718192021222324252627282930313233343536373839404142434445464748495051525354555657585960
13
254
255 Fig. 2. Surface area by material of all contents in each room. “Paint” refers to paint-covered
256 surfaces, and “Wood” refers to stained wood.
257
258 Discussion
259 In considering interactions between gases, particles, and surfaces indoors, we must consider
260 the contribution of a room’s contents to surface area. The average S*/S ratio of 1.5 determined in
261 this study means that objects in a room increase its surface area by 50% beyond that of the walls,
262 floor, and ceiling alone. The average V*/V ratio of 0.9 means that objects in a room decrease the
263 volume of bulk air by 10%; they ranged from 3% to 30% of the total volume of the room. S*/S
264 and V*/V were less variable than S*/V* (relative standard deviations of 20%, 11%, and 38%,
265 respectively), so we recommend that researchers who wish to apply the results of this study first
266 determine S and V for their scenario, then estimate S* and V* using the ratios shown in Table 1,
267 and finally use these to calculate S*/V*. Our overall mean S*/V* ratio was 14% higher than the
268 “typical” value of S/V used by Nazaroff et al.5
Page 14 of 28Environmental Science: Processes & Impacts
123456789101112131415161718192021222324252627282930313233343536373839404142434445464748495051525354555657585960

14
269 As the large furnishings or appliances were similar across rooms of the same type, we found
270 that variability in surface area was attributable mainly to miscellaneous contents. By definition, a
271 neat room would have more open space and more organized contents than would a messy room.
272 A guest bedroom may have fewer miscellaneous contents in addition to the essentials (bed,
273 closet, lights, etc.), whereas a child’s bedroom may be less organized with more miscellaneous
274 contents. Typically, a messy room would have a higher S*/S ratio. In addition to size and shape,
275 the orientation of the contents can affect the amount of exposed surface area in a room. For
276 example, the exposed surface area of rectangular box with a high aspect ratio changes when the
277 box is flipped on its side.
278 The S/V and S*/V* ratios calculated in this study are consistent with those in the literature, as
279 summarized in Table 2. In previous studies of rooms in actual residences, the surface-to-volume
280 ratio, accounting for large furnishings at least, ranged from 1.6 (averaged across 43 living rooms
281 in Lee et al.3) to 5.4 m-1 (a bathroom in Hodgson et al.13), compared to our range of 2.0 to 6.8 m-1
282 (Table S1). Compared to a similar study by Hodgson et al.,13 our S*/V* ratio was 14% lower for
283 bedrooms, and our overall S*/V* ratio for all types of rooms, 3.2 m-1, was only 3% lower than
284 theirs of 3.3 m-1, excluding bathrooms. The categorization and types of rooms differed from
285 those described by Hodgson et al.13 All of the bedrooms in their study also functioned as an
286 office for the occupants, and the two offices were in residences. In our study, all bedrooms
287 primarily functioned as bedrooms, and only four out of 10 contained a desk and chair. The
288 offices in our study were in an academic building. Hodgson et al.13 included kitchens as part of
289 the common area, which also included living and dining rooms, hallways, and foyers, whereas
290 our study focused on kitchens separately from all other common areas. One difference between
291 this approach and Hodgson et al.’s13 is the handling of small objects. Hodgson et al.13 grouped
Page 15 of 28 Environmental Science: Processes & Impacts
123456789101112131415161718192021222324252627282930313233343536373839404142434445464748495051525354555657585960
15
292 small objects, between 300 and 2000 cm2, into three size bins and counted them instead of
293 measuring each object’s dimensions. In addition, they did not measure small miscellaneous
294 objects, less than 300 cm2, approximately the size of soda can, while we omitted some objects
295 that were smaller than ~100 cm2.
296 The good agreement between the two studies suggests that the results from a combined 55
297 rooms in the San Francisco Bay Area and Blacksburg, Virginia, may be broadly representative.
298 Even though there are regional differences in the housing stock across the country in terms of
299 age and type of construction, such differences probably matter less for the objects that people
300 keep in their rooms. One limitation of our sample is that the room occupants were mostly
301 university students and faculty, and it is possible that there are demographic differences in how
302 people furnish their rooms.
303
Page 16 of 28Environmental Science: Processes & Impacts
123456789101112131415161718192021222324252627282930313233343536373839404142434445464748495051525354555657585960
16
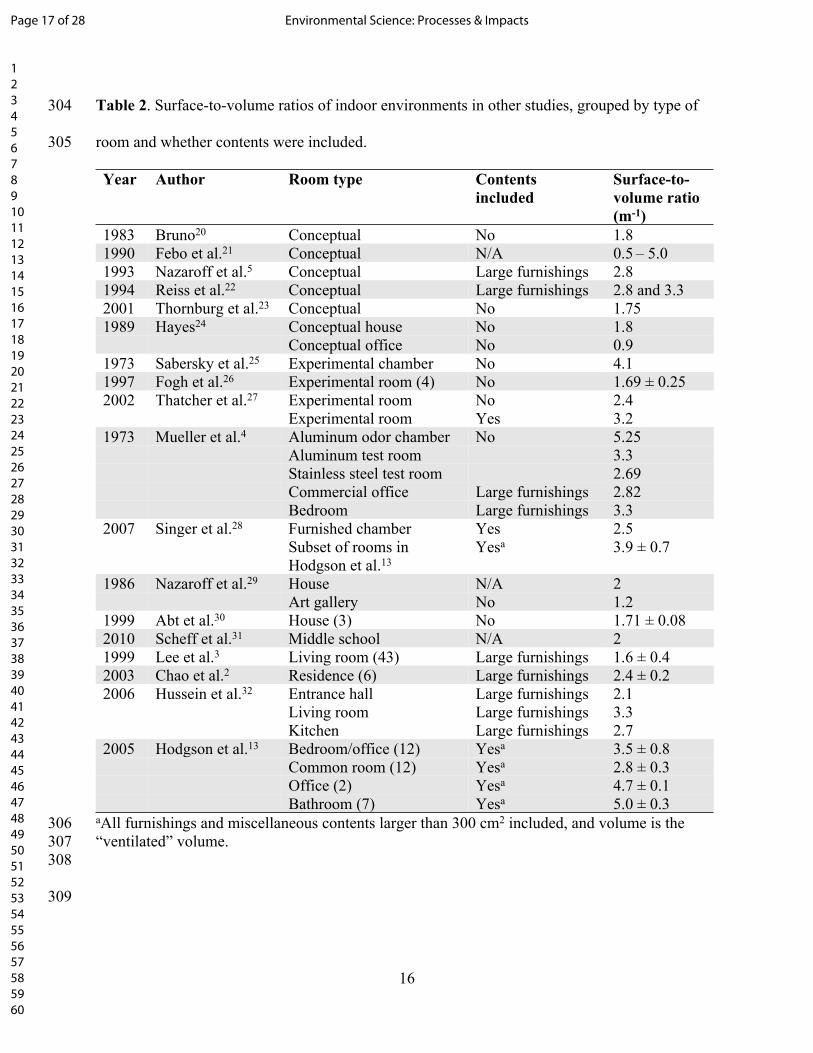
304 Table 2. Surface-to-volume ratios of indoor environments in other studies, grouped by type of
305 room and whether contents were included.
Year Author Room type Contents included
Surface-to-volume ratio (m-1)
1983 Bruno20 Conceptual No 1.81990 Febo et al.21 Conceptual N/A 0.5 – 5.01993 Nazaroff et al.5 Conceptual Large furnishings 2.81994 Reiss et al.22 Conceptual Large furnishings 2.8 and 3.32001 Thornburg et al.23 Conceptual No 1.751989 Hayes24 Conceptual house No 1.8
Conceptual office No 0.91973 Sabersky et al.25 Experimental chamber No 4.11997 Fogh et al.26 Experimental room (4) No 1.69 ± 0.252002 Thatcher et al.27 Experimental room No 2.4
Experimental room Yes 3.21973 Mueller et al.4 Aluminum odor chamber No 5.25
Aluminum test room 3.3Stainless steel test room 2.69Commercial office Large furnishings 2.82Bedroom Large furnishings 3.3
2007 Singer et al.28 Furnished chamber Yes 2.5Subset of rooms in Hodgson et al.13
Yesa 3.9 ± 0.7
1986 Nazaroff et al.29 House N/A 2Art gallery No 1.2
1999 Abt et al.30 House (3) No 1.71 ± 0.082010 Scheff et al.31 Middle school N/A 21999 Lee et al.3 Living room (43) Large furnishings 1.6 ± 0.42003 Chao et al.2 Residence (6) Large furnishings 2.4 ± 0.22006 Hussein et al.32 Entrance hall Large furnishings 2.1
Living room Large furnishings 3.3Kitchen Large furnishings 2.7
2005 Hodgson et al.13 Bedroom/office (12) Yesa 3.5 ± 0.8Common room (12) Yesa 2.8 ± 0.3Office (2) Yesa 4.7 ± 0.1Bathroom (7) Yesa 5.0 ± 0.3
306 aAll furnishings and miscellaneous contents larger than 300 cm2 included, and volume is the 307 “ventilated” volume.308
309
Page 17 of 28 Environmental Science: Processes & Impacts
123456789101112131415161718192021222324252627282930313233343536373839404142434445464748495051525354555657585960

17
310 These results have important implications for understanding the chemistry of indoor
311 environments. Accurate representation of pollutant deposition to surfaces is important for
312 predicting reactions that may take place on surfaces and health effects because deposition
313 eliminates the inhalation exposure route. Previous work has demonstrated that deposition of
314 gases and particles depends on both surface area and type of material. A study of particle losses
315 indoors showed that the deposition rate of submicron particles was ~2 times higher in a furnished
316 experimental room compared to an unfurnished room;27 the furnishings increased the surface
317 area by a factor of 1.3, less than the average increase of 1.5 reported here. Surface deposition
318 velocities for ozone, nitrogen dioxide (NO2), and sulfur dioxide (NO2) vary with material by a
319 factor of 100 or more and were found to be zero for NO2 and SO2 on glass.25, 33 A further
320 complication is that films of water or semi-volatile organic compounds may coat the surfaces.5,
321 34, 35 Laboratory experiments have shown that the reaction probabilities of ozone with 3-carene
322 and d-limonene, two monoterpenes that may be released from air fresheners, personal care or
323 cleaning products, and wood, vary by a factor of 3-10 across three different materials: glass,
324 polyvinylchloride, and zirconium silicate.36 Gas-surface partitioning depends on material; the
325 partition coefficient of di-2-ethylhexyl phthalate, a suspected endocrine disruptor, has been
326 shown to vary by a factor of 20 between acrylic and steel.11 These examples emphasize the
327 importance of properly characterizing the total surface area of indoor environments, as
328 demonstrated in an investigation of the impact of ozone-surface reactions on indoor air quality.37
329 In this study, we did not account for any of the contents present inside the closets, drawers,
330 and cabinets because we assumed that the air-exchange rate between the bulk air inside the room
331 and the air inside the closed space was much lower than that of the bulk air with outdoor air. If
332 any of the closets, drawers, or cabinets were open, S*/V* would increase since the objects
Page 18 of 28Environmental Science: Processes & Impacts
123456789101112131415161718192021222324252627282930313233343536373839404142434445464748495051525354555657585960

18
333 present within them would increase the amount of surface available for interactions with
334 particles and gases in the bulk room air. Although small open cabinets or drawers may only
335 increase S*/V* slightly, an open walk-in closet could produce a significantly higher ratio.
336 Similarly, we did not account for humans present in the room. The surface area of an average
337 human38 is 1.70 m2, which is negligible compared to the observed values of S*. However, if
338 several people were present in a room, such as in a classroom or during a social event, their
339 surface area could raise S*/V* substantially. Whether surfaces are oriented vertically or
340 horizontally, and particularly upward-facing, is important for particle deposition,39 but we did
341 not categorize orientation in this study.
342 Heating, ventilation, and air conditioning (HVAC) systems, which present surface area
343 beyond the occupied space, can also impact transport, transformation, and fate of pollutants in
344 indoor air. For example, residential HVAC filters have been shown to remove 10% of ozone
345 from air flowing through the system, and even more is removed by deposition to ducts.40 For a
346 single room, the surface area presented by ducts is small (<1% if we assume a 6-inch duct that is
347 five times the length of the room), but the surface area of filters and heat exchangers in the
348 HVAC system could substantially increase the surface-to-volume ratio of a building. Additional
349 measurements are needed to characterize fully the surface area of HVAC systems in buildings.
350 We measured surface area at a resolution of ~1 cm, much larger than the scale pertinent to
351 gases and particles. Measuring objects with higher resolution would produce much larger values
352 of S* and S*/V*. Using atomic force microscopy with a resolution of ~5 nm, we previously
353 showed that the surface area of smooth, flat materials including glass, aluminum, plastic, and
354 stainless steel was up to 2.1 times higher than the projected surface area.11 A study using a
355 surface topography approach concluded that the “real” surface area of selected materials (vinyl,
Page 19 of 28 Environmental Science: Processes & Impacts
123456789101112131415161718192021222324252627282930313233343536373839404142434445464748495051525354555657585960

19
356 wallpaper, chipboard, plywood, plaster, and concrete) was up to 1.04 times higher than the
357 projected area.41 The difference would be much higher for “rougher” materials, especially
358 fibrous ones such as carpets. If the surface roughnesses of all materials in a room were known,
359 one could combine them with geometric surface area measurements to estimate total surface
360 area. Clearly, measurement resolution has a sizeable impact on estimates of surface area and
361 should be considered carefully in future studies. However, the projected surface area remains
362 relevant because most experiments to determine deposition velocities use it. Roughness is
363 especially important when considering adsorption on surfaces, and it also affects the deposition
364 velocity of particles.41, 42
365 Measuring all the contents of a room is time-consuming and tedious (4-8 hours per room in
366 this study), so the question arises, “How many items do we need to measure to capture most of
367 the surface area?” Figure 3 shows the cumulative surface area in each room as a function of the
368 number of items ordered from largest to smallest in terms of surface area. The number of items
369 that contribute to 95% of the exposed surface area ranges from 14 to 26. Measuring 20 items
370 captures at least 90% of the surface area, and measuring 25 items captures at least 95% of the
371 surface area. In this enumeration, each wall, the floor, and the ceiling count as a different object,
372 so these would account for six objects in a typical room. As volume incorporates another
373 dimension, the smaller objects are even less important in estimating the total volume of objects
374 in a room to calculate the volume of bulk air. Very small items, even if highly reactive, will not
375 contribute much to overall deposition. Another labor-saving approach might be to use image
376 processing or Light Detection and Ranging (LIDAR) to measure surface area, although these
377 would require considerable method development.
378
Page 20 of 28Environmental Science: Processes & Impacts
123456789101112131415161718192021222324252627282930313233343536373839404142434445464748495051525354555657585960

20
379
380 Figure 3. Number of items, including floor, ceiling, and each wall, required to achieve a certain
381 amount of the total exposed surface area. Red is bedrooms, blue is kitchens, and green is offices.
382 The dashed line indicates 90% of the total surface area.
383
384 Conclusions
385 We measured the surface-to-volume ratio, including and excluding contents, of 10 bedrooms,
386 nine kitchens, and three offices, in buildings in Virginia. Across all types of rooms, the average
387 ratio of surface area with contents to that without, S*/S, was 1.5 ± 0.3 (mean ± standard
388 deviation), meaning that the contents of a room contributed to the total surface area another 50%
389 beyond the area of the walls, floor, and ceiling. The average ratio of volume of bulk air to
390 volume of the entire room, V*/V, was 0.9 ± 0.1, meaning that the contents occupied only about
391 10% of space in a room. S/V was 1.8 ± 0.3 m-1, and S*/V* was 3.2 ± 1.2 m-1, 80% higher
392 compared to the ratio that ignores contents. These ratios were not significantly different by type
393 of room, except for V*/V, which was smaller for kitchens. Generally, the amount of
Page 21 of 28 Environmental Science: Processes & Impacts
123456789101112131415161718192021222324252627282930313233343536373839404142434445464748495051525354555657585960

21
394 miscellaneous contents beyond major furnishings and appliances dictated S*/V*, and more
395 cluttered rooms, of course, had a higher S*/V*. While these measurements contribute new
396 information about surface area indoors, they underestimate the true surface area that is accessible
397 to gases and particles, as we necessarily used a resolution of ~1 cm. The largest 14-26 objects in
398 a room accounted for 95% of its total surface area.
399 We also characterized the shape and material of objects in the rooms. The majority of objects
400 were flat surfaces, dominated by walls, floor, ceiling, cabinets, closet doors, and windows. Paint
401 was typically the most common surface type, largely due to walls and ceilings. This work will
402 help improve the representation of surfaces in the indoor environment, and results can be used to
403 improve models of the fate and transport of gases and particles in indoor environments.
404
405 Conflicts of Interest
406 There are no conflicts to declare.
407
408 Acknowledgments
409 This research was supported by the United States Environmental Protection Agency (RD-
410 83560601-0) and the National Science Foundation (ECCS-1542100). The authors thank those
411 who volunteered their homes and offices for this study and Gabriel Isaacman-VanWertz for
412 valuable feedback on the research.
413
414 References
415 1. N. E. Klepeis, W. C. Nelson, W. R. Ott, J. P. Robinson, A. M. Tsang, P. Switzer, J. V.
416 Behar, S. C. Hern and W. H. Engelmann, The National Human Activity Pattern Survey
Page 22 of 28Environmental Science: Processes & Impacts
123456789101112131415161718192021222324252627282930313233343536373839404142434445464748495051525354555657585960
22
417 (NHAPS): a resource for assessing exposure to environmental pollutants, Journal of
418 Exposure Science and Environmental Epidemiology, 2001, 11, 231-252.
419 2. C. Y. H. Chao, M. P. Wan and E. C. K. Cheng, Penetration coefficient and deposition
420 rate as a function of particle size in non-smoking naturally ventilated residences,
421 Atmospheric Environment, 2003, 37, 4233-4241.
422 3. K. Lee, J. Vallarino, T. Dumyahn, H. Ozkaynak and J. D. Spengler, Ozone decay rates in
423 residences, Journal of the Air and Waste Management Association, 1999, 49, 1238-1244.
424 4. F. X. Mueller, L. Loeb and W. H. Mapes, Decomposition rates of ozone in living areas,
425 Environmental Science & Technology, 1973, 7, 342-346.
426 5. W. Nazaroff, A. Gadgil and C. Weschler, Critique of the use of deposition velocity in
427 modeling indoor air quality, in Modeling of Indoor Air Quality and Exposure, ASTM
428 International, West Conshohocken, PA, 1993, vol. STP1205-EB, pp. 81-104.
429 6. C. J. Weschler, H. Shields and B. M. Shah, Understanding and reducing the indoor
430 concentration of submicron particles at a commercial building in southern California,
431 Journal of the Air and Waste Management Association, 1996, 46, 291-299.
432 7. H. Wang and G. C. Morrison, Ozone-initiated secondary emission rates of aldehydes
433 from indoor surfaces in four homes, Environmental Science & Technology, 2006, 40,
434 5263-5268.
435 8. I. Eames and S. B. Dalziel, Dust resuspension by the flow around an impacting sphere,
436 Journal of Fluid Mechanics, 2000, 403, 305-328.
437 9. I. Goldasteh, G. Ahmadi and A. R. Ferro, Wind tunnel study and numerical simulation of
438 dust particle resuspension from indoor surfaces in turbulent flows, Journal of Adhesion
439 Science and Technology, 2013, 27, 1563-1579.
Page 23 of 28 Environmental Science: Processes & Impacts
123456789101112131415161718192021222324252627282930313233343536373839404142434445464748495051525354555657585960

23
440 10. C. J. Weschler and W. W. Nazaroff, Semivolatile organic compounds in indoor
441 environments, Atmospheric Environment, 2008, 42, 9018-9040.
442 11. Y. Wu, C. M. A. Eichler, W. Leng, S. S. Cox, L. C. Marr and J. C. Little, Adsorption of
443 hhthalates on impervious indoor surfaces, Environmental Science & Technology, 2017,
444 51, 2907-2913.
445 12. M. Sleiman, L. A. Gundel, J. F. Pankow, P. Jacob, 3rd, B. C. Singer and H. Destaillats,
446 Formation of carcinogens indoors by surface-mediated reactions of nicotine with nitrous
447 acid, leading to potential thirdhand smoke hazards, Proceedings of the National Academy
448 of Sciences, 2010, 107, 6576-6581.
449 13. A. T. Hodgson, K. Y. Ming and B. C. Singer, Quantifying object and material surface
450 areas in residences, Indoor Environment Department Report LBNL-56786, Lawrence
451 Berkeley Laboratory, 2004.
452 14. J. H. Seinfeld and S. N. Pandis, Atmospheric Chemistry and Physics - From Air Pollution
453 to Climate Change, John Wiley & Sons, Inc., Hoboken, New Jersey, Second edn., 2006
454 15. P. J. Jones and G. E. Whittle, Computational fluid dynamics for building air flow
455 prediction—current status and capabilities, Building and Environment, 1992, 27, 321-
456 338.
457 16. K. L. Abdullahi, J. M. Delgado-Saborit and R. M. Harrison, Emissions and indoor
458 concentrations of particulate matter and its specific chemical components from cooking:
459 A review, Atmospheric Environment, 2013, 71, 260-294.
460 17. J. M. Logue, N. E. Klepeis, A. B. Lobscheid and B. C. Singer, Pollutant exposures from
461 natural gas cooking burners: a simulation-based assessment for Southern California,
462 Environmental Health Perspectives, 2014, 122, 43-50.
Page 24 of 28Environmental Science: Processes & Impacts
123456789101112131415161718192021222324252627282930313233343536373839404142434445464748495051525354555657585960

24
463 18. N. Seltenrich, Take care in the kitchen: avoiding cooking-related pollutants,
464 Environmental Health Perspectives, 2014, 122, A154-A159.
465 19. U.S. Census Bureau, American Housing Survey, 2018,
466 https://www.census.gov/programs-surveys/ahs/data.html, (accessed 22 January 2019).
467 20. R. C. Bruno, Verifying a model of radon decay product behavior indoors, Health Physics,
468 1983, 45, 471-480.
469 21. A. Febo and C. Perrino, Prediction and experimental evidence for high air concentration
470 of nitrous acid in indoor environments, Atmospheric Environment. Part A. General
471 Topics, 1991, 25, 1055-1061.
472 22. R. Reiss, P. B. Ryan and P. Koutrakis, Modeling ozone deposition onto indoor residential
473 surfaces, Environmental Science & Technology, 1994, 28, 504-513.
474 23. J. Thornburg, D. S. Ensor, C. E. Rodes, P. A. Lawless, L. E. Sparks and R. B. Mosley,
475 Penetration of particles into buildings and associated physical factors. Part I: model
476 development and computer simulations, Aerosol Science and Technology, 2001, 34, 284-
477 296.
478 24. S. R. Hayes, Estimating the effect of being indoors on total personal exposure to outdoor
479 air pollution, JAPCA, 1989, 39, 1453-1461.
480 25. R. H. Sabersky, D. A. Sinema and F. H. Shair, Concentrations, decay rates, and removal
481 of ozone and their relation to establishing clean indoor air, Environmental Science &
482 Technology, 1973, 7, 347-353.
483 26. C. L. Fogh, M. A. Byrne, J. Roed and A. J. H. Goddard, Size specific indoor aerosol
484 deposition measurements and derived I/O concentrations ratios, Atmospheric
485 Environment, 1997, 31, 2193-2203.
Page 25 of 28 Environmental Science: Processes & Impacts
123456789101112131415161718192021222324252627282930313233343536373839404142434445464748495051525354555657585960

25
486 27. T. L. Thatcher, A. C. K. Lai, R. Moreno-Jackson, R. G. Sextro and W. W. Nazaroff,
487 Effects of room furnishings and air speed on particle deposition rates indoors,
488 Atmospheric Environment, 2002, 36, 1811-1819.
489 28. B. C. Singer, A. T. Hodgson, T. Hotchi, K. Y. Ming, R. G. Sextro, E. E. Wood and N. J.
490 Brown, Sorption of organic gases in residential rooms, Atmospheric Environment, 2007,
491 41, 3251-3265.
492 29. W. W. Nazaroff and G. R. Cass, Mathematical modeling of chemically reactive
493 pollutants in indoor air, Environmental Science & Technology, 1986, 20, 924-934.
494 30. E. Abt, H. H. Suh, G. Allen and P. Koutrakis, Characterization of indoor particle sources:
495 A study conducted in the metropolitan Boston area, Environmental Health Perspectives,
496 2000, 108, 35-44.
497 31. P. A. Scheff, V. K. Paulius, L. Curtis and L. M. Conroy, Indoor air quality in a middle
498 school, Part II: Development of emission factors for particulate matter and bioaerosols,
499 Applied Occupational and Environmental Hygiene, 2000, 15, 835-842.
500 32. T. Hussein, T. Glytsos, J. Ondráček, P. Dohányosová, V. Ždímal, K. Hämeri, M.
501 Lazaridis, J. Smolík and M. Kulmala, Particle size characterization and emission rates
502 during indoor activities in a house, Atmospheric Environment, 2006, 40, 4285-4307.
503 33. T. Grøntoft and M. R. Raychaudhuri, Compilation of tables of surface deposition
504 velocities for O3, NO2 and SO2 to a range of indoor surfaces, Atmospheric Environment,
505 2004, 38, 533-544.
506 34. C. J. Weschler and W. W. Nazaroff, Growth of organic films on indoor surfaces, Indoor
507 Air, 2017, 27, 1101-1112.
Page 26 of 28Environmental Science: Processes & Impacts
123456789101112131415161718192021222324252627282930313233343536373839404142434445464748495051525354555657585960

26
508 35. C. M. A. Eichler, J. Cao, G. Isaacman-VanWertz and J. C. Little, Modeling the formation
509 and growth of organic films on indoor surfaces, Indoor Air, 2019, 29, 17-29.
510 36. M. Springs, J. R. Wells and G. C. Morrison, Reaction rates of ozone and terpenes
511 adsorbed to model indoor surfaces, Indoor Air, 2011, 21, 319-327.
512 37. M. Kruza, A. C. Lewis, G. C. Morrison and N. Carslaw, Impact of surface ozone
513 interactions on indoor air chemistry: A modeling study, Indoor Air, 2017, 27, 1001-1011.
514 38. E. A. Gehan and S. L. George, Estimation of human body surface area from height and
515 weight, Cancer Chemotherapy Reports, 1970, 54, 225-235.
516 39. A. C. K. Lai and W. W. Nazaroff, Modeling indoor particle deposition from turbulent
517 flow onto smooth surfaces, Journal of Aerosol Science, 2000, 31, 463-476.
518 40. P. Zhao, J. A. Siegel and R. L. Corsi, Ozone removal by HVAC filters, Atmospheric
519 Environment, 2007, 41, 3151-3160.
520 41. S. El-Hamdani, K. Limam, M. O. Abadie and A. Bendou, Deposition of fine particles on
521 building internal surfaces, Atmospheric Environment, 2008, 42, 8893-8901.
522 42. B. Zhao and J. Wu, Particle deposition in indoor environments: Analysis of influencing
523 factors, Journal of Hazardous Materials, 2007, 147, 439-448.
524
Page 27 of 28 Environmental Science: Processes & Impacts
123456789101112131415161718192021222324252627282930313233343536373839404142434445464748495051525354555657585960

TOC Entry
Objects in a room add 50% to its surface area beyond the walls, ceiling, and floor.
Page 28 of 28Environmental Science: Processes & Impacts
123456789101112131415161718192021222324252627282930313233343536373839404142434445464748495051525354555657585960