total retinal blood flow measurement with ultrahigh speed ... · total retinal blood flow...
TRANSCRIPT
Total retinal blood flow measurement
with ultrahigh speed
swept source/Fourier domain OCT
Bernhard Baumann,1,2
Benjamin Potsaid,1,3
Martin F. Kraus,1,4
Jonathan J. Liu,1
David Huang,5 Joachim Hornegger,
4,6 Alex E. Cable,
3 Jay S. Duker,
2 and
James G. Fujimoto1,*
1Department of Electrical Engineering and Computer Science, and Research Laboratory of Electronics,
Massachusetts Institute of Technology, Cambridge, MA 02139, USA 2New England Eye Center and Tufts Medical Center, Tufts University, Boston, MA 02116, USA
3Advanced Imaging Group, Thorlabs, Inc., Newton, NJ 07860, USA 4Pattern Recognition Lab, University Erlangen-Nuremberg, D-91058 Erlangen, Germany
5Casey Eye Institute, Oregon Health & Science University, Portland, OR 97239, USA 6School of Advanced Optical Technologies, University Erlangen-Nuremberg, D-91052 Erlangen, Germany
Abstract: Doppler OCT provides depth-resolved information on flow in
biological tissues. In this article, we demonstrate ultrahigh speed swept
source/Fourier domain OCT for visualization and quantitative assessment of
retinal blood flow. Using swept laser technology, the system operated in the
1050-nm wavelength range at a high axial scan rate of 200 kHz. The rapid
imaging speed not only enables volumetric imaging with high axial scan
densities, but also enables measurement of high flow velocities in the
central retinal vessels. Deep penetration in the optic nerve and lamina
cribrosa was achieved by imaging at 1-µm wavelengths. By analyzing en-
face images extracted from 3D Doppler data sets, absolute flow in single
vessels as well as total retinal blood flow was measured using a simple and
robust protocol that does not require measurement of Doppler angles. The
results from measurements in healthy eyes suggest that ultrahigh speed
swept source/Fourier domain OCT could be a promising technique for
volumetric imaging of retinal vasculature and quantitation of retinal blood
flow in a wide range of retinal diseases.
©2011 Optical Society of America
OCIS codes: (170.3880) Medical and biological imaging; (170.4500) Optical coherence
tomography; (280.2490) Flow diagnostics; (170.4470) Ophthalmology.
References and links
1. J. Flammer, S. Orgül, V. P. Costa, N. Orzalesi, G. K. Krieglstein, L. M. Serra, J. P. Renard, and E. Stefánsson,
―The impact of ocular blood flow in glaucoma,‖ Prog. Retin. Eye Res. 21(4), 359–393 (2002).
2. L. Schmetterer and M. Wolzt, ―Ocular blood flow and associated functional deviations in diabetic retinopathy,‖ Diabetologia 42(4), 387–405 (1999).
3. E. Friedman, ―A hemodynamic model of the pathogenesis of age-related macular degeneration,‖ Am. J.
Ophthalmol. 124(5), 677–682 (1997). 4. L. Schmetterer and G. Garhofer, ―How can blood flow be measured?‖ Surv. Ophthalmol. 52(6 Suppl 2), S134–
S138 (2007).
5. W. E. Lieb, S. M. Cohen, D. A. Merton, J. A. Shields, D. G. Mitchell, and B. B. Goldberg, ―Color Doppler imaging of the eye and orbit. Technique and normal vascular anatomy,‖ Arch. Ophthalmol. 109(4), 527–531
(1991).
6. G. T. Feke, H. Tagawa, D. M. Deupree, D. G. Goger, J. Sebag, and J. J. Weiter, ―Blood flow in the normal human retina,‖ Invest. Ophthalmol. Vis. Sci. 30(1), 58–65 (1989).
7. C. E. Riva, J. E. Grunwald, S. H. Sinclair, and B. L. Petrig, ―Blood velocity and volumetric flow rate in human
retinal vessels,‖ Invest. Ophthalmol. Vis. Sci. 26(8), 1124–1132 (1985). 8. G. T. Feke, D. G. Goger, H. Tagawa, and F. C. Delori, ―Laser Doppler technique for absolute measurement of
blood speed in retinal vessels,‖ IEEE Trans. Biomed. Eng. BME-34(9), 673–800 (1987).
#143940 - $15.00 USD Received 16 Mar 2011; revised 11 May 2011; accepted 11 May 2011; pub. 13 May 2011(C) 2011 OSA 1 June 2011 / Vol. 2, No. 6 / BIOMEDICAL OPTICS EXPRESS 1539

9. D. Huang, E. A. Swanson, C. P. Lin, J. S. Schuman, W. G. Stinson, W. Chang, M. R. Hee, T. Flotte, K. Gregory,
C. A. Puliafito, and J. G. Fujimoto, ―Optical coherence tomography,‖ Science 254(5035), 1178–1181 (1991). 10. W. Drexler and J. G. Fujimoto, ―State-of-the-art retinal optical coherence tomography,‖ Prog. Retin. Eye Res.
27(1), 45–88 (2008).
11. R. Leitgeb, C. K. Hitzenberger, and A. F. Fercher, ―Performance of fourier domain vs. time domain optical coherence tomography,‖ Opt. Express 11(8), 889–894 (2003).
12. J. F. de Boer, B. Cense, B. H. Park, M. C. Pierce, G. J. Tearney, and B. E. Bouma, ―Improved signal-to-noise
ratio in spectral-domain compared with time-domain optical coherence tomography,‖ Opt. Lett. 28(21), 2067–2069 (2003).
13. M. A. Choma, M. V. Sarunic, C. H. Yang, and J. A. Izatt, ―Sensitivity advantage of swept source and Fourier
domain optical coherence tomography,‖ Opt. Express 11(18), 2183–2189 (2003). 14. R. Huber, M. Wojtkowski, and J. G. Fujimoto, ―Fourier Domain Mode Locking (FDML): A new laser operating
regime and applications for optical coherence tomography,‖ Opt. Express 14(8), 3225–3237 (2006).
15. B. Potsaid, I. Gorczynska, V. J. Srinivasan, Y. L. Chen, J. Jiang, A. Cable, and J. G. Fujimoto, ―Ultrahigh speed spectral/Fourier domain OCT ophthalmic imaging at 70,000 to 312,500 axial scans per second,‖ Opt. Express
16(19), 15149–15169 (2008).
16. W. Wieser, B. R. Biedermann, T. Klein, C. M. Eigenwillig, and R. Huber, ―Multi-megahertz OCT: High quality 3D imaging at 20 million A-scans and 4.5 GVoxels per second,‖ Opt. Express 18(14), 14685–14704 (2010).
17. A. F. Fercher, C. K. Hitzenberger, G. Kamp, and S. Y. Elzaiat, ―Measurement of intraocular distances by
backscattering spectral interferometry,‖ Opt. Commun. 117(1-2), 43–48 (1995). 18. F. Lexer, C. K. Hitzenberger, A. F. Fercher, and M. Kulhavy, ―Wavelength-tuning interferometry of intraocular
distances,‖ Appl. Opt. 36(25), 6548–6553 (1997).
19. B. Golubovic, B. E. Bouma, G. J. Tearney, and J. G. Fujimoto, ―Optical frequency-domain reflectometry using rapid wavelength tuning of a Cr4+:forsterite laser,‖ Opt. Lett. 22(22), 1704–1706 (1997).
20. J. A. Izatt, M. D. Kulkarni, S. Yazdanfar, J. K. Barton, and A. J. Welch, ―In vivo bidirectional color Doppler
flow imaging of picoliter blood volumes using optical coherence tomography,‖ Opt. Lett. 22(18), 1439–1441 (1997).
21. Z. Chen, T. E. Milner, D. Dave, and J. S. Nelson, ―Optical Doppler tomographic imaging of fluid flow velocity in highly scattering media,‖ Opt. Lett. 22(1), 64–66 (1997).
22. R. A. Leitgeb, L. Schmetterer, W. Drexler, A. F. Fercher, R. J. Zawadzki, and T. Bajraszewski, ―Real-time
assessment of retinal blood flow with ultrafast acquisition by color Doppler Fourier domain optical coherence tomography,‖ Opt. Express 11(23), 3116–3121 (2003).
23. S. Makita, Y. Hong, M. Yamanari, T. Yatagai, and Y. Yasuno, ―Optical coherence angiography,‖ Opt. Express
14(17), 7821–7840 (2006). 24. T. Schmoll, C. Kolbitsch, and R. A. Leitgeb, ―Ultra-high-speed volumetric tomography of human retinal blood
flow,‖ Opt. Express 17(5), 4166–4176 (2009).
25. A. Szkulmowska, M. Szkulmowski, D. Szlag, A. Kowalczyk, and M. Wojtkowski, ―Three-dimensional
quantitative imaging of retinal and choroidal blood flow velocity using joint Spectral and Time domain Optical
Coherence Tomography,‖ Opt. Express 17(13), 10584–10598 (2009).
26. L. An, H. M. Subhush, D. J. Wilson, and R. K. Wang, ―High-resolution wide-field imaging of retinal and choroidal blood perfusion with optical microangiography,‖ J. Biomed. Opt. 15(2), 026011 (2010).
27. S. Makita, T. Fabritius, and Y. Yasuno, ―Quantitative retinal-blood flow measurement with three-dimensional
vessel geometry determination using ultrahigh-resolution Doppler optical coherence angiography,‖ Opt. Lett. 33(8), 836–838 (2008).
28. Y. Wang, A. Lu, J. Gil-Flamer, O. Tan, J. A. Izatt, and D. Huang, ―Measurement of total blood flow in the
normal human retina using Doppler Fourier-domain optical coherence tomography,‖ Br. J. Ophthalmol. 93(5), 634–637 (2009).
29. H. Wehbe, M. Ruggeri, S. Jiao, G. Gregori, C. A. Puliafito, and W. Zhao, ―Automatic retinal blood flow
calculation using spectral domain optical coherence tomography,‖ Opt. Express 15(23), 15193–15206 (2007). 30. Y. K. Tao, K. M. Kennedy, and J. A. Izatt, ―Velocity-resolved 3D retinal microvessel imaging using single-pass
flow imaging spectral domain optical coherence tomography,‖ Opt. Express 17(5), 4177–4188 (2009).
31. R. M. Werkmeister, N. Dragostinoff, M. Pircher, E. Götzinger, C. K. Hitzenberger, R. A. Leitgeb, and L. Schmetterer, ―Bidirectional Doppler Fourier-domain optical coherence tomography for measurement of absolute
flow velocities in human retinal vessels,‖ Opt. Lett. 33(24), 2967–2969 (2008).
32. V. J. Srinivasan, S. Sakadzić, I. Gorczynska, S. Ruvinskaya, W. C. Wu, J. G. Fujimoto, and D. A. Boas, ―Quantitative cerebral blood flow with optical coherence tomography,‖ Opt. Express 18(3), 2477–2494 (2010).
33. B. Potsaid, B. Baumann, D. Huang, S. Barry, A. E. Cable, J. S. Schuman, J. S. Duker, and J. G. Fujimoto,
―Ultrahigh speed 1050nm swept source/Fourier domain OCT retinal and anterior segment imaging at 100,000 to 400,000 axial scans per second,‖ Opt. Express 18(19), 20029–20048 (2010).
34. I. Grulkowski, I. Gorczynska, M. Szkulmowski, D. Szlag, A. Szkulmowska, R. A. Leitgeb, A. Kowalczyk, and
M. Wojtkowski, ―Scanning protocols dedicated to smart velocity ranging in spectral OCT,‖ Opt. Express 17(26), 23736–23754 (2009).
35. B. Povazay, K. Bizheva, B. Hermann, A. Unterhuber, H. Sattmann, A. F. Fercher, W. Drexler, C. Schubert, P. K.
Ahnelt, M. Mei, R. Holzwarth, W. J. Wadsworth, J. C. Knight, and P. S. Russell, ―Enhanced visualization of
#143940 - $15.00 USD Received 16 Mar 2011; revised 11 May 2011; accepted 11 May 2011; pub. 13 May 2011(C) 2011 OSA 1 June 2011 / Vol. 2, No. 6 / BIOMEDICAL OPTICS EXPRESS 1540
choroidal vessels using ultrahigh resolution ophthalmic OCT at 1050 nm,‖ Opt. Express 11(17), 1980–1986
(2003). 36. A. Unterhuber, B. Povazay, B. Hermann, H. Sattmann, A. Chavez-Pirson, and W. Drexler, ―In vivo retinal
optical coherence tomography at 1040 nm—enhanced penetration into the choroid,‖ Opt. Express 13(9), 3252–
3258 (2005). 37. Y. Yasuno, Y. J. Hong, S. Makita, M. Yamanari, M. Akiba, M. Miura, and T. Yatagai, ―In vivo high-contrast
imaging of deep posterior eye by 1-μm swept source optical coherence tomography and scattering optical
coherence angiography,‖ Opt. Express 15(10), 6121–6139 (2007). 38. Y. L. Chen, D. L. Burnes, M. de Bruin, M. Mujat, and J. F. de Boer, ―Three-dimensional pointwise comparison
of human retinal optical property at 845 and 1060 nm using optical frequency domain imaging,‖ J. Biomed. Opt.
14(2), 024016 (2009). 39. S. H. Yun, G. J. Tearney, J. F. de Boer, and B. E. Bouma, ―Motion artifacts in optical coherence tomography
with frequency-domain ranging,‖ Opt. Express 12(13), 2977–2998 (2004).
40. J. Walther, A. Krüger, M. Cuevas, and E. Koch, ―Effects of axial, transverse, and oblique sample motion in FD OCT in systems with global or rolling shutter line detector,‖ J. Opt. Soc. Am. A 25(11), 2791–2802 (2008).
41. W.-Y. Oh, B. J. Vakoc, M. Shishkov, G. J. Tearney, and B. E. Bouma, ―>400 kHz repetition rate wavelength-
swept laser and application to high-speed optical frequency domain imaging,‖ Opt. Lett. 35(17), 2919–2921 (2010).
42. C. Dorrer, N. Belabas, J. P. Likforman, and M. Joffre, ―Spectral resolution and sampling issues in Fourier-
transform spectral interferometry,‖ J. Opt. Soc. Am. B 17(10), 1795–1802 (2000). 43. M. Wojtkowski, V. J. Srinivasan, T. H. Ko, J. G. Fujimoto, A. Kowalczyk, and J. S. Duker, ―Ultrahigh-
resolution, high-speed, Fourier domain optical coherence tomography and methods for dispersion
compensation,‖ Opt. Express 12(11), 2404–2422 (2004). 44. R. Bracewell, The Fourier Transform and Its Application (McGraw-Hill Science/Engineering/Math, 1999).
45. Y. Yasuno, V. D. Madjarova, S. Makita, M. Akiba, A. Morosawa, C. Chong, T. Sakai, K.-P. Chan, M. Itoh, and
T. Yatagai, ―Three-dimensional and high-speed swept-source optical coherence tomography for in vivo investigation of human anterior eye segments,‖ Opt. Express 13(26), 10652–10664 (2005).
46. B. Baumann, E. Götzinger, M. Pircher, and C. K. Hitzenberger, ―Single camera based spectral domain polarization sensitive optical coherence tomography,‖ Opt. Express 15(3), 1054–1063 (2007).
47. M. Mujat, B. H. Park, B. Cense, T. C. Chen, and J. F. de Boer, ―Autocalibration of spectral-domain optical
coherence tomography spectrometers for in vivo quantitative retinal nerve fiber layer birefringence determination,‖ J. Biomed. Opt. 12(4), 041205 (2007).
48. B. J. Vakoc, S. H. Yun, J. F. de Boer, G. J. Tearney, and B. E. Bouma, ―Phase-resolved optical frequency domain
imaging,‖ Opt. Express 13(14), 5483–5493 (2005). 49. M. Yamanari, Y. Lim, S. Makita, and Y. Yasuno, ―Visualization of phase retardation of deep posterior eye by
polarization-sensitive swept-source optical coherence tomography with 1-μm probe,‖ Opt. Express 17(15),
12385–12396 (2009).
50. A. S. G. Singh, C. Kolbitsch, T. Schmoll, and R. A. Leitgeb, ―Stable absolute flow estimation with Doppler OCT
based on virtual circumpapillary scans,‖ Biomed. Opt. Express 1(4), 1047–1058 (2010).
51. T. Schmoll, T. Lasser, and R. A. Leitgeb, ―Cyclic reconstruction of 4D retinal blood flow with pulse
synchronization,‖ Proc. SPIE 7168, 71680A, 71680A-5 (2009).
1. Introduction
Serious ocular diseases such as glaucoma, diabetic retinopathy and age-related macular
degeneration are connected with abnormalities in retinal blood flow [1–3]. Comprehensive
knowledge of ocular perfusion is important not only for treatment, but also for understanding
the pathophysiology of these diseases. Hence, there is great demand for methods to assess
ocular blood flow in vivo. In the last decades, several different techniques have been
developed to assess perfusion in the human eye [4]. Angiographic methods are based on
imaging an injected fluorescent dye and allow for visualization of vascular structures. The
Doppler effect has been exploited for various techniques such as ultrasound-based color
Doppler imaging (CDI), laser Doppler velocimetry (LDV) or Doppler optical coherence
tomography (OCT). CDI combines B-mode images with velocity information obtained from
the Doppler shift of the erythrocytes moving in the retrobulbar vessels [5]. Using CDI, it is
possible to access information on pulsatile blood flow; however, since the vessel diameters
cannot be quantified with this technique, total blood flow cannot be determined. Laser speckle
techniques suffer from the same drawback. They estimate flow velocity from the rate of
variation of the speckle pattern. LDV is an approach to measure blood velocity in retinal
arterioles and venules using the Doppler shift of light. Total blood flow in a single vessel can
be calculated from an additional measurement of the retinal vessel diameter [6,7]. The Laser
#143940 - $15.00 USD Received 16 Mar 2011; revised 11 May 2011; accepted 11 May 2011; pub. 13 May 2011(C) 2011 OSA 1 June 2011 / Vol. 2, No. 6 / BIOMEDICAL OPTICS EXPRESS 1541

Doppler blood flowmeter (Canon) is a commercially available instrument that combines LDV
with a retinal vessel diameter assessment system, which makes it the only device on the
market capable of measuring retinal volumetric blood flow—one of the key parameters for
understanding retinal physiology—in absolute units [7,8].
OCT enables non-contact imaging of transparent and scattering tissue with micrometer
scale resolution [9]. In ophthalmology, OCT has become an indispensable tool for diagnosis
of disease and monitoring therapy due to its ability to perform high resolution depth-resolved
cross-sectional imaging of retinal structures [10]. Recent advances in sensitivity and imaging
speed using Fourier domain detection have enabled the acquisition of three dimensional (3D)
data sets comprising several tens, or even hundreds of thousands of axial scans within a few
seconds [11–16]. Fourier domain OCT relies on the detection of the spectral interference
pattern and can be performed either using spectrometer based detection (spectral/Fourier
domain OCT) or using a swept laser source (swept source/Fourier domain OCT) [17–19].
Doppler OCT (or optical Doppler tomography, ODT) is a functional extension of OCT
that enables the measurement of flow in biological tissues [20,21]. Doppler OCT combines
the principles of LDV and OCT by detecting Doppler shifts generated by moving scatterers as
a function of depth. In contrast to most other techniques for blood flow measurements,
Doppler OCT provides both structural and functional information. Using high-speed Fourier
domain Doppler OCT, retinal and choroidal vasculature has been visualized in 3D [22–26].
Several approaches have been proposed to assess total blood flow in retinal vessels. Since
Doppler OCT measures only the velocity component parallel to the optical beam, the Doppler
angle, i.e. the angle between flow direction and optical beam, must be determined from the
retinal structure in order to calculate absolute flow velocities [27–30]. Using the absolute flow
velocity and measuring vessel cross-section area, total flow values can be calculated. Another
approach is to detect Doppler shifts in two different directions using two beams impinging at
different angles, similar to bidirectional LDV [31]. This approach does not require knowledge
of the vessel angle; however, it adds additional system complexity.
In this paper, a new approach for measuring total retinal blood flow is presented which is
based on a technique for cerebral blood flow measurement recently published by Srinivasan et
al. [32]. By measuring the flow at a fixed angle of 0°, i.e. in a plane perpendicular to the
optical beam, this technique does not require measurement of the vessel angle. An ultrahigh
speed swept source OCT instrument operating at 200 kHz was used for imaging the optic disk
in healthy eyes in vivo [33]. This system is especially suited for Doppler OCT because (i) the
high speed enables dense sampling of 3D data sets as well as the detection of high flow
velocities [24,34], (ii) the 1-μm wavelength range has been demonstrated to provide deeper
penetration into the retina and optic nerve, thus enabling the measurement of papillary retinal
vessels [35–38], and (iii) swept source detection has been shown to be more robust to fringe
washout when detecting high flow velocities [39,40].
2. Methods
2.1 Ultrahigh speed swept-source/Fourier domain system
The system is based on a recently developed ultrahigh speed swept source/Fourier domain
OCT instrument [33]. A commercially available short cavity laser was used as a light source
(Axsun Technologies, Inc.). The swept output spectrum of the laser was centered at 1044 nm
and had a 3-dB bandwidth of 103 nm and a 10-dB bandwidth of 111 nm. The fundamental
sweep rate of the laser was 100 kHz. Since the laser was emitting light during the forward
sweep only, its duty cycle was ~52%. A ~1 km length of single mode fiber was used to delay
part of the original sweep by ~5 µs and double the sweep rate to 200 kHz (Fig. 1(A)).
#143940 - $15.00 USD Received 16 Mar 2011; revised 11 May 2011; accepted 11 May 2011; pub. 13 May 2011(C) 2011 OSA 1 June 2011 / Vol. 2, No. 6 / BIOMEDICAL OPTICS EXPRESS 1542
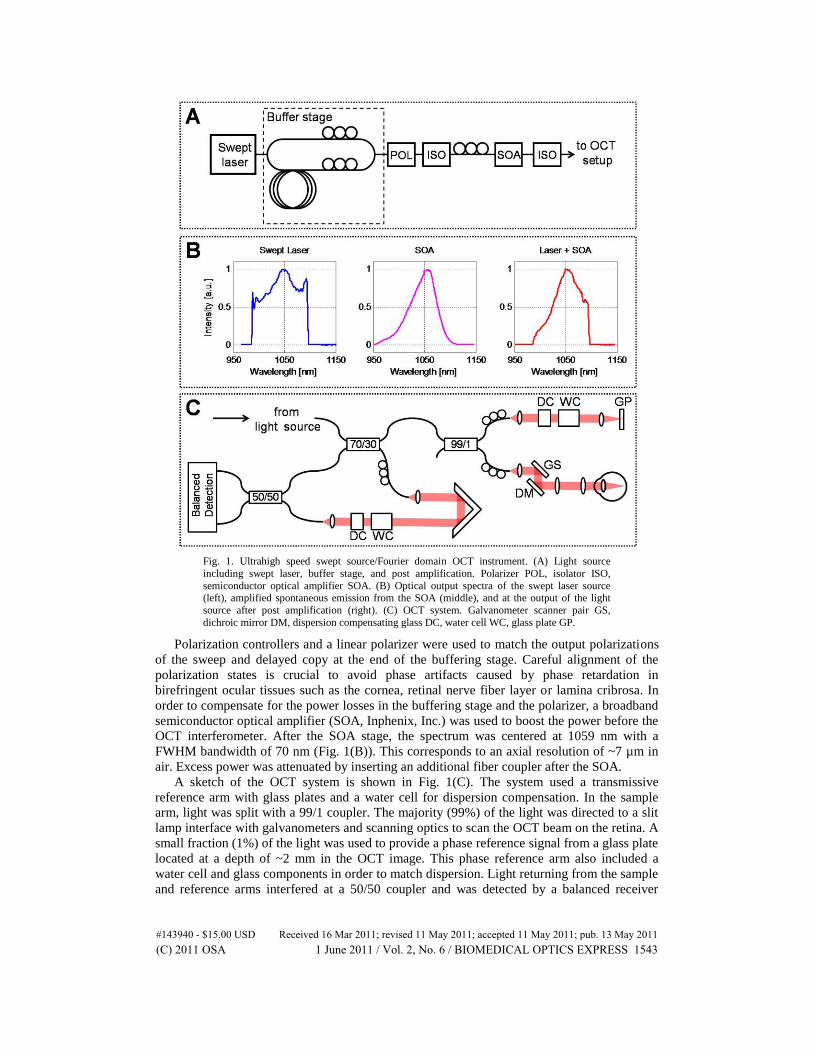
Fig. 1. Ultrahigh speed swept source/Fourier domain OCT instrument. (A) Light source
including swept laser, buffer stage, and post amplification. Polarizer POL, isolator ISO,
semiconductor optical amplifier SOA. (B) Optical output spectra of the swept laser source (left), amplified spontaneous emission from the SOA (middle), and at the output of the light
source after post amplification (right). (C) OCT system. Galvanometer scanner pair GS,
dichroic mirror DM, dispersion compensating glass DC, water cell WC, glass plate GP.
Polarization controllers and a linear polarizer were used to match the output polarizations
of the sweep and delayed copy at the end of the buffering stage. Careful alignment of the
polarization states is crucial to avoid phase artifacts caused by phase retardation in
birefringent ocular tissues such as the cornea, retinal nerve fiber layer or lamina cribrosa. In
order to compensate for the power losses in the buffering stage and the polarizer, a broadband
semiconductor optical amplifier (SOA, Inphenix, Inc.) was used to boost the power before the
OCT interferometer. After the SOA stage, the spectrum was centered at 1059 nm with a
FWHM bandwidth of 70 nm (Fig. 1(B)). This corresponds to an axial resolution of ~7 µm in
air. Excess power was attenuated by inserting an additional fiber coupler after the SOA.
A sketch of the OCT system is shown in Fig. 1(C). The system used a transmissive
reference arm with glass plates and a water cell for dispersion compensation. In the sample
arm, light was split with a 99/1 coupler. The majority (99%) of the light was directed to a slit
lamp interface with galvanometers and scanning optics to scan the OCT beam on the retina. A
small fraction (1%) of the light was used to provide a phase reference signal from a glass plate
located at a depth of ~2 mm in the OCT image. This phase reference arm also included a
water cell and glass components in order to match dispersion. Light returning from the sample
and reference arms interfered at a 50/50 coupler and was detected by a balanced receiver
#143940 - $15.00 USD Received 16 Mar 2011; revised 11 May 2011; accepted 11 May 2011; pub. 13 May 2011(C) 2011 OSA 1 June 2011 / Vol. 2, No. 6 / BIOMEDICAL OPTICS EXPRESS 1543
(Thorlabs, Inc.). The interference fringes were recorded by a high speed digitizer (Innovative
Integration, Inc.) at 400 MHz with 14 bit resolution. The acquisition of each buffer consisting
of the spectral data from both a sweep and its delayed copy was triggered by an A-line trigger
signal from the light source. The system sensitivity measured with a mirror and neutral
density filter was 95 dB. The sensitivity roll-off was 4.2 dB/mm. The increased roll-off
compared to the original setup was probably due to an increase of the instantaneous laser
linewidth in the SOA [41]. The image range of the system was 4.8 mm in air.
Standard Fourier domain OCT processing was performed and included the following
steps: First, the number of spectral data points was increased by applying an FFT, zero
padding and applying an inverse FFT [42]. Using calibration traces recorded with a Michelson
interferometer, the spectral signals were interpolated and resampled into linear k-space [33].
Numerical dispersion compensation and Gaussian shaping was performed, and fixed pattern
noise was removed [43]. Finally, the complex-valued depth scans were generated by zero-
padding the spectral data and Fourier transforming.
2.2 Wavelength calibration of the laser sweep spectra
For phase sensitive imaging using optical fiber buffering, special care is required so that after
resampling, the sweep and copy spectrum cover exactly the same spectral ranges. Although
the sampling rate is the same for sweep and buffered copies, the time dependent spectral
characteristic of the buffered copy is likely to be different due to the dispersion in the long
fiber buffer. Consequently, phase delays of one spectrum with respect to the other one will
result in different depth ranges for axial scans obtained by Fourier transforming the sweeps
and copies. In addition, any shift δk between the spectra from sweep and buffered copies
would result in an additive, depth dependent phase ramp, 2π·δk·z, in the axial scan [44].
In order to achieve a pixel-to-pixel correspondence of matched spectral ranges of sweep
and buffered copy, interference fringes were recorded with a Michelson interferometer [33].
From the phase of the spectral interferograms, interpolation vectors for linear sampling in k-
space were generated [45]. These k-space linear vectors were then translated and stretched in
such a way that (i) the resulting imaging ranges were identical, i.e. the covered spectral
bandwidth Δk was the same, and (ii) that the phase difference ΔΦ between axial scans
computed from sweep and buffered copies did not increase with depth, i.e. δk = 0 and hence
2π·δk·z = 0. The stretching factor to achieve the same Δk for sweep and copy was obtained by
computing the ratio of the respective depth positions of a signal from a mirror positioned at a
deep delay z. After subsequently translating the interpolation vectors along k, δk = 0 was
found when the phase difference ΔΦ for static signals at various depth positions equaled zero.
The resulting interpolation vectors were then used to calibrate the spectral data from the
retina. This approach is similar to methods for matching the spectra of different polarization
components in spectrometer based polarization sensitive OCT [46,47].
2.3 Assessment of Doppler flow velocities and compensation for phase artifacts
From the phase difference ΔΦDoppler(z) between neighboring axial scans, depth resolved axial
flow velocities can be calculated as v(z) = ΔΦDoppler(z)/(2·k·T), where k is the wavenumber
and T is the time interval between the two axial scans [20,21]. For the data analyzed in this
study, Doppler flow velocities were calculated between every other axial scan (i.e., between
sweeps only) and between every scan (i.e., between axial scans from sweeps and buffered
copies) in cross-sectional images. This corresponds to imaging with A-line repetition rates T1
of 100 kHz and 200 kHz and enables detection sensitivity in two different velocity ranges.
The respective maximum velocities that correspond to ±π phase shifts are ±26 mm/s and
±52.5 mm/s for 100 kHz and 200 kHz, respectively.
The actual flow velocity profiles were obscured by different phase artifacts which required
compensation (Fig. 2). In addition to the Doppler shifts caused by moving scatterers in the
#143940 - $15.00 USD Received 16 Mar 2011; revised 11 May 2011; accepted 11 May 2011; pub. 13 May 2011(C) 2011 OSA 1 June 2011 / Vol. 2, No. 6 / BIOMEDICAL OPTICS EXPRESS 1544
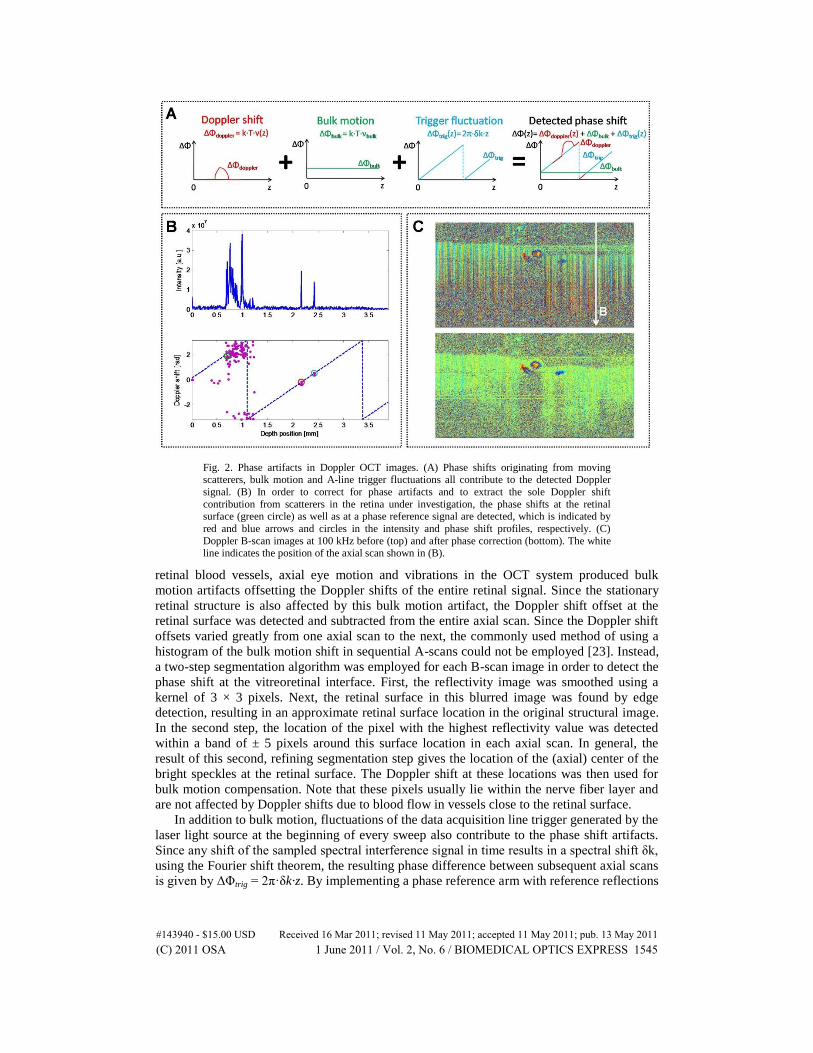
Fig. 2. Phase artifacts in Doppler OCT images. (A) Phase shifts originating from moving scatterers, bulk motion and A-line trigger fluctuations all contribute to the detected Doppler
signal. (B) In order to correct for phase artifacts and to extract the sole Doppler shift
contribution from scatterers in the retina under investigation, the phase shifts at the retinal surface (green circle) as well as at a phase reference signal are detected, which is indicated by
red and blue arrows and circles in the intensity and phase shift profiles, respectively. (C)
Doppler B-scan images at 100 kHz before (top) and after phase correction (bottom). The white
line indicates the position of the axial scan shown in (B).
retinal blood vessels, axial eye motion and vibrations in the OCT system produced bulk
motion artifacts offsetting the Doppler shifts of the entire retinal signal. Since the stationary
retinal structure is also affected by this bulk motion artifact, the Doppler shift offset at the
retinal surface was detected and subtracted from the entire axial scan. Since the Doppler shift
offsets varied greatly from one axial scan to the next, the commonly used method of using a
histogram of the bulk motion shift in sequential A-scans could not be employed [23]. Instead,
a two-step segmentation algorithm was employed for each B-scan image in order to detect the
phase shift at the vitreoretinal interface. First, the reflectivity image was smoothed using a
kernel of 3 × 3 pixels. Next, the retinal surface in this blurred image was found by edge
detection, resulting in an approximate retinal surface location in the original structural image.
In the second step, the location of the pixel with the highest reflectivity value was detected
within a band of ± 5 pixels around this surface location in each axial scan. In general, the
result of this second, refining segmentation step gives the location of the (axial) center of the
bright speckles at the retinal surface. The Doppler shift at these locations was then used for
bulk motion compensation. Note that these pixels usually lie within the nerve fiber layer and
are not affected by Doppler shifts due to blood flow in vessels close to the retinal surface.
In addition to bulk motion, fluctuations of the data acquisition line trigger generated by the
laser light source at the beginning of every sweep also contribute to the phase shift artifacts.
Since any shift of the sampled spectral interference signal in time results in a spectral shift δk,
using the Fourier shift theorem, the resulting phase difference between subsequent axial scans
is given by ΔΦtrig = 2π·δk·z. By implementing a phase reference arm with reference reflections
#143940 - $15.00 USD Received 16 Mar 2011; revised 11 May 2011; accepted 11 May 2011; pub. 13 May 2011(C) 2011 OSA 1 June 2011 / Vol. 2, No. 6 / BIOMEDICAL OPTICS EXPRESS 1545

far away from the zero delay, this phase ramp was sampled at two different depth positions in
order to estimate the slope of the ramp as shown in Fig. 2(B) [48,49].
Fig. 3. Scheme of Doppler OCT flow measurements. (A) In conventional Doppler methods, the
angle α between the vessel is measured to compute absolute velocity values vabs. By measuring
the cross-sectional area of the vessel, total flow can be calculated. (B) En-face plane based flow
method. Total flow is calculated by integrating the axial velocity components vz in a surface S whose normal vector is parallel to vz.
The effectiveness of the phase compensation was estimated using a mirror and ND-3 filter.
The mirror was positioned at a depth of 0.8 mm and the galvanometer scanners were turned
off. The SNR was 35 dB for the mirror and 33 dB and 31 dB for the front and back surfaces of
the glass plate, respectively. After applying the phase compensation algorithm, the standard
deviation of the phase differences between successive sweeps (i.e., at 100 kHz repetition rate)
measured at the mirror position was 97 mrad, which is of the same order as that of previously
reported phase-resolved swept-source/Fourier domain OCT systems [48,49]. The standard
deviation of phase differences between sweep and buffered copies (i.e., at 200 kHz repetition
rate) retrieved from the same measurement was 47 mrad (0.79 mm/s). In order to estimate the
accuracy of phase-resolved measurements in scattering tissue, the histogram of phase
differences measured in scattering tissue was investigated, as suggested in a recent paper by
Schmoll et al. [24]. The semi-FWHM of the phase difference distribution retrieved from an
image of 1000 axial scans of static retinal tissue (after phase compensation; only pixels with
intensities at least 5 dB above the mean noise level were included) was 0.37 rad and 0.61 rad
at repetition rates of 200 kHz and 100 kHz, respectively, which is comparable to the value of
0.41 rad reported for ultrahigh speed spectral/Fourier domain OCT [24].
2.4 Total retinal blood flow measurement using en-face images
Total blood flow computation was performed using an algorithm based on a recent publication
by Srinivasan et al. [32]. Unlike previous methods, knowledge of the Doppler angle, i.e. the
angle between vessel and optical beam, is not required. In general, absolute flow in a vessel is
computed by integrating the inner product of velocity over a surface S intersecting the vessel:
S
F v dS (1)
In conventional Doppler OCT methods, the absolute flow velocity vector is reconstructed
from the retinal geometry by measuring the inclination angle of the vessel with respect to the
OCT beam (Fig. 3(A)). Then, absolute flow can be calculated by integrating the absolute
velocity vectors over the vessel cross section. The step of estimating vessel angles is
unnecessary if the measured velocity vector and the normal vector of the integrating surface S
are chosen to be parallel (Fig. 3(B)). It is therefore convenient to compute absolute flow
#143940 - $15.00 USD Received 16 Mar 2011; revised 11 May 2011; accepted 11 May 2011; pub. 13 May 2011(C) 2011 OSA 1 June 2011 / Vol. 2, No. 6 / BIOMEDICAL OPTICS EXPRESS 1546

values from 3D Doppler OCT data by integrating the flow components in a plane bisecting
vessels perpendicular to the optical beam, i.e., in an en-face plane [32]:
( , ) ,z
xy plane
F v x y dxdy
(2)
where vz(x,y) is the axial flow velocity measured from different pixels in the en-face plane.
In most areas of the retina, the blood vessels are almost parallel to the retinal surface.
Therefore, the central retinal vessels in the optic disk must be imaged. Here, the vessels are
almost parallel to the OCT beam, and all vessels can be intersected by a volumetric data cube.
However, the flow velocity components in the direction of the OCT beam are high (up to ~50
mm/s), therefore a high axial scan rate and deep penetration into the optic nerve are required.
Software was developed to enable measurement of flow in small regions of interest
designated by the operator in the respective en-face image extracted from a 3D Doppler data
set of the optic disk. Alternatively, total blood flow measurement was possible in a large area
of interest covering an area of ~0.6 mm2 at the optic disk. In order to reject contributions from
venous vessels when evaluating total arterial blood flow in the central retinal arteries (cp.
Section 3.2), flow oriented away from the pupil was excluded from the integration.
3. Results and discussion
3.1 Volumetric imaging of retinal vasculature
3D OCT data sets of retinal vasculature were acquired using the ultrahigh speed swept
source/Fourier domain OCT system. Volumetric data sets (3(x) × 3(y) × 4.8(z) mm3)
consisting of 250 B-scans with 2000 axial scans each were acquired in 2.5 s. Retinal imaging
was performed with an incident average power of 1.9 mW, consistent with American National
Standards Institute (ANSI) standards safe exposure limits. The study protocol was approved
by the institutional review board of M.I.T. Written informed consent was obtained prior to the
study.
Figure 4 shows example results from volumetric imaging of the optic disk region of a
healthy subject. Figures 4(A) and (B) show examples of Doppler B-scan images at 100 kHz
and 200 kHz extracted from the same 3D OCT data set. Note the different velocity ranges for
the two images. In the central retinal vessels, where flow velocities are high, phase wrapping
can still be observed as color changes from red to blue and vice versa in the 100-kHz image.
As a result of the narrow instantaneous laser linewidth and swept source detection, there are
no apparent fringe washout artifacts, even in the middle of the central retinal vessels where
the phase is wrapped. However, no phase wrapping artifacts were observed at 200 kHz
repetition rates. Arteries and veins appearing in red and blue color can clearly be
distinguished. The treelike branching of central retinal arteries and veins can nicely be
appreciated in the 3D renderings of Doppler images at 100 kHz and 200 kHz computed from
the same spectral data (Figs. 4(C) and (D)). Blood flow can be visualized even in the central
retinal arteries deep in the papilla.
3.2 Measurement of retinal blood flow
Total flow was measured in the optic disk by integrating over the vessels in en-face planes
from the 200 kHz data set using the method described in section 2.4. Flow was calculated for
individual vessels in different en-face planes of the 3D Doppler OCT data set at different
depths over a range of 120 µm (Fig. 5). The depth range over which flow measurements were
performed is indicated in the Doppler OCT cross-sectional image in Fig. 5(A). Only small
variations between measurements at different depths were observed. In the retinal arteries
labeled A1, A2, and A3 in the en-face image of Fig. 5(B), the mean flow values were 6.8
μL/min, 15.5 μL/min, and 26.6 μL/min. The total arterial flow of 50.7 µL/min was computed
as the sum of A1–A3. The average total arterial flow computed in a larger region of interest
#143940 - $15.00 USD Received 16 Mar 2011; revised 11 May 2011; accepted 11 May 2011; pub. 13 May 2011(C) 2011 OSA 1 June 2011 / Vol. 2, No. 6 / BIOMEDICAL OPTICS EXPRESS 1547

around the optic disk was 49.1 µL/min and had a coefficient of variation (standard
deviation/mean) of 5.0%.
Fig. 4. Volumetric Doppler OCT imaging of retinal vasculature. (A) Doppler OCT B-scan image at 100 kHz close to the optic disk. (B) Corresponding Doppler OCT image at 200kHz.
Arterial and venous vessels in the papilla can be distinguished in red and blue color. Note that the color scale encodes the ranges of ±19.7 mm/s and ±39.5 mm/s for 100 kHz and 200 kHz,
respectively. 3D renderings of volumetric data sets at 100 kHz (C, Media 1) and 200 kHz (D,
Media 2) show the three-dimensional structure of the retinal arteries and veins branching in the optic disk. (E) Structural reflectivity B-scan image demonstrating the robustness of the swept-
source/Fourier domain OCT system to signal loss due to interference fringe washout.
Figure 5(C) shows results from depth-resolved measurements of arterial blood flow. Table
1 summarizes these results and shows the average values, standard deviations, and
coefficients of variation for the depth-resolved measurements of total blood vessel area, mean
flow velocity and total blood flow. The measured retinal blood flow values are in good
agreement with values reported in the literature using LDV and OCT [7,28,50].
In order to investigate the variations from measurements in different depths, mean velocity
was plotted as a function of total vessel area at each depth (Fig. 5(D)). For each en-face
image, vessel areas were computed using an automated segmentation algorithm including
smoothing the Doppler data using a ~30 × 30 µm2 kernel and detecting areas with positive
#143940 - $15.00 USD Received 16 Mar 2011; revised 11 May 2011; accepted 11 May 2011; pub. 13 May 2011(C) 2011 OSA 1 June 2011 / Vol. 2, No. 6 / BIOMEDICAL OPTICS EXPRESS 1548
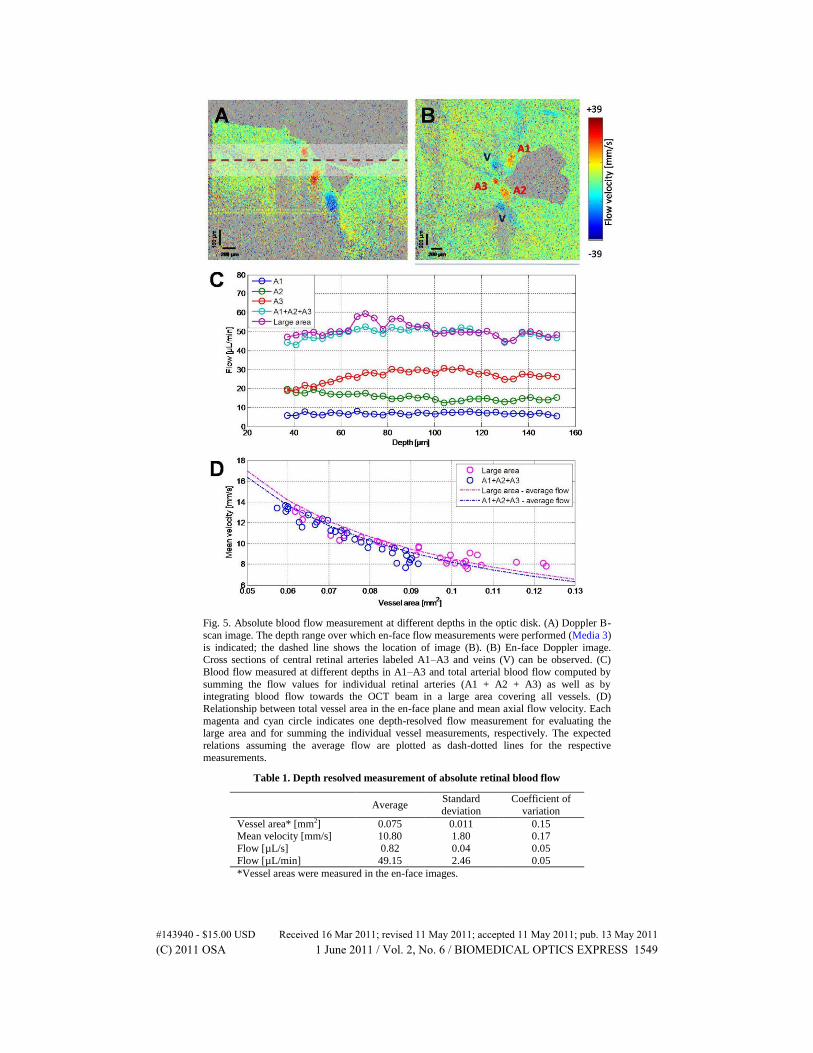
Fig. 5. Absolute blood flow measurement at different depths in the optic disk. (A) Doppler B-
scan image. The depth range over which en-face flow measurements were performed (Media 3)
is indicated; the dashed line shows the location of image (B). (B) En-face Doppler image. Cross sections of central retinal arteries labeled A1–A3 and veins (V) can be observed. (C)
Blood flow measured at different depths in A1–A3 and total arterial blood flow computed by
summing the flow values for individual retinal arteries (A1 + A2 + A3) as well as by integrating blood flow towards the OCT beam in a large area covering all vessels. (D)
Relationship between total vessel area in the en-face plane and mean axial flow velocity. Each
magenta and cyan circle indicates one depth-resolved flow measurement for evaluating the large area and for summing the individual vessel measurements, respectively. The expected
relations assuming the average flow are plotted as dash-dotted lines for the respective
measurements.
Table 1. Depth resolved measurement of absolute retinal blood flow
Average
Standard
deviation Coefficient of
variation Vessel area* [mm2] 0.075 0.011 0.15 Mean velocity [mm/s] 10.80 1.80 0.17 Flow [µL/s] 0.82 0.04 0.05 Flow [µL/min] 49.15 2.46 0.05 *Vessel areas were measured in the en-face images.
#143940 - $15.00 USD Received 16 Mar 2011; revised 11 May 2011; accepted 11 May 2011; pub. 13 May 2011(C) 2011 OSA 1 June 2011 / Vol. 2, No. 6 / BIOMEDICAL OPTICS EXPRESS 1549

velocity components in both 100-kHz and 200-kHz data of the same en-face images. Note that
phase wrapping in 100-kHz images occurred only in the center of large vessels and was not
present in the 200-kHz images. The region of interest for vessel segmentation and flow
calculation was interactively selected by drawing a circumscribing boundary. Mean axial
velocity values were computed for each of the segmented vessel areas.
For large area flow calculation, axial velocity components were integrated in a region
comprising multiple vessels. For both evaluation methods, summing flow values of single
vessels, as well as integrating arterial flow in a large area, the measured values are distributed
closely around the lines computed from the total flow values averaged over all depths.
However, in the anterior parts of the optic disk, where the central retinal vessels are nearly
perpendicular than parallel to the OCT beam, the axial velocity components are considerably
lower than from deeper in the nerve, and deviations can be observed between the values
measured from single vessel measurements and large area integration, respectively (Fig. 5(D),
right). Deeper in the optic nerve, there is excellent agreement between the two measurements.
These results confirm the accuracy and indicate the potential of this method to measure high
axial flow velocities and total blood flow in the central retinal vasculature.
3.3 Measurement of pulsatility in retinal vessels
The ultrahigh imaging speed and high sensitivity for a large range of flow velocities make
ultrahigh speed swept source/Fourier domain OCT an excellent technique for measuring total
blood flow in papillary vessels. The results also suggest that this instrument could be a useful
tool for investigating flow dynamics and pulsatile blood flow in retinal vessels.
Pulsatile blood flow was investigated by repeated imaging of individual retinal cross
sections close to the optic disk at a frame rate of 100 fps for 5 seconds (Fig. 6). Arterial
vessels were segmented by an automated algorithm and the axial blood flow velocity in the
center of the vessel was mapped as a function of time. Figure 6(A) shows the pulsatile blood
flow velocity traces for two arterial vessels at a pulse rate of 75 bpm. Details of Doppler B-
scan images are shown for different phases of the pulse cycle. Note that for the diastolic pulse
phase, the velocities are low, such that the velocity values at the border of the vessels are on
the order of the Doppler shift noise level in static tissue. However, the central velocities were
always well above this noise level, thus enabling accurate measurements of pulsatile flow
velocity variations. The maximum and minimum axial flow velocities, vmax and vmin, were
measured for the systole and diastole of 5 pulse cycles for the 4 major branch arteries at the
locations labeled by crosses in Fig. 6(B). The results are plotted in Fig. 6(C) and are
summarized in Table 2. Pulsatility was calculated as the ratio vmax/vmin for each of these
vessels, yielding values in the range from 2.61 to 3.18. The average arterial pulsatility was
2.88 with a standard deviation of 0.26.
Table 2. Ultrahigh speed measurement of pulsatility in central retinal arteries.
Vessel
#
vmax [mm/s]* vmin [mm/s]* Pulsatility
Average Standard
deviation
Average Standard
deviation
Average Standard
deviation 1 35.6 1.1 12.0 1.4 3.01 0.27 2 25.8 2.0 8.1 0.6 3.18 0.4 3 36.2 1.3 13.3 1.0 2.73 0.22 4 27.3 1.8 10.7 1.9 2.61 0.46
All 31.2 5.4 11.1 2.2 2.88 0.26 *vmax and vmin are axial flow velocities
Quantitative mapping of pulsatile blood flow could be of particular interest for
investigating pathologies in diseases such as glaucoma or diabetic retinopathy as well as
vessel occlusions. It should be noted that quantitative flow mapping using single 3D data sets
represents a snap shot of pulsatile retinal blood flow at a particular time point in the cardiac
#143940 - $15.00 USD Received 16 Mar 2011; revised 11 May 2011; accepted 11 May 2011; pub. 13 May 2011(C) 2011 OSA 1 June 2011 / Vol. 2, No. 6 / BIOMEDICAL OPTICS EXPRESS 1550

Fig. 6. Pulsatility measurement using ultrahigh speed Doppler OCT. (A) Measurement of pulsatile axial flow velocity in two central arterial branches close to the optic nerve head over 5
seconds. Details of Doppler OCT B-scan images show cross sections of two arterial and one
venous branch vessel at different phases of the pulse. (B) The locations of pulsatile flow measurements in 4 branch arteries around the optic disk are indicated by the crosses on the
fundus photo. (C) Quantitative pulsatility assessment. For the vessels numbered 1–4 in (B),
maximum and minimum velocities are plotted as black and white triangles for 5 pulse cycles.
cycle. Since the cross sectional images of a 3D data set are recorded sequentially, different
parts of the 3D data sets will be recorded at different phases of the pulse waveform. Recently,
4D OCT imaging of retinal vasculature was demonstrated by recording 3D Doppler OCT data
sets at different phases in the cardiac cycle using ultrahigh speed spectral/Fourier domain
OCT [51]. By combining the advantages of ultrahigh speed swept source/Fourier domain
OCT at 1-µm wavelengths, volumetric imaging of retinal structure with increased image
penetration and high sensitivity to flow velocities in the central retinal vessels, future
investigations could enable time-resolved imaging and quantitative measurement of retinal
blood flow. Ultimately, such measurements could open new insights in retinal physiology and
pathogenesis.
#143940 - $15.00 USD Received 16 Mar 2011; revised 11 May 2011; accepted 11 May 2011; pub. 13 May 2011(C) 2011 OSA 1 June 2011 / Vol. 2, No. 6 / BIOMEDICAL OPTICS EXPRESS 1551

4. Conclusion
Structural imaging of retinal vasculature as well as quantitative assessment of total retinal
blood flow was demonstrated using a novel ultrahigh-speed swept-source/Fourier domain
OCT instrument. The method was based on a recently developed system for ophthalmic OCT
imaging at ultrahigh speed and long wavelengths [33]. Several modifications were required to
enable phase sensitive imaging, including additional optics and post-processing steps. Highly
stable phase measurements and Doppler flow imaging at repetition rates of 100 kHz and 200
kHz were demonstrated. Compared to previous methods, this approach has several
advantages: Imaging at 1050-nm wavelengths provides enhanced penetration into deep ocular
structures. The rapid axial scan rate enables detection of high axial flow velocities up to ±
52.5 mm/s (39.5 mm/s in tissue with n = 1.33). Finally, swept-source OCT is less sensitive to
phase washout compared to spectrometer-based spectral/Fourier domain systems.
The instrument was used to perform structural and volumetric imaging of the retinal
vasculature in healthy subjects. Two- and three-dimensional Doppler OCT images provided a
clear and detailed visualization of the central retinal vessels branching in the optic disk. In
addition to assessment of the morphology of central retinal vasculature, quantitative mapping
of total retinal blood flow was demonstrated using a new and robust method. Absolute blood
flow values were computed for single vessels as well as for the total retina. Furthermore,
pulsatile blood flow was investigated for several vessels in the optic disk.
These results suggest that swept source OCT could be a powerful tool for in vivo
assessment of blood flow in healthy and diseased eyes. Many of the diseases which are major
causes of blindness are associated with alterations of retinal perfusion. Having a tool that
enables volumetric imaging with micrometer resolution, 3D visualization of the retinal
vasculature and the ability to quantify blood flow promises to open new perspectives on
understanding pathophysiology, as well as diagnosis and monitoring therapeutic response.
Acknowledgments
The authors thank T.-H. Tsai and C. Zhou for discussions and technical assistance, as well as
V. Manjunath and L. Branchini for assistance with fundus imaging. We also acknowledge
support from the National Institutes of Health (NIH R01-EY011289-25, R01-EY013178-10,
R01-EY013516-07, R01-EY019029-02, R01-CA075289-14, R01-HL095717-02), Air Force
Office of Scientific Research (AFOSR FA9550-10-1-0063), Medical Free Electron Laser
Program (FA9550-10-1-0551) and Deutsche Forschungsgesellschaft (DFG-GSC80-SAOT).
#143940 - $15.00 USD Received 16 Mar 2011; revised 11 May 2011; accepted 11 May 2011; pub. 13 May 2011(C) 2011 OSA 1 June 2011 / Vol. 2, No. 6 / BIOMEDICAL OPTICS EXPRESS 1552