total monthly active users (maus) 138 173 180 … subscribers 59 75 83 40% 10% ad-supported maus 83...
TRANSCRIPT

Spotify Technology S.A.
42-44 avenue de la Gare, LU-1610 Luxembourg
1
July 26, 2018
Dear Shareholders,
Today Spotify is reporting results for Q2 2018. The quarter was largely in line with our
expectations, with some metrics performing at the high end of our guidance range.
We finished the quarter with 180 million Monthly Active Users (“MAU”) and 83 million Premium
Subscribers, up 30% and 40% respectively, Y/Y.1
Total Revenue was €1,273 million, up 26% Y/Y and 34% Y/Y after adjusting for the negative
impact from changes in foreign exchange rates.2
Gross Margin of 25.8% was at the high end of our guidance range of 24-26%.
Our Operating Loss was €90 million or approximately 7% of Total Revenue. This includes a €30
million cash expense related to our direct listing on the NYSE in April (“Direct Listing”) and €32
million of accrued social costs for options and RSUs34(€24 million more than anticipated in our
Q2 guidance as a result of the strong stock performance in the quarter). Excluding increased
accrued social costs for options and RSUs, Operating Loss would have been at the low end of
our guidance. Net cash flows from operating activities were €30 million, and Free Cash Flow
was €18 million.2
1 Historical Total and Ad-Supported MAU figures adjusted from previously reported amounts. See “Updating Our Key User Metrics
Policy” for additional information. 2 Free Cash Flow and Revenue excluding foreign exchange effect are non-IFRS measures. See “Use of Non-IFRS Measures” and
“Reconciliation of IFRS to Non-IFRS Results” for additional information. 3 Payroll taxes associated with employee salaries and benefits, including stock-based compensation that we are subject to in
various countries in which we operate. 4 Based on actual figures and not rounded sums.
SUMMARY USER AND FINANCIAL METRICS
% Change4
USERS (M) Q2 20171
Q1 20181
Q2 2018 Y/Y Q/Q
Total Monthly Active Users ("MAUs") 138 173 180 30% 4%
Premium Subscribers 59 75 83 40% 10%
Ad-Supported MAUs 83 102 101 23% (0%)
FINANCIALS (€M)
Premium 904 1,037 1,150 27% 11%
Ad-Supported 103 102 123 20% 21%
Total Revenue 1,007 1,139 1,273 26% 12%
Gross Profit 232 283 329 42% 16%
Gross Margin 23.0% 24.9% 25.8% -- --
Operating Loss (79) (41) (90) (14%) (121%)
Operating Margin (7.8%) (3.6%) (7.1%) -- --
Net cash flows from operating activities 72 84 30 (58%) (64%)
Free Cash Flow2
59 74 18 (69%) (76%)

Spotify Technology S.A.
42-44 avenue de la Gare, LU-1610 Luxembourg
2
MONTHLY ACTIVE USERS
MAUs grew 30% Y/Y to 180 million at the end of Q2. Growth in our emerging regions of Latin
America and Rest of World continues to outpace growth in our more established markets.
Total MAUs by Region
Ad-Supported MAUs totaled 101 million at the end of Q2, up 23% Y/Y. Earlier this year we
began rolling out a new user interface for our Ad-Supported tier of service, the first major
revision since our mobile product was introduced in 2014. We expect this new user interface to
drive improvements in engagement, retention, and conversion.
PREMIUM SUBSCRIBERS
Premium Subscribers grew to 83 million, up 40% Y/Y. Our mid-year campaign performed well
and was a significant portion of our subscriber intake in the quarter. Family Plan continues to be
a primary driver of gross adds and lower churn due to strong retention. We also extended our
offer of a Spotify + Hulu bundle to Standard $9.99 Premium subscribers in the US, following the
early success of the Spotify Student + Hulu bundle launched last fall.
Europe37%
North America31%
Latin America21%
Rest of World11%

Spotify Technology S.A.
42-44 avenue de la Gare, LU-1610 Luxembourg
3
Subscribers by Region
UPDATING OUR KEY USER METRICS POLICY
We continually seek to improve estimates of our user base, and we regularly review our policies
and processes for calculating user metrics to improve their accuracy. In Q2, we revised our
policy to better align with current practices of other consumer-facing internet companies. In our
Registration Statement on Form F-1 filed in March and our Q1 earnings release, we excluded a
number of users that may have employed methods to limit or otherwise avoid being served
advertisements (although our financials captured all the costs of streaming content to these
users). As such, the MAUs we reported did not reflect the full number of users consuming
content through our service.
Our Q2 Total MAU figure of 180 million is inclusive of these users that may have employed
methods to limit or otherwise avoid being served advertisements. For comparability we have
adjusted our prior period figures to align with this revised methodology. We estimate that users
exhibiting this behavior constitute less than 5% of our total reported Ad-Supported MAU figure
(less than 3% of Total MAUs).
Europe40%
North America31%
Latin America20%Rest of World
9%

Spotify Technology S.A.
42-44 avenue de la Gare, LU-1610 Luxembourg
4
Total MAUs1
1. Q1’17 - Q1’18 adjusted from previously reported figures as described above
Separately, we continue to work to identify and remove users from our reported metrics that we
consider to be “fake” users based on various criteria. This includes, but is not limited to, bots
and other users who aim to manipulate stream counts for purposes of royalty calculations. Such
users are removed from our metrics in a timely fashion once they are discovered. However,
some such users may remain in our reported metrics because of the limitations of our ability to
identify their accounts.
FINANCIAL METRICS
Revenue
Total revenue was €1,273 million this quarter, up 26% Y/Y. Foreign exchange rate movement
continued to be a significant headwind this quarter. Excluding the negative impact from foreign
exchange rates, growth in revenue would have been 34% Y/Y.
Premium revenue was €1,150 million in Q2, up 27% Y/Y. Foreign exchange rates had a
meaningful impact, as Premium revenue would have been up 35% Y/Y if the negative impact
were excluded.
Average revenue per user (“ARPU”) was €4.89 in Q2, down 12% Y/Y and up 4% Q/Q. The
increase from Q1 is largely due to the timing of our bi-annual campaigns which create a
seasonal impact to both revenue and gross margin. We expect this seasonality to continue.
Growth in Family and Student plans continues to weigh on ARPU, as does the shift in market
mix as we grow faster in relatively lower ARPU geographies like Latin America, Southeast Asia,
and other newly launched markets. Changes in foreign exchange rates also contributed to the
Y/Y decline in ARPU. Excluding the impact of foreign exchange rates, ARPU would have been
down 6% Y/Y.
132 138
150 160
173 180
Q1 Q2 Q3 Q4 Q1 Q2
2017 2018

Spotify Technology S.A.
42-44 avenue de la Gare, LU-1610 Luxembourg
5
Ad-Supported revenue was €123 million in Q2, up 20% Y/Y. Foreign exchange rates also had a
substantial impact on advertising revenues due to the mix of US dollar denominated revenue.
Adjusting for the impact of foreign exchange rates, Ad-Supported revenue would have grown
28% Y/Y.
During Q2 we implemented a new data policy which slowed our revenue growth. We course
corrected early in Q3 and are seeing a recovery in the business. We did see some GDPR
disruption across our European markets during Q2 but seem to be largely past that now. We
are, and will remain, GDPR compliant thanks to a terrific cross-functional effort.
The majority of our Ad-Supported revenue continues to be driven through our Direct channel,
but our Programmatic & Ad Studio products are growing faster and now account for more than
20% of the total. In Q2 we launched our new automated self-serve platform, Ad Studio, in
several more countries. We’re now live in the US, UK, Canada, and Australia. Over time, we
expect our Programmatic and self-serve products to become a significant portion of Ad-
Supported revenue.
Ad spending continues to grow fast on our mobile platform, which comprises the majority of Ad
revenue. From a product perspective, video is our fastest growing source of revenue, while
audio remains our largest source of revenue and continues to experience solid growth.
At the end of the quarter we unveiled Active Media in Australia, which gives users the choice to
hear, watch, or skip audio and video ads they are served. We believe this system will better
enable us to understand what drives intent and engagement, and ultimately allow us to
personalize the ad experience in the same way as our most popular playlists. With good
execution we’re betting that pay for performance will better monetize our free user base than
our current CPM-based pricing model.
Gross Margin
Gross Margin was 25.8% in Q2, the high end of our guidance range, up from 24.9% in Q1 and
23.0% in Q2 2017. As a reminder, Gross Margins tend to be lower in Q1 and Q3, resulting from
the costs of promotional campaigns we launch in Q2 and Q4 of each calendar year, during
which we typically experience faster subscriber growth. Q1 2018 margins included a 124 basis
point gain from adjustments to prior period estimates related to changes in rightsholder
liabilities. While there was a similar adjustment in Q2, margins this quarter were much more in
line with the usual seasonality. We expect Gross Margin to continue to demonstrate these
seasonal patterns throughout the remainder of the year.
Premium Gross Margin was 26.9% in Q2, up from 26.0% in Q1 and 24.1% in Q2 2017. Ad-
Supported Gross Margin was 16.3% in Q2, up from 12.7% in Q1 and 13.6% in Q2 2017. Ad-
Supported Gross Margins are relatively strong in our developed markets and relatively weak in
our emerging markets. As the emerging markets grow, margins should too.

Spotify Technology S.A.
42-44 avenue de la Gare, LU-1610 Luxembourg
6
Over the long run our goal is to manage the consolidated business to 30%+ Gross Margins. We
outlined our long-term margin goals for the business at our Investor Day on March 15, 2018.
Those goals are informed by a vision for building a two-sided marketplace where millions of
artists can reach millions of fans. To succeed, we said we need to help more artists connect
with more fans. The path to success involves building services and tools for labels and artists
focused on promotion, marketing, and career management. This will be a multi-year journey, but
we’re making exciting progress. In the last quarter we have grown the number of unique artists
listened to on our platform by 5%. Additionally, Spotify for Artists, our platform where artists can
manage their profiles, is now used by 200k artists monthly. In its first 9 months Monthly Active
Artists grew by 100k and doubled in the next 6 months. Expect regular updates on our progress
over time.
The benchmarks for success will include (1) the number of creators on our platform, (2) the
number of creators using our promotion, marketing, and career management tools, and (3) the
number of artists and labels paying us to use our tools and services.
Operating Expenses / Income (Loss)
Operating expenses totaled €419 million this quarter, and total Operating Loss was €90 million.
Operating Margin of (7.1%) improved 70 bps Y/Y.
We expensed €30 million in Q2 related to our Direct Listing. The Operating Loss included a €32
million accrued expense related to increased social tax on stock option grants and RSUs,
primarily in Sweden, a result of the strong stock performance in the quarter. This was €24
million higher than our guidance forecast. Excluding the non-recurring Direct Listing fee would
have yielded an Operating Loss of €60 million or (4.7%) as a percent of revenue, a 310 bps
improvement Y/Y.
As of June 30, we had 3,969 full-time employees and contractors globally. Research &
Development made up the greatest share of hiring this quarter, accounting for almost half of the
added headcount.
Free Cash Flow
We generated €30 million in Net cash flows from operating activities and €18 million in Free
Cash Flow in Q2, which includes the €30 million one-time expense related to our Direct Listing.
We maintain positive working capital dynamics, and our goal is to sustain and grow Free Cash
Flow excluding the impact of capital expenditures associated with the build-out of new and
existing offices in New York, London, Los Angeles, Stockholm, and Boston, among others. We
anticipate these projects to cost more than €300 million over the next 12 to 18 months.
At the end of the quarter we held €1.7 billion in cash and cash equivalents, restricted cash, and
short term investments.

Spotify Technology S.A.
42-44 avenue de la Gare, LU-1610 Luxembourg
7
OUTLOOK
These forward-looking statements reflect Spotify’s expectations as of July 26, 2018 and are
subject to substantial uncertainty. For the third quarter we are expecting:
● Total Monthly Active Users (“MAU”): 188-193 million, up 25-29% Y/Y
● Total Premium Subscribers: 85-88 million, up 36-43% Y/Y
● Total Revenue: €1.2-€1.4 billion, up 17-36% Y/Y. This includes a negative impact of
approximately €30 million from foreign exchange rates; excluding this impact, up 20-38%
Y/Y
● Gross Margin: 23.7-25.7%
● Operating Loss: €10-€90 million
Additionally, for the fourth quarter we are expecting:
● Total Monthly Active Users (“MAU”): 199-207 million, up 24-30% Y/Y
● Total Premium Subscribers: 93-97 million, up 30-37% Y/Y
● Total Revenue: €1.35-€1.55 billion, up 18-35% Y/Y. This includes a negative impact of
approximately €20 million from foreign exchange rates; excluding this impact, up 20-37%
Y/Y
● Gross Margin: 24.5-26.5%
● Operating Loss: €20-€100 million
TME INVESTMENT
Tencent Music Entertainment Group (“TME”), through its parent Tencent Holdings Limited, has
announced its intention to list TME’s shares on a recognized stock exchange in the United
States through a registered public offering. We own TME shares. These are held in long term
investments on our balance sheet. A TME IPO would trigger a fair market value adjustment to
the carrying value of our investment recognized in other comprehensive income. The gain could
be significant. The accounting treatment for such a gain could trigger a tax benefit large enough
to generate positive Net Income for us in the quarter of the IPO. If such an outcome were to
occur, it would be a one-time, non-recurring event. The following quarters we would expect the
business to once again generate a Net Loss.
EARNINGS QUESTION & ANSWER SESSION
The Company will host a live question and answer session starting at 8 a.m. ET today on
investors.spotify.com. Daniel Ek, our Co-Founder and CEO, and Barry McCarthy, our Chief
Financial Officer, will be on hand to answer questions submitted to [email protected] and through
the live chat window available through the webcast. Participants also may join using the listen-
only conference line:

Spotify Technology S.A.
42-44 avenue de la Gare, LU-1610 Luxembourg
8
Participant Toll Free Dial-In Number: (866) 393-4306
Participant International Dial-In Number: (734) 385-2616
Conference ID 4567529
Contacts
Investor Relations:
Paul Vogel
Public Relations:
Graham James
[email protected] [email protected]
Use of Non-IFRS Measures
This shareholder letter includes references to the non-IFRS financial measures of EBITDA and Free Cash Flow. Management
believes that EBITDA and Free Cash Flow are important metrics because they present measures that approximate the amount of
cash generated that is available to repay debt obligations, make investments, and for certain other activities that excludes certain
infrequently occurring and/or non-cash items. However, these measures should be considered in addition to, not as a substitute for
or superior to, net income, operating income, or other financial measures prepared in accordance with IFRS. This shareholder letter
also includes references to the non-IFRS financial measures of Revenue excluding foreign exchange effect, Premium revenue
excluding foreign exchange effect and Ad-Supported revenue excluding foreign exchange effect. Management believes that
Revenue excluding foreign exchange effect, Premium revenue excluding foreign exchange effect and Ad-Supported revenue
excluding foreign exchange effect are important metrics because they present measures that facilitate comparison to our historical
performance. Revenue excluding foreign exchange effect, Premium revenue excluding foreign exchange effect and Ad-Supported
revenue excluding foreign exchange effect excluding foreign exchange effect should be considered in addition to, not as a substitute
for or superior to, Revenue, Premium revenue, Ad-Supported revenue or other financial measures prepared in accordance with
IFRS.
Forward Looking Statements
We would like to caution you that this letter to shareholders contains “forward-looking statements” as defined in Section 27A of the
United States Securities Act of 1933, as amended, and Section 21E of the United States Securities Exchange Act of 1934, as
amended. We intend such forward-looking statements to be covered by the safe harbor provisions for forward-looking statements
contained in the Private Securities Litigation Reform Act of 1995 and include this statement for purposes of complying with the safe
harbor provisions. Such forward-looking statements involve significant risks, uncertainties and assumptions that could cause actual
results to differ materially from our historical experience and our present expectations or projections, including but not limited to the
following known material factors: our ability to attract prospective customers and to retain existing customers; our dependence upon
third-party licenses for sound recordings and musical compositions; our ability to comply with the many complex license agreements
to which we are a party; our ability to generate sufficient revenue to be profitable or to generate positive cash flow on a sustained
basis; our lack of control over the providers of our content and their effect on our access to music and other content; our ability to
accurately estimate the amounts payable under our license agreements; the limitations on our operating flexibility due to the
minimum guarantees required under certain of our license agreements; our ability to obtain accurate and comprehensive information
about music compositions in order to obtain necessary licenses or perform obligations under our existing license agreements;
potential breaches of our security systems; risk associated with unauthorized access of our software and services and manipulation
of stream counts and customer accounts; assertions by third parties of infringement or other violations by us of their intellectual
property rights; risks related to our status as a foreign private issuer; dilution resulting from additional share issuances; and the
concentration of voting power among our founders who have and will continue to have substantial control over our business; tax-
related risks; unanticipated changes relating to competitive factors in our industry; ability to hire and retain key personnel; changes
in legislation or governmental regulations affecting us; international, national or local economic, social or political conditions;
conditions in the credit markets; risks associated with accounting estimates, currency fluctuations and foreign exchange controls;
and such other risks as set forth in our filings with the United States Securities and Exchange Commission.
We caution you not to place undue reliance on these forward-looking statements, which speak only as of the date hereof. We
undertake no obligation to publicly update or revise any of our forward-looking statements after the date they are made, whether as
a result of new information, future events or otherwise, except to the extent required by law.

Spotify Technology S.A.
42-44 avenue de la Gare, LU-1610 Luxembourg
9
Interim condensed consolidated statement of operations
(Unaudited)
(in € millions, except share and per share data)
Three months ended Six months ended
June 30,
2018
March 31,
2018
June 30,
2017
June 30,
2018
June 30,
2017
Revenue 1,273 1,139 1,007 2,412 1,909
Cost of revenue 944 856 775 1,800 1,572
Gross profit 329 283 232 612 337
Research and development 143 115 95 258 175
Sales and marketing 173 138 146 311 256
General and administrative 103 71 70 174 124
419 324 311 743 555
Operating loss (90 ) (41 ) (79 ) (131 ) (218 )
Finance income 41 15 41 56 68
Finance costs (343 ) (154 ) (148 ) (497 ) (210 )
Share in earnings of associate — — (1 ) — 1
Finance income/(costs) - net (302 ) (139 ) (108 ) (441 ) (141 )
Loss before tax (392 ) (180 ) (187 ) (572 ) (359 )
Income tax expense/(benefit) 2 (11 ) 1 (9 ) 2
Net loss attributable to owners of the
parent (394 ) (169 ) (188 ) (563 ) (361 )
Net loss per share attributable to owners
of the parent
Basic and diluted (2.20 ) (1.01 ) (1.24 ) (3.25 ) (2.40 )
Weighted-average ordinary shares
outstanding
Basic and diluted 179,077,124 167,778,952 151,069,953 173,459,249 150,612,183
Spotify Technology S.A.
42-44 avenue de la Gare, LU-1610 Luxembourg
10
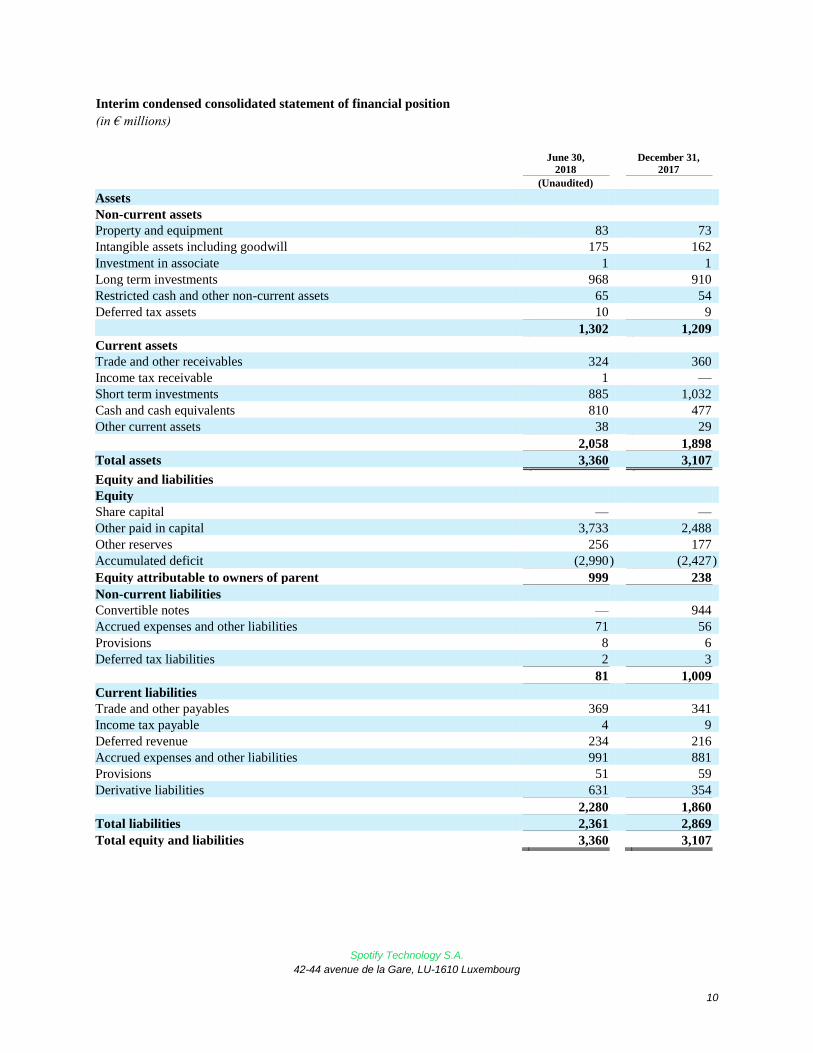
Interim condensed consolidated statement of financial position
(in € millions)
June 30,
2018
December 31,
2017
(Unaudited)
Assets
Non-current assets
Property and equipment 83 73
Intangible assets including goodwill 175 162
Investment in associate 1 1
Long term investments 968 910
Restricted cash and other non-current assets 65 54
Deferred tax assets 10 9
1,302 1,209
Current assets
Trade and other receivables 324 360
Income tax receivable 1 —
Short term investments 885 1,032
Cash and cash equivalents 810 477
Other current assets 38 29
2,058 1,898
Total assets 3,360 3,107
Equity and liabilities
Equity
Share capital — —
Other paid in capital 3,733 2,488
Other reserves 256 177
Accumulated deficit (2,990 ) (2,427 )
Equity attributable to owners of parent 999 238
Non-current liabilities
Convertible notes — 944
Accrued expenses and other liabilities 71 56
Provisions 8 6
Deferred tax liabilities 2 3
81 1,009
Current liabilities
Trade and other payables 369 341
Income tax payable 4 9
Deferred revenue 234 216
Accrued expenses and other liabilities 991 881
Provisions 51 59
Derivative liabilities 631 354
2,280 1,860
Total liabilities 2,361 2,869
Total equity and liabilities 3,360 3,107
Spotify Technology S.A.
42-44 avenue de la Gare, LU-1610 Luxembourg
11
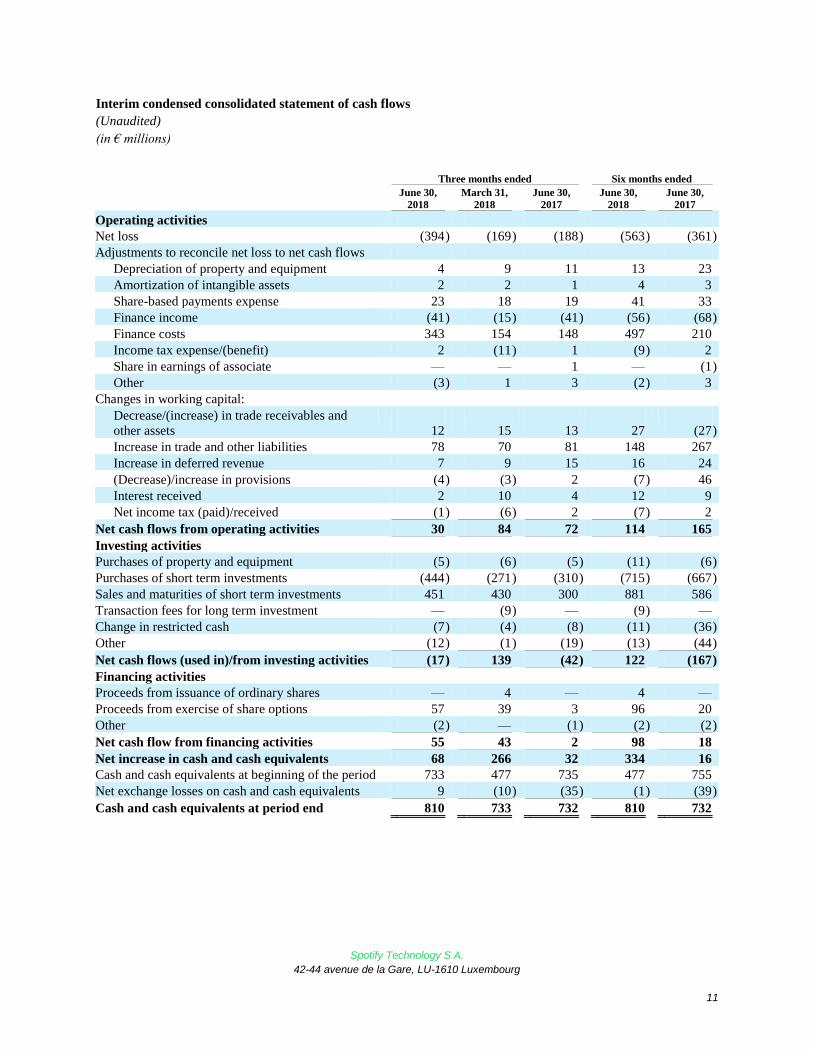
Interim condensed consolidated statement of cash flows
(Unaudited)
(in € millions)
Three months ended Six months ended
June 30,
2018
March 31,
2018
June 30,
2017
June 30,
2018
June 30,
2017
Operating activities
Net loss (394 ) (169 ) (188 ) (563 ) (361 )
Adjustments to reconcile net loss to net cash flows
Depreciation of property and equipment 4 9 11 13 23
Amortization of intangible assets 2 2 1 4 3
Share-based payments expense 23 18 19 41 33
Finance income (41 ) (15 ) (41 ) (56 ) (68 )
Finance costs 343 154 148 497 210
Income tax expense/(benefit) 2 (11 ) 1 (9 ) 2
Share in earnings of associate — — 1 — (1 )
Other (3 ) 1 3 (2 ) 3
Changes in working capital:
Decrease/(increase) in trade receivables and
other assets 12 15 13 27 (27 )
Increase in trade and other liabilities 78 70 81 148 267
Increase in deferred revenue 7 9 15 16 24
(Decrease)/increase in provisions (4 ) (3 ) 2 (7 ) 46
Interest received 2 10 4 12 9
Net income tax (paid)/received (1 ) (6 ) 2 (7 ) 2
Net cash flows from operating activities 30 84 72 114 165
Investing activities
Purchases of property and equipment (5 ) (6 ) (5 ) (11 ) (6 )
Purchases of short term investments (444 ) (271 ) (310 ) (715 ) (667 )
Sales and maturities of short term investments 451 430 300 881 586
Transaction fees for long term investment — (9 ) — (9 ) —
Change in restricted cash (7 ) (4 ) (8 ) (11 ) (36 )
Other (12 ) (1 ) (19 ) (13 ) (44 )
Net cash flows (used in)/from investing activities (17 ) 139 (42 ) 122 (167 )
Financing activities
Proceeds from issuance of ordinary shares — 4 — 4 —
Proceeds from exercise of share options 57 39 3 96 20
Other (2 ) — (1 ) (2 ) (2 )
Net cash flow from financing activities 55 43 2 98 18
Net increase in cash and cash equivalents 68 266 32 334 16
Cash and cash equivalents at beginning of the period 733 477 735 477 755
Net exchange losses on cash and cash equivalents 9 (10 ) (35 ) (1 ) (39 )
Cash and cash equivalents at period end 810 733 732 810 732
Spotify Technology S.A.
42-44 avenue de la Gare, LU-1610 Luxembourg
12
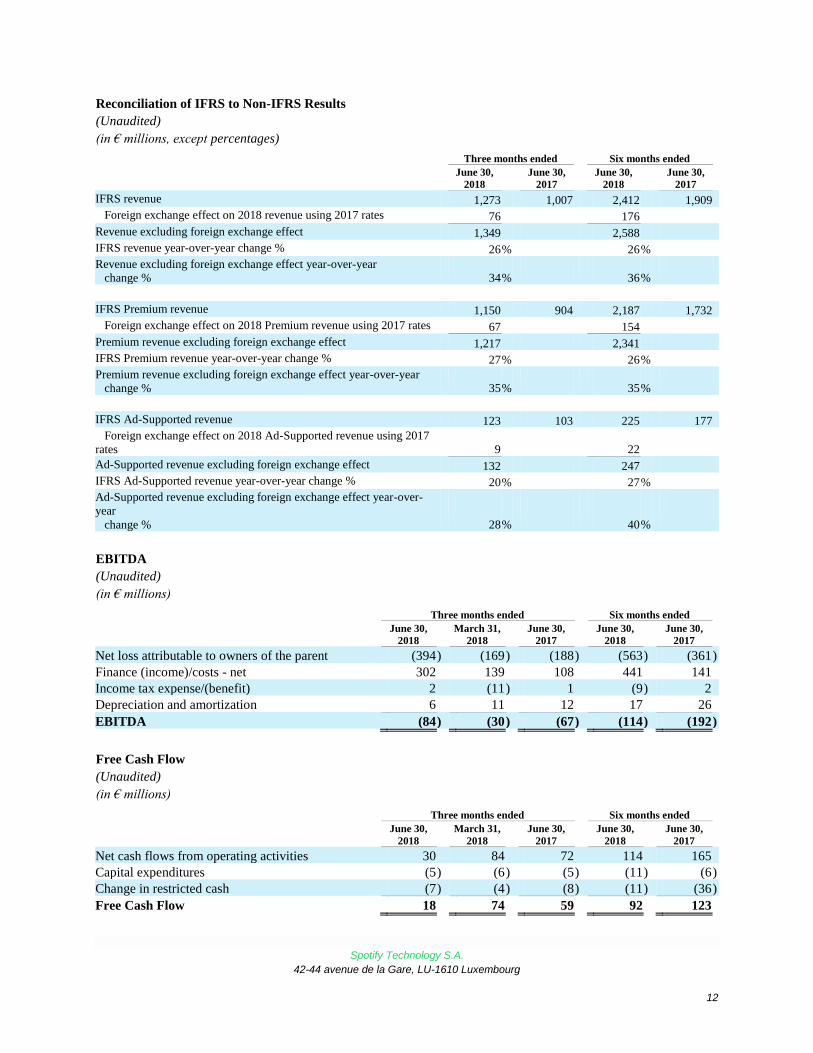
Reconciliation of IFRS to Non-IFRS Results
(Unaudited)
(in € millions, except percentages)
Three months ended Six months ended
June 30,
2018 June 30,
2017 June 30,
2018 June 30,
2017
IFRS revenue 1,273 1,007 2,412 1,909
Foreign exchange effect on 2018 revenue using 2017 rates 76 176
Revenue excluding foreign exchange effect 1,349 2,588
IFRS revenue year-over-year change % 26 % 26 %
Revenue excluding foreign exchange effect year-over-year
change % 34 % 36 %
IFRS Premium revenue 1,150 904 2,187 1,732
Foreign exchange effect on 2018 Premium revenue using 2017 rates 67 154
Premium revenue excluding foreign exchange effect 1,217 2,341
IFRS Premium revenue year-over-year change % 27 % 26 %
Premium revenue excluding foreign exchange effect year-over-year
change % 35 % 35 %
IFRS Ad-Supported revenue 123 103 225 177
Foreign exchange effect on 2018 Ad-Supported revenue using 2017
rates 9 22
Ad-Supported revenue excluding foreign exchange effect 132 247
IFRS Ad-Supported revenue year-over-year change % 20 % 27 %
Ad-Supported revenue excluding foreign exchange effect year-over-
year
change % 28 % 40 %
EBITDA
(Unaudited)
(in € millions)
Three months ended Six months ended
June 30,
2018
March 31,
2018
June 30,
2017
June 30,
2018
June 30,
2017
Net loss attributable to owners of the parent (394 ) (169 ) (188 ) (563 ) (361 )
Finance (income)/costs - net 302 139 108 441 141
Income tax expense/(benefit) 2 (11 ) 1 (9 ) 2
Depreciation and amortization 6 11 12 17 26
EBITDA (84 ) (30 ) (67 ) (114 ) (192 )
Free Cash Flow
(Unaudited)
(in € millions)
Three months ended Six months ended
June 30,
2018
March 31,
2018
June 30,
2017
June 30,
2018
June 30,
2017
Net cash flows from operating activities 30 84 72 114 165
Capital expenditures (5 ) (6 ) (5 ) (11 ) (6 )
Change in restricted cash (7 ) (4 ) (8 ) (11 ) (36 )
Free Cash Flow 18 74 59 92 123