total ionization dose (tid) test results of the...
TRANSCRIPT

TID LDR RH1028MW W1117814 W5
P a g e 1 | 40 LINEAR TECHNOLOGY CORPORATION
Total Ionization Dose (TID) Test Results of the RH1028MW Ultralow Noise Precision High Speed Operational Amplifiers @ Low Dose Rate (LDR)
LDR = 10 mrads(Si)/s
20 February 2015
Duc Nguyen, Sana Rezgui
Acknowledgements
The authors would like to thank the Signal Conditioning Product Engineering Group from Linear Technology for their help with the board design and assembly as well as the data collection pre- and post-irradiations. Special thanks are also for Thomas Shepherd from Defense Microelectronics Activity (DMEA) for the extensive work for board setup and continuous dosimetry monitoring throughout the ELDRS tests.

TID LDR RH1028MW W1117814 W5
P a g e 2 | 40 LINEAR TECHNOLOGY CORPORATION
TID LDR Test Results of the RH1028MW Ultralow Noise Precision High Speed Operational Amplifiers
Part Type Tested: RH1028MW Ultralow Noise Precision High Speed Operational Amplifier Traceability Information: Fab Lot # 1117814.1; Wafer # 5; Assembly Lot # 675617.1; Date Code 1228A. See photograph of unit under test in Appendix A. Quantity of Units: 12 units received, 2 units for control, 5 units for biased irradiation, and 5 units for All GND’d irradiation. Serial numbers 432, 433, and 435-437 had all pins tied to ground during irradiation. Serial numbers 451-455 were biased during irradiation. Serial numbers 438 and 439 were used as control. See Appendix B for the radiation bias connection tables. Radiation and Electrical Test Increments: Ionizing radiation with the following electrical test increments: 25 Krads(Si), 50 Krads(Si), 78 Krads(Si), 100 Krads(Si). Radiation dose: 10 mrads(Si)/sec. Radiation Test Standard: MIL-STD-883 TM1019.9 Condition D. Test Hardware and Software: LTX pre-irradiation test program EQBRH1028.02; LTX post-irradiation test program EQBRH1028.02; Test Board LT1028. Facility and Radiation Source: Defense Micro Electronic Activity (DMEA) and Cobalt-60. Irradiation and Test Temperature: Room temperature controlled to 24°C±6°C per MIL-STD-883 and MIL-STD-750.
SUMMARY ALL 12 PARTS PASSED THE ELECTRICAL TEST LIMITS AS SPECIFIED IN THE DATASHEET AFTER EACH IRRADIATION INCREMENT. ADDITIONAL INFORMATION CAN BE PROVIDED PER REQUEST.

TID LDR RH1028MW W1117814 W5
P a g e 3 | 40 LINEAR TECHNOLOGY CORPORATION
1.0 Overview and Background
Among other radiation effects, Total Ionizing Dose (TID) may affect electrical characteristics, causing parametric and/or functional failures in integrated circuits. During gamma-irradiations, TID-induced and transported electron-hole pairs may result in charge trapping in a transistor’s dielectrics and interface regions, affecting the device’s basic features. Such effects warrant testing and monitoring of circuits to TID, after which annealing and/or Time Dependent Effects (TDE) may take place, depending on the circuit’s design and process technology. Hence the requirement per Condition D (for low-dose rates ranging from less than or equal to 10 mrads(Si)/sec) in TM1019, MIL-STD-883 is to not exceed the allowed time from the end of an incremented irradiation and an electrical test to more than one hour. Additionally, the total time from the end of one incremental irradiation to the start of the next incremental step should be less than two hours. 2.0 Radiation Facility and Test Equipment The samples were irradiated at Defense Micro-Electronics Activity (DMEA) facility in Sacramento, California. DMEA utilizes J.L. Shepherd model 81-22/484 to provide the dose-rate of 10 mrads(Si)/s. A special design screw-driven automatic cart inside the exposure tunnel positions the Device-Under-Test (DUT) precisely and repeatedly from the source to attain optimal rate verified by ion chamber detectors. See Appendix C for the certificate of dosimetry. 3.0 Test Conditions The 10 samples were placed in a lead/aluminum container and aligned with the radiation source, Cobalt-60, at DMEA facility in Sacramento, California. During irradiation, five units were biased at +/- 15V, +8V and other five had all pads grounded. The devices were irradiated up to 100 Krad(Si) with increments of 25, 50, 78 Krads(Si). After each irradiation, the samples were transported in dry ice to Linear Technology testing facility. Testing was performed on the two control units to confirm the operation of the test system prior to the electrical testing of the 12 units (10 irradiated and 2 control). The criteria to pass the low dose-rate test is that five samples irradiated under electrical bias must pass the datasheet limits. If any of the measured parameters of these five units do not meet the required limits then a failure-analysis of the part should be conducted and if valid the lot will be scrapped.

TID LDR RH1028MW W1117814 W5
P a g e 4 | 40 LINEAR TECHNOLOGY CORPORATION
4.0 Tested Parameters The following parameters were measured pre- and post-irradiations at VS = +/- 15V, VCM = 0V unless otherwise noted:
- Input Offset Voltage VOS (uV)
- Input Offset Current IOS (nA)
- Positive Bias Current + IB (nA)
- Negative Bias Current – IB (nA)
- Positive Slew Rate +SR (V/uS)
- Negative Slew Rate –SR (V/uS)
- Common Mode Rejection Ratio CMRR (dB)
- Power Supply Rejection Ratio PSRR (dB)
- Large-Signal Voltage Gain AVOL (V/mV)
- Positive Output Voltage Swing (V) at RL = 2KΩ
- Negative Output Voltage Swing (V) at RL = 2KΩ
- Positive Output Voltage Swing (V) at RL = 600Ω
- Negative Output Voltage Swing (V) at RL = 600Ω
Appendix D details the test conditions, minimum and maximum values at different accumulated doses.

TID LDR RH1028MW W1117814 W5
P a g e 5 | 40 LINEAR TECHNOLOGY CORPORATION
5.0 Test Results All ten samples passed the post-irradiation electrical tests. All measurements of the thirteen listed parameters in section 4.0 are within the specification limits. The used statistics in this report are based on the tolerance limits, which are bounds to gage the quality of the manufactured products. It assumes that if the quality of the items is normally distributed with known mean and known standard deviation, the two-sided tolerance limits can be calculated as follows: +KTL = mean + (KTL) (standard deviation) -KTL = mean - (KTL) (standard deviation) Where +KTL is the upper tolerance limit and -KTL is the lower tolerance limit. These tolerance limits are defined in a table of inverse normal probability distribution. However, in most cases, mean and standard deviation are unknown and therefore it is practical to estimate both of them from a sample. Hence the tolerance limit depends greatly on the sample size. The Ps90%/90% KTL factor for a lot quality P of 0.9, confidence C of 0.9 with a sample size of 5, can be found from the tabulated table (MIL-HDBK-814, page 94, table IX-B). The KTL factor in this report is 2.742. In the plots, the dotted lines with diamond markers are the average of the measured data points of five samples irradiated under electrical bias while the dashed lines with X-markers are the average of measured data points of five units irradiated with all pins tied to ground. The solid lines with triangle markers are the average of the data points after the calculation of the KTL statistics on the sample irradiated in the biased setup. The solid lines with square symbols are the average of the measured points after the application of the KTL statistics on the five samples irradiated with all pins grounded. The orange solid lines with circle markers are the specification limits. The 25 Krads(Si) test limits are using Linear Technology datasheet 20 Krads(Si) specification limits.

TID LDR RH1028MW W1117814 W5
P a g e 6 | 40 LINEAR TECHNOLOGY CORPORATION
Figure 5.1 Plot of Input Voltage Offset VOS versus Total Dose All ten samples passed the post-irradiation input voltage offset test.
-100
-50
0
50
100
150
200
0 20 40 60 80 100 120
VO
S (
uV
) @
+/-
15V
Total Dose (Krad(Si))
Specification MAX
Ps90%/90% (+KTL) Biased
Ps90%/90% (+KTL) All GND'd
Average Biased
Average All GND'd
Ps90%/90% (-KTL) Biased
Ps90%/90% (-KTL) All GND'd

TID LDR RH1028MW W1117814 W5
P a g e 7 | 40 LINEAR TECHNOLOGY CORPORATION
Table 5.1: Raw data for input voltage offset versus total dose including the statistical calculations, maximum specification, and the status of the test (PASS/FAIL) under the orange headers)
Parameter VOS @ +/- 15V
Units (uV) 0 25 50 78 100
432 All GND'd Irradiation -27.29 -14.80 -11.70 -12.50 -9.79
433 All GND'd Irradiation -4.59 7.43 14.10 15.10 15.70
435 All GND'd Irradiation -6.62 5.40 5.52 8.02 9.44
436 All GND'd Irradiation -21.67 -15.80 -13.50 -17.10 -11.90
437 All GND'd Irradiation -2.60 9.64 13.70 22.40 27.10
451 Biased-Irradiation 10.17 23.80 26.90 33.70 34.50
452 Biased-Irradiation -13.62 2.93 1.63 9.74 8.10
453 Biased-Irradiation -33.04 -14.20 -12.00 -10.10 -8.29
454 Biased-Irradiation 11.57 27.90 30.90 34.10 34.00
455 Biased-Irradiation -12.46 7.86 9.64 13.40 14.90
438 Control Unit -24.01 -18.50 -18.20 -19.00 -17.70
439 Control Unit 13.63 20.10 18.40 17.80 17.30
All GND'd Irradiation Statistics
Average All GND'd -12.55 -1.63 1.62 3.18 6.11
Std Dev All GND'd 11.16 12.58 13.44 17.26 16.74
Ps90%/90% (+KTL) All GND'd 18.04 32.86 38.49 50.52 52.01
Ps90%/90% (-KTL) All GND'd -43.15 -36.11 -35.24 -44.15 -39.79
Biased-Irradiation Statistics
Average Biased -7.48 9.66 11.41 16.17 16.64
Std Dev Biased 18.64 16.96 17.79 18.49 18.15
Ps90%/90% (+KTL) Biased 43.64 56.16 60.21 66.87 66.41
Ps90%/90% (-KTL) Biased -58.59 -36.84 -37.38 -34.54 -33.13
Specifications MIN
Status (Measurements) All GND'd
Status (Measurements) Biased
Specification MAX 80 120 140 160
Status (Measurements) All GND'd PASS PASS PASS PASS
Status (Measurements) Biased PASS PASS PASS PASS
Status (-KTL) All GND'd
Status (+KTL) All GND'd PASS PASS PASS PASS
Status (-KTL) Biased
Status (+KTL) Biased PASS PASS PASS PASS
Total Dose (Krad(Si)) @ 10 mrads(Si)/second
TID LDR RH1028MW W1117814 W5
P a g e 8 | 40 LINEAR TECHNOLOGY CORPORATION
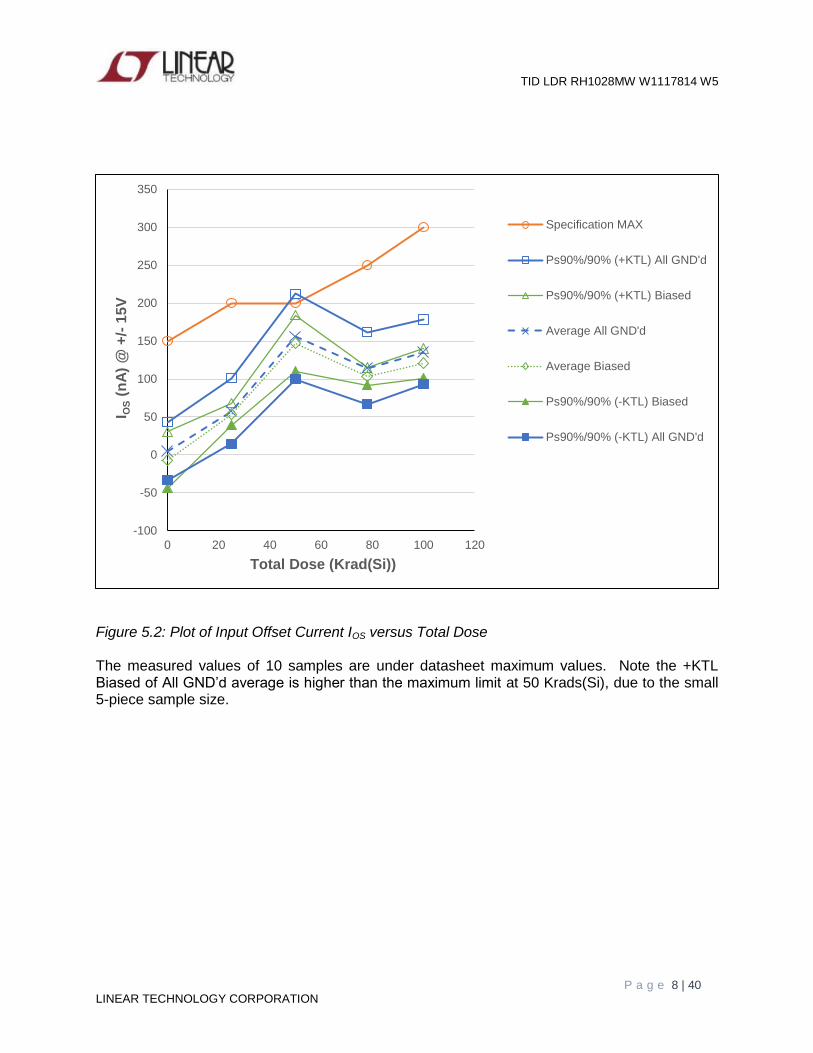
Figure 5.2: Plot of Input Offset Current IOS versus Total Dose The measured values of 10 samples are under datasheet maximum values. Note the +KTL Biased of All GND’d average is higher than the maximum limit at 50 Krads(Si), due to the small 5-piece sample size.
-100
-50
0
50
100
150
200
250
300
350
0 20 40 60 80 100 120
IO
S (
nA
) @
+/-
15V
Total Dose (Krad(Si))
Specification MAX
Ps90%/90% (+KTL) All GND'd
Ps90%/90% (+KTL) Biased
Average All GND'd
Average Biased
Ps90%/90% (-KTL) Biased
Ps90%/90% (-KTL) All GND'd

TID LDR RH1028MW W1117814 W5
P a g e 9 | 40 LINEAR TECHNOLOGY CORPORATION
Table 5.2: Raw data for input offset current versus total dose including the statistical calculations, maximum specification, and the status of the test (PASS/FAIL under the second orange header)
Parameter IOS @ +/- 15V
Units (nA) 0 25 50 78 100
432 All GND'd Irradiation 23.44 79.10 180.00 136.00 154.00
433 All GND'd Irradiation 13.92 68.10 168.00 129.00 151.00
435 All GND'd Irradiation -1.83 49.10 157.00 103.00 124.00
436 All GND'd Irradiation -12.08 39.20 126.00 95.90 123.00
437 All GND'd Irradiation 1.10 53.50 148.00 107.00 126.00
451 Biased-Irradiation 12.82 53.50 129.00 106.00 128.00
452 Biased-Irradiation -25.27 45.10 149.00 96.70 110.00
453 Biased-Irradiation -6.96 55.70 138.00 102.00 119.00
454 Biased-Irradiation -6.23 54.60 163.00 107.00 126.00
455 Biased-Irradiation -9.52 59.30 156.00 105.00 119.00
438 Control Unit 9.52 9.16 44.90 11.00 9.15
439 Control Unit 17.21 18.70 73.80 19.50 17.90
All GND'd Irradiation Statistics
Average All GND'd 4.91 57.80 155.80 114.18 135.60
Std Dev All GND'd 13.90 15.81 20.52 17.37 15.50
Ps90%/90% (+KTL) All GND'd 43.03 101.15 212.07 161.80 178.11
Ps90%/90% (-KTL) All GND'd -33.21 14.45 99.53 66.56 93.09
Biased-Irradiation Statistics
Average Biased -7.03 53.64 147.00 103.34 120.40
Std Dev Biased 13.54 5.25 13.66 4.16 7.09
Ps90%/90% (+KTL) Biased 30.10 68.03 184.45 114.74 139.85
Ps90%/90% (-KTL) Biased -44.16 39.25 109.55 91.94 100.95
Specification MIN
Status (Measurements) All GND'd
Status (Measurements) Biased
Specification MAX 150 200 200 300
Status (Measurements) All GND'd PASS PASS PASS PASS
Status (Measurements) Biased PASS PASS PASS PASS
Status (-KTL) All GND'd
Status (+KTL) All GND'd PASS PASS FAIL PASS
Status (-KTL) Biased
Status (+KTL) Biased PASS PASS PASS PASS
Total Dose (Krad(Si)) @ 10 mrads(Si)/second
TID LDR RH1028MW W1117814 W5
P a g e 10 | 40 LINEAR TECHNOLOGY CORPORATION
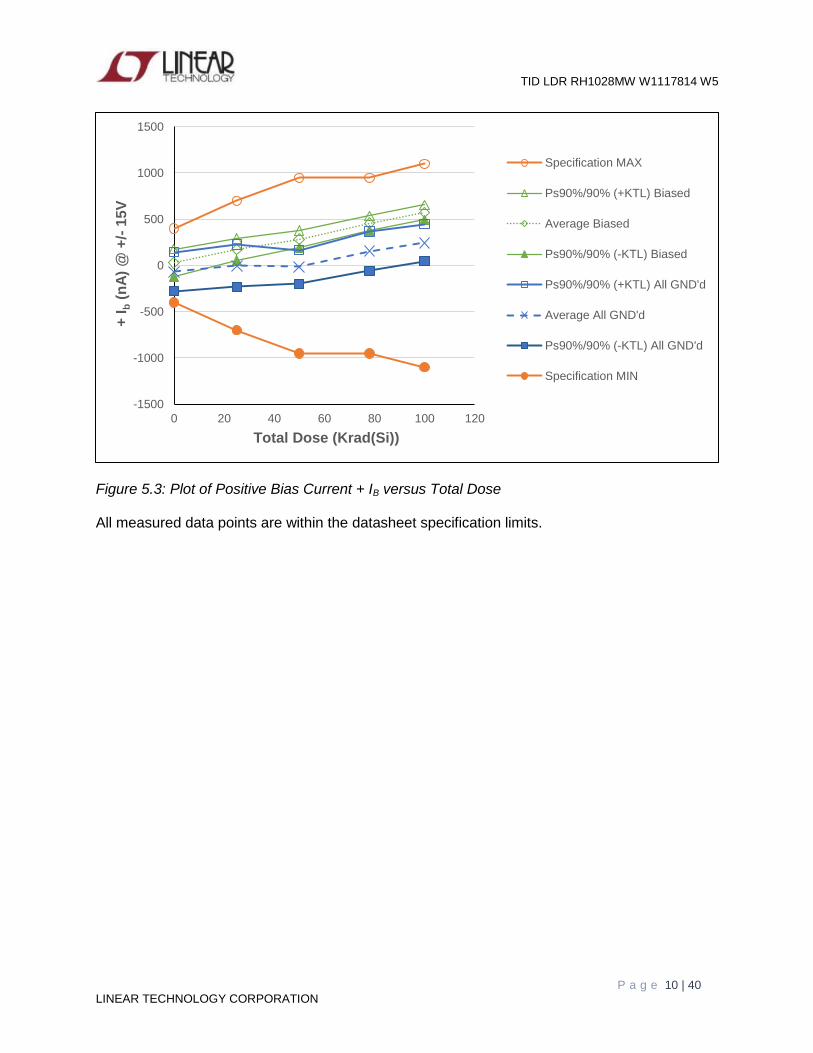
Figure 5.3: Plot of Positive Bias Current + IB versus Total Dose All measured data points are within the datasheet specification limits.
-1500
-1000
-500
0
500
1000
1500
0 20 40 60 80 100 120
+ I
b (
nA
) @
+/-
15V
Total Dose (Krad(Si))
Specification MAX
Ps90%/90% (+KTL) Biased
Average Biased
Ps90%/90% (-KTL) Biased
Ps90%/90% (+KTL) All GND'd
Average All GND'd
Ps90%/90% (-KTL) All GND'd
Specification MIN

TID LDR RH1028MW W1117814 W5
P a g e 11 | 40 LINEAR TECHNOLOGY CORPORATION
Table 5.3: Raw data for positive bias current versus total dose including the statistical calculations, minimum specification, maximum specification, and the status of the test (PASS/FAIL).
Parameter Positive IB @ +/- 15V
Units (nA) 0 25 50 78 100
432 All GND'd Irradiation -18.87 49.70 13.50 194.00 272.00
433 All GND'd Irradiation -199.32 -141.00 -132.00 31.80 139.00
435 All GND'd Irradiation -6.23 73.30 36.10 238.00 339.00
436 All GND'd Irradiation -55.14 13.20 6.57 166.00 251.00
437 All GND'd Irradiation -58.62 0.55 -2.19 137.00 223.00
451 Biased-Irradiation -58.62 183.00 252.00 439.00 551.00
452 Biased-Irradiation 23.08 113.00 263.00 419.00 536.00
453 Biased-Irradiation 37.56 232.00 314.00 481.00 588.00
454 Biased-Irradiation 78.77 172.00 327.00 489.00 609.00
455 Biased-Irradiation 65.95 158.00 267.00 459.00 585.00
438 Control Unit 108.09 45.10 33.00 110.00 105.00
439 Control Unit -74.93 -81.40 -131.00 -27.40 -83.50
All GND'd Irradiation Statistics
Average All GND'd -67.64 -0.85 -15.60 153.36 244.80
Std Dev All GND'd 77.02 83.51 66.60 77.49 73.01
Ps90%/90% (+KTL) All GND'd 143.54 228.13 167.00 365.84 444.99
Ps90%/90% (-KTL) All GND'd -278.82 -229.83 -198.21 -59.12 44.61
Biased-Irradiation Statistics
Average Biased 29.35 171.60 284.60 457.40 573.80
Std Dev Biased 53.92 43.00 33.55 29.03 29.64
Ps90%/90% (+KTL) Biased 177.19 289.52 376.58 537.00 655.08
Ps90%/90% (-KTL) Biased -118.49 53.68 192.62 377.80 492.52
Specification MIN -400 -700 -950 -1100
Status (Measurements) All GND'd PASS PASS PASS PASS
Status (Measurements) Biased PASS PASS PASS PASS
Specification MAX 400 700 950 1100
Status (Measurements) All GND'd PASS PASS PASS PASS
Status (Measurements) Biased PASS PASS PASS PASS
Status (-KTL) All GND'd PASS PASS PASS PASS
Status (+KTL) All GND'd PASS PASS PASS PASS
Status (-KTL) Biased PASS PASS PASS PASS
Status (+KTL) Biased PASS PASS PASS PASS
Total Dose (Krad(Si)) @ 10 mrads(Si)/second

TID LDR RH1028MW W1117814 W5
P a g e 12 | 40 LINEAR TECHNOLOGY CORPORATION
Figure 5.4: Plot of Negative Bias Current -IB versus Total Dose All measured data points are within datasheet specification limits.
-1500
-1000
-500
0
500
1000
1500
0 20 40 60 80 100 120
- I
b (
nA
) @
+/-
15V
Total Dose (Krad(Si))
Specification MAX
Ps90%/90% (+KTL) Biased
Average Biased
Ps90%/90% (-KTL) Biased
Ps90%/90% (+KTL) AllGND'd
Average All GND'd
Ps90%/90% (-KTL) All GND'd
Specification MIN

TID LDR RH1028MW W1117814 W5
P a g e 13 | 40 LINEAR TECHNOLOGY CORPORATION
Table 5.4: Raw data for negative input bias current versus total dose including the statistical calculations, minimum specification, maximum specification, and the status of the test (PASS/FAIL).
Parameter Negative IB +/- 15V
Units (nA) 0 25 50 78 100
432 All GND'd Irradiation 4.58 131.00 229.00 326.00 427.00
433 All GND'd Irradiation -187.59 -71.80 29.40 159.00 291.00
435 All GND'd Irradiation -7.69 126.00 233.00 343.00 465.00
436 All GND'd Irradiation -65.95 56.10 153.00 263.00 372.00
437 All GND'd Irradiation -59.17 54.20 147.00 245.00 350.00
451 Biased-Irradiation -42.50 235.00 422.00 545.00 679.00
452 Biased-Irradiation -3.30 159.00 397.00 516.00 648.00
453 Biased-Irradiation 30.23 288.00 464.00 585.00 708.00
454 Biased-Irradiation 73.28 232.00 477.00 598.00 734.00
455 Biased-Irradiation 57.34 218.00 447.00 566.00 703.00
438 Control Unit 117.25 120.00 113.00 121.00 114.00
439 Control Unit -58.44 -58.60 -70.10 -55.90 -64.50
All GND'd Irradiation Statistics
Average All GND'd -63.17 59.10 158.28 267.20 381.00
Std Dev All GND'd 76.11 81.87 82.69 73.18 67.66
Ps90%/90% (+KTL) All GND'd 145.53 283.60 385.01 467.86 566.54
Ps90%/90% (-KTL) All GND'd -271.87 -165.40 -68.45 66.54 195.46
Biased-Irradiation Statistics
Average Biased 23.01 226.40 441.40 562.00 694.40
Std Dev Biased 46.75 46.13 32.24 32.58 32.47
Ps90%/90% (+KTL) Biased 151.19 352.90 529.80 651.34 783.43
Ps90%/90% (-KTL) Biased -105.17 99.90 353.00 472.66 605.37
Specification MIN -400 -700 -950 -1100
Status (Measurements) All GND'd PASS PASS PASS PASS
Status (Measurements) Biased PASS PASS PASS PASS
Specification MAX 400 700 950 1100
Status (Measurements) All GND'd PASS PASS PASS PASS
Status (Measurements) Biased PASS PASS PASS PASS
Status (-KTL) All GND'd PASS PASS PASS PASS
Status (+KTL) All GND'd PASS PASS PASS PASS
Status (-KTL) Biased PASS PASS PASS PASS
Status (+KTL) Biased PASS PASS PASS PASS
Total Dose (Krad(Si)) @ 10 mrads(Si)/second

TID LDR RH1028MW W1117814 W5
P a g e 14 | 40 LINEAR TECHNOLOGY CORPORATION
Figure 5.5: Plot of Positive Slew Rate versus Total Dose The measured parameters are over the specification minimum limits.
6
8
10
12
14
16
18
20
0 20 40 60 80 100 120
+ S
lew
Ra
te (
V/u
S)
Total Dose (Krad(Si))
Ps90%/90% (+KTL) All GND'd
Ps90%/90% (+KTL) Biased
Average Biased
Average All GND'd
Ps90%/90% (-KTL) Biased
Ps90%/90% (-KTL) All GND'd
Specification MIN

TID LDR RH1028MW W1117814 W5
P a g e 15 | 40 LINEAR TECHNOLOGY CORPORATION
Table 5.5: Raw data for positive slew rate versus total dose including the statistical calculations, minimum specification, and the status of the test (PASS/FAIL)
Parameter Positive Slew Rate
Units (V/us) 0 25 50 78 100
432 All GND'd Irradiation 15.72 16.20 16.00 15.50 14.40
433 All GND'd Irradiation 14.59 14.60 14.60 14.20 13.10
435 All GND'd Irradiation 15.72 16.20 15.70 15.50 14.20
436 All GND'd Irradiation 15.25 15.70 15.50 15.20 14.00
437 All GND'd Irradiation 14.39 14.60 14.60 14.20 13.40
451 Biased-Irradiation 14.39 14.40 14.60 14.60 14.00
452 Biased-Irradiation 14.59 14.80 14.80 14.80 14.00
453 Biased-Irradiation 15.25 15.50 15.30 15.50 14.80
454 Biased-Irradiation 15.25 15.50 15.30 15.20 14.60
455 Biased-Irradiation 14.81 14.80 14.80 14.60 14.20
438 Control Unit 15.03 15.50 15.70 15.70 14.60
439 Control Unit 15.48 16.20 16.20 16.20 15.30
All GND'd Irradiation Statistics
Average All GND'd 15.14 15.46 15.28 14.92 13.82
Std Dev All GND'd 0.63 0.81 0.65 0.67 0.55
Ps90%/90% (+KTL) All GND'd 16.85 17.68 17.05 16.75 15.33
Ps90%/90% (-KTL) All GND'd 13.42 13.24 13.51 13.09 12.31
Biased-Irradiation Statistics
Average Biased 14.86 15.00 14.96 14.94 14.32
Std Dev Biased 0.39 0.48 0.32 0.40 0.36
Ps90%/90% (+KTL) Biased 15.92 16.33 15.84 16.03 15.32
Ps90%/90% (-KTL) Biased 13.79 13.67 14.08 13.85 13.32
Specification MIN 11.0 7.5 7.5 7.5
Status (Measurements) All GND'd PASS PASS PASS PASS
Status (Measurements) Biased PASS PASS PASS PASS
Specification MAX
Status (Measurements) All GND'd
Status (Measurements) Biased
Status (-KTL) All GND'd PASS PASS PASS PASS
Status (+KTL) All GND'd
Status (-KTL) Biased PASS PASS PASS PASS
Status (+KTL) Biased
Total Dose (Krad(Si)) @ 10 mrads(Si)/second

TID LDR RH1028MW W1117814 W5
P a g e 16 | 40 LINEAR TECHNOLOGY CORPORATION
Figure 5.6: Plot of Negative Slew Rate versus Total Dose All measured data are higher than specification minimum limits.
6
8
10
12
14
16
18
20
0 20 40 60 80 100 120
-
Sle
w R
ate
(V
/uS
)
Total Dose (Krad(Si))
Ps90%/90% (+KTL) All GND'd
Ps90%/90% (+KTL) Biased
Average Biased
Average All GND'd
Ps90%/90% (-KTL) Biased
Ps90%/90% (-KTL) All GND'd
Specification MIN

TID LDR RH1028MW W1117814 W5
P a g e 17 | 40 LINEAR TECHNOLOGY CORPORATION
Table 5.6: Raw data for negative slew rate versus total dose including the statistical calculations, minimum specification, and the status of the test (PASS/FAIL)
Parameter Negative Slew Rate Total Dose (Krad(Si)) @ 10 mrads(Si)/second
Units (V/us) 0 25 50 78 100
432 All GND'd Irradiation 16.07 16.10 16.30 15.80 14.70
433 All GND'd Irradiation 14.91 15.10 14.90 14.70 13.00
435 All GND'd Irradiation 15.82 15.80 16.10 15.60 14.50
436 All GND'd Irradiation 15.35 15.60 15.60 15.10 14.30
437 All GND'd Irradiation 15.13 15.10 15.10 14.70 13.70
451 Biased-Irradiation 15.13 15.10 14.90 15.10 14.30
452 Biased-Irradiation 14.91 15.10 15.10 15.10 14.30
453 Biased-Irradiation 15.35 15.60 15.80 15.60 14.90
454 Biased-Irradiation 15.82 15.80 15.80 16.00 15.10
455 Biased-Irradiation 14.91 14.90 15.10 15.10 14.30
438 Control Unit 15.13 15.80 16.10 16.00 15.10
439 Control Unit 15.82 16.30 16.60 16.50 15.60
All GND'd Irradiation Statistics
Average All GND'd 15.46 15.54 15.60 15.18 14.04
Std Dev All GND'd 0.48 0.44 0.61 0.51 0.69
Ps90%/90% (+KTL) All GND'd 16.79 16.74 17.27 16.57 15.94
Ps90%/90% (-KTL) All GND'd 14.13 14.34 13.93 13.79 12.14
Biased-Irradiation Statistics
Average Biased 15.22 15.30 15.34 15.38 14.58
Std Dev Biased 0.38 0.38 0.43 0.41 0.39
Ps90%/90% (+KTL) Biased 16.28 16.34 16.51 16.50 15.65
Ps90%/90% (-KTL) Biased 14.17 14.26 14.17 14.26 13.51
Specification MIN 11.0 7.5 7.5 7.5
Status (Measurements) All GND'd PASS PASS PASS PASS
Status (Measurements) Biased PASS PASS PASS PASS
Specification MAX
Status (Measurements) All GND'd
Status (Measurements) Biased
Status (-KTL) All GND'd PASS PASS PASS PASS
Status (+KTL) All GND'd
Status (-KTL) Biased PASS PASS PASS PASS
Status (+KTL) Biased

TID LDR RH1028MW W1117814 W5
P a g e 18 | 40 LINEAR TECHNOLOGY CORPORATION
Figure 5.7: Plot of Common Mode Rejection Rate (CMRR) versus Total Dose The average measured values of 10 samples pass the datasheet specification minimum limit.
100
105
110
115
120
125
130
0 20 40 60 80 100 120
CM
RR
(d
B)
@ +
/- 1
5V
; C
MR
@ +
/- 1
1V
Total Dose (Krad(Si))
Ps90%/90% (+KTL) All GND'd
Average All GND'd
Ps90%/90% (+KTL) Biased
Average Biased
Ps90%/90% (-KTL) All GND'd
Ps90%/90% (-KTL) Biased
Specification MIN

TID LDR RH1028MW W1117814 W5
P a g e 19 | 40 LINEAR TECHNOLOGY CORPORATION
Table 5.7: Raw data table for common mode rejection ratio (CMRR) versus total dose including the statistical calculations, minimum specification, and the status of the test (PASS/FAIL)
ParameterCMRR @ +/- 15V; CMR @ +/- 11V
Units (dB) 0 25 50 78 100
432 All GND'd Irradiation 124 124 124 125 124
433 All GND'd Irradiation 124 123 124 124 124
435 All GND'd Irradiation 124 124 124 124 124
436 All GND'd Irradiation 124 123 124 125 125
437 All GND'd Irradiation 123 124 123 123 124
451 Biased-Irradiation 123 123 123 122 123
452 Biased-Irradiation 123 123 123 123 123
453 Biased-Irradiation 123 122 123 123 123
454 Biased-Irradiation 123 122 123 123 123
455 Biased-Irradiation 123 124 123 123 123
438 Control Unit 122 121 122 121 122
439 Control Unit 123 124 124 123 123
All GND'd Irradiation Statistics
Average All GND'd 124 124 124 124 124
Std Dev All GND'd 1 1 0 1 0
Ps90%/90% (+KTL) All GND'd 125 125 125 126 125
Ps90%/90% (-KTL) All GND'd 122 122 123 122 123
Biased-Irradiation Statistics
Average Biased 123 123 123 123 123
Std Dev Biased 0 1 0 0 0
Ps90%/90% (+KTL) Biased 124 125 123 124 123
Ps90%/90% (-KTL) Biased 122 121 123 122 123
Specification MIN 110 106 106 106
Status (Measurements) All GND'd PASS PASS PASS PASS
Status (Measurements) Biased PASS PASS PASS PASS
Specification MAX
Status (Measurements) All GND'd
Status (Measurements) Biased
Status (-KTL) All GND'd PASS PASS PASS PASS
Status (+KTL) All GND'd
Status (-KTL) Biased PASS PASS PASS PASS
Status (+KTL) Biased
Total Dose (Krad(Si)) @ 10 mrads(Si)/second

TID LDR RH1028MW W1117814 W5
P a g e 20 | 40 LINEAR TECHNOLOGY CORPORATION
Figure 5.8: Plot of Power Supply Rejection Rate (PSRR) versus Total Dose The average measured values of 10 samples pass the datasheet specification minimum limit.
80
90
100
110
120
130
140
150
160
0 20 40 60 80 100 120
PS
RR
(d
B)
@ V
S =
+/-
4V
to
+/-
18V
Total Dose (Krad(Si))
Ps90%/90% (+KTL) All GND'd
Ps90%/90% (+KTL) Biased
Average All GND'd
Average Biased
Ps90%/90% (-KTL) All GND'd
Ps90%/90% (-KTL) Biased
Specification MIN

TID LDR RH1028MW W1117814 W5
P a g e 21 | 40 LINEAR TECHNOLOGY CORPORATION
Table 5.8: Raw data table for power supply rejection ratio (PSRR) versus total dose including the statistical calculations, minimum specification, and the status of the test (PASS/FAIL)
Parameter PSRR @ VS = +/- 4V to +/- 18V
Units (dB) 0 25 50 78 100
432 All GND'd Irradiation 131 132 132 132 133
433 All GND'd Irradiation 131 131 133 133 134
435 All GND'd Irradiation 132 131 132 132 132
436 All GND'd Irradiation 143 142 140 138 136
437 All GND'd Irradiation 127 127 129 130 133
451 Biased-Irradiation 128 129 130 131 131
452 Biased-Irradiation 131 131 132 131 132
453 Biased-Irradiation 129 130 131 130 130
454 Biased-Irradiation 128 130 129 129 129
455 Biased-Irradiation 130 132 132 132 132
438 Control Unit 130 131 131 131 131
439 Control Unit 129 130 130 129 129
All GND'd Irradiation Statistics
Average All GND'd 133 133 133 133 134
Std Dev All GND'd 6 6 4 3 2
Ps90%/90% (+KTL) All GND'd 150 148 144 141 138
Ps90%/90% (-KTL) All GND'd 116 117 122 125 129
Biased-Irradiation Statistics
Average Biased 129 130 131 131 131
Std Dev Biased 1 1 1 1 1
Ps90%/90% (+KTL) Biased 132 134 134 134 134
Ps90%/90% (-KTL) Biased 126 127 127 127 127
Specification MIN 110 104 104 104
Status (Measurements) All GND'd PASS PASS PASS PASS
Status (Measurements) Biased PASS PASS PASS PASS
Specification MAX
Status (Measurements) All GND'd
Status (Measurements) Biased
Status (-KTL) All GND'd PASS PASS PASS PASS
Status (+KTL) All GND'd
Status (-KTL) Biased PASS PASS PASS PASS
Status (+KTL) Biased
Total Dose (Krad(Si)) @ 10 mrads(Si)/second

TID LDR RH1028MW W1117814 W5
P a g e 22 | 40 LINEAR TECHNOLOGY CORPORATION
Figure 5.9: Plot of Large Signal Voltage Gain AVOL versus Total Dose The average measured values of 10 samples pass the datasheet specification minimum limit.
0.00E+00
1.00E+05
2.00E+05
3.00E+05
4.00E+05
5.00E+05
6.00E+05
7.00E+05
8.00E+05
9.00E+05
1.00E+06
0 20 40 60 80 100 120
AV
OL (
V/m
V)
VO=
-1
0V
to
10V
; R
L =
2KΩ
Total Dose (Krad(Si))
Ps90%/90% (+KTL) All GND'd
Ps90%/90% (+KTL) Biased
Average All GND'd
Average Biased
Ps90%/90% (-KTL) Biased
PS90%/90% (-KTL) All GND'd
Specification MIN
TID LDR RH1028MW W1117814 W5
P a g e 23 | 40 LINEAR TECHNOLOGY CORPORATION
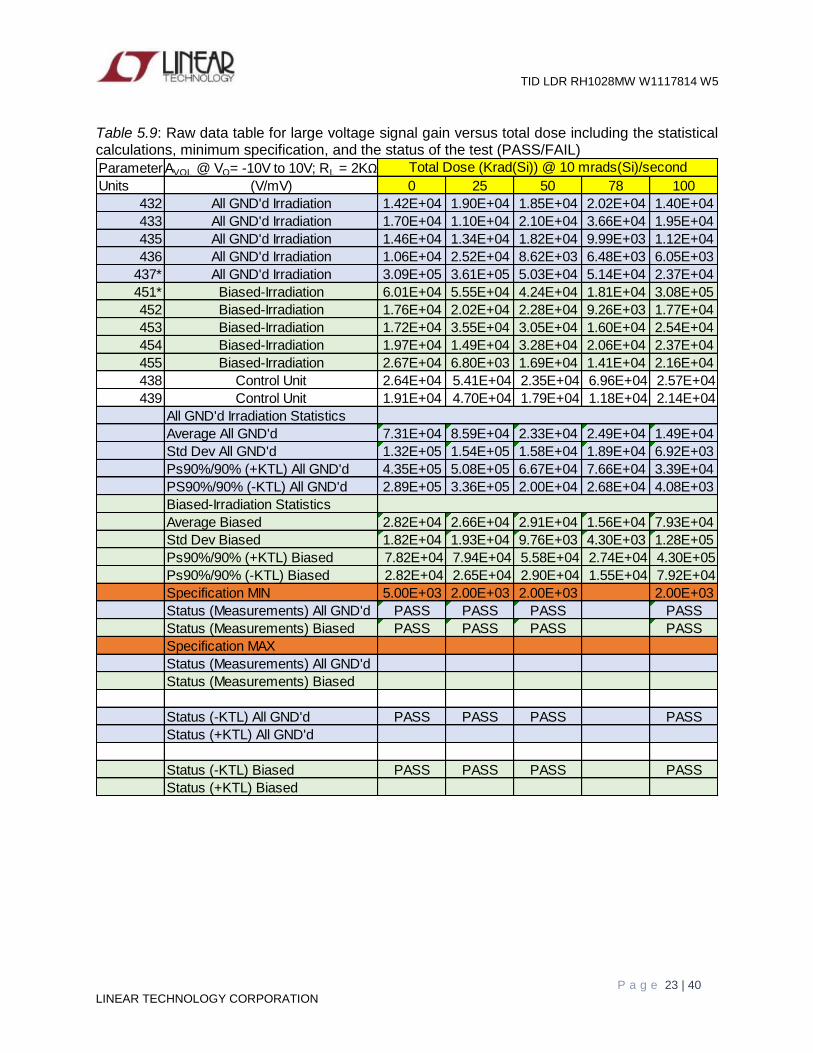
Table 5.9: Raw data table for large voltage signal gain versus total dose including the statistical calculations, minimum specification, and the status of the test (PASS/FAIL)
ParameterAVOL @ VO= -10V to 10V; RL = 2KΩ
Units (V/mV) 0 25 50 78 100
432 All GND'd Irradiation 1.42E+04 1.90E+04 1.85E+04 2.02E+04 1.40E+04
433 All GND'd Irradiation 1.70E+04 1.10E+04 2.10E+04 3.66E+04 1.95E+04
435 All GND'd Irradiation 1.46E+04 1.34E+04 1.82E+04 9.99E+03 1.12E+04
436 All GND'd Irradiation 1.06E+04 2.52E+04 8.62E+03 6.48E+03 6.05E+03
437* All GND'd Irradiation 3.09E+05 3.61E+05 5.03E+04 5.14E+04 2.37E+04
451* Biased-Irradiation 6.01E+04 5.55E+04 4.24E+04 1.81E+04 3.08E+05
452 Biased-Irradiation 1.76E+04 2.02E+04 2.28E+04 9.26E+03 1.77E+04
453 Biased-Irradiation 1.72E+04 3.55E+04 3.05E+04 1.60E+04 2.54E+04
454 Biased-Irradiation 1.97E+04 1.49E+04 3.28E+04 2.06E+04 2.37E+04
455 Biased-Irradiation 2.67E+04 6.80E+03 1.69E+04 1.41E+04 2.16E+04
438 Control Unit 2.64E+04 5.41E+04 2.35E+04 6.96E+04 2.57E+04
439 Control Unit 1.91E+04 4.70E+04 1.79E+04 1.18E+04 2.14E+04
All GND'd Irradiation Statistics
Average All GND'd 7.31E+04 8.59E+04 2.33E+04 2.49E+04 1.49E+04
Std Dev All GND'd 1.32E+05 1.54E+05 1.58E+04 1.89E+04 6.92E+03
Ps90%/90% (+KTL) All GND'd 4.35E+05 5.08E+05 6.67E+04 7.66E+04 3.39E+04
PS90%/90% (-KTL) All GND'd 2.89E+05 3.36E+05 2.00E+04 2.68E+04 4.08E+03
Biased-Irradiation Statistics
Average Biased 2.82E+04 2.66E+04 2.91E+04 1.56E+04 7.93E+04
Std Dev Biased 1.82E+04 1.93E+04 9.76E+03 4.30E+03 1.28E+05
Ps90%/90% (+KTL) Biased 7.82E+04 7.94E+04 5.58E+04 2.74E+04 4.30E+05
Ps90%/90% (-KTL) Biased 2.82E+04 2.65E+04 2.90E+04 1.55E+04 7.92E+04
Specification MIN 5.00E+03 2.00E+03 2.00E+03 2.00E+03
Status (Measurements) All GND'd PASS PASS PASS PASS
Status (Measurements) Biased PASS PASS PASS PASS
Specification MAX
Status (Measurements) All GND'd
Status (Measurements) Biased
Status (-KTL) All GND'd PASS PASS PASS PASS
Status (+KTL) All GND'd
Status (-KTL) Biased PASS PASS PASS PASS
Status (+KTL) Biased
Total Dose (Krad(Si)) @ 10 mrads(Si)/second

TID LDR RH1028MW W1117814 W5
P a g e 24 | 40 LINEAR TECHNOLOGY CORPORATION
Figure 5.10: Plot of Positive Output Swing Voltage VOUT with RL = 2KΩ versus Total Dose The average measured values of 10 samples pass the datasheet specification minimum limit.
11
12
13
14
0 20 40 60 80 100 120
+ V
OU
T (
V)
@ +
/- 1
5V
; R
L =
2kΩ
Total Dose (Krad(Si))
Ps90%/90% (+KTL) Biased
Ps90%/90% (-KTL) All GND'd
Ps90%/90% (+KTL) All GND'd
Average All GND'd
Average Biased
Ps90%/90% (-KTL) Biased
Specification MIN
TID LDR RH1028MW W1117814 W5
P a g e 25 | 40 LINEAR TECHNOLOGY CORPORATION
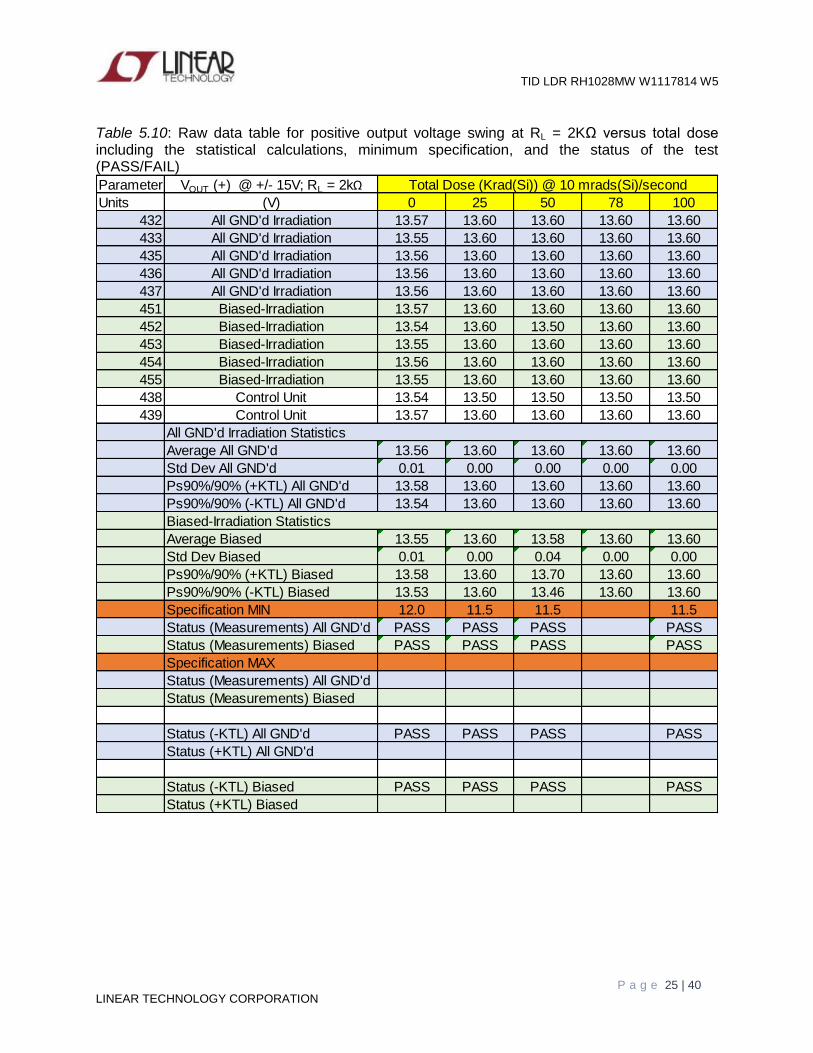
Table 5.10: Raw data table for positive output voltage swing at RL = 2KΩ versus total dose including the statistical calculations, minimum specification, and the status of the test (PASS/FAIL)
Parameter VOUT (+) @ +/- 15V; RL = 2kΩ Total Dose (Krad(Si)) @ 10 mrads(Si)/second
Units (V) 0 25 50 78 100
432 All GND'd Irradiation 13.57 13.60 13.60 13.60 13.60
433 All GND'd Irradiation 13.55 13.60 13.60 13.60 13.60
435 All GND'd Irradiation 13.56 13.60 13.60 13.60 13.60
436 All GND'd Irradiation 13.56 13.60 13.60 13.60 13.60
437 All GND'd Irradiation 13.56 13.60 13.60 13.60 13.60
451 Biased-Irradiation 13.57 13.60 13.60 13.60 13.60
452 Biased-Irradiation 13.54 13.60 13.50 13.60 13.60
453 Biased-Irradiation 13.55 13.60 13.60 13.60 13.60
454 Biased-Irradiation 13.56 13.60 13.60 13.60 13.60
455 Biased-Irradiation 13.55 13.60 13.60 13.60 13.60
438 Control Unit 13.54 13.50 13.50 13.50 13.50
439 Control Unit 13.57 13.60 13.60 13.60 13.60
All GND'd Irradiation Statistics
Average All GND'd 13.56 13.60 13.60 13.60 13.60
Std Dev All GND'd 0.01 0.00 0.00 0.00 0.00
Ps90%/90% (+KTL) All GND'd 13.58 13.60 13.60 13.60 13.60
Ps90%/90% (-KTL) All GND'd 13.54 13.60 13.60 13.60 13.60
Biased-Irradiation Statistics
Average Biased 13.55 13.60 13.58 13.60 13.60
Std Dev Biased 0.01 0.00 0.04 0.00 0.00
Ps90%/90% (+KTL) Biased 13.58 13.60 13.70 13.60 13.60
Ps90%/90% (-KTL) Biased 13.53 13.60 13.46 13.60 13.60
Specification MIN 12.0 11.5 11.5 11.5
Status (Measurements) All GND'd PASS PASS PASS PASS
Status (Measurements) Biased PASS PASS PASS PASS
Specification MAX
Status (Measurements) All GND'd
Status (Measurements) Biased
Status (-KTL) All GND'd PASS PASS PASS PASS
Status (+KTL) All GND'd
Status (-KTL) Biased PASS PASS PASS PASS
Status (+KTL) Biased

TID LDR RH1028MW W1117814 W5
P a g e 26 | 40 LINEAR TECHNOLOGY CORPORATION
Figure 5.11: Plot of Negative Output Swing Voltage VOUT with RL = 2KΩ versus Total Dose The average measured values of 10 samples pass the datasheet specification maximum limit.
-14
-13
-12
-11
0 20 40 60 80 100 120
- V
OU
T (
V)
@ +
/- 1
5V
; R
L =
2kΩ
Total Dose (Krad(Si))
Specification MAX
Ps90%/90% (+KTL) All GND'd
Ps90%/90% (+KTL) Biased
Average All GND'd
Average Biased
Ps90%/90% (-KTL) Biased
Ps90%/90% (-KTL) All GND'd

TID LDR RH1028MW W1117814 W5
P a g e 27 | 40 LINEAR TECHNOLOGY CORPORATION
Table 5.11: Raw data table for negative output voltage swing at RL = 2KΩ versus total dose including the statistical calculations, maximum specifications, and the status of the test (PASS/FAIL)
Parameter VOUT (-) @ +/- 15V; RL = 2kΩ
Units (V) 0 25 50 78 100
432 All GND'd Irradiation -13.90 -13.90 -13.90 -13.90 -13.90
433 All GND'd Irradiation -13.88 -13.90 -13.90 -13.90 -13.90
435 All GND'd Irradiation -13.90 -13.90 -13.90 -13.90 -13.90
436 All GND'd Irradiation -13.90 -13.90 -13.90 -13.90 -13.90
437 All GND'd Irradiation -13.88 -13.90 -13.90 -13.90 -13.90
451 Biased-Irradiation -13.90 -13.90 -13.90 -13.90 -13.90
452 Biased-Irradiation -13.88 -13.90 -13.90 -13.90 -13.90
453 Biased-Irradiation -13.89 -13.90 -13.90 -13.90 -13.90
454 Biased-Irradiation -13.89 -13.90 -13.90 -13.90 -13.90
455 Biased-Irradiation -13.89 -13.90 -13.90 -13.90 -13.90
438 Control Unit -13.89 -13.90 -13.90 -13.90 -13.90
439 Control Unit -13.90 -13.90 -13.90 -13.90 -13.90
All GND'd Irradiation Statistics
Average All GND'd -13.89 -13.90 -13.90 -13.90 -13.90
Std Dev All GND'd 0.01 0.00 0.00 0.00 0.00
Ps90%/90% (+KTL) All GND'd -13.87 -13.90 -13.90 -13.90 -13.90
Ps90%/90% (-KTL) All GND'd -13.92 -13.90 -13.90 -13.90 -13.90
Biased-Irradiation Statistics
Average Biased -13.89 -13.90 -13.90 -13.90 -13.90
Std Dev Biased 0.01 0.00 0.00 0.00 0.00
Ps90%/90% (+KTL) Biased -13.87 -13.90 -13.90 -13.90 -13.90
Ps90%/90% (-KTL) Biased -13.91 -13.90 -13.90 -13.90 -13.90
Specification MIN
Status (Measurements) All GND'd
Status (Measurements) Biased
Specification MAX -12.0 -11.5 -11.5 -11.5
Status (Measurements) All GND'd PASS PASS PASS PASS
Status (Measurements) Biased PASS PASS PASS PASS
Status (-KTL) All GND'd
Status (+KTL) All GND'd PASS PASS PASS PASS
Status (-KTL) Biased
Status (+KTL) Biased PASS PASS PASS PASS
Total Dose (Krad(Si)) @ 10 mrads(Si)/second

TID LDR RH1028MW W1117814 W5
P a g e 28 | 40 LINEAR TECHNOLOGY CORPORATION
Figure 5.12: Plot of Positive Output Swing Voltage VOUT with RL = 600Ω versus Total Dose The average measured values of 10 samples pass the datasheet specification minimum limit.
9
10
11
12
13
0 20 40 60 80 100 120
+ V
OU
T (
V)
@ +
/- 1
5V
; R
L =
600Ω
Total Dose (Krad(Si))
Ps90%/90% (+KTL) All GND'd
Ps90%/90% (+KTL) Biased
Average All GND'd
Average Biased
Ps90%/90% (-KTL) Biased
Ps90%/90% (-KTL) All GND'd
Specification MIN

TID LDR RH1028MW W1117814 W5
P a g e 29 | 40 LINEAR TECHNOLOGY CORPORATION
Table 5.12: Raw data table for positive output voltage swing at RL = 600Ω versus total dose including the statistical calculations, minimum specification, and the status of the test (PASS/FAIL)
Parameter VOUT (+) @ +/- 15V; RL = 600Ω Total Dose (Krad(Si)) @ 10 mrads(Si)/second
Units (V) 0 25 50 78 100
432 All GND'd Irradiation 12.08 12.10 12.10 12.10 12.10
433 All GND'd Irradiation 11.92 11.90 12.00 12.00 11.90
435 All GND'd Irradiation 12.04 12.10 12.10 12.10 12.00
436 All GND'd Irradiation 11.98 12.00 12.00 12.00 12.00
437 All GND'd Irradiation 11.95 12.00 12.00 12.00 12.00
451 Biased-Irradiation 11.98 12.00 12.00 12.10 12.00
452 Biased-Irradiation 11.89 11.90 11.90 12.00 11.90
453 Biased-Irradiation 11.99 12.00 12.00 12.10 12.00
454 Biased-Irradiation 11.98 12.00 12.00 12.00 12.00
455 Biased-Irradiation 11.93 11.90 11.90 12.00 11.90
438 Control Unit 11.98 12.00 12.00 12.00 12.10
439 Control Unit 12.04 12.10 12.10 12.10 12.10
All GND'd Irradiation Statistics
Average All GND'd 11.99 12.02 12.04 12.04 12.00
Std Dev All GND'd 0.06 0.08 0.05 0.05 0.07
Ps90%/90% (+KTL) All GND'd 12.17 12.25 12.19 12.19 12.19
Ps90%/90% (-KTL) All GND'd 11.82 11.79 11.89 11.89 11.81
Biased-Irradiation Statistics
Average Biased 11.96 11.96 11.96 12.04 11.96
Std Dev Biased 0.04 0.05 0.05 0.05 0.05
Ps90%/90% (+KTL) Biased 12.08 12.11 12.11 12.19 12.11
Ps90%/90% (-KTL) Biased 11.83 11.81 11.81 11.89 11.81
Specification MIN 10.5 10.0 10.0 10.0
Status (Measurements) All GND'd PASS PASS PASS PASS
Status (Measurements) Biased PASS PASS PASS PASS
Specification MAX
Status (Measurements) All GND'd
Status (Measurements) Biased
Status (-KTL) All GND'd PASS PASS PASS PASS
Status (+KTL) All GND'd
Status (-KTL) Biased PASS PASS PASS PASS
Status (+KTL) Biased

TID LDR RH1028MW W1117814 W5
P a g e 30 | 40 LINEAR TECHNOLOGY CORPORATION
Figure 5.13: Plot of Negative Output Swing Voltage VOUT with RL = 600Ω versus Total Dose The average measured values of 10 samples pass the datasheet specification maximum limit.
-13
-12
-11
-10
-9
0 20 40 60 80 100 120
-V
OU
T (
V)
@ +
/- 1
5V
; R
L =
600Ω
Total Dose (Krad(Si))
Specification MAX
Ps90%/90% (+KTL) All GND'd
Ps90%/90% (+KTL) Biased
Average All GND'd
Average Biased
Ps90%/90% (-KTL) Biased
Ps90%/90% (-KTL) All GND'd

TID LDR RH1028MW W1117814 W5
P a g e 31 | 40 LINEAR TECHNOLOGY CORPORATION
Table 5.13: Raw data table for negative output voltage swing at RL = 600Ω versus total dose including the statistical calculations, maximum specification, and the status of the test (PASS/FAIL)
Parameter VOUT (-) @ +/- 15V; RL = 600Ω Total Dose (Krad(Si)) @ 10 mrads(Si)/second
Units (V) 0 25 50 78 100
432 All GND'd Irradiation -12.39 -12.40 -12.40 -12.40 -12.30
433 All GND'd Irradiation -12.26 -12.20 -12.20 -12.20 -12.10
435 All GND'd Irradiation -12.36 -12.30 -12.30 -12.30 -12.30
436 All GND'd Irradiation -12.33 -12.30 -12.30 -12.30 -12.20
437 All GND'd Irradiation -12.25 -12.20 -12.20 -12.20 -12.10
451 Biased-Irradiation -12.30 -12.30 -12.30 -12.30 -12.20
452 Biased-Irradiation -12.24 -12.20 -12.20 -12.20 -12.10
453 Biased-Irradiation -12.33 -12.30 -12.30 -12.30 -12.30
454 Biased-Irradiation -12.28 -12.30 -12.20 -12.30 -12.20
455 Biased-Irradiation -12.24 -12.20 -12.20 -12.20 -12.10
438 Control Unit -12.32 -12.30 -12.40 -12.40 -12.40
439 Control Unit -12.36 -12.40 -12.50 -12.40 -12.40
All GND'd Irradiation Statistics
Average All GND'd -12.32 -12.28 -12.28 -12.28 -12.20
Std Dev All GND'd 0.06 0.08 0.08 0.08 0.10
Ps90%/90% (+KTL) All GND'd -12.15 -12.05 -12.05 -12.05 -11.93
Ps90%/90% (-KTL) All GND'd -12.49 -12.51 -12.51 -12.51 -12.47
Biased-Irradiation Statistics
Average Biased -12.28 -12.26 -12.24 -12.26 -12.18
Std Dev Biased 0.04 0.05 0.05 0.05 0.08
Ps90%/90% (+KTL) Biased -12.18 -12.11 -12.09 -12.11 -11.95
Ps90%/90% (-KTL) Biased -12.38 -12.41 -12.39 -12.41 -12.41
Specification MIN
Status (Measurements) All GND'd
Status (Measurements) Biased
Specification MAX -10.5 -10.0 -10.0 -10.0
Status (Measurements) All GND'd PASS PASS PASS PASS
Status (Measurements) Biased PASS PASS PASS PASS
Status (-KTL) All GND'd
Status (+KTL) All GND'd PASS PASS PASS PASS
Status (-KTL) Biased
Status (+KTL) Biased PASS PASS PASS PASS

TID LDR RH1028MW W1117814 W5
P a g e 32 | 40 LINEAR TECHNOLOGY CORPORATION
Appendix A
Picture of one among ten samples used in the test. The date code and related identification numbers should be correlated with the provided information in the second page of this report.
Figure A1: Top View showing date code
Figure A2: Bottom View showing serial number

TID LDR RH1028MW W1117814 W5
P a g e 33 | 40 LINEAR TECHNOLOGY CORPORATION
Appendix B
Radiation Bias Connection Tables
Table B1: Biased Conditions
Table B2: All GND’d
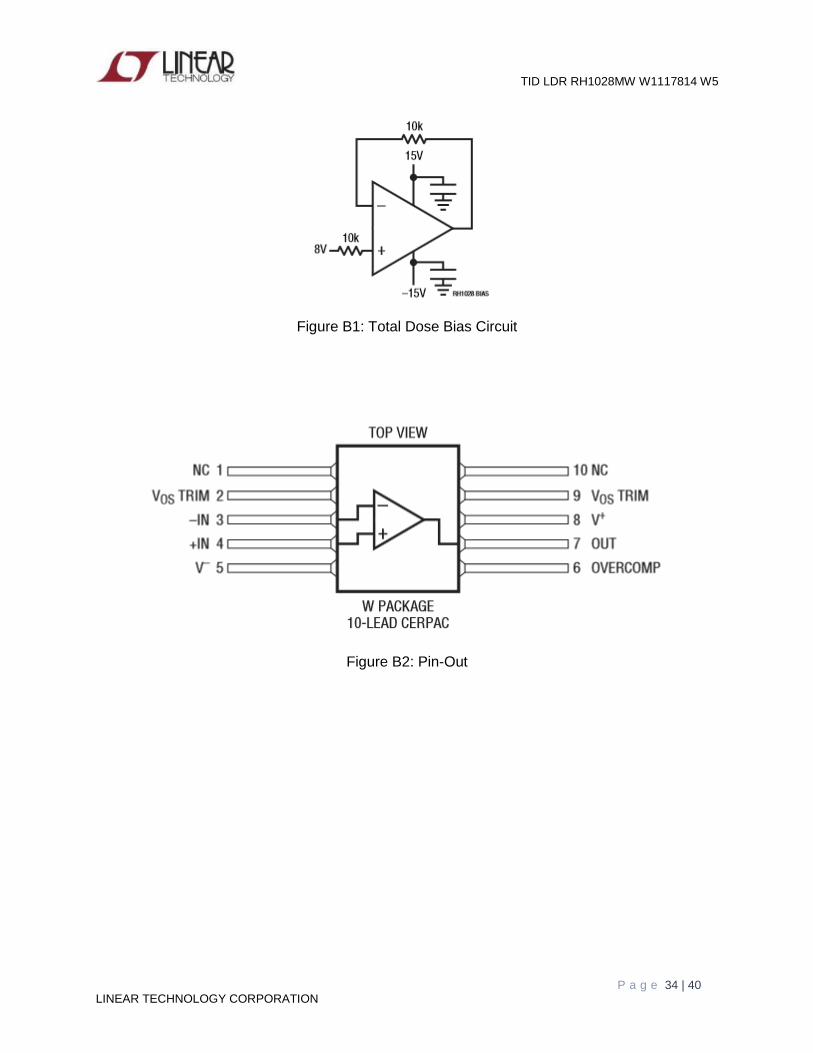
Pin Function Connection / Bias
1 NC NC
2 VOS TRIM NC
3 - IN To 10 KΩ resistor to pin 7
4 + IN To 10 KΩ resistor to +8V
5 V - To - 15V to bypass capacitor
6 Overcomp NC
7 VOUT To 10 KΩ resistor to pin 3
8 V + To + 15V to bypass capacitor
9 VOS TRIM NC
10 NC NC
Pin Function Connection / Bias
1 NC GND
2 VOS TRIM GND
3 - IN GND
4 + IN GND
5 V - GND
6 Overcomp GND
7 VOUT GND
8 V + GND
9 VOS TRIM GND
10 NC GND
TID LDR RH1028MW W1117814 W5
P a g e 34 | 40 LINEAR TECHNOLOGY CORPORATION
Figure B1: Total Dose Bias Circuit
Figure B2: Pin-Out

TID LDR RH1028MW W1117814 W5
P a g e 35 | 40 LINEAR TECHNOLOGY CORPORATION
Figure B3: Bias Board (top view)
Figure B4: Bias Board (bottom view)

TID LDR RH1028MW W1117814 W5
P a g e 36 | 40 LINEAR TECHNOLOGY CORPORATION
Appendix C

TID LDR RH1028MW W1117814 W5
P a g e 37 | 40 LINEAR TECHNOLOGY CORPORATION

TID LDR RH1028MW W1117814 W5
P a g e 38 | 40 LINEAR TECHNOLOGY CORPORATION

TID LDR RH1028MW W1117814 W5
P a g e 39 | 40 LINEAR TECHNOLOGY CORPORATION

TID LDR RH1028MW W1117814 W5
P a g e 40 | 40 LINEAR TECHNOLOGY CORPORATION
Appendix D
Table D1: Electrical Characteristics of Device-Under-Test
ParameterPre-irradiation
MIN MAX
10 Krad(Si)
MIN MAX
20 Krad(Si)
MIN MAX
50 Krad(Si)
MIN MAX
100 Krad(Si)
MIN MAX
200 Krad(Si)
MIN MAX
Units
Input Offset Voltage 80 100 120 140 160 180 uV
Input Offset Current 150 200 200 200 300 500 nA
+ Input Bias Current +/-400 +/-600 +/-700 +/-950 +/-1100 +/-1700 nA
- Input Bias Current +/-400 +/-600 +/-700 +/-950 +/-1100 +/-1700 nA
+ Slew Rate 11 7.5 7.5 7.5 7.5 7.5 V/uS
- Slew Rate 11 7.5 7.5 7.5 7.5 7.5 V/uS
CMRR 110 106 106 106 106 106 dB
PSRR 110 104 104 104 104 104 dB
AVOL (RL = 2 KΩ) 5 2 2 2 2 2 V/uV
VOUT (+) (RL = 2 KΩ) 12 11.5 11.5 11.5 11.5 11.5 V
VOUT (-) (RL = 2 KΩ) -12 -11.5 -11.5 -11.5 -11.5 -11.5 V
VOUT (+) (RL = 600 Ω) 10.5 10 10 10 10 10 V
VOUT (-) (RL = 600 Ω) -10.5 -10 -10 -10 -10 -10 V