total capital formation and saving, by type and sector ... · total capital formation and saving,...
TRANSCRIPT

This PDF is a selection from an out-of-print volume from the NationalBureau of Economic Research
Volume Title: The Formation and Stocks of Total Capital
Volume Author/Editor: John W. Kendrick
Volume Publisher: NBER
Volume ISBN: 0-87014-271-2
Volume URL: http://www.nber.org/books/kend76-1
Publication Date: 1976
Chapter Title: Total Capital Formation and Saving, by Type and Sector,Relative to Income and Product
Chapter Author: John W. Kendrick
Chapter URL: http://www.nber.org/chapters/c3806
Chapter pages in book: (p. 65 - 93)

3Total Capital Formation and Saving,by Type and Sector, Relative toIncome and Product
Although unequal at the sector level, saving and investment are equalat the national level. Note, therefore, that our description of the move-ments of total investment in relation to (adjusted) GNP in the initialsection applies equally to saving. In the sector discussions, of course,investment and saving are treated separately.
Trends in Total Gross and NetI nvestment
Between 1929 and 1969 growth rates in total investment were higherthan those in national product according to all four measures shown inTable 3-1. In current dollars, both gross and net total investmentmeasures showed much the same growth rates as GNP and NNP,respectively, from 1929 to 1948 and then accelerated relativelybetween 1948 and 1969. In constant prices, both investment measuresgrew somewhat less rapidly than the corresponding product measuresover the 1929—1948 period due to relative increases in the investmentprice deflators, but from 1948 to 1969 the real investment measures alsoshowed distinctly higher growth rates than the real product measures.
The results of the relative trends in investment and product in65

Tab
le 3
-1.
Tot
al in
vest
men
t and
Pro
duct
(bi
llion
s of
cur
rent
and
195
8 do
llars
and
ave
rage
annu
al p
erce
ntag
e ra
tes
of c
hang
e)
Li n
e N
o.19
2919
4819
69
A. B
illio
ns o
f D
olla
rs
1. 2.
Cur
rent
dol
lars
Gro
ss N
atio
nal P
rodu
ct12
7.3
327.
7T
otal
gro
ssin
vest
men
t55
.714
1.8
1,24
7.9
617.
1
3. 4.N
et N
atio
nal P
rodu
ct92
.323
6.4
Tot
al n
et in
vest
men
t20
.650
.589
7.6
266.
8
5. 6.
Con
stan
t (19
58)
dolla
rsR
eal G
ross
Nat
iona
l Pro
duct
252.
442
0.6
Rea
l gro
ss in
vest
men
t11
9.0
957.
247
4.7
7. 8.R
eal N
et N
atio
nal P
rodu
ct17
7.2
297.
6R
eal n
et in
vest
men
t43
.962
.768
0.6
198.
1
B. A
vera
ge A
nnua
l Per
cent
age
Rat
es o
f C
hang
e
1929
—69
1929
—48
1948
—69
1. 2.
Cur
rent
dol
lars
Cro
ss N
atio
nal P
rodu
ct5.
95.
1T
otal
gro
ss in
vest
men
t6.
25.
06.
67.
3
3. 4.N
et N
atio
nal P
rodu
ct5.
95.
1T
otal
net
inve
stm
ent
6.6
4.8
6.6
8.2
5. 6.
Con
stan
t (19
58)
dolla
rsR
eal G
ross
Nat
iona
l Pro
duct
3.4
2.7
Rea
l gro
ss in
vest
men
t3.
52.
44.
04.
6
7. 8.R
eal N
et N
atio
nal P
rodu
ct3.
42.
8R
eal n
et in
vest
men
t3.
81.
94.
05.
6

CAPITAL FORMATION AND SAVING-AND INCOME AND PRODUCT 67
Table 3-2. Total In vestment as Percentage of National Product
Line No. 1929 1948 1969
Current dollars
1. Total gross investment/GNP 43.7 43.3 49.5
2. Total net investmentiNNP
Constant dollars
22.3 21.4 29.7
3. Total gross investmentlGNP 47.2 44.1 49.6
4. Total net investmentlNNP 24.8 21.1 29.1
terms of the percentages of national product saved and invested,according to our definitions, are shown in Table 3-2. Two major conclu-sions emerge from studying that table. The first is the high proportion ofadjusted GNP devoted to gross saving and investment reached by 1969.In that year almost half of GNP represented total investment (accordingto our definition), compared with a less than 15 per cent ratio of grossprivate domestic (tangible) plus net foreign investment to GNP (accord-ing to official Commerce Department definitions and estimates).
The second major finding is the significant increase in the share oftotal investment in adjusted GNP—from around 43 per cent in both1929 and 1948 to 49.5 per cent in 1969. This contrasts with somedecline in the ratio of gross private domestic pius net foreign invest-ment to GNP as conventionally defined—from 16.5 per cent in 1929and 18.6 per cent in 1948 to 14.2 per cent in 1969.
The increase of net saving and investment in relation to adjustedNNP is even more pronounced—from a bit over and under 21 per centin 1929 and 1948, respectively, to almost 30 per cent in 1969 (see Chart3-1). Actually, the growth of capital consumption allowances closelyparallels the growth of CNP. As a fraction of GNP, NNP remainedrelatively stable, at 72.5 per cent in 1929 and approximately 72.0 percent in both 1948 and 1969. But since gross investment was growingfaster than CNP after 1948, the ratio of capital consumption allowancesto gross investment fell, and the ratio of net to gross investment rose—from 36 per cent in 1948 to 43 per cent in 1969. The drop in the capitalconsumption-gross investment ratio occurred entirely in the intangi-bles, reflecting their more rapid growth and the time lags betweeninvestment and the beginning of depreciation following maturation ofthe capital, particularly in the education category. The ratio of capitalconsumption to gross intangible investment also fell somewhat

between 1929 and 1948, but this was more than counterbalanced by arise in the ratio for tangibles, which subsequently stabilized.
The net increase in the ratio of saving (investment) to nationalproduct between 1929 and 1969 is considerably reduced when bothvariables are expressed in terms of constant 1958 dollars. The relativeincrease is almost as great, however, in constant as in current dollarsfrom 1948 to 1969. This reflects a significantly greater increase in theimplicit price deflator for total investment than in the deflator fornational product, particularly between 1937 and 1948. The ratio of theformer to the latter (on a gross basis) rose from 92.7 per cent in both1929 and 1937 to 98.1 per cent in 1948, and after 1955 stayed within±0.5 per cent of 100.0.
68 THE FORMATION AND STOCKS OF TOTAL CAPITAL
Chart 3-i. Cross and Net Investment-Product Ratios Based on Current Dollars,1 929—1969
ROt jOS
.6
.5
.4
.3
.2
.1
0
-.21929 '34 '39 '44 '49 '54 '59 '64 '69

CAPITAL FORMATION AND SAVING-AND INCOME AND PRODUCT 69
Reflecting the divergent movement of the deflators, the ratio oftotal real gross investment to real GNP dropped from 47.2 per cent in1929 to 44.1 per cent in 1948, and thereafter climbed to 49.6 per cent in1969. Although the net increase in the ratio to 1969 was about 5 per centof the 1929 base, this was much less than in current prices. The ratio oftotal net investment to real NNP dropped from 24.8 per cent in 1929 to21.1 per cent in 1948, and then rose sharply to 29.1 per cent in 1969. Asin the case of current dollars, the increase in the real net ratio wasconsiderably greater than in the real gross ratio between 1929 and 1969,but again relatively smaller in constant than in current dollars. From1948 to 1969, however, the relative increases in both gross and netratios were almost as great in constant as in current dollars because by1948 the divergence between the investment and product deflators hadnarrowed greatly.
A word of caution is in order regarding the constant dollar results.As noted in the appendixes, the price deflators for investment are ofuncertain quality.1 Many of the component price indexes, particularlyfor intangible investment, are basically unit cost indexes which do notreflect productivity increases. Productivity may not have risen much incertain investment activities, such as education, but to the extent that ithas, the deflators would tend to have an upward bias. This, in turn,would impart some downward bias to the trend in the real investment-to-product ratios. For this reason, more weight should be given to thecurrent dollar estimates in evaluating the relative movements of totalinvestment.
In summary, all the available measures point to a significantincrease in the fraction of national income and product that was savedand invested between 1929 and 1969, particularly after 1948, wheninvestment is defined broadly as including intangible as well as tangi-ble investments in all sectors. The increase is most pronounced in whatis probably the most significant measure—..-total net investment as afraction of NNP, in current dollars—assuming reasonable depreciationestimates. The increase is smallest in what is, in our judgment, the leastsignificant measure—total real gross investment as a fraction of realCNP. But even the latter measure shows a small net increase from 1929to 1969, and a significant rise in the 1948—1969 period.
These estimates suggest that as per capita real income and wealthincrease, the fraction of income saved and devoted to the total invest-ment tends to rise. Keynes had theorized that the saving ratio mighttend to rise in advanced countries, but the statistics did not show this in
1. This view is documented in a study now in progress by RobertJ, Cordon for theNational Bureau, tentatively entitled "The Measurement of Durable Goods Prices."

70 THE FORMATION AND STOCKS OF TOTAL CAPITAL
terms of his narrow definition of investment (consisting largely ofbusiness tangibles).2 But the broadening of the investment definitionproduces estimates that seem to support his hunch. Certainly, as percapita income grows, individuals and the community can afford to savea larger fraction of additional income than the average proportion ofincome saved in the past, and apparently they have done so in theUnited States, at least since World War II.
Formulation of a general, dynamic "law" in respect to saving andinvestment behavior must, however, await further studies of the econ-omy of the United States and other countries. With regard to the UnitedStates, it is probable that the ratio of total investment to income andproduct was rising for several decades prior to 1929, since availablestatistics show a marked rise in the intangible investment ratio and littlechange for the tangible investment ratio.3 Also, the stability or declineof the total investment ratio between 1929 and the post-World War IIperiod can be attributed to the effects of the Great Depression and thewar, with the subsequent rise representing a "catching-up" andresumption of the longer-run trend. But frirther work is needed beftreconfident generalizations can be made.
Trends in Total Investments, by Type
First we look at total gross investment in current dollars, by major type(see Table 3-3), and then indicate generally any difference in patternsof movement in net investment or in the constant dollar series. Themajor conclusion that emerges is that all of the relative increase in totalinvestment over 1929—1969 has been due to a sharp increase in theproportion of GNP devoted to intangible investment, particularly after1948 (see Chart 3-2). The tangible investment share sagged a bit, andthe ratio of gross intangible to tangible investment rose from about 40per cent in 1929 to over 75 per cent in 1969. In fact, total intangibleinvestment in 1969, at $268 billion, was almost as large as tangiblenonhuman investment, at $286 billion.
2. The narrow definition of investment is useful for business cycle analysis, ofcourse; a much higher percentage of business tangible investment is financed throughfinancial intermediaries than in the case of nonbusiness and intangible investments.
3. My earlier study presented figures showing that intangible investments (R&D,education, and health) tripled between 1909 and 1929 when GNP had less thandoubled. See my Productivity Trends in the United States, Princeton, PrincetonUniversity Press for NBER, 1961, Table 21, p. 105; Table 24, p. 109; and Table A-JIb,pp. 296—297.

Tab
le 3
-3.
Tot
al C
ross
and
Net
Inve
stm
ent,
by T
ype
(Cur
rent
Pric
es),
as
Per
cent
ages
of N
atia
nat P
rodu
ct
TO
TA
L G
RO
SST
OT
AL
NE
T
Lin
e N
o.
INV
EST
ME
NT
/GN
PIN
VE
STM
EN
T/N
NP
1929
1948
1969
1929
1948
1969
1.D
omes
tic in
vest
men
t43
.142
.749
.521
.520
.629
.8
2.T
angi
ble
30.8
29.0
28.1
14.9
12.5
13.8
3.H
uman
7.7
5.6
5.1
5.1
3.6
4.8
4. 5.N
onhu
man
Stru
ctur
es23
.123
.49.
08.
522
.9 7.6
9.9
4.8
8.9
5.0
9.1
3.8
6.E
quip
men
t12
.113
.414
.32.
31.
83.
97.
•In
vent
ory
2.0
1.5
1.0
2.7
2.1
1.3
8.In
tang
ible
12.3
13.7
21.5
6.6
8.1
16.0
9.H
uman
12.1
13.0
19.4
6.5
7.6
15.2
10.
Edu
catio
n an
d tr
aini
ng8.
69.
415
.46.
26.
413
.611
.H
ealth
1.5
1.6
2.2
.7.9
1.1
12.
Mob
ility
2.0
2.0
1.7
—.5
.2.5
13.
Non
hum
an.2
.72.
1.1
.5.8
14.
Bas
ic r
esea
rch
.03
.1.3
0.1
.415
.A
pplie
d R
& D
.17
.71.
8.1
.4.4
16.
Net
for
eign
inve
stm
ent
.6.6
— .1
..8
.8.1
17.
Tot
al in
vest
men
t43
.743
.349
.422
.321
.429
.7
-&
72 THE FORMATION AND STOCKS OF TOTAL CAPITAL
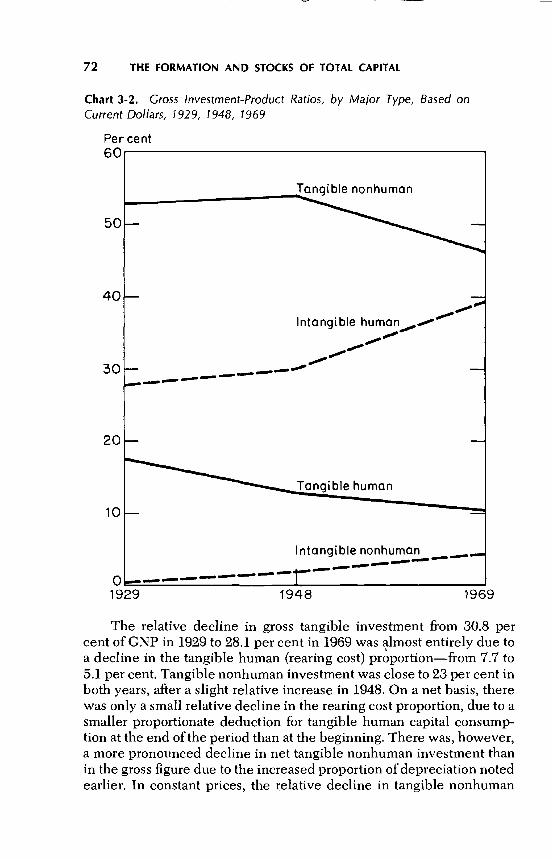
Chart 3-2. Gross Investment-ProductCurrent Dollars, 1929, 1948, 1969
50
40
30
20
10
1929
Ratios, by Major Type, Based on
1948 1969
The relative decline in gross tangible investment from 30.8 percent of GNP in 1929 to 28.1 per cent in 1969 was almost entirely due toa decline in the tangible human (rearing cost) proportion—from 7.7 to5.1 per cent. Tangible nonhuman investment was close to 23 per cent inboth years, after a slight relative increase in 1948. On a net basis, therewas only a small relative decline in the rearing cost proportion, due to asmaller proportionate deduction for tangible human capital consump-tion at the end of the period than at the beginning. There was, however,a more pronounced decline in net tangible nonhuman investment thanin the gross figure due to the increased proportion of depreciation notedearlier. In constant prices, the relative decline in tangible nonhuman
Per cent60
human
Intangible— —
— —— — —
Tangible human
0 — — —
Intangible nonhuman — —— — — — — —

CAPITAL FORMATION AND SAVING-AND INCOME AND PRODUCT 73
investment is a bit larger than in current prices. But for real humaninvestment, the relative drop becomes smaller on a gross basis and istransformed into an increase on a net basis. This is so because thedeflator for rearing costs, which comprise the goods and services con-sumed by children, rises less than the deflators for other types ofinvestment.
Within the tangible nonhuman category, investments in structuresand inventories show a relative decline, particularly in constant prices,while equipment and other durable goods outlays show a relativeincrease.
Intangible investment shows a greater rise on a net than on a grossbasis because of the declining depreciation ratio, as explained above.The relative increases in intangible investments on both gross and netbases are distinctly smaller in constant dollars than in current pricesdue to the significantly higher rate of increase in the intangible defla-tors than in the implicit price index for total national product. But evenin constant dollars, the relative expansion in intangible investment ismarked.
Among the various types of intangible investment, by far the mostimportant category is education and training, which comprised overtwo-thirds of the total on a gross basis and over 90 per cent on a netbasis in 1929 and a bit less in 1969. The net proportion is higherbecause the average life of educational investment is much longer thanthat of other types of intangibles except health. The ratio of educationaland training investment to GNP increased by almost 80 per cent on agross basis, and more than doubled on a net basis.
The largest proportionate increase (twentyfold on a gross basisfrom 1929 to 1969) occurred in R&D, although even in 1969 the R&Dshare of intangible investment was only 10 per cent on a gross basis and5 per cent on a net basis. The ratio to GNP of investments in health andsafety increased by about 50 per cent over the period, and by 1969comprised about 10 per cent of total intangibles, too.
Mobility outlays, on a gross basis, were the only form of intangiblesto show a decline in the ratio to GNP. This came about becausemobility outlays are related to the size of the labor force, and the latterexperienced significantly less growth than real GNP. It will be notedthat in some years net mobility investment is negative due to the veryshort lives of some of the categories of mobility, such as job search,reflecting high rates of labor turnover. Thus, in some years gross mobil-ity costs were less than the amortization of previous years' mobilityinvestment.
Net foreign investment is a relatively minor category throughout.Its movements are erratic and exhibit no definite trend.
Changes in the percentage distributions of total investment result-

Tab
le 3
-4.
Perc
enta
ge D
istr
ibut
ion
of T
otal
Gro
ss a
nd N
et In
vest
men
t, by
Typ
e
TO
TA
L G
RO
SST
OT
AL
NE
T
Lin
e N
o.
INV
EST
ME
NT
INV
EST
ME
NT
1929
1969
1929
1969
1.D
omes
tic in
vest
men
t98
.610
0.1
96.3
100.
3
2.T
angi
ble
70.4
56.8
66.7
46.5
3.H
uman
17.5
10.4
22.6
16.0
4.N
onhu
man
52.9
46.4
44.1
30.5
5.St
ruct
ures
20.6
15.5
21.5
12.9
6.E
quip
men
t27
.829
.010
.413
.17.
Inve
ntor
y4.
51.
912
.34.
5
8.In
tang
ible
28.2
43.4
29.5
53.9
9.H
uman
27.7
39.2
29.0
51.1
10.
Edu
catio
n an
d tr
aini
ng19
.831
.227
.845
.811
.H
ealth
3.4
4.5
3.3
3.8
12.
Mob
ility
4.5
3.5
—2.
11.
613
.N
onhu
man
.54.
2.6
2.7
14.
Bas
ic r
esea
rch
.1.6
.21.
415
.A
pplie
d R
& D
.43.
6.4
1.3
16.
Net
for
eign
inve
stm
ent
1.4
—.1
3.7
—.3
17.
Tot
al in
vest
men
t10
0.0
100.
010
0.0
100.
0

CAPITAL FORMATION AND SAVING-AND INCOME AND PRODUCT 75
ing from the relative trends discussed above are summarized in Table3-4. Here items whose share of national product remained relativelyconstant, such as tangible nonhuman investment, show a decline as apercentage of total investment, which rose in relation to product. Evenin terms of per cent distributions of total investment, all the intangiblecategories, except mobility, rose significantly over the forty years.
Subperiod and Recession Behavior ofTotal Investment
SUBPERIODS
In Table 3-5, we divide the forty-year period 1929—1969 into sixsubperiods bounded by the seven business-cycle peak years (omitting1954). Looking at the overall investment-to-product percentages (Part Aof the table), we see that all measures show much the same patterns, butin varying degrees. The investment ratios all declined sharply between1929 and 1937, which is not surprising in view of the fact that theeconomy was still substantially below full employment even at thepeak of the 1933—1937 expansion.
Between 1937 and the full recovery of 1948, the current dollarratios rose markedly, and in 1948 were less than one percentage pointbelow the 1929 percentages. The recovery in the constant dollar ratioswas much weaker, with the 1948 percentages still below1929. This reflected the relative increase in th&investment deflatorduring the 1937—1948 subperiod, as noted earlier.
The largest proportionate increase in all the investment ratios camein the 1948—1953 subperiod. By 1953, all ratios significantly exceededthose of 1929 except total gross investment in constant dollars, whichrepresented approximately the same percentage of real GNP as in 1929.
From 1953 to 1957, the gross investment ratios rose further, but thenet ratios receded somewhat as capital consumption allowances grewfaster than gross investment. Between 1957 and 1960, all the ratiosreceded. It will be remembered that the 1955—1960 period was one ofrelatively slow growth, reflected in the rising unemployment ratesbetween peak years. The slower growth in investment than in productwas a significant aspect of this period. Retardations in growth of grossinvestment are generally accentuated in the net investment measures.
In the subperiod of strong growth, 1960—1969, total investment

Tab
le 3
-5.
Tot
al In
vest
men
t as
Per
cent
age
of N
atio
nal P
rodu
ct, i
n P
eak
Yea
rs
Lin
e N
o.19
2919
3719
4819
5319
5719
6019
69
A. T
otal
Gro
ss a
nd N
et I
nves
tmen
t in
Cur
rent
and
Con
stan
t Dol
lars
(bill
ions
)
Tot
al g
ross
inve
stm
entlG
NP
1.C
urre
nt d
olla
rs40
.643
.346
.648
.247
.849
.52.
Con
stan
t (19
58)
dolla
rs47
.243
.744
.147
.048
.047
.849
.6
Tot
al n
et in
vest
men
tlNN
P.
3.C
urre
nt d
olla
rs22
.317
.421
.425
.825
.424
.929
.74.
Con
stan
t (19
58)
dolla
rs24
.819
.221
.126
.125
.324
.929
.1
B. T
otal
Gro
ss I
nves
tmen
tin
Cur
rent
Dol
lais
, by
Typ
e
1.G
ross
dom
estic
inve
stm
ent
43.1
40.5
42.7
47.1
47.6
47.5
49.5
2.T
angi
ble
30.8
27.6
29.0
32.4
31.3
30.0
28.1
3.H
uman
7.7
6.0
5.6
5.7
6.1
6.2
5.1
4.N
onhu
man
23.1
21.6
23.4
26.7
25.3
23.8
22.9
5.St
ruct
ures
9.0
7.0
8.5
9.1
9.2
8.7
7.6
6.E
quip
men
t12
.111
.513
.416
.415
.514
.114
.37.
Inve
ntor
y2.
03.
11.
51.
2.5
1.0
1.0
8.In
tang
ible
12.3
12.9
13.7
14.6
16.2
17.5
21.5
9.H
uman
12.1
12.6
13.0
13.5
14.4
15.4
19.4
10.
Edu
catio
n an
d tr
aini
ng8.
68.
79.
410
.010
.711
.515
.411
.H
ealth
1.5
1.6
1.6
1.7
1.9
2.0
2.2
12.
Mob
ility
2.0
2.2
2.0
1.9
1.8
1.9
1.7
13.
Non
hum
an.2
.3.7
1.2
1.8
2.1
2.1
14.
Bas
ic r
esea
rch
.03
.1.1
.1.2
.2.3
15.
App
lied
R &
D.1
7.3
.71.
11.
61.
91.
8
16.
Net
for
eign
inve
stm
ent
.6.1
.6—
.5.6
.3—
.1

-w
CAPITAL FORMATION AND SAVING-AND INCOME AND PRODUCT 77
once again grew significantly faster than national product. The increasein the investment ratios was particularly marked on the net basis ascapital consumption increased less rapidly than gross investment.
The overall subperiod movements just summarized reflect the neteffect of divergent changes in the investment components. Part B ofTable 3-5, showing the gross investment to GNP ratios for the peakyears, is the focus of our discussion, which will touch upon significantdivergences in the movements of the other measures.
Our most important conclusion is that the occasional downwardmovements in the total investment ratios during the subperiods werecaused chiefly by declines in the tangible investment ratios. The totalgross intangible investment ratio was in a steady uptrend across all thepeak years, whether measured in current or constant prices. Both netintangible investment ratios did drop between 1929 and 1937, and theconstant dollar net real intangible investment ratio eased slightlybetween 1948 and 1953. But the general picture is one of strong growthin the total intangible investment ratios, with most of the subperioddeclines in the total investment ratios resulting from declines in thetangible investment ratio during subperiods of retarded growth.
The gross tangible human investment ratios dropped from 1929through 1937 and 1948, reflecting the relatively low birth rates thatprevailed until the early postwar period. By contrast, the relatively highbirth rates that followed and characterized most of the 1950s werereflected in rising ratios from 1948 through 1960. The trend was re-versed again: the 1969 ratio was below that of 1960 as a result of thedeclining birth rates of the late 1950s and the 1960s. The net ratiosfollowed the same patterns, except that 1948 was already higher than1937.
Tangible nonhuman investment fell proportionately more thannational product from 1929 to 1937 according to all four measures. Thegross current dollar ratio showed recovery between 1937 and 1948, butthe constant dollar measure dropped a bit further, and both net mea-sures showed more pronounced declines. Between 1948 and 1953 theratios for all four measures rose markedly. Thereafter, the ratio of grossnonhuman investment to GNP in current dollars sagged in each suc-ceeding peak year, although in real terms there was a mild reversal inthe 1960—1969 period. The net ratios showed an even more pro-nounced decline than the gross ratio in 1953—1957 and 1957—1960.Finally, between 1960 and 1969 both showed a rise.
As to intangible investments, on a gross current dollar basis alltypes except mobility showed rising (or, occasionally, stable) ratios overall subperiods. On a constant dollar basis, the human intangible ratiosto real GNP showed small decreases between 1948 and 1953—the

78 THE FORMATION AND STOCKS OF TOTAL CAPITAL
subperiod during which the tangible ratios were rising sharply. Therewere also minor declines in the 1960—1969 period in medical and R&Doutlays, while the real education ratio was still rising substantially.
The net intangible investment ratios were more sensitive. Thus,for most of the types, in both current and constant dollars, they droppedbetween 1929 and 1937. There were also declines in the constant dollarhuman intangible ratios from 1948 to 1953. And in both current andconstant dollars, the net R&D ratio dropped between 1960 and 1969(most of the decline occurring in the latter part of the subperiod).
RECESSIONS
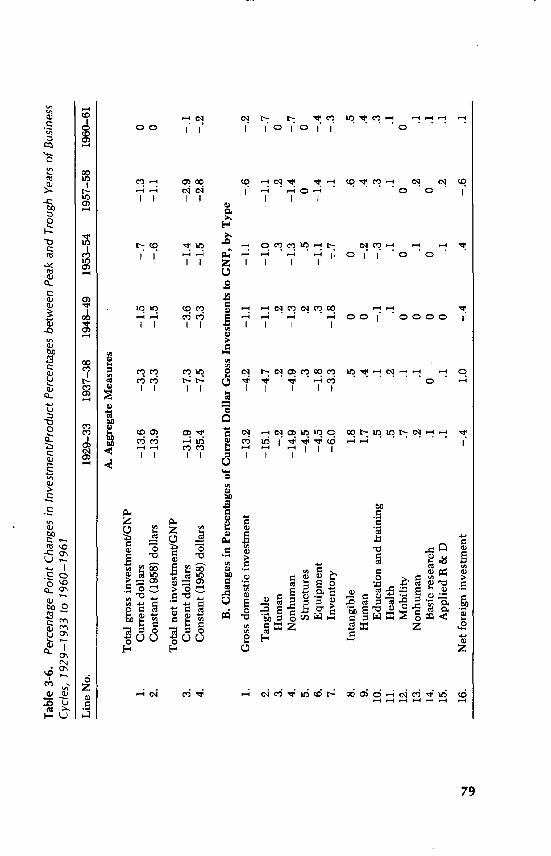
Even on a total investment basis (including intangibles), invest-ment declined more than product between the peak and trough years ofthe business cycles during the 1929—1969 period, with the exception ofthe 1960—1961 contraction, when the investment ratios were virtuallyunchanged. There was a marked contrast between the 1930s and thepost-World War II years, as shown in Table 3-6. Total investment felldrastically relative to national product between 1929 and 1933, andsubstantially (though much more moderately) during 1937— 1938. Since1948, however, recession declines in the investment ratios have beensmall.
Downturns in the net investment ratios from peaks to troughs havebeen significantly greater than those in the gross investment ratios.This is to be expected, since capital consumption allowances in reces-sions continue to grow at rates near those of expansion periods whilegross investment either drops or is much retarded in growth. Thechanges in the ratios are much the same in current and constant dollars,since the time periods involved are too short to permit much diver-gence between price deflators for investment and for national product.
From a look at the gross investment ratios by type (Part B of Table3-6), it is apparent that the declines in the total investment ratiobetween peak and trough years have been entirely due to declines intangible nonhuman investment relative to national product. Rearingcost ratios have risen in recessions (except from 1929 to 1933) concomi-tantly with the growing number of children. All of the intangibleinvestment ratios have also gone up or remained stable in recessions,reflecting their strong secular growth or their countercyclical tenden-cies, as in the case of mobility costs. On a net basis, the intangibleinvestment ratios generally dropped somewhat in the contractions ofthe 1930s and the first two postwar contractions, but proportionatelymuch less than the net tangible nonhuman investment ratios. In the last
Tab
le 3
-6.
Per
cent
age
Poi
nt C
hang
es in
Inve
stm
ent/P
rodu
ct P
erce
ntag
es b
etw
een
Pea
k an
d T
roug
h Y
ears
of B
usin
ess
Cyc
les,
192
9—19
33 to
196
0—19
61
Lin
e N
o.19
29—
3319
37—
3819
48—
4919
53—
5419
57—
5819
60—
61
A. A
ggre
gate
Mea
sure
s
Tot
al g
ross
inve
stm
ent/G
NP
1.C
urre
nt d
olla
rs—
13.6
—3.
3—
1.5
—.7
—1.
30
2.C
onst
ant (
1958
) do
llars
—13
.9—
3.3
—1.
5—
.6—
1.1
0
Tot
al n
et in
vest
men
tiGN
P3.
Cur
rent
dol
lars
—31
.9—
7.3
—3.
6—
1.4
—2.
9—
.14.
Con
stan
t (19
58)
dolla
rs—
35.4
—7.
5—
3.3
—1.
5—
2.8
—.2
B. C
hang
es in
Per
cent
ages
of C
urre
nt D
olla
r G
ross
Inv
estm
ents
toG
NP,
by
Typ
e
1.G
ross
dom
estic
inve
stm
ent
—13
.2—
4.2
—1.
1—
1.1
—.6
—.2
2.T
angi
ble
—15
.1—
4.7
—1.
1—
1.0
—1.
1—
.7
3.H
uman
— .2
.2.2
.3.2
04.
Non
hum
an—
14.9
—4.
9—
1.3
—1.
3—
1.4
—.7
5.St
ruct
ures
—4.
5.3
.2.5
00
6.E
quip
men
t—
4.5
—1.
8.3
—1.
1—
1.4
—.4
7.In
vent
ory
—6.
0—
3.3
—1.
8--
.7.1
—.3
8.In
tang
ible
1.8
.50
0.6
.59.
Hum
an1.
7.4
0—
.2.4
.410
.E
duca
tion
and
trai
ning
.5.1
—.1
— .3
.3.3
11.
Hea
lth.5
.2.1
.1.1
.112
.M
obili
ty.7
.10
00
013
.N
onhu
man
.2.1
0.1
.2.1
14.
Bas
ic r
esea
rch
.10
00
0.1
15.
App
lied
R &
D.1
.10
.1.2
.1
16.
Net
for
eign
inve
stm
ent
—.4
1.0
—.4
.4—
.6.1
80 THE FORMATION AND STOCKS OF TOTAL CAPITAL
two recessions covered—1957—1958 and 1960—1961—the net intangi-ble investment ratio and most if its components rose slightly.
One may conclude that intangible investments and tangible humaninvestment outlays are much less cyclical than tangible nonhumaninvestment. They account for the much smaller recession declines inthe ratio of total investment to product than in the tangible nonhumaninvestment ratios alone. In fact, the human and intangible investmentoutlays play a countercyclical role by helping to cushion recessions on agross outlay basis, which is what is relevant in cycle analysis.
Trends in Total Investment, by Sector
An examination of the investment trends by sector over the long periodand the subperiods reveals that it was the government sector thataccounted for all of the growth relative to national product on a grossbasis, and for most of it on a net basis. (See Table 3-7.) Looking at thetotal gross investment ratios of the end-years 1929 and 1969, one sees aslight rise in total gross investment of the personal sector, a slight dropin the business sector, and a jump in the government sector—from 4.6to 11.3 per cent, in current dollars—that slightly exceeds the 6.5 per-centage point increase in the total gross domestic investment ratio.
In constant dollars, the pattern is only moderately different. Thereal total gross personal investment ratio rises a bit more than in currentdollars, chiefly because of the less than average increase in the deflatorfor rearing costs (which cover consumer products). Contrariwise, thetotal real gross business investment ratio falls more than in currentdollars, and the government investment ratio rises less. Still, the rise inthe government ratio exceeds the lesser increase in the real total grossdomestic investment ratio by a wider margin than in the current dollarcase.
The patterns of the total net domestic investment ratios in the tablereveal an important difference. In constant dollars, and even more so incurrent prices, substantial increases in the total net personal investmentratio as well as in the government ratio contribute significantly to therise in the total ratio—which is notably larger on a net basis than on agross basis. In the government sector, the increases in the net invest-ment ratios are about the same as those in the gross ratios, although thenet ratios are larger relative to the gross ratios than in the privatesectors. In the business sector, net investment ratios fall more thangross ratios, while in the personal sector they rise more than the

Tab
le 3
-7.
Tot
al In
vest
men
t, by
Dom
estic
Sec
tor,
as
Per
cent
age
of N
atio
nal P
rodu
ct, G
ross
and
Net
, in
Cur
rent
and
Con
stan
t Dol
lars
Lin
e N
o.19
2919
3719
4819
5319
5719
6019
69
Gro
ss d
omes
tic in
vest
men
tlGN
P1.
Cur
rent
dol
lars
, tot
al43
.140
.542
.747
.147
.547
.549
.62.
Pers
onal
26.1
22.3
24.8
24.9
25.5
25.8
26.5
3.B
usin
ess
12.4
11.5
12.6
10.6
11.1
10.8
11.8
4.G
over
nmen
t4.
66.
75.
311
.610
.910
.911
.3
5.C
onst
ant d
olla
rs, t
otal
46.4
43.6
43.6
47.4
47.4
47.6
49.6
6.Pe
rson
al26
.023
.024
.524
.325
.525
.927
.17.
Bus
ines
s14
.512
.313
.311
.011
.010
.812
.18.
Gov
ernm
ent
5.9
8.3
5.8
12.1
10.9
10.9
10.4
Tot
al n
et in
vest
men
t/NN
P9.
Cur
rent
dol
lars
, tot
al21
.517
.420
.626
.524
.624
.629
.910
.Pe
rson
al9.
74.
011
.310
.19.
710
.112
.811
.B
usin
ess
7.3
6.6
9.2
5.5
5.3
4.8
5.8
12.
Gov
ernm
ent
4.5
6.8
.1•
10.9
9.6
9.7
11.3
13.
Con
stan
t dol
lars
, tot
al23
.919
.120
.226
.724
.424
.529
.214
.Pe
rson
al9.
43.
710
.99.
59.
610
.213
.215
.B
usin
ess
8.5
6.6
9.5
5.7
5.2
4.8
5.9
16.
Gov
ernm
ent
6.0
8.8
— .2
11.5
9.6
9.5
10.1
-I

82 THE FORMATION AND STOCKS OF TOTAL CAPITAL
corresponding gross ratios because of the relative decline in capitalconsumption allowances (due to the greater importance of intangiblesin the personal sector). The similar relative movements of governmentinvestment, both gross and net, suggest that the proportions of tangibleand intangible investments were similar to those in total domesticinvestment.
It is evident from the subperiod estimates shown in Table 3-7 thatthe trends in the ratio were not linear. Turning first to the grossinvestment sector of general government, note that there was already asignificant increase in its investment ratio by 1937, reflecting expandedNew Deal public works programs in the context of a slack overalleconomy. The ratio receded somewhat in 1948, when the economy wasfully employed. Between 1948 and 1953, given the impetus of theKorean engagement, the government total gross investment ratio morethan doubled, whether measured in current or constant dollars. Theratio was somewhat lower in both 1957 and 1960 than in 1953. By 1969it rose a bit in current dollars, but dropped somewhat in constantdollars.
The general pattern for government is much the same in terms ofthe net investment-product ratios, except that the ratio fell almost tozero in 1948, reflecting high capital consumption allowances on the stilllarge (but declining) stock of military capital goods coupled withreduced new gross investment. Also, in net terms both the current andconstant dollar ratios rose between 1960 and 1969.
In the personal sector, the total gross investment ratio, based onboth current and constant dollars, remained relatively stable over allthe peak years, except for a drop in 1937, followed by recovery in thepostwar period, and a noticeable increase between 1960 and 1969. Thepattern was essentially the same on a net basis, except that the drop inthe 1930s and the rise in the 1960s were much more marked.
Business sector gross investment in relation to GNP varied oniy alittle between peak years, around a mild downward trend, which ismore noticeable in the constant than in the current dollar estimates. Ona net basis, the current and constant dollar estimates for 1948 werenoticeably higher than in the previous peak years, particularly 1937.But the ratios for the peak years in the subsequent two decades variedmoderately around a distinctly lower level.
SECTOR TOTAL INVESTMENT AND SAVING RELATIVE TODISPOSABLE INCOME
The trends of total investment by sector relative to national productbecome more meaningful if.we first examine the movement of each

CAPITAL FORMATION AND SAVING-AND INCOMI AND PRODUCT 83
sector's disposable income relative to national product, and then look atthe proportions of sector disposable incomes saved and invested (seeChart 3-3). The disposable income of each sector basically equals itsincome earned from current production pius transfers received fromother sectors (and tax receipts, in the case of government) less transferpayments (including taxes paid by the private sectors). The computa-tions are analogous to those prepared by the Council of EconomicAdvisers (see Appendix A). Total gross disposable income of the sectorsequals GNP less statistical discrepancy. The saving of each sector(disposable income less current consumption) may exceed or fall shortof its tangible plus intangible investment total, yielding a residual netfinancial investment (which, if negative, reflects net borrowing fromother sectors).
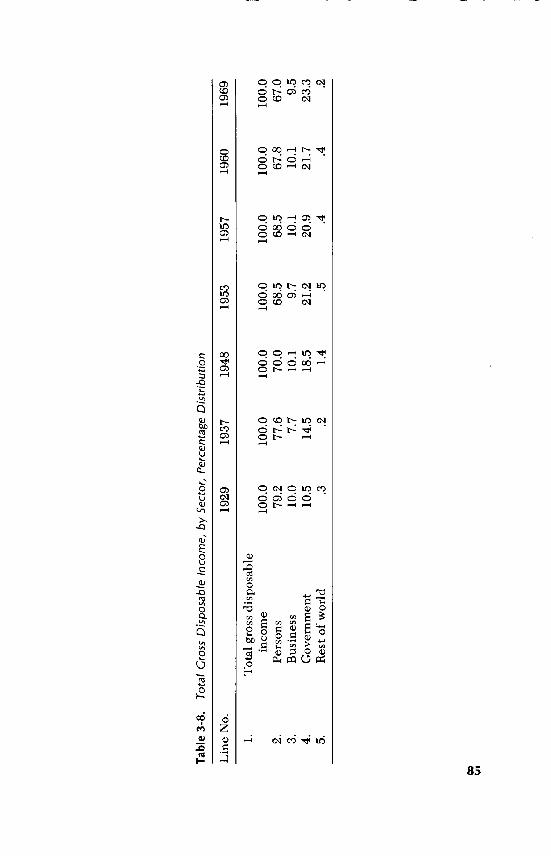
Table 3-8 gives a quick picture of the sectoral distribution of totalgross disposable income in peak years over 1929—1969. The outstand-ing trends are a drop in the share of disposable personal income fromalmost four-fifths in 1929 to two-thirds in 1969, and a counterbalancingincrease in the share of disposable government income from little morethan one-tenth in 1929 to over 23 per cent in 1969. Disposable businessincome (gross "cash flow" less dividends) held around 10 per centthroughout the period, while net transfers to the rest of the world weregenerally of only fractional magnitude, except during the early post-World War II period.
On a net basis, the relative trends in sector ratios of disposableincome to total income were much the same. In the personal anagovernmental sectors the ratios were higher on a net than on a grossbasis, however, reflecting the much lower ratio of business disposableincome on the former basis (since depreciation comprises more thanhalf of cash flow less dividends) and a somewhat rising fraction, asnoted earlier. Net foreign transfers, unaffected by depreciation, areobviously higher in relation to NNP than to GNP, but still relativelyunimportant.
PERSONAL SECTOR. As the ratio of gross disposable personalincome gradually declined from almost 79 per cent of adjusted GNP in1929 to 67 per cent in 1969, the proportion of DPI invested rose fromabout one-third in 1929 to almost 40 per cent in 1969. As a result,personal sector gross investment remained a relatively stable fraction ofGNP at around one-fourth in good years (see Table 3-9). Thus, theaverage investment propensity was rising during these four decades notonly in the total economy, as noted earlier, but also in the personalsector. This is also true of saving, for the personal sector generallyshowed a small excess of saving over total investment, with net lendingamounting to about 2 per cent of DPI in 1929 and 1 per cent in 1960.

Cha
rt 3
-3. R
atio
s of
Gro
ss In
vest
men
t to
GN
P a
nd D
ispo
sabl
e In
com
e,by
Sec
tor,
with
Rat
ios
ofSe
ctor
Dis
-po
sabl
e In
com
es to
GN
P, B
ased
on
Cur
rent
Dol
lars
, 192
9, 1
948,
196
9
—D
I•
——
P I Dl
——
— —
— —
— —
— —
—
— —
.-pI
/.—
•--•
——
— —
I /N
iD
IG
NP
II
I
11G
NP
1929
'37
'48
'53
'57
'60
'69
& P
erso
nal
B. B
usin
ess
C. G
over
nmen
tP
er c
ent
160
—
140
—
120
—
100
80 60 —
Per
cen
t76
0
740
720
700
80 60 40 20
0'6
919
29
Per
cen
t16
0—
140
—
120
—
too
—
80 —
60 — —
—40
—'N
20 — 0
40 —
20
0I
1929
'37
GN
P II IL
'48
'53
'57
'60
Tab
le 3
-8.
Tot
al C
ross
Dis
posa
ble
In c
ome,
by
Sec
tor,
Per
cent
age
Dis
trib
utio
n
Line No.
1929
1937
1948
1953
1957
1960
1969
I..
Tot
al g
ross
dis
posa
ble
inco
me
100.
010
0.0
100.
010
0.0
100.
010
0.0
100.
02.
Pers
ons
79.2
77.6
70.0
68.5
68.5
67.8
67.0
3.B
usin
ess
10.0
7.7
10.1
9.7
10.1
10.1
9.5
4.G
over
nmen
t10
.514
.518
.521
.220
.921
.723
.35.
Res
t of
wor
ld.3
.21.
4.5
.4.4
.2
cji

86 THE FORMATION AND STOCKS OF TOTAL CAPITAL
Table 3-9. Gross Investment and Saving, by Sector, Relative to Gross Product andDisposable Income
1929 1937
%of %of %of %ofLine No. GNP DI GNP DI
1.
Personal sectorDisposable income 78.8 100.0 77.6 100.0
2. Total gross investment 26.1 33.2 22.3 28.83. Net financial investment 1.7 2.2 3.5 4.54. Total gross saving 27.8 35.8 25.8 33.2
5.Business sector
Disposable income 10.0 100.0 7.7 100.06. Total gross investment 12.4 124.4 11.5 150.17. Net financial investment —2.4 —24.5 —3.9 —50.28. Total gross saving 10.0 100.0 7.7 99.9
Government sector9. Disposable income 10.4 100.0 14.5 100.0S
10. Total gross investment 4.6 44.3 6.7 45.911. Net financial investment .8 7.4 .4 3.012. Total gross saving 5.4 51.7 7.1 48.9
(We lacked final estimates of current consumption and saving for 1969at the time our estimates were completed in 1970.)
Note that by our broader definitions, personal saving is a muchlarger fraction of sector disposable personal income, near 40 per cent in1969, than by the official definitions, which placed it at 6 per cent.
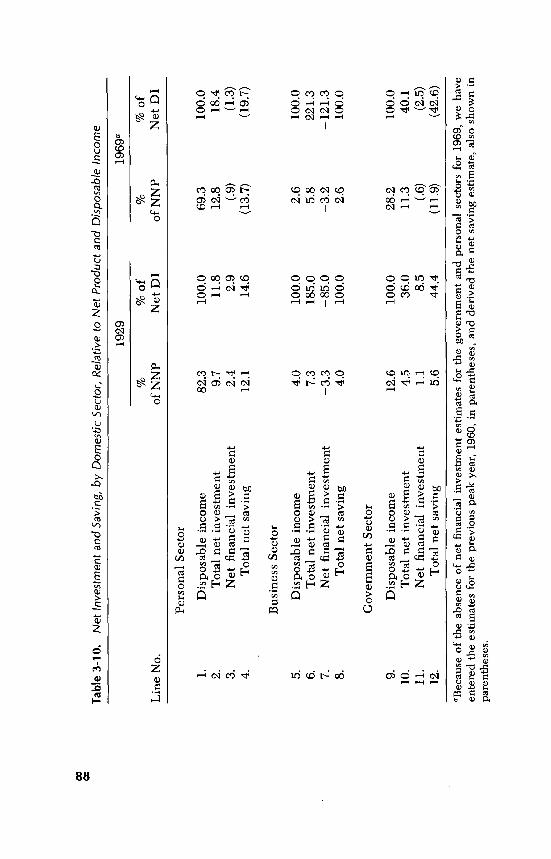
On a net basis (see Table 3-10), the personal saving and investmenttrends were similar, except that from 1929 to 1969 investment had risenproportionately more in relation to disposable income on the net thanon the gross basis—from near 12 to over 18 per cent. So, despite thevirtually identical proportionate drop of the disposable income-productratio on a net and gross basis, the ratio of personal net investment toNNP rose from less than 10 per cent to almost 13 per cent in 1969.Almost all of this relative increase took place after 1960, however. Sincenet financial investment is the same in the net as in the gross calcula-tions, the relative net saving trends parallel the relative net investmenttrends, although at a somewhat higher level.
BUSINESS SECTOR. Table 3-8 showed the remarkable stability ofgross business disposable income in good years at around 10 per cent ofGNP. Note that by definition (since consumption of intermediate goodsand dividend payments are already out), gross disposable income is

CAPITAL FORMATION AND SAVING-AND INCOME AND PRODUCT 87
1948
%of %of1953 1957 1960 1969
%of %of %of %of %of %of %of %ofGNP DI GNP DI GNP DI GNP DI GNP DI
70.4 100.0 68.1 100.0 68.5 100.0 68.0 100.0 67.0 100.024.8 35.2 24.9 36.6 25.5 37.3 25.8 38.0 26.5 39.4
1.0 1.5 1.4 2.1 1.6 2.3 .6 .9 (.6) (.9)25.8 36.7 26.3 38.7 27.1 39.6 26.5 39.0 (27.4) (40.3)
10.2 100.0 9.6 100.0 10.1 100.0 10.1 100.0 9.5 100.012.6 123.8 10.6 109.9 11.1 109.5 10.8 106.6 11.8 123.9—2.4 —23.8 —1.0 —9.9 —1.0 —9.5 —.7 —6.6 —2.3 —23.910.2 100.0 9.6 100.0 10.1 100.0 10.1 100.0 9.5 100.0
18.7 100.0 21.1 100.0 20.9 100.0 21.7 100.0 23.4 100.05.3 28.6 11.6 55.0 10.9 52.2 10.9 50.3 11.3 48.12.6 13.7 —1.6 —7.5 0 —.1 .4 2.0 (.4) (2.0)7.9 42.3 10.0 47.5 10.9 52.1 11.4 52.3 (11.7) (50.1)
equal to the gross saving of the sector. In good years, the businesssector typically invests more than its internally generated disposableincome (or saving). The resulting negative net financial investment (ornet borrowing) was a bit above and below 24 per cent of disposableincome in 1929 and 1969, respectively (see Table 3-9). Since disposableincome relative to GNP was also fractionally lower in 1969 than in1929, the business gross investment ratio to GNP fell slightly from 12.4per cent to 11.8 per cent. In good years, the ratio varied between 10.5and 12.5 per cent. There was no real trend in any of the three keyratios—disposable income to product, investment to income, andinvestment to product.
On a net basis, disposable business income represents a muchsmaller and shrinking proportion of national product. Although netbusiness investment rose from 185 per cent of disposable income (netsaving) in 1929 to 221 per cent in 1969 (see Table 3-10), the ratio of netinvestment to NNP still declined from over 7 per cent to under 6 percent. Vis-à-vis the relative stability of the gross investment ratio, thisreflects the growth of depreciation allowances as calculated in relationto retained earnings.
GOVERNMENT SECTOR. Here the dramatic rise in the ratio of
Tab
le 3
-10.
Net
Inve
stm
ent a
nd S
avin
g, b
y D
omes
tic S
ecto
r, R
ela
tive
toN
et P
rodu
ctan
d D
ispo
sabl
ein
com
e
1929
1969
a
%%
of%
%of
Lin
e N
o.of
NN
PN
et D
Iof
NN
PN
et D
I
Pers
onal
Sec
tor
1.D
ispo
sabl
e in
com
e82
.310
0.0
69.3
100.
02.
Tot
al n
et in
vest
men
t9.
711
.812
.818
.43.
Net
fina
ncia
lin
vest
men
t2.
42.
9(.
9)(1
.3)
4.T
otal
net
sav
ing
12.1
14.6
(13.
7)(1
9.7)
Bus
ines
s Se
ctor
5.D
ispo
sabl
e in
com
e4.
010
0.0
2.6
100.
06.
Tot
al n
etin
vest
men
t7.
318
5.0
5.8
221.
37.
Net
fina
ncia
l inv
estm
ent
—3.
3—
85.0
—3.
2—
121.
38.
Tot
al n
etsa
ving
4.0
100.
02.
610
0.0
Gov
ernm
ent S
ecto
r
9.D
ispo
sabl
e in
com
e12
.610
0.0
28.2
100.
010
.T
otal
net
inve
stm
ent
4.5
36.0
11.3
40.1
11.
Net
fina
ncia
lin
vest
men
t1.
18.
5(.
6)(2
.5)
12.
Tot
al n
etsa
ving
5.6
44.4
(11.
9)(4
2.6)
aBec
ause
of
the
abse
nce
of n
et f
inan
cial
inve
stm
ent e
stim
ates
for
the
gove
rnm
ent a
nd p
erso
nal s
ecto
rs f
or19
69, w
eha
veen
tere
d th
e es
timat
es f
or th
epr
evio
uspe
ak y
ear,
196
0, in
par
enth
eses
, and
der
ived
the
net s
avin
g es
timat
e, a
lso
show
n in
pare
nthe
ses.

CAPITAL FORMATION AND SAVING-AND INCOME AND PRODUCT 89
disposable income to GNP pius a moderate expansion in the share ofincome devoted to total investment accounted for the increase in totalgross investment from 4.6 per cent in 1929 to 11.3 per cent in 1969 (seeTable 3-9). Since the public sector has tended to generate positive netfinancial investment in peak cycle years, by our definition, the trend ofthe gross saving ratio has paralleled that of gross investment. The netinvestment picture exhibits much the same trends (see Table 3-10).Note that, while the fraction of gross disposable income invested bygovernments was below average in 1948, in the peak years 1953, 1957,and 1960 it exceeded 50 per cent, before declining to 48 per cent in1969 (compared with 44 per cent in 1929). It is not commonly realizedthat governments devote around half of their disposable income toinvestment, counting intangibles along with tangibles—an even higherfraction than that allotted by persons. Thus, the relative shift of incomefrom persons to government has contributed to the rise in the nationalinvestment ratio on top of the rising trend of the investment ratio inboth sectors.
DIFFERENCES IN SECTORAL INVESTMENT MIX, 1929—1969
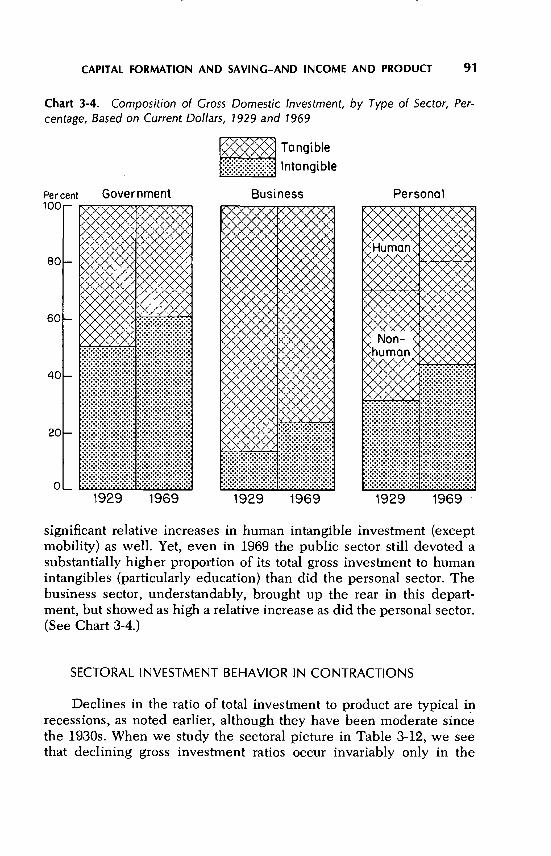
Differences in the composition of sectoral investment and changesfrom 1929 to 1969 are shown in Table 3-11. Note that rearing costs areascribed solely to the personal sector, where its share of total grossinvestment dropped from 29 to 19 per cent between 1929 and 1969.Tangible nonhuman investment constituted a smaller proportion oftotal gross investment in the personal sector than in the others butdeclined only modestly between 1929 and 1969, while it droppedmuch more in the other two domestic sectors due, chiefly, to significantdeclines in the nonresidential construction ratios. Equipment outlayratios rose in both business and government sectors, but not enough tooffset relative declines in construction (and in inventory accumulationin the business sector). Note that, even after its relative downturn,nonhuman tangible investment still accounted for over three-fourths ofbusiness investment in 1969, while it comprised less than 40 per cent inthe other sectors.
Intangible investment rose sharply in all sectors in relation to totalgross investment. Its ratio was markedly higher in the public sector—ataround 50 per cent in 1929 and 61 per cent in 1969—than in the privatesectors. It was lowest in business, but showed the sharpest rise in thatsector, from 14 to 24 per cent over the period under review.
Within the intangibles area, almost all of the relative increase inthe public sector was due to R&D. In the private sectors there were

Tab
le 3
-1 1
.G
ross
Dom
estic
Inve
stm
ent i
n C
urre
nt D
olla
rs, P
erce
nt D
istr
ibut
ion
by T
ype
and
Sec
tor
Lin
e N
o.
-PE
RSO
NA
LSE
CT
OR
BU
SIN
ESS
SEC
TO
RG
OV
ER
NM
EN
TSE
CT
OR
1929
1969
1929
1969
1929
1969
1.G
ross
sec
tor
inve
stm
ent
100.
010
0.0
100.
010
0.0
100.
010
0.0
2.T
angi
ble
inve
stm
ent
68.3
55.5
86.1
76.0
49.6
39.1
3.H
uman
29.4
19.4
0.0
0.0
0.0
0.0
4.N
onhu
man
38.9
36.2
86.1
76.0
49.6
39.1
5.St
ruct
ures
7.9
8.4
39.7
26.4
43.6
20.5
6.E
quip
men
t28
.527
.635
.543
.96.
116
.67.
Inve
ntor
ies
2.5
0.8
10.8
5.7
0.0
0.5
8.In
tang
ible
inve
stm
ent
31.7
44.5
13.9
24.0
50.4
60.9
9.H
uman
31.6
44.1
12.8
17.3
49.2
50.1
10.
Edu
catio
n an
d tr
aini
ng20
.632
.510
.415
.342
.744
.411
.H
ealth
4.4
6.0
0.4
0.5
6.2
5.2
12.
Mob
ility
6.6
5.6
2.0
1.5
0.3
0.5
13.
Non
hum
an0.
10.
31.
06.
81.
210
.814
.B
asic
res
earc
h0.
10.
20.
10.
30.
21.
715
.A
pplie
d R
& D
0.0
0.1
1.0
6.4
1.0
9.0
CAPITAL FORMATION AND SAVING-AND INCOME AND PRODUCT 91
Chart 3-4. Compositioncentage, Based on Current Do!!ars, 1929 and 1969
Per-
Tangible
Intangible
significant relative increases in human intangible investment (exceptmobility) as well. Yet, even in 1969 the public sector still devoted asubstantially higher proportion of its total gross investment to humanintangibles (particularly education) than did the personal sector. Thebusiness sector, understandably, brought up the rear in this depart-ment, but showed as high a relative increase as did the personal sector.(See Chart 3-4.)
SECTORAL INVESTMENT BEHAVIOR IN CONTRACTIONS
Declines in the ratio of total investment to product are typical inrecessions, as noted earlier, although they have been moderate sincethe 1930s. When we study the sectoral picture in Table 3-12, wethat declining
seegross investment ratios occur invariably only in the
of Gross Domestic Investment, by Type of Sector,
Government Business PersonQiPer cent100—
80—
60—
40—
20—
0
::::::::::::
::::::::::::::::::::::::
1929 1969 1929 1969 1929 1969
Tab
le 3
-12.
Sec
tor
Cha
nges
in C
ross
Dis
posa
ble
Inco
me,
Inve
stm
ent,
and
Sav
ing
as P
erce
ntag
es o
f C N
P b
etw
een
Cyc
le P
eaks
and
1.D
ispo
sabl
e in
com
e/G
NP
2.In
vest
men
tldis
posa
ble
inco
me
3.In
vest
men
tJG
NP
4.Sa
ving
/GN
P5.
Fina
ncia
l inv
estm
ent/G
NP
Bus
ines
s Se
ctor
10.
Dis
posa
ble
inve
stm
ent/G
NP
11.
Inve
stm
ent/d
ispo
sabl
e in
com
e12
.In
vest
men
tlGN
P13
.Sa
ving
IGN
P14
.Fi
nanc
ial i
nves
tmen
tlGN
P
.7.3
.2—
69.0
—34
.0—
12.2
—4.
7—
3.2
—1.
03.
35.
53.
51.
2
3.3
0—
2.1
4.6
8.8
11.5
2.1
1.2
1.3
—.7
—.9
—2.
3
—1.
0—
.9—
.6—
.38.
75.
5—
.61.
3—
.6—
1.0
.9—
.4
Tro
ughs
(per
cent
age
poin
ts)
Lin
e N
o.19
29—
3319
37—
3819
48—
4919
53—
5419
57—
5819
60—
61
Pers
onal
Sec
tor
—1.
2—
.6
—.8
—3.
6—
2.9
.7 .7 .7—
.2—
1.0
2.2
—8.
5—
6.1
—7.
4—
1.3
—5.
9—
46.6
—9.
2
.91.
1.2
—.8
.5—
.8
6.D
ispo
sabl
e in
com
e/G
NP
7.In
vest
men
t/dis
posa
ble
inco
me
8.In
vest
men
tlGN
P9.
Fina
ncia
l inv
estm
entlG
NP
Gov
ernm
ent S
ecto
r
—.2
0—
.7.1
.5—
.1—
.3 .3 .7
—.4
—13
.2—
1.7
1.3
0—
7.0
—.8 .8
—2.
8—
2.1
—3.
60
—2.
3—
1.2
CAPITAL FORMATION AND SAVING-AND INCOME AND PRODUCT 93
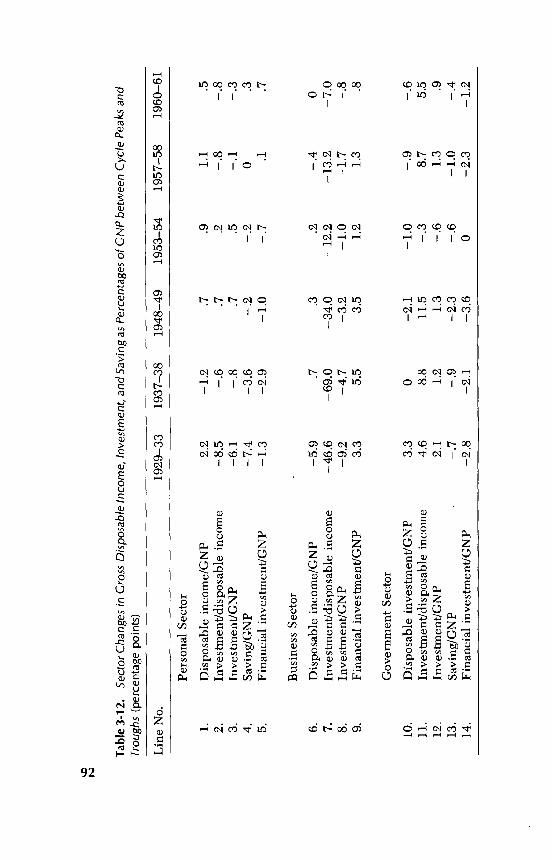
business sector. In the personal sector the picture is mixed, while in thepublic sector the ratio of total gross investment to GNP has risen in allcontractions, with the minor exception of 1953—1954.
The related disposable income data help us to analyze cyclicalinvestment behavior more fully. In the personal sector, DPI rose rela-tive to GNP in all recessions except 1937—1938, reflecting the operationof built-in stabilizers. Investment was reduced as a proportion of DPI inall contractions except 1948—1949 and 1953—1954, which were affectedby backlogs of durable goods demand. The net result was a shrinkinginvestment-product ratio in all contractions except the two noted above.The declines in the investment ratios, particularly vis-à-vis GNP, weremodest, however, except in the Great Depression of 1929—1933. It isinteresting that in all recessions through 1954, net financial investmentwas reduced, so that the ratio of gross saving to GNP fell more than theinvestment ratio, or declined when the investment ratio rose. In thesubsequent two recession years, net lending rose, so that thegross saving ratio did not drop, although the gross investment ratio diddecline slightly in both years.
In the business sector, except for a marked drop in 1929— 1933, theratio of disposable income (gross saving) to GNP did not change muchduring contractions. However, the proportion of disposable incomeinvested did drop significantly, although the declines have tended tobecome smaller in recessions since 1937—1938. This has meant signifi-cant declines in the business gross investment-GNP ratio during con-tractions, although these, too, have tended to become smaller. It isnoteworthy that the investment cuts were used to strengthen financialstructure. In every contraction net financial investment rose, going fromminus to plus without exception.
Finally, the public sector exhibits a downtrend in the ratio of grossdisposable income to GNP since the 1930s, reflecting an effect of built-in stabilizers which is the reverse of that operating in the personalsector. Further, the proportion of disposable income devoted to invest-ment rose significantly in all contractions except that of 1953—1954,when there was a small decline due to the post-Korean cutbacks. Thenet result was a significant increase in the gross government invest-ment-GNP ratio in all contractions (except 1953—1954). It is interestingthat in the government sector, net financial investment was reduced inall contractions except 1953—1954, when there was no change: that is,general governments as a whole went from surpluses on currentaccount in peak years to deficits in contraction years. As a result, theratio of gross public saving to CNP declined in all cyclical contractions,which, together with the investment increases, exerted an importantcountercyclical influence.