total body water and extracellular water measurements...
TRANSCRIPT

Spectroscopy 17 (2003) 603–611 603IOS Press
Total body water and extracellular watermeasurements throughin vivo dilution ofD2O and bromide as tracers
Giuseppe Sergia,∗, Roberta Bertanib, Irene Calliaric, Lucia Lupolia, Adriano Bertonb,Stefania Volpatoa and Giuliano EnziaaDepartment of Medical and Surgical Sciences, Division of Geriatrics, University of Padova,Via Vendramini 7, 35100 Padova, ItalyE-mail: [email protected] Department of Chemical Processes of Engineering, Faculty of Engineering, University of Padova,and Institute of Molecular Sciences and Technologies, C.N.R. – Sezione di Padova, Via Marzolo 9,35131 Padova, ItalyE-mail: [email protected] Department of Mechanical Engineering, University of Padova, Via Marzolo 9, 35131 Padova, Italy
Abstract. Large interest is into the determination of body fluids because of changes in body water in a wide variety of physio-logical and pathological conditions. Here methods based on dilution of tracers, are reported, for the extracellular water (ECW)and total body water (TBW) determinations on the same sample. As for ECW, bromide is used as tracer and its concentrationis determined by energy dispersive X-ray spectrometry; while as for TBW, D2O is used as tracer and HOD is determined byFT IR. Both methods represent significant improvements with respect the procedures described in the literature in terms ofavailability, reproducibility and accuracy.
1. Introduction
Studies of fluid balance in humans are of interest because of changes in body water in illness, mal-nutrition and in evaluation of the drugs distribution in pharmacokinetics studies [1]. Clinicians requirea tool both for a discriminative diagnosis of fluid imbalance and for monitoring changes in water spacesin elderly patients [2].
Patients with congestive heart failure need a pharmacological treatment to restore the body fluid bal-ance, since body weight only gives a rough estimate of body fluid content. Therefore, it would be benefi-cial to apply a method to identify the total body water, extracellular fluid and intracellular volume whichis optimal for each patient and which diuretic therapy could aim at restoring [3].
Fluid compartments are also enlarged in obese patients, particularly with an expansion of the extracel-lular water (ECW) and an increased extracellular/intracellular water (ECW/ICW) ratio [4]. This ECWexpansion was explained with an increased ECW/ICW ratio of fat mass [5,6] with obesity related oedemaor with hormonal responses related to adipose tissue [7]. In obese subjects the weight loss by diet or bysurgical treatment is more rapid in the first months and is associated with body composition and fluiddistribution changes. The desirable weight loss should interest mostly fat mass with limited fat-free mass
* Corresponding author.
0712-4813/03/$8.00 2003 – IOS Press. All rights reserved
604 G. Sergi et al. / Total body water and extracellular water measurements
and body fluids variations. In fact an important fat-free mass loss and fluids unbalance are disadvanta-geous because often associated with muscle weakness and disability [8,9].
All classic methods to measure TBW and ECW are based on the principle of dilution; this principlerequires a tracer that is not noxious, uniformly distributing in the whole unknown compartment and notinterfering with water or other substances distribution of whole body.
The TBW determination has been performed by “in vivo” dilution method of tracer compounds: ra-dioactive tritium oxide [10] has been extensively used, but it has been recently substituted by deuteriumoxide (D2O) [11], which is non-toxic in tracer amounts and can therefore be used in research on childrenand fertile women. The deuterium concentration was determined in body fluids, as HOD, by differentprocedures (i.e. freezing point evaluation, gas-chromatography, mass spectrometry and infrared absorp-tion). All these methods suffer from the combination of technical and practical limitations which involvethe compliance of the subjects and the quantitative determination which must be reproducible withinreasonable error limits.
To evaluate ECW inulin, manitol, thiocyanate, thiosulphate, bromide but also compounds containingradioisotopes82Sr, 34S, 24Na and82Br have been used as tracers [12]. Bromide is the most used one inestimating ECW, because it is neither radioactive nor noxious in the small quantities usually given to pa-tients [13]. Bromide has almost the same distribution as chloride and the advantage of good absorption,only moderate penetration into cells and slow excretion [12]. Yet, the bromide space determination rep-resents a good measure of extracellular fluid and is used like the reference method for the validation ofother fast methods not based on dilution principle, such as Bioelectrical Impedance Analysis (BIA) [14].
The critical point in the bromide space determination is the accuracy of the measure of the plasmabromide concentration, which is extremely low. Several techniques have been employed for bromidedetermination in plasma, including the colorimetric bromate-rosaniline method [15], Neutron ActivationAnalysis (NAA) [16], X-ray-emission by protons (PIXE) [17] and photons (XRF) [18] and bromide ionchromatography [19]. NAA and PIXE are very long time consuming techniques and require expensiveequipment which is not routinely available in a medical laboratory, the anion-exchange chromatographicmethod needs giving an high oral dose of bromide to patients [20]. EDXRS seems to be the most advan-tageous technique to routinely measure the bromide concentration.
Here we describe a method for both TBW [21] and ECW [22] evaluations through D2O and bromidedeterminations in plasma, respectively.
2. Experimental
Selected subjects received orally a known doses of D2O and NaBr (ca. 50 g of a solution containing200 ml of D2O in 1000 ml of H2O solution and 35 mg/kg body weight of NaBr). Before administrationof D2O and after 3 hrs, when bromide and D2O are uniformly distributed, 20 ml venous blood sampleswere drawn into syringes and transferred into heparinized stoppered tubes. The samples were centrifugedat 3000 rpm for 15 min (with ALC4236A) and frozen at−50◦C. 1 ml and 2 ml of plasma were used forthe preparation of samples for ECW and TBW evaluations, respectively.
2.1. Preparation of samples for ECW evaluation
1 ml of plasma (basal and equilibrium) was accurately mixed with 1 ml of yttrium nitrate solution(0.84%) in a Petri capsule; this solution was frozen and dried. Yttrium was chosen as internal referenceand the ratios between Br and Y net intensities were used in linear calibration. The dried powders, mainly

G. Sergi et al. / Total body water and extracellular water measurements 605
Fig. 1. Linear fit for EDXRS determinations (r = 0.99989).
constituted of plasmatic proteins, bromide and yttrium, were shattered for 3 minutes in an agate mortar,to obtain homogeneous powders with the same grain size; 50 mg of each powder were pressed intoa 1.3 cm diameter pellet.
As the matrix and interelemental effects are relatively constant in all samples, a least squares regressionanalysis to relate elemental concentrations to peak ratios (Br/Y) has been used.
To obtain the calibration line 200µl of six NaBr solutions at different concentrations (75, 150, 300,600, 900, 1200µg/ml) were added to basal plasma. Each standard sample, containing respectively 15,30, 60, 120, 180 and 240µg of NaBr, was prepared twice. In Fig. 1 the calibration plot is reported. Sincethe detection limit, calculated as the concentration corresponding to 3 times SD for the backgroundcounts is 5µg/ml, the low negative value (−2.7µg/ml) of the intercept has no influence on the accuracyof determination. Bromide concentration in both standard and unknown samples were determined byEDXRS (Energy Dispersive X-Ray Fluorescence) measurements performed with a Kevex Delta 770spectrometer in a secondary target excitation mode in the following experimental conditions: Rh tube,Ag secondary target, tube voltage 30 kV, tube current 3.0 mA, Si(Li) detector 150 eV resolution, analysistime 300 s.
2.2. Preparation of samples for TBW evaluation
2 ml of plasma were frozen at−50◦C (in a cold bath of EtOH/liquid N2) and were then sublimed undervacuum to dryness using a diffusive pump (Edwards/Galileo) operating at 10−5 mbar. The sublimate wascondensed in a trap immersed in liquid nitrogen giving purified water samples suitable for analysis whichwere stored in screw top septum vials at−20◦C.
The apparatus for sublimation [21] was designed and constructed in the laboratory of the authors.The form and dimensions were optimised in order to obtain the most complete and rapid sublimation,after a number of attempts in order to obtain the most reproducible processes. In this apparatus thestarting frozen material was distributed on a large surface and relatively large dimensions of transferlines allowed a complete sublimation to dryness in ca. 5 hrs even for samples containing a large amountof solid residue (overall proteins). With smaller or different apparatus such samples required 10 hrs ormore for sublimation, sometimes giving opaque sublimates and samples which were thus not suitable forIR determination. The preparation of the sublimed samples represented the key step of the determination.In fact, some relevant parameters of the sublimation, such as temperature, vacuum and determination ofend point must be considered. Analyses of HOD were performed on a FT Infrared SpectrophotometerNicolet Nexus operating under N2 and at constant temperature of 20◦C using CaF2 cells with 0.2 mmpath length.

606 G. Sergi et al. / Total body water and extracellular water measurements
3. Results and discussion
3.1. ECW evaluation
Energy dispersive X-ray spectrometry (EDXRS) is a powerful analytical technique, that allows forsimultaneous determination, inµg/g levels, of several elements in biological samples, especially in sec-ondary excitation mode [23]. Consequently numerous papers have been devoted to the use of EDXRS foranalysing biological materials [24]. The sample and target preparation are critical steps in the analysisof such sample types. Therefore considerable effort has been made to develop and improve appropriateprocedures, e.g., by making thick target pellets from dried biological materials, or by making thin-filmtargets obtained by low and high temperature asking, wet digestion in an open or close teflon vessels [25].In the thin-film method the sample is chemically dissolved with acid reagents and 100–300µl of the ob-tained solution are pipetted on a mylar film, dried under vacuum and analysed. The advantage of thistarget preparation procedure is the low matrix effect and the possibility to concentrate the solution withan appropriate ratio of sample weight to digestion solvent amount; it allows an improvement of detec-tion limits. The calibration targets are prepared by pipetting standard solutions containing the elementsto determine at different concentrations [26]. This procedure requires digestion systems, acid reagentsand chemical supports which are not always available in a clinical laboratory; furthermore, the obtainedtargets are not easily storable for further investigation so that the calibration targets have to be pre-pared each time. This method was successfully applied to analyse algae, plants, hair, human tissues,blood [23,25(a),27]. The detection limits for elements withZ � 20 in an organic matrix, expressed asµg/ml, are in the range 0.1–0.5 [23] which correspond to 2–10µg/g on dry weight, when 100 mg ofdried sample are dissolved in 1 ml of acid. In the thick target method the specimen for the spectrometeris obtained by pressing in an IR hydraulic press 50–150 mg of dried sample powder to a 1.3 cm diame-ter pellet. The calibration pellets are prepared by addition of fixed amounts of the analysed elements toa reference powder. In both methods, to eliminate the geometric effects and/or small errors in the weight-ing or dilution steps, a fixed amount of an internal reference element (Ti, Y, Zr) is added to sample andcalibration targets.
The thick targets are easier to prepare and to store than thin targets, thus the calibration specimensmay be prepared at the beginning of the study and stored for further analysis, taking into account theinstrumental drift. The detection limits are in the range 2–10µg/g on dry weight basis.
In the present paper the thick target method is applied to measure the Br content in human blood toestimate the extracellular water. The published data [28] concerning this subject report the measurementsof Br in blood and saliva simultaneously using stable bromine and82Br. The targets for X-ray spectrome-ter were obtained by placing fresh urine and blood plasma samples on a thin ash-free filter paper, dried ina vacuum. Bromine was estimated under thin film conditions with an annular109Cd source. The accuracyand precision of the method was evaluated by comparing the CBS data obtained by stable bromine tothe routine method with82Br indicator. The differences in CBS estimation by82Br and EDXRF (saliva,urine and blood) are less than 10%: the advantage of stable bromine method is evident.
In the present paper the bromine was determined on blood using the thick pellets method.Sodium bromide is administered to patients, adsorbed by body and diluted by extracellular water.
The equilibrium of bromide concentration is established in blood about 3 hours after the administra-tion [17(c)].

G. Sergi et al. / Total body water and extracellular water measurements 607
Extracellular water can be estimated from the Corrected Bromide Space (CBS), which was calculatedaccording to the following formula [29]:
CBS = Br dose (mmol)/Br in plasma (mmol/l) × 0.90× 0.95× 0.94,
where
0.90 = correction factor for the distribution of bromide in the non-extracellular sites (principally redblood cells);
0.95 = correction factor for the Donnan equilibrium [30];0.94 = correction factor for the concentration of water in the plasma which is about 94%.
3.2. TBW evaluation
It is well known that when H2O and D2O are mixed, HOD formation occurs. At low D2O concentra-tion the solutions consist principally of H2O and HOD. Infrared spectroscopic analysis of dilute HODsolutions is based on the O–D stretching observed at 2500 cm−1 [31].
The accurate detection of the O–D stretching requires an FT IR spectrophotometer using a short pathlength (0.2 mm) [32]. This absorption is positioned in a free region of the spectrum but falls between thevery strong CH (2800 cm−1) and CO2 absorptions (2337 cm−1). The data obtained for a series of refer-ence samples are reported in Fig. 2 and Table 1. For all samples the same range for integration between2660 and 2400 cm−1 was considered. We obtained perfectly reproducible determinations on referencesamples in the range of interest (110–550 ppm) even for quite dilute solutions (between 30 to 100 ppm).For the range of concentrations considered the Lambert–Beer law is strictly observed. In Fig. 2 is also re-ported the comparison between the data obtained for H2O/D2O mixtures prepared by simple dilution andthe data obtained for the same solutions after sublimation, which are perfectly superimposed. These dataclearly indicate that with the apparatus used for sublimation no H2O or HOD loss occurred, as a conse-quence of the difference in density and vapour pressure of these two components. Figure 2 represents the
Fig. 2. Linear fit for calculations and comparison between the data obtained for H2O/D2O mixtures measured after dilution (◦)or after sublimation (•).

608 G. Sergi et al. / Total body water and extracellular water measurements
Table 1
(a) Values obtained after repeated FT IR determinations on reference samples
Real Integration values – FT IR measurements Integration values – FT IR measurements onconcentration on not sublimed samples sublimed samples
110 629.1 average value= 627.5 619.9 average value= 624.8620.9 624.8632.5 629.7
220 1255.1 average value= 1257.7 1254.9 average value= 1259.51264.0 1269.01253.9 1254.5
275 1576.0 average value= 1577.8 1569.9 average value= 1576.71574.9 1581.11582.5 1579.2
385 2171.5 average value= 2171.8 2165.5 average value= 2170.22174.3 2176.22169.5 2168.8
440 2494.7 average value= 2499.4 2484.5 average value= 2492.22503.1 2500.92500.5 2491.1
550 3129.2 average value= 3123.8 3099.4 average value= 3109.63127.6 3110.63114.6 3118.8
(b) Concentration (ppm) obtained after repeated subli-mations and FT IR determinations on different samples
Sample 1 236 235 232Sample 2 272 275 269Sample 3 264 265 260Sample 4 339 339 330Sample 5 364 365 365Sample 6 262 266 264Sample 7 390 390 390
calibration curve used for calculations. All measurements on samples were performed under the sameconditions checking continuously the calibration curve. The reproducibility of the measurements fallswithin 1% for the HOD range concentration considered, as showed by the data reported in Table 1.
The TBW values have been finally obtained by the insertion of obtained HOD concentration in ppminto the following calculation [33]:
TBW = A/B × 0.928,
where
0.928= correction coefficient which takes into account that D2O is involved in H/D exchangeprocesses into the body;
A = quantity of D2O administered in grams;B = concentration of HOD determined in ppm.
G. Sergi et al. / Total body water and extracellular water measurements 609
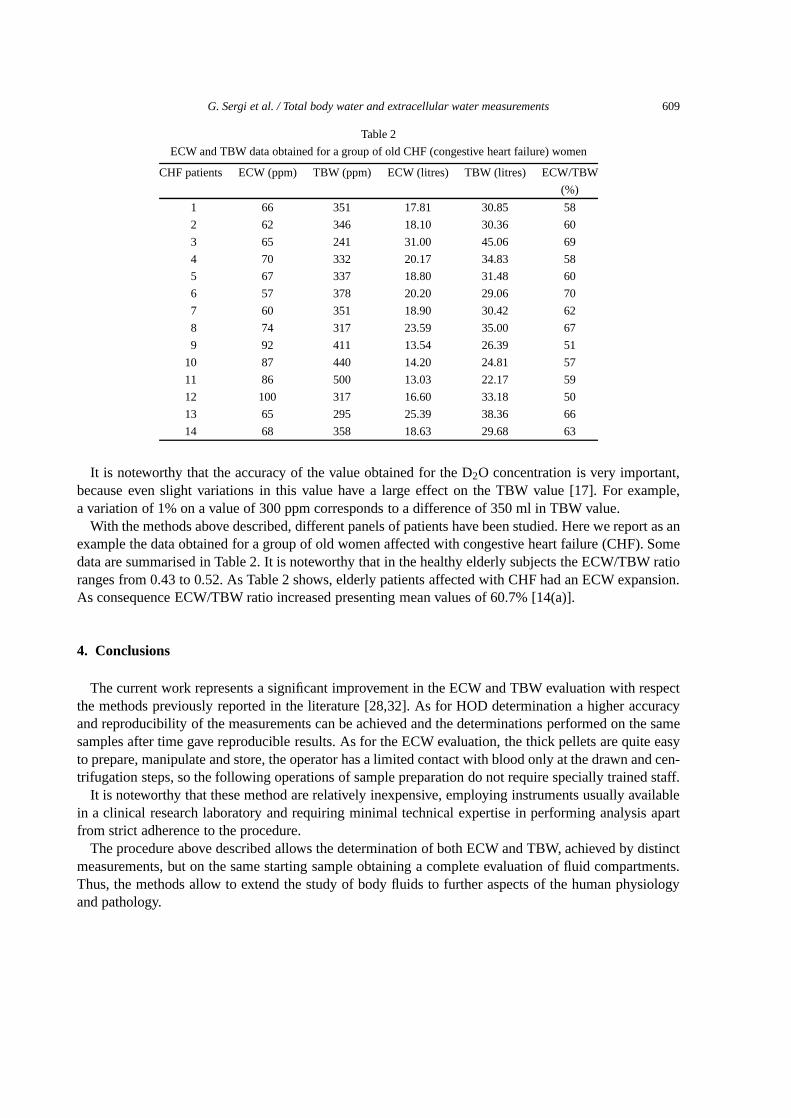
Table 2
ECW and TBW data obtained for a group of old CHF (congestive heart failure) women
CHF patients ECW (ppm) TBW (ppm) ECW (litres) TBW (litres) ECW/TBW
(%)
1 66 351 17.81 30.85 58
2 62 346 18.10 30.36 60
3 65 241 31.00 45.06 69
4 70 332 20.17 34.83 58
5 67 337 18.80 31.48 60
6 57 378 20.20 29.06 70
7 60 351 18.90 30.42 62
8 74 317 23.59 35.00 67
9 92 411 13.54 26.39 51
10 87 440 14.20 24.81 57
11 86 500 13.03 22.17 59
12 100 317 16.60 33.18 50
13 65 295 25.39 38.36 66
14 68 358 18.63 29.68 63
It is noteworthy that the accuracy of the value obtained for the D2O concentration is very important,because even slight variations in this value have a large effect on the TBW value [17]. For example,a variation of 1% on a value of 300 ppm corresponds to a difference of 350 ml in TBW value.
With the methods above described, different panels of patients have been studied. Here we report as anexample the data obtained for a group of old women affected with congestive heart failure (CHF). Somedata are summarised in Table 2. It is noteworthy that in the healthy elderly subjects the ECW/TBW ratioranges from 0.43 to 0.52. As Table 2 shows, elderly patients affected with CHF had an ECW expansion.As consequence ECW/TBW ratio increased presenting mean values of 60.7% [14(a)].
4. Conclusions
The current work represents a significant improvement in the ECW and TBW evaluation with respectthe methods previously reported in the literature [28,32]. As for HOD determination a higher accuracyand reproducibility of the measurements can be achieved and the determinations performed on the samesamples after time gave reproducible results. As for the ECW evaluation, the thick pellets are quite easyto prepare, manipulate and store, the operator has a limited contact with blood only at the drawn and cen-trifugation steps, so the following operations of sample preparation do not require specially trained staff.
It is noteworthy that these method are relatively inexpensive, employing instruments usually availablein a clinical research laboratory and requiring minimal technical expertise in performing analysis apartfrom strict adherence to the procedure.
The procedure above described allows the determination of both ECW and TBW, achieved by distinctmeasurements, but on the same starting sample obtaining a complete evaluation of fluid compartments.Thus, the methods allow to extend the study of body fluids to further aspects of the human physiologyand pathology.
610 G. Sergi et al. / Total body water and extracellular water measurements
References
[1] J.F. Aloia, A. Vaswani, E. Flaster and R. Ma.,J. Lab. Clin. Med. 132(6) (1998), 483–490.[2] P. Ritz,J. Gerontol. 56A(6) (2001), M344–M348.[3] M. Soderberg, R.G. Hahn and T. Cederholm,Scand. J. Clin. Lab. Invest. 61 (2001), 89–94.[4] W.D. Van Marken Lichtenbelt and M. Fogelholm,J. Appl. Physiol. 87 (1999), 294–298.[5] M. Di Girolamo and J.L. Owens,Am. J. Physiol. 231 (1976), 1568–1572.[6] J. Wang and R.N. Pierson,J. Nutr. 106 (1976), 1687–1693.[7] M. Waki, J.G. Kral, M. Mazariegos, J. Wang, R.J. Pierson and S.B. Heymsfield,Am. J. Physiol. 261 (1991), E199–E203.[8] W.J. Evans and W.W. Campbell,J. Nutr. 123 (1993), 465–468.[9] C.R. Gross, R.D. Lindquist, A.C. Woolley, R. Granieri and K. Allard,B. J. Emerg. Med. 10(3) (1992), 267–274.
[10] (a) G.M. Culebras, G.F. Fitzpatrick, M.F. Brennan, C.M. Boyden and F.D. Moore,Am. J. Physiol. 232 (1977), R60–65. (b) T.C. Prentice, W. Siri, N.I. Berlin, G.M. Hyde, R.J. Parsons, E.E. Joiner and J.H. Lawrence,J. Clin. Invest. 31(1952), 412. (c) M.P. Vignault, M. Saboreau and C. Grenot,Comp. Biochem. Physiol. A 115 (1996), 187. (d) G.J. Maw,I.L. Mackenzie, D.A.M. Comer and N.A.S. Taylor,Med. Sci. Sports Exerc. 28 (1996), 1038.
[11] (a) D.A. Schoeller, E. van Santen, D.W. Peterson, W. Dietz, J. Jaspan and P.D. Klein,Am. J. Clin. Nutr. 33 (1980), 2686.(b) H.G.E. Endres and O. Gruner,Clin. Invest. 72 (1994), 830. (c) S. Borgogha, R. Kuryian, C. Petracchi, A. Ferro-Luzziand A.V. Kurpad,Indian J. Physiol. Pharmacol. 41 (1997), 47. (d) G. Woodrow, B. Oldroyd, J.H. Turney, P.S.W. Davies,J.M.E. Day and M.A. Smith,Clin. Nephrol. 47 (1997), 52. (e) G. Woodrow, B. Oldroyd, J.H. Turney, P.S.W. Davies,J.M.E. Day and M.A. Smith,Clin. Sci. 91 (1996), 763. (e) D.W. Johnson, B.J. Thomas, S.J. Fleming, J. Westhuyzen,D. Moran and L.C. Ward,Blood Pres. Res. 19 (1996), 94. (f) K.R. Westerterp, P. Robach, L. Wouters and J.P. Richalet,J. Appl. Physiol. 80 (1996), 1968. (g) M. Wabistch, U. Braun, E. Heinze, R. Muche, H. Mayer, W. Teller and C. Ensch,J. Appl. Physiol. 80(6) (1996), 1968. (h) M. Wabitsch, U. Braun, E. Heinze, R. Muche, H. Meuer, W. Teller and C. Fusch,Am. J. Clin. Nutr. 64(1) (1996), 1.
[12] (a) D.B. Cheek,J. Pediatrics 58 (1961), 103. (b) N. Vaisman, P. Pencharz, G. Koren and J. Johnson,Am. J. Clin. Nutr. 47(1987), 1. (c) G.B. Forbes, in:Human Growth: Postnatal Growth, Vol. 2, F. Falkner and J.M. Tanner, eds, Plenum Press,New York, 1978, pp. 239–272. (d) R.N. Pierson, D.C. Price, J. Wang and R.K. Jain,Am. J. Physiol. 235 (1978), F254.(e) D.H. Elwyin, B.C. Brown and W.C. Schoemaker,Am. Surg. 182 (1975), 76.
[13] M.E. Miller, J.M. Cosgriff and G.B. Forbes,Am. J. Clin. Nutr. 50 (1989), 168.[14] (a) G. Sergi, M. Bussolotto, P. Perini, I. Calliari, V. Giantin, A. Ceccon, F. Scanferla, M. Bressan, G. Moschini and G. Enzi,
Ann. Nutr. Metab. 38 (1994), 158. (b) R. Gudivaka, D.A. Schoeller, R.F. Kushner and M.J.G. Bolt,J. Appl. Physiol. 87(1999), 1097. (c) E.M. Baarends, W.D.V. Lichtenbelt, E.F.M. Wouters and A.M.W.J. Scholts,Clin. Nutr. 17 (1998), 15.
[15] J.F. Goodwin,Clin. Chem. 17 (1971), 544.[16] R.E. Jervis, R.G.V. Hancock, D.E. Hill and K. Isles,J. Radioanal. Chem. 37 (1977), 463.[17] (a) H.J. Hay and D.B. Cheek,Aust. J. Physiol. 40 (1987), 207. (b) H.R. Shao, Q.X. Liu, G. Sergi, P. Perini, G. Enzi
and G. Moschini,Proceedings of International Conference on Application of Nuclear Techniques, Heracko-Crete, WordScientific, 1990, p. 148. (c) H.R. Shao, Q.X. Liu, G. Enzi, G. Moschini and G. Sergi,Nucl. Instrument. Methods Phys.Res. B 49 (1990), 238.
[18] (a) L. Kaufman and J. Wilson,J. Nucl. Med. 14 (1973), 812. (b) W. Wong, H.P. Sheng, J.C. Morkeberg, J.L. Kosanovich,L.L. Clarke and P.D. Klein,Am. J. Clin. Nutr. 50 (1989), 1290.
[19] (a) W.D.D.M. Lichtenbelt, A. Kester, E.M. Baarends and K.R. Westersterp,J. Am. Physiol. (1996), 653. (b) L.D. Thomasand D.V.V.P.R. Schloerb,J. Pharm. Biomed. Anal. 9 (1991), 581.
[20] A.M. Zhang, S.H. Wang, L.Y. Du and H. Cui,Analyt. Lett. 33 (2000), 2321.[21] R. Bertani, G. Sergi, L. Lupoli, A. Berton, S. Volpato, K. Zambon, A. Coin and G. Enzi,Ann. Chim. 92 (2002), 135–138.[22] G. Sergi, I. Calliari, R. Bertani, L. Lupoli, S. Volpato, A. Coin and G. Enzi,Ann. Chim., submitted.[23] J.M. Jaklevic and R.D. Giacque, Energy dispersive X-ray fluorescence analysis using X-ray tube excitation, in:Handbook
of X-Ray Spectrometry, R.Van Grieken and A.A. Markowicz, eds, Marcel Dekker, Inc., 1993, pp. 151–179.[24] A.A. Katsanos, X-ray methods in elemental analysis of biological materials, Tech. Report Series n.197, IAEA, Vienna,
1980, pp. 231–254.[25] (a) I. Calliari, A.M. Tollardo, R. Callegaro, L. Celin and G. Caniglia,X-Ray Spectrometry 24 (1995), 143–148. (b) J. Injuk
and R. Van Grieken, Sample preparation for XRF, in:Handbook of X-Ray Spectrometry, R.Van Grieken and A.A. Markow-icz, eds, Marcel Dekker, Inc., 1993, pp. 657–685. (c) J. Kucera, I. Obrusnik and E. Sabbioni,Nuclear and AnalyticalMethods in the Life Sciences, Humana Press, 1994. (d) A.S. Fassina, I. Calliari, A. Sangiorgio, M. Rossato, M. Ramigni,M. Dal Bianco and F. Pagano,Eur. Urol. 18 (1990), 140–144.
[26] T. Pinheiro, H. Duflou and W. Maenhaut,Biol. Trace Elem. Res. 26 (1990), 26.[27] I. Calliari, G. Concheri and S. Nardi,X-Ray Spectrom. 22 (1993), 332–337.[28] V. Zaichick,Appl. Radiat. Isot. 49 (1998), 1665–1669.[29] E.F. Bell, E.F. Ziegler and G.B. Forbes, Letter to the Editors,Pediatric Res. 18 (1984), 392.

G. Sergi et al. / Total body water and extracellular water measurements 611
[30] D.B. Cheek,J. Appl. Physiol. 5 (1953), 639.[31] H.C. Lukaski and P.E. Johnson,Am. J. Clin. Nutr. 41 (1985), 363.[32] W.C. Waggener,Anal. Chem. 30 (1958), 1569. (b) W.J. Potts, Jr.,Chemical Infrared Spectroscopy, Vol. 1, John Wiley &
Sons, New York, 1963, pp. 250–252.[33] W.P. Bartoli, J.M. Davis, R.R. Pate, D.S. Ward and P.D. Watson,Medicine and Sciences in Sports and Exercise 25 (1993),
1422.

Submit your manuscripts athttp://www.hindawi.com
Chromatography Research International
Hindawi Publishing Corporationhttp://www.hindawi.com Volume 2013
Hindawi Publishing Corporationhttp://www.hindawi.com Volume 2013
Carbohydrate Chemistry
International Journal of
Hindawi Publishing Corporationhttp://www.hindawi.com
International Journal of
Analytical ChemistryVolume 2013
ISRN Chromatography
Hindawi Publishing Corporationhttp://www.hindawi.com Volume 2013
Hindawi Publishing Corporation http://www.hindawi.com Volume 2013Hindawi Publishing Corporation http://www.hindawi.com Volume 2013
The Scientific World Journal
Bioinorganic Chemistry and ApplicationsHindawi Publishing Corporationhttp://www.hindawi.com Volume 2013
Hindawi Publishing Corporationhttp://www.hindawi.com Volume 2013
CatalystsJournal of
ISRN Analytical Chemistry
Hindawi Publishing Corporationhttp://www.hindawi.com Volume 2013
ElectrochemistryInternational Journal of
Hindawi Publishing Corporation http://www.hindawi.com Volume 2013
Hindawi Publishing Corporationhttp://www.hindawi.com Volume 2013
Advances in
Physical Chemistry
ISRN Physical Chemistry
Hindawi Publishing Corporationhttp://www.hindawi.com Volume 2013
SpectroscopyInternational Journal of
Hindawi Publishing Corporationhttp://www.hindawi.com Volume 2013
ISRN Inorganic Chemistry
Hindawi Publishing Corporationhttp://www.hindawi.com Volume 2013
Hindawi Publishing Corporationhttp://www.hindawi.com Volume 2013
Journal of
Chemistry
Hindawi Publishing Corporationhttp://www.hindawi.com Volume 2013
Inorganic ChemistryInternational Journal of
Hindawi Publishing Corporation http://www.hindawi.com Volume 2013
International Journal ofPhotoenergy
Hindawi Publishing Corporationhttp://www.hindawi.com
Analytical Methods in Chemistry
Journal of
Volume 2013
ISRN Organic Chemistry
Hindawi Publishing Corporationhttp://www.hindawi.com Volume 2013
Hindawi Publishing Corporationhttp://www.hindawi.com Volume 2013
Journal of
Spectroscopy