total 155 10,268,842 12 $ 1,731 - hellenicshippingnews.com · 3 as at may 08th 2015 0 50 100 150...
TRANSCRIPT
2
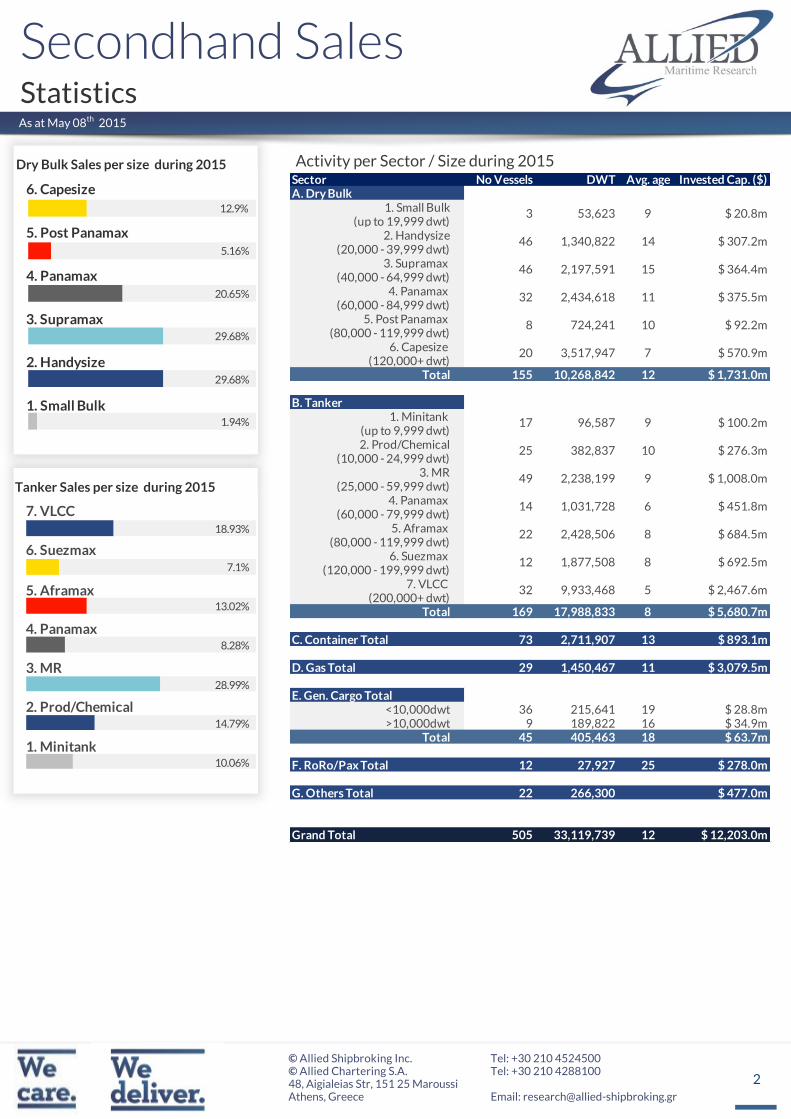
Sector No Vessels DWT Avg. age Invested Cap. ($)A. Dry Bulk
1. Small Bulk(up to 19,999 dwt)
2. Handysize(20,000 - 39,999 dwt)
3. Supramax (40,000 - 64,999 dwt)
4. Panamax (60,000 - 84,999 dwt)
5. Post Panamax (80,000 - 119,999 dwt)
6. Capesize (120,000+ dwt)
Total 155 10,268,842 12 $ 1,731.0m
B. Tanker1. Minitank
(up to 9,999 dwt)2. Prod/Chemical
(10,000 - 24,999 dwt)3. MR
(25,000 - 59,999 dwt)4. Panamax
(60,000 - 79,999 dwt)5. Aframax
(80,000 - 119,999 dwt)6. Suezmax
(120,000 - 199,999 dwt)7. VLCC
(200,000+ dwt)Total 169 17,988,833 8 $ 5,680.7m
C. Container Total 73 2,711,907 13 $ 893.1m
D. Gas Total 29 1,450,467 11 $ 3,079.5m
E. Gen. Cargo Total<10,000dwt 36 215,641 19 $ 28.8m>10,000dwt 9 189,822 16 $ 34.9m
Total 45 405,463 18 $ 63.7m
F. RoRo/Pax Total 12 27,927 25 $ 278.0m
G. Others Total 22 266,300 $ 477.0m
Grand Total 505 33,119,739 12 $ 12,203.0m
32 $ 375.5m
9,933,468
2,428,506
1,877,508
2,238,199
3,517,947
96,587
2,434,618
20 $ 570.9m
17 $ 100.2m
8 724,241 $ 92.2m
3 $ 20.8m
46 $ 307.2m
46 $ 364.4m2,197,591
53,623
1,340,822
9
14
15
14 $ 451.8m
$ 276.3m
9
10
1,031,728
25 382,837
9
6
49 $ 1,008.0m
32 $ 2,467.6m5
8
8
22 $ 684.5m
12 $ 692.5m
11
10
7
As at May 08th 2015
Dry Bulk Sales per size during 2015
7. VLCC
5. Aframax
4. Panamax
3. MR
2. Prod/Chemical
1. Minitank
6. Suezmax
18.93%
7.1%
13.02%
8.28%
28.99%
14.79%
10.06%
6. Capesize
5. Post Panamax
4. Panamax
3. Supramax
2. Handysize
1. Small Bulk
12.9%
5.16%
20.65%
29.68%
29.68%
1.94%
Tanker Sales per size during 2015
3
As at May 08th 2015
0
50
100
150
200
250
Jan
ua
ry
Fe
bru
ary
Mar
ch
Ap
ril
Ma
y
Jun
e
July
Au
gu
st
Se
pte
mb
er
Oct
ober
No
vem
ber
De
cem
be
r
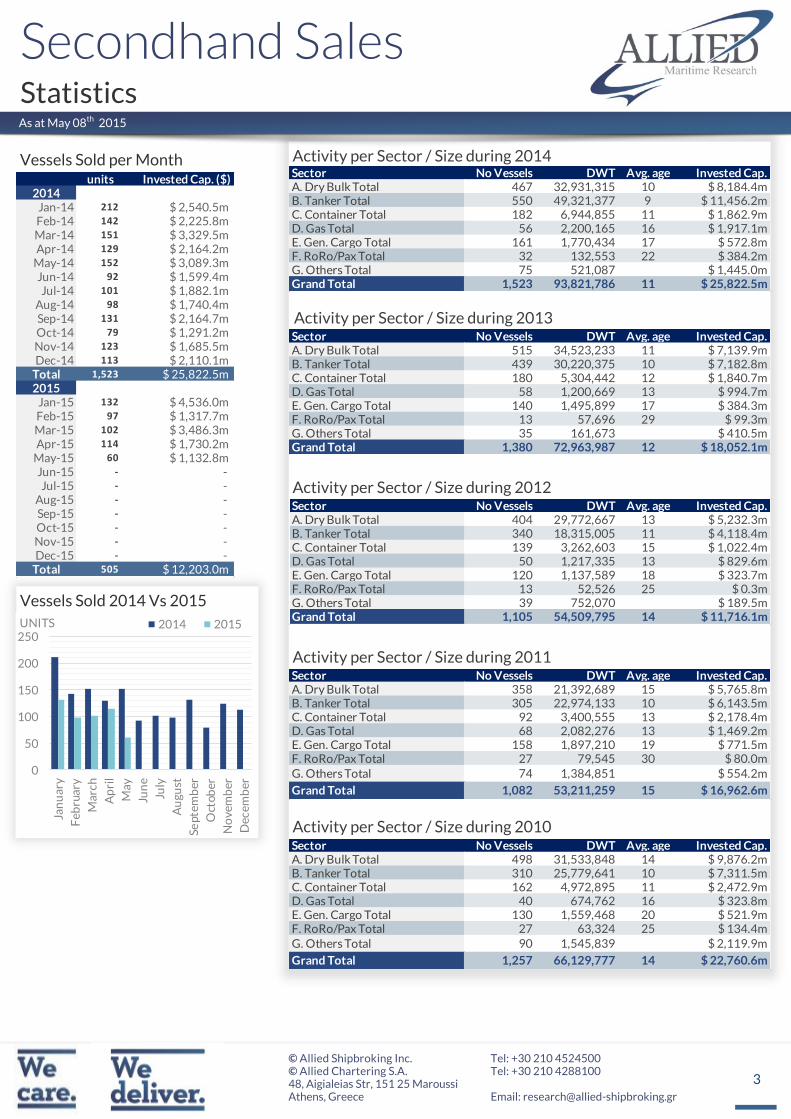
UNITS 2014 2015
Vessels Sold per Month
Vessels Sold 2014 Vs 2015
units Invested Cap. ($)2014
Jan-14 212 $ 2,540.5m Feb-14 142 $ 2,225.8m Mar-14 151 $ 3,329.5m Apr-14 129 $ 2,164.2m
May-14 152 $ 3,089.3m Jun-14 92 $ 1,599.4m Jul-14 101 $ 1,882.1m
Aug-14 98 $ 1,740.4m Sep-14 131 $ 2,164.7m Oct-14 79 $ 1,291.2m Nov-14 123 $ 1,685.5m Dec-14 113 $ 2,110.1m
Total 1,523 $ 25,822.5m 2015
Jan-15 132 $ 4,536.0m Feb-15 97 $ 1,317.7m Mar-15 102 $ 3,486.3m Apr-15 114 $ 1,730.2m
May-15 60 $ 1,132.8m Jun-15 - - Jul-15 - -
Aug-15 - - Sep-15 - - Oct-15 - - Nov-15 - - Dec-15 - -
Total 505 $ 12,203.0m
Sector No Vessels DWT Avg. age Invested Cap.A. Dry Bulk Total 467 32,931,315 10 $ 8,184.4mB. Tanker Total 550 49,321,377 9 $ 11,456.2mC. Container Total 182 6,944,855 11 $ 1,862.9mD. Gas Total 56 2,200,165 16 $ 1,917.1mE. Gen. Cargo Total 161 1,770,434 17 $ 572.8mF. RoRo/Pax Total 32 132,553 22 $ 384.2mG. Others Total 75 521,087 $ 1,445.0mGrand Total 1,523 93,821,786 11 $ 25,822.5m
Sector No Vessels DWT Avg. age Invested Cap.A. Dry Bulk Total 515 34,523,233 11 $ 7,139.9mB. Tanker Total 439 30,220,375 10 $ 7,182.8mC. Container Total 180 5,304,442 12 $ 1,840.7mD. Gas Total 58 1,200,669 13 $ 994.7mE. Gen. Cargo Total 140 1,495,899 17 $ 384.3mF. RoRo/Pax Total 13 57,696 29 $ 99.3mG. Others Total 35 161,673 $ 410.5mGrand Total 1,380 72,963,987 12 $ 18,052.1m
Sector No Vessels DWT Avg. age Invested Cap.A. Dry Bulk Total 404 29,772,667 13 $ 5,232.3mB. Tanker Total 340 18,315,005 11 $ 4,118.4mC. Container Total 139 3,262,603 15 $ 1,022.4mD. Gas Total 50 1,217,335 13 $ 829.6mE. Gen. Cargo Total 120 1,137,589 18 $ 323.7mF. RoRo/Pax Total 13 52,526 25 $ 0.3mG. Others Total 39 752,070 $ 189.5mGrand Total 1,105 54,509,795 14 $ 11,716.1m
Sector No Vessels DWT Avg. age Invested Cap.A. Dry Bulk Total 358 21,392,689 15 $ 5,765.8mB. Tanker Total 305 22,974,133 10 $ 6,143.5mC. Container Total 92 3,400,555 13 $ 2,178.4mD. Gas Total 68 2,082,276 13 $ 1,469.2mE. Gen. Cargo Total 158 1,897,210 19 $ 771.5mF. RoRo/Pax Total 27 79,545 30 $ 80.0mG. Others Total 74 1,384,851 $ 554.2m
Grand Total 1,082 53,211,259 15 $ 16,962.6m
Sector No Vessels DWT Avg. age Invested Cap.A. Dry Bulk Total 498 31,533,848 14 $ 9,876.2mB. Tanker Total 310 25,779,641 10 $ 7,311.5mC. Container Total 162 4,972,895 11 $ 2,472.9mD. Gas Total 40 674,762 16 $ 323.8mE. Gen. Cargo Total 130 1,559,468 20 $ 521.9mF. RoRo/Pax Total 27 63,324 25 $ 134.4mG. Others Total 90 1,545,839 $ 2,119.9m
Grand Total 1,257 66,129,777 14 $ 22,760.6m

4
As at May 08th 2015
Buyer Nationality during 2015 - Top 10
(No of vessels per sector)
(Total Invested Capital per sector in US$)
Sellers Nationality during 2015 - Top 10
(No of vessels per sector)
(Total Received Capital per sector in US$)
Dry Bulk Tanker Container Gas Total
Greece 51 35 13 2 107 China 27 6 3 1 38 Turkey 6 2 6 3 20
Germany - 1 12 - 17 Syria 8 - - - 10
Norway 2 13 - - 16 Denmark - 8 1 - 9 Far East 2 2 4 2 10
Singapore 1 7 1 1 10 Indonesia 2 3 - 2 7
undisclosed 13 19 8 2 70 all other 43 73 25 16 191
Total 155 169 73 29 505
Dry Bulk Tanker Container Gas Total
Greece 791.5m 1,367.1m 283.6m 460.0m 2,914.2m
China 160.7m 218.3m 12.0m 65.6m 459.9m
Turkey 45.1m 26.5m 65.0m 33.3m 171.5m
Germany - 33.8m 291.2m - 603.0m
Syria 23.0m - - - 26.4m
Norway 11.6m 457.5m - - 469.1m
Denmark - 236.3m 10.0m - 246.3m
Far East 9.5m 34.5m 17.5m - 61.5m
Singapore 4.1m 135.6m 15.8m 73.0m 228.4m
Indonesia 28.0m 26.8m - 154.0m 208.8m
undisclosed 94.8m 394.1m 46.5m - 583.0m
all other 562.8m 2,750.5m 151.7m 2,293.6m 6,231.1m
Total 1,731.0m 5,680.7m 893.1m 3,079.5m 12,203.0m
Dry Bulk Tanker Container Gas Total
Greece 32 20 3 1 61 Japan 27 16 8 4 57
Germany 3 2 36 - 55 Norway 1 12 - 2 23
Singapore 3 19 1 1 25 China 8 4 - - 14 U. K. 8 1 - - 10
Turkey 3 3 - - 12 S. Korea 4 5 1 - 10
Malaysia 1 1 - 5 7 undisclosed - - - - -
all other 65 86 24 16 231 Total 155 169 73 29 505
Dry Bulk Tanker Container Gas Total
Greece 180.8m 808.8m 13.8m 5.8m 1,021.4m
Japan 278.4m 160.9m 141.2m 101.1m 688.3m
Germany 27.5m 51.0m 302.3m - 673.5m
Norway 10.5m 400.5m - - 411.0m
Singapore 26.9m 1,562.5m - 27.0m 1,616.3m
China 67.0m 168.3m - - 235.3m
U. K. 81.5m 1.8m - - 83.3m
Turkey 28.0m 91.0m - - 127.5m
S. Korea 21.0m 358.7m 1.5m - 381.2m
Malaysia - - - 1,100.0m 1,100.0m
undisclosed - - - - -
all other 1,009.6m 2,077.3m 434.4m 1,845.6m 5,865.3m
Total 1,731.0m 5,680.7m 893.1m 3,079.5m 12,203.0m

5
Sector No Of Vessels DWT No Of Vessels DWTA. Dry Bulk
1. Small Bulk(up to 19,999 dwt)
2. Handysize(20,000 - 39,999 dwt)
3. Supramax (40,000 - 64,999 dwt)
4. Panamax (60,000 - 84,999 dwt)
5. Post Panamax (80,000 - 119,999 dwt)
6. Capesize (120,000+ dwt)
Total 302 15,344,305 214 17,016,684
B. Tanker1. Minitank
(up to 9,999 dwt)2. Product/Chemical
(10,000 - 24,999 dwt)3. MR
(25,000 - 59,999 dwt)4. Panamax
(60,000 - 79,999 dwt)5. Aframax
(80,000 - 119,999 dwt)6. Suezmax
(120,000 - 199,999 dwt)7. VLCC
(200,000+ dwt)Total 157 10,110,100 40 1,745,588
C. Container Total 165 5,666,468 40 1,148,818
D. Gas Total 35 335,012 9 121,080
E. Gen. Cargo Total<10,000dwt 286 1,182,121 44 219,386 >10,000dwt 83 1,692,478 25 624,195
Total 369 2,874,599 69 843,581
F. RoRo/Pax Total 65 604,356 8 128,912
G. Others Total 317 709,825 90 685,645
Grand Total 1,410 35,644,665 470 21,690,308
2014 2015
32 342,708 8 107,550
110 3,355,635
39 150,348 14 57,437
2 183,307 3 270,166
41 1,566,790 10 327,792
21 311,037 5 83,374
23 3,887,539 60 ########
26 2,422,244 4 382,340
8 522,004 5 333,780
13 3,811,292 2 560,865
9 1,326,385 - -
67 4,580,562 39 2,737,908
77 2,568,169
68 2,994,554 27 1,195,395
As at May 08th 2015
Sector 2015 2014 2013A. Dry Bulk 24.80 27.59 28.30B. Tanker 28.63 27.79 25.87C. Container 22.38 21.99 22.17D. Gas 32.33 30.49 31.55E. Gen. Cargo 30.54 31.35 31.55F. RoRo/Pax 38.29 34.01 33.78G. Other 37.20 35.09 35.00Total 28.44 29.92 29.93
7. VLCC
6. Suezmax
5. Aframax
4. Panamax
3. MR
2. Product/Chemical
1. Minitank
5.%
0.00%
10.%
12.5%
25.%
12.5%
35.%
6. Capesize
5. Post Panamax
4. Panamax
3. Supramax
2. Handysize
1. Small Bulk
28.04%
1.4%
18.22%
12.62%
35.98%
3.74%
Average Scrapping Age
Dry Bulk scrapping per size during 2015
Tanker scrapping per size during 2015

6
units LDT2014
Jan-14 119 444,477
Feb-14 114 377,258
Mar-14 113 247,724
Apr-14 120 326,960
May-14 142 409,260
Jun-14 129 249,479
Jul-14 95 222,941
Aug-14 149 380,515
Sep-14 105 269,022
Oct-14 96 481,476
Nov-14 107 577,931
Dec-14 121 486,167
Total 1,410 4,473,210
2015Jan-15 118 537,234
Feb-15 118 712,444
Mar-15 121 771,189
Apr-15 88 637,300
May-15 25 336,560
Jun-15 - -
Jul-15 - -
Aug-15 - -
Sep-15 - -
Oct-15 - -
Nov-15 - -
Dec-15 - -
Total 470 2,994,727
As at May 08th 2015
0
20
40
60
80
100
120
140
160
Jan
ua
ry
Fe
bru
ary
Mar
ch
Ap
ril
Ma
y
Jun
e
July
Au
gu
st
Se
pte
mb
er
Oct
ob
er
No
ve
mb
er
De
cem
be
r
UNITS 2014 2015
Vessels Scrapped per Month
Vessels Scrapped 2014 Vs 2015
Sector No Vessels DWT Avg. age LDTA. Dry Bulk Total 302 15,344,305 27.59 1,689,679 B. Tanker Total 157 10,110,100 27.79 1,110,037 C. Container Total 165 5,666,468 21.99 708,822 D. Gas Total 35 335,012 30.49 98,655 E. Gen. Cargo Total 369 2,874,599 31.35 516,677 F. RoRo/Pax Total 65 604,356 34.12 203,186 G. Others Total 317 709,825 146,154 Grand Total 1,410 35,644,665 29.92 4,473,210
Sector No Vessels DWT Avg. age LDTA. Dry Bulk Total 439 23,371,985 28.35 4,095,527 B. Tanker Total 180 14,638,400 25.87 2,362,723 C. Container Total 205 6,788,448 22.17 2,291,344 D. Gas Total 22 356,145 31.55 164,718 E. Gen. Cargo Total 481 3,658,280 31.55 914,107 F. RoRo/Pax Total 85 919,362 35.97 578,692 G. Others Total 385 1,186,575 413,442 Grand Total 1,797 50,919,195 29.95 10,820,554
Sector No Vessels DWT Avg. age LDTA. Dry Bulk Total 576 34,061,931 28.08 5,800,337 B. Tanker Total 206 13,635,059 26.51 2,323,432 C. Container Total 176 5,030,944 23.46 1,636,110 D. Gas Total 21 218,936 32.52 102,264 E. Gen. Cargo Total 530 5,152,684 30.91 1,182,901 F. RoRo/Pax Total 72 500,600 35.76 244,666 G. Others Total 400 2,881,374 806,466 Grand Total 1,981 61,481,528 29.67 12,096,176
Sector No Vessels DWT Avg. age LDTA. Dry Bulk Total 448 25,303,909 30.70 4,385,647 B. Tanker Total 235 10,730,622 29.67 1,884,898 C. Container Total 53 1,238,462 29.49 417,391 D. Gas Total 23 483,851 32.74 190,983 E. Gen. Cargo Total 621 4,902,790 33.28 1,269,398 F. RoRo/Pax Total 85 666,190 30.95 349,906 G. Others Total 470 1,640,910 581,037 Grand Total 1,935 44,966,734 32.30 9,079,260
Sector No Vessels DWT Avg. age LDTA. Dry Bulk Total 176 7,644,202 31.04 1,207,657 B. Tanker Total 356 15,815,597 28.32 2,976,091 C. Container Total 95 2,423,464 26.53 741,571 D. Gas Total 36 659,004 29.03 266,571 E. Gen. Cargo Total 488 3,280,319 34.07 988,062 F. RoRo/Pax Total 145 1,554,742 34.76 960,358 G. Others Total 509 1,806,965 670,035 Grand Total 1,805 33,184,293 31.81 7,810,345

7
As at May 08th 2015
Demo Destination during 2015 - Top 5
(No of vessels per sector)
(Total '000s DWT capacity per sector)
Sellers Nationality during 2015 - Top 5
(No of vessels per sector)
(Total '000s DWT capacity per sector)
Dry Bulk Tanker Container Gas Total
Bangladesh 60 10 4 2 97 India 38 5 15 3 93 China 45 2 9 2 76
Pakistan 40 12 - - 55 Turkey 4 1 4 1 35
Unk./Other 27 10 8 1 114 Total 214 40 40 9 470
Dry Bulk Tanker Container Gas Total
Bangladesh 5,580 204 45 9 6,033 India 3,069 134 456 25 4,189 China 2,394 71 308 83 3,175
Pakistan 4,099 759 - - 4,911 Turkey 145 31 195 1 739
Unk./Other 1,731 547 145 4 2,643 Total 17,017 1,746 1,149 121 21,690
Dry Bulk Tanker Container Gas Total
Greece 33 2 5 3 47 Russia 3 1 - 1 18 Japan 7 2 2 - 13
Germany 2 - 9 - 14 Singapore 7 1 - - 12
all other 162 34 24 5 366 Total 214 40 40 9 470
Dry Bulk Tanker Container Gas Total
Greece 3,312 50 181 10 3,642 Russia 102 4 - 4 139 Japan 1,148 34 79 - 1,281
Germany 167 - 359 - 562 Singapore 1,095 5 - - 1,136
all other 11,193 1,653 529 107 14,930 Total 17,017 1,746 1,149 121 21,690

8
AERAKIS GEORGEMOBILE: +30 6946 04 57 37
BOLIS ILIASMOBILE: +30 6937 02 65 00
DASKALAKIS GEORGEMOBILE: +30 6932 24 80 07
DRAKOGIANNOPOULOS STAVROSMOBILE: +30 6932 20 15 65
DRAKOGIANNOPOULOS SAKISMOBILE: +30 6944 88 58 08
HATZIGEORGIOU NASSOSMOBILE: +30 6944 73 33 93
KARADIMAS COSTASMOBILE: +30 6932 20 15 64
KLONIZAKIS JOHNMOBILE: +30 6948 50 55 81
KOSTOYANNIS JOHNMOBILE: +30 6932 43 39 99
MANOLAS NIKOLASMOBILE: +30 6940 63 22 56
MOISSOGLOU THEODOROSMOBILE: +30 6932 45 52 41
PAPOUIS THASSOSMOBILE: +30 6944 29 49 89
PRACHALIAS ARGIRISMOBILE: +30 6947 62 82 62
STASSINAKIS JOHNMOBILE: +30 6972 60 92 09
TOBALOGLOU EVAGELOSMOBILE: +30 6932 40 56 20
TSALPATOUROS COSTISMOBILE: +30 6932 20 15 63
VARVAROS PLUTONMOBILE: +30 6937 25 15 15
GEORGE LAZARIDISMOBILE: +30 6946 95 69 40
Maritime Research & Valuations
Sale & PurchaseCOSTAS KARAMANIS
MOBILE: +30 6941 54 14 65
MARGARITA TSALPATOUROU MOBILE: +30 6934 74 22 16
DIMITRIS KANELLOSMOBILE: +30 6945 07 47 85
PANOS ALEXOPOULOSMOBILE: +30 6944 34 66 15
ARISTOFANIS THEODOTOSMOBILE: +30 6951 79 82 89
DIMITRIS PATELISMOBILE: +30 6944 04 43 61
VASSILIS MANOLOPOULOS MOBILE: +30 6988 88 13 05
KOSVIS STRATISMOBILE: +30 6974 18 07 84
GEORGINA MAVRIKOUMOBILE: +30 697 4 18 07 84
ANGELIKI KAPPAMOBILE: +30 697 5 85 60 84
NATALIA KARAMANIMOBILE: +30 698 4 58 82 99
JOHN FLOURISMOBILE: +30 6955 80 15 03
NICOLAS PAPANTONOPOULOSMOBILE: +30 6945 23 21 88
STELLA FOUROULIMOBILE: +30 6947 35 68 48
Dry Cargo Chartering
Tanker Chartering
ALLIED SHIPBROKING INC. 48, Aigialeias Street, 4th Floor, Maroussi 151 25, Greece Tel: +30 210 45 24 500 Fax: +30 210 45 25 017/ 019 E-mail: [email protected]
ALLIED CHARTERING S.A. 48, Aigialeias Street, 4th Floor, Maroussi 151 25, Greece Tel : +30 210 42 88 100 Fax: +30 210 45 24 201
E-mail: [email protected]
E-mail: [email protected]
As at May 08th 2015

9
Disclaimer
The information contained within this report has been provided by Allied Shipbroking Inc. and Allied Chartering S.A. for general information pur-
poses.
All the information is compiled through Allied Shipbroking Inc. and Allied Chartering S.A. databases, as well as from other market sources. Despite
having taken reasonable care in the gathering, filtering and auditing of this information and believing that the information is accurate and correct,
it may still contain errors, as a lot of the views regarding market levels are partially derived from estimates and/or subject judgments while the
reported transaction activity is gathered from several sources and rumors, some of which are sometimes hard to validate in full their accuracy and
truthfulness. As such we advise that the information be taken cautiously, while advising that this information doesn’t not obviate the need to also
make further enquiries and seek further information in order to obtain a more accurate outlook. As we make no warranties of any kind, both ex-
pressed or implied, as to the completeness, accuracy, reliability or completeness of the information herein, Allied Shipbroking Inc. and its connect-
ed persons shall not be held liable to any loss or damage of any kind, including direct, indirect and/or consequential damages caused by negligence
of any kind on our part.
Any choice to rely on this information provided is strictly at the recipient’s own risk.
This report and its information is confidential and solely for the internal use of its recipients, while any re-production or re-distribution of the re-
port and its material is strictly prohibited without prior permission from Allied Shipbroking Inc.
If you wish to subscribe to this or any other report we produce, please contact us directly.
As at May 08th 2015