torsion pendulm
TRANSCRIPT
8/8/2019 Torsion Pendulm
http://slidepdf.com/reader/full/torsion-pendulm 1/12
The Torsion Pendulum in the Investigation of Polymers
J . HEIJBOER
Divis ion of Technology for Socie ty TN O
2600 A E Del f t , The Nether lands
Th e early history of the use of the torsion pendulum in the
investigation of polymers is described together with the de-
velopment of dynamic mechanical testing at TNO. Examples
are listed of studies of structure-property relationships by
means of the torsion pendulum. Techniques using supported
samples are compared with those using unsupported samples,
particular attention being paid to the advantages and restric-
tions of torsional braid analysis (TBA). Th e comprehensive
application of TBA by Professor Gillham is reviewed; a few
TBA results are compared with our torsion pendulum mea-
surements. A rheologist’s view on the so-called liquid-liquid
transition ( T l l ) n polymer melts, as observed by TBA, is
presented.
EARLY HISTORY O F THE TORSION PEND ULUM
AND DYNAMIC MECHANICAL TESTI NG
s an introduction to th e discussion of torsional braid
Aanalysis (TBA), which has been so successfully de-
veloped and applied by Professor Gillham, I will first
present a retrospective view of the use of the torsion
pendu lum, including some early uses of other dynamic
mechanical techniques for testing solid polymers.
The oldest reference I found to a torsion pendulum in
the investigation of polymers was a paper by Mooney
and Gerke (1)of the U. S . Rubber Co., who used it in the
testing of rubber. They attached a horizontal circular
disc to the lower end ofa vertical rubber str ip clamped at
its upper end, and made th e disc oscillate about a verti-
cal axis, measuring the oscillation period by noting the
passage of a mark on the edge of the disc.
The next example found, also concerning rubber, was
the inst rument of Kuhn and Kuenzle (2), at the Univer-
sity of Basel, who as early as 1947 counterbalanced th e
load on th e sample and used different moments of inertiaby applying different discs between th e suspension wire
and the sample. The motion was traced by means of a
beam of light reflected by a mirror.
Application of th e torsion pendul um to plastics began
in the early fifties. In the USA, Nielsen and Buchdahl
(3-6)of Monsanto were t he first to publish an investiga-
tion of plastics with a torsion pendulum. Their first
equipm ent was built according to Kuhn and Kuenzle’s
principles. As early as 1953 (6), they investigated four
important topics using a torsion pendu lum: th e effect of
plasticization on the glass transition of PVC; the be-
havior of‘two-phase systems (high-impact polystyrene),the effect of crystallization on th e modulus of polyethyl-
ene , and the minimum in th e damping of plastics above
their glass-transition temperature, T o . Later , Cox, Isak-
son, and Merz (7) correlated the position of this
niiniinum in polystyrene with its molecular weight.
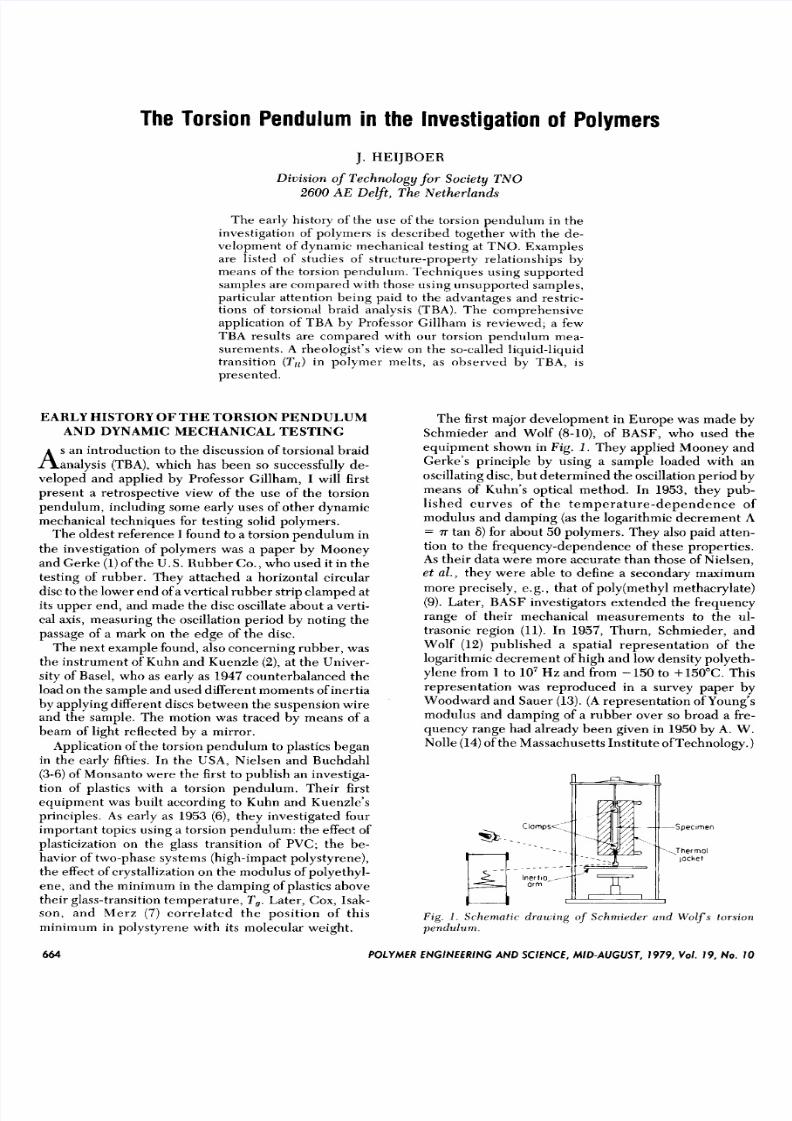
The first major development in Europe was made bySchmieder and Wolf (8-lo), of B A SF , who used the
equipm ent shown in Fig. 1. They applied Mooney and
Gerke’s principle by using a sample loaded with an
oscillating disc, but dete rmi ned the oscillation period bymeans of Kuhn’s optical method. In 1953, they pub-
l ished curves of the temperature-dependence of
modulus and damping (as the logarithmic decrem ent A= T tan 6) for about 50 polymers. They also paid at ten-
tion to the frequency-dependence of these properties.
As their data were more accurate than those of Nielsen,
et al. , they were able to define a secondary maximum
more precisely, e.g., that of poly(methy1 methacryla te)
(9). Later, BASF investigators extended t he frequency
range of their mechanical measurements to the ul-
trasonic region (11).In 1957, Thurn, Schmieder, and
Wolf (12) published a spatial representation of the
logarithmic decrem ent of high and low density polyeth-
ylene from 1 to lo’ Hz an d from -150 to +150°C. This
representation was reproduced in a survey paper byWoodward and Sauer (13). A representation of Young’s
modulus and damping of a rubber over so broad a fre-
quency range had already been given in 1950 by A. W .Nolle (14)of the Massachusetts Institute ofTechnology.)
-Specimen
,Thermal
locket
Fig. 1 . Schematic druuing of Schmieder und Wolfs torsionpendulum.
664 POLYMER ENGINEERING AND SCIENCE, MID-AUGUST, 1979, Vol. 19, NO .10
8/8/2019 Torsion Pendulm
http://slidepdf.com/reader/full/torsion-pendulm 2/12
The Tors ion Pendulum in the Inves t igat ion of Polymers
At TNO we have from the outset been interested in
measurements over a broad frequency range. For this
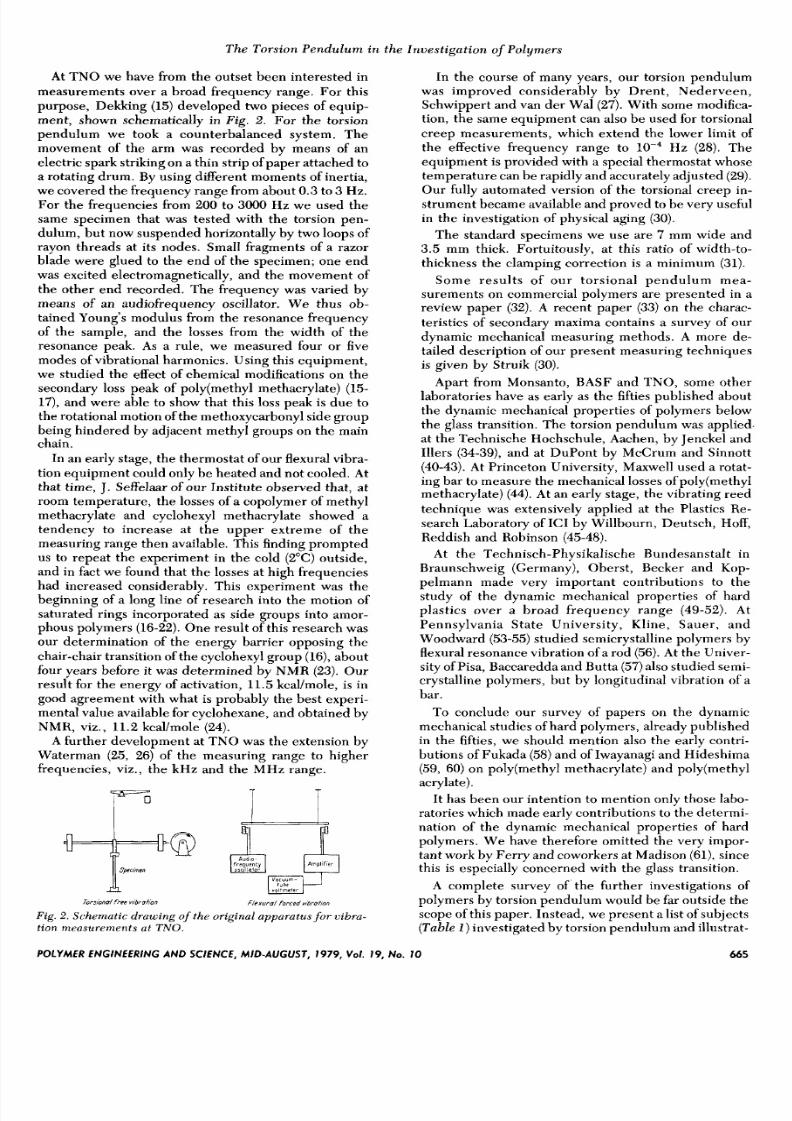
purpose, Dekking (15)developed two pieces of equip-
ment, shown schematically in F ig . 2. For the torsion
pendulum we took a counterbalanced system. The
movement of the arm was recorded by means of an
electric spark striking on a thin strip of paper attached to
a rotating drum. By using dfierent moments of inertia,
we covered the frequency range from about 0.3 to 3 Hz.
For the frequencies from 200 to 3000 Hz we used the
same specimen that was tested with the torsion pen-
dulum, but now suspended horizontally by two loops of
rayon threads at its nodes. Small fragments of a razor
blade were glued to the end of the specimen; one end
was excited electromagnetically, and the movement of
the other end recorded. The frequency was varied by
means of an audiofrequency oscillator. We thus ob-
tained Young‘s modulus from the resonance frequency
of the sample, and the losses from the width of the
resonance peak. As a rule, we measured four or fivemodes of vibrational harmonics. Using this equipment,
we studied the effect of chemical modifications on the
secondary loss peak of poly(methy1 methacrylate) (15-
17), and were able to show that this loss peak is due to
the rotational motion of the methoxycarbonyl side group
being hindered by adjacent methyl groups on the main
chain.
In an early stage, the thermostat of our flexural vibra-
tion equipment could only be heated and not cooled. At
that time, J . Seffelaar of our Institu te observed that, at
room temperature, the losses of a copolymer of methyl
methacrylate and cyclohexyl methacrylate showed atendency to increase at the upper extreme of the
measuring range then available. This finding prompted
us to repeat the experiment in the cold (2OC) outside,
and in fact we found that the losses at high frequencies
had increased considerably. This experiment was the
beginning of a long line of research into the motion of
saturated rings incorporated as side groups into amor-
phous polymers (16-22). One result of this research was
our determination of the energy barrier opposing the
chair-chair transition of the cyclohexyl group (16), about
four years before it was determined by NMR (23). Our
result for the energy of activation, 11.5kcal/mole, is ingood agreement with what is probably the best experi-
mental value available for cyclohexane, and obtained by
NMR, viz., 11.2 kcal/mole (24).
A further development at T N O was the extension by
Waterman (25, 26) of the measuring range to higher
frequencies, viz., the kHz and the MHz range.
-. TI
i I
rors iond free vb r o im Flexura/ forced wbrohon
Fig. 2. Schematic drawin g of the originul apparatusfor vibra-
t ion measurements at T N O .
In the course of many years, our torsion pendulum
was improved considerably by Drent, Nederveen,
Schwippert and van der Wal(27). With some modifica-
tion, the same equipment can also be used for torsional
creep measurements, which extend the lower limit of
the effective frequency range to Hz (28). The
equipment is provided with a special thermostat whose
temperature can be rapidly and accurately adjusted (29).
Our fully automated version of the torsional creep in-
strument became available and proved to be very useful
in the investigation of physical aging (30).
The standard specimens we use are 7 mm wide and
3.5 mm thick. Fortuitously, at this ratio of width-to-
thickness the clamping correction is a minimum (31).
Some results of our torsional pendulum mea-
surements on commercial polymers are presented in a
review paper (32). A recent paper (33)on the charac-
teristics of secondary maxima contains a survey of our
dynamic mechanical measuring methods. A more de-
tailed description of our present measuring techniques
is given by Struik (30).
Apart from Monsanto, BASF and TNO, some other
laboratories have as early as the fifties published about
the dynamic mechanical properties of polymers below
the glass transition. The torsion pendulum was applied.
at the Technische Hochschule, Aachen, by Jenckel and
Illers (34-39), and at DuPont by McCrum and Sinnott
(40-43). A t Princeton University, Maxwell used a rotat-
ing bar to measure the mechanical losses of poly(methy1
methacrylate) (44). At an early stage, the vibrating reed
technique was extensively applied at the Plastics Re-
search Laboratory of ICI by Willbourn, Deutsch, Hoff,Reddish and Robinson (45-48).
At the Technisch-Physikalische Bundesanstalt in
Braunschweig (Germany), Oberst, Becker and Kop-
pelmann made very important contributions to the
study of the dynamic mechanical properties of hard
plastics over a broad frequency range (49-52). At
Pennsylvania State University, Kline, Sauer, and
Woodward (53-55) studied semicrystalline polymers by
flexural resonance vibration of a rod (56).At the Univer-
sity of Pisa, Baccaredda and Butta (57)also studied semi-
crystalline polymers, but by longitudinal vibration of a
bar.
To conclude our survey of papers on the dynamic
mechanical studies of hard polymers, already published
in the fifties, we should mention also the early contri-
butions of Fukada (58) and of Iwayanagi and Hideshima
(59, 60) on poly(methy1 methacrylate) and poly(methy1
acrylate).
It has been our intention to mention only those labo-
ratories which made early contributions to the determi-
nation of the dynamic mechanical properties of hard
polymers. We have therefore omitted the very impor-
tant work by Ferry and coworkers at Madison (61), sincethis is especially concerned with the glass transition.
A complete survey of the further investigations of
polymers by torsion penduIum would be far outside the
scope of this paper. Instead, we present a list of subjects
(Tuble 1 ) nvestigated by torsion pendulum and illustrat-
POLYMER ENGINEERING AND SCIENCE, MID-A UGUS T, 1979, Vol. 19,NO. 10 665
8/8/2019 Torsion Pendulm
http://slidepdf.com/reader/full/torsion-pendulm 3/12
J. Heijboer
Table 1. Subjects of Torsion Pendulum Research
Reference
1. Plasticizers (5, 9, 38)2. Crystallinity, annealing (41, 62-68)
3. Crosslinking (10, 69-71)4. Polymer blends (72-82)5. High-impact homopolymers (83-87)
6. Block copolymers (88-92)
8. Side groups (19-22, 43,94-97)
9. Low-molecular weight additives (86, 98-103)
7. Interpenetrating networks (93)
10. Antiplasticization (104-107)
11. Physical aging (30)
ing its versatility. The references listed a re in tended as
examples and are not exhaustive.
The extension of the measurements down to liquid
helium temperatures (42, 96, 108) has essentially
broadened the scope of the torsion pendulum . A device
has been developed to perform torsion pendu lum mea-
surements at pressures up to 1500bar (109). The torsion
pendulum can also be used to measure fatigue proper-
ties (110).
In addition, the instrument is suitable for studying
other materials: a recent paper (111)describes a ver-
satile apparatus for measurements on metals.
Roller and Gillham (112) give a survey of equ ipmen t
for dynamic mechanical testing, including equipment
that is commercially available. An older, more detailed,
survey ofautomated equipment for the determination of
mechanical relaxation has been given by Becker (113).
In comparison with other dynamic mechanical
equipment, the conventional torsion pendulum is un-surpassed in accuracy and reliability: if the test bars are
large enough, the absolute modulus values can be ob-
tained with an accuracy of at least 2 percent. Other
dynamic mechanical equipment may yield absolute
modulus values which can be in error by 50 percent
(114).
The classical, accurate, version of the torsion pen-
dulum with free vibration has the disadvantage, how-
ever, that its operation is rather laborious and time-
consuming, particularly when several moments of iner-
tia are successively applied to obtain data at a num ber of
frequencies.
MEASURING TECHNIQU ES USING SUPP ORT ED
SAMPLES
When the amount of material available is small, or
when it cannot support a load, the conventional torsion
pendulum cannot be used. It is, therefore, not surpris-
ing that techniques for measuring supported samples
have been developed from the outset.
The easiest method, from a practical point of view,
uses flexural vibrations of thin metal strips, coated on
one side with the material to be investigated. The
method and theories have been described (1 15-118).They are more suitable for determining the damping
than the modulus and are of practical importance for
noise-abatement systems (119).
Thurn (120) has described an interest ing variation of
the method in which a quartz filament, bent into the
shape of a V, is fixed at the out er ends of its legs, and
coated by a thin layer of the material to be investigated.
The coated filament is placed in a vacuum and made to
vibrate. The method of attaching the V-shaped filament
has the advantage that its apex is constrained to vibrate
in a single plane, and so cannot describe Lissajous
figures. The amplitude of vibration of the apex decays to
half its initial value in a certain tim e. This “half time” is
measured, and is inversely proportional to the loss
modulus (in extension) of the coating. Thurn presents
data for, among others, PV C and PE.
A rather complicated method for dealing with tor-
sional vibrations of a coated st rip is described by Inoue
and Kobatake (121).
The most successful technique for measuring sup-
ported samples is no doubt that which is now called
torsional braid analysis (TBA). The first TBA inst rum ent
was developed at American Cyanamid, Stamford,
Conn ., by Lewis and Gillham (122-125). Later, when
Gillham was at Princeton University, he and his co-
workers developed the device into a highly sophisti-
cated instrumen t (126-132). An extensive review paper
(127) dating from 1972, gives as many as 49 references to
torsional braid analysis, and since then the rate of ap-
pearance of papers referring to the technique has still
increased. In many applications TBA has superseded
the conventional torsion pendulum.
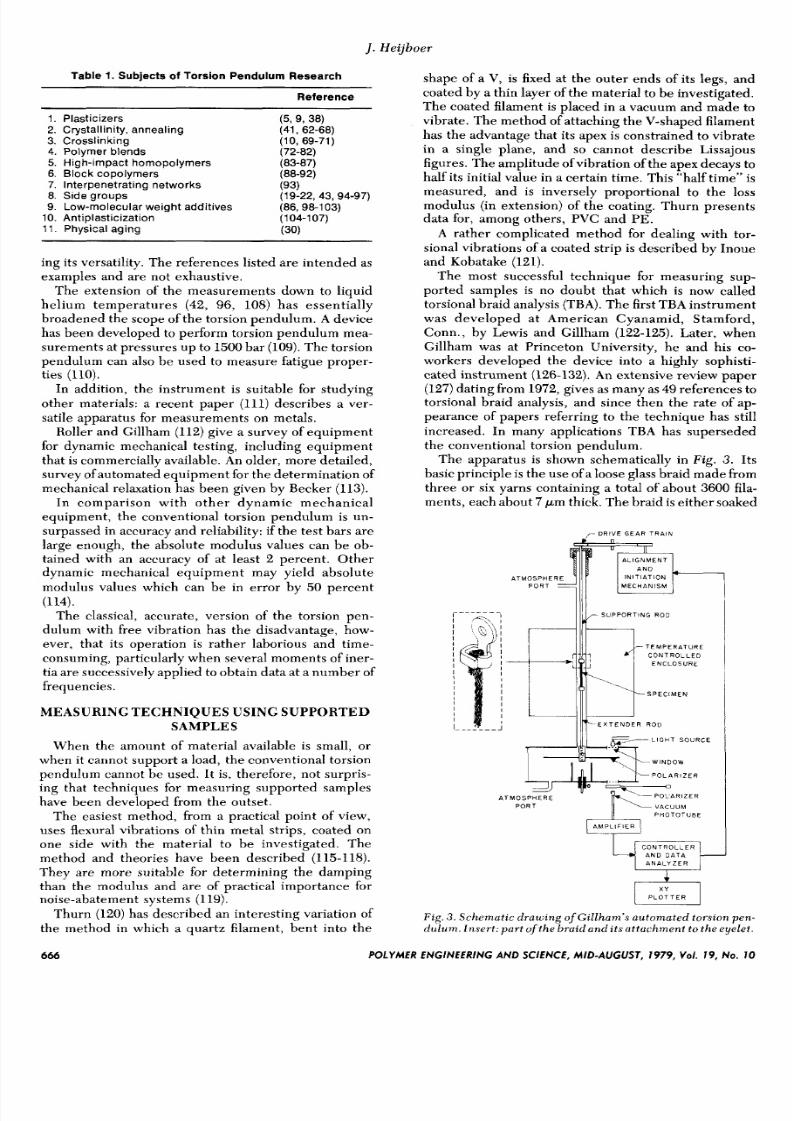
The apparatus is shown schematically in Fi g . 3. It s
basic principle is the use of a loose glass braid made from
three or six yarns containing a total of about 3600 fila-
ments, each about 7 pm thick. The braid is eithe r soaked
1- D R ! V E G E A R T R A I N
L
S U P P O R T I N G R O D
T E M P E R A T U R E
C O N T R O L L E DI i E N C L O S U R F
S P E C I M E N
P O L A R I Z E R
V A C U U M
P H O T O T U B E
A N D D A T A
A T M O S P H E R E
P O R T
Fig. . Schemuti c drawing of Gillham’s automated torsion pen-dulum. Insert: part uf the braid and its attuchment t o the eyelet.
666 POLYMER ENGINEERING AN D SCIENCE, MID-AUGUST, 1979, YO/. 19 , NO. 10
8/8/2019 Torsion Pendulm
http://slidepdf.com/reader/full/torsion-pendulm 4/12
The Tors ion Pendulum i n the lnves t iga t ion of Polymers
in a polymer solution, or dipped in a polymer melt, or
dipped in a liquid that reacts to form a crosslinked
polymer. The braid soaks up the liquid by capillary
action. The impregnated braid is used as a specimen to
be tested in a sensitive torsion pendulum. To this end it
is provided with eyelets, by the upper one of which it is
clamped to a supporting rod and by the lower one to an
extender rod, the two rods protruding from the oven of
the torsion pendulum. As the braid has a small cross-
section (diameter about 0.5mm), only a small moment of
inertia can be applied. The braid is kept in a vertical
position by a magnetic stabilizer at the lower end of the
extender rod. The torsional motion is recorded electro-
optically by the rotation of a horizontal polarizer disc,
whose transmission is a linear function of the position
angle. By virtue of this ingenious system, the specimen
can make well-defined undisturbed motions in spite of
the low moment of inertia. Moreover, this motion can berecorded electronically and is amenable to processing by
a computer. The logarithmic decrement, A = m tan 6,and the period P of the vibration are calculated. P-’ is
proportional to the rigidity G, of the system polymer-
braid. Both A and G, can be plotted on logarithmic
scales as a function of temperature or time.
One might wonder why torsional braid analysis has
taken such a wide scope. First, the method has a num ber
of inherent advantages over unsupported techniques.
There is no doubt, however, that the inventiveness and
perseverance of Professor Gillham and coworkers have
greatly contributed to the success of the technique.
Particularly their early success in fully automating the
instrument has promoted its practical application.The advantages ofTBA are listed, together with a few
restrictions, in Table 2 and will be discussed below.
First of all, the measurement requires only a small
amount of material: a few mg. This is, of course, an
advantage in investigations of exotic materials. The clas-
sical torsion pendulum requires an amount of material in
the order of 1 g.A second advantage is the simple way in which the
polymer can be converted into a suitable specimen from
a solution, melt or suspension. N o compression molding
or machining is required.
By TBA, measurements through transition ranges canbe made in a simple fashion. In the glass transition range
Table 2. Torsional Braid Analysis
Advantages
-The amount of material needed is small-The material can be applied from a solution, melt, or suspen-
-Measurements can be made through majortransition ranges,
-In situ monitoring of chemical reactions is possible-The sample rapidly approaches equilibrium with the sur-
-The support ing system has a favorable geometry
Restrictions
-The physical quantities obtained are not absolute-“Modulus curves are squashed non-linearly”-It is difficult to apply different moments of inertia
sion
even into the melt
rounding atmosphere
the conventional torsion pendulum needs additional
stiffnesses, owing to the high damping. Crystalline
polymers cannot be measured through their ent ire melt-
ing range by the conventional torsion pendulum, be-
cause in tha t range they will not support sufficient loads.
In my opinion, the most important feature of TBA is
the possibility it affords of following chemical reactions
i n situ. Examples are the gelation of a crosslinking sys-
tem starting from the liquid, and the degradation of a
high-temperature polymer until it completely disinte-
grates.
In this connection it is worth mentioning that the
small size of the sample used in TBA allows for ready
removal of volatiles and for rapid thermostating. The
sample approaches thermal, physical and thermal
equilibrium in a shorter time than does the larger sam-
ple of the conventional torsion pendulum.
One point remains to be discussed: the favorable
geometry of the special supporting system used in TBA.
The frequency of flexural vibration of a coated quartzfilament is only slightly influenced by the modulus of the
thin coating and, hence, this vibration method is unsuit-
able for the determination of the storage modulus of the
coating. By contrast, t he shear deformation of a loosely
woven impregnated braid depends much more on the
polymer than on the glass, so that the total stiffness in
shear is determined mainly by the polymer. This situa-
tion changes only when the polymer has a very low
stiffness, as, e .g . , a liquid polymer.
As far as th e determination of the modulus is con-
cerned , the torsional braid also has .a more favorable
geometry than the impregnated strip of blotting paper,which has been applied by Koleske and Faucher (133-
135). This does.not detract from the suitability of the
latter method for the determination of the glass transi-
tion temperature of low molecular weight compounds,
because the glass transition is accompanied by a very
large decrease in modulus.
The supported technique used by Fava and Chaney
(136), in which the polymer is encapsulated in a rigid
matrix of a phenolic resin, is suitable only for the location
of loss peaks and does not permit the determination of
the storage modulus.
We conclude that, among the supported techniques,TBA is particularly suited to the observation of changes
in modulus with temperature. Nevertheless, it should
be borne in mind that the method gives only relative
values and that the ratio of the relative to the real shear
modulus is not a constant. As Gillham puts it (Ref. 127,
p. 165) “the relative rigidity curves are not quantita-
tively relative and are squashed non-linearly”. This is
particularly evident in the glass transition of amorphous
polymers: going from the glassy to the rubberlike state,
the modulus decreases by a factor of the order of 1000,
whereas TBA yields only a factor of about 10 (compare,
e.g. , t he curves for the poly(methacry1ates) in Ref. (137)and Ref. (138) with those in Ref. (17) or Ref. (32);see
also, Figs. 6a and 6b).Therefore, considerable caution
should be exercised in drawing quantitative conclusions
from TBA data on G’ or the loss modulus G” = G’ tan 6
(138, 139). As we will see in the section on the liquid-
POLYMER ENGINEERING AND SCIENCE, MID-AUGUS T, 797 9, Vol. 19,No . 70 667

8/8/2019 Torsion Pendulm
http://slidepdf.com/reader/full/torsion-pendulm 5/12
J. Heijboer
liquid transition, the situation for polymer melts is not
yet settled. In the glassy region the relative modulus-
temperature curve is much less distorted. Hartmann
and Lee (140)maintain that in this region the multiplica-
tion factor between the relative and the absolute
modulus is a constant. However, a closer examination of
their Fig. 6 reveals that this conclusion is a rather op-
timistic one: in the temperature range from -160 to
+20° C , where the absolute modulus decreases by 45
percent, the multiplication factor already increases by
about 8 percent.
Another restriction of the torsional braid method is
due to the fact that the frequency changes with tempera-
ture, owing to the changing stiffness. This, however,
applies to most conventional torsion pendulums. To
obtain data at a constant frequency, one has to apply
different moments of inertia and to interpolate the re-
sults to a constant frequency. TBA usually gives data
near 1 Hz.
For a further comparison of TBA with the torsionpendulum and with the Rheovibron, we refer to Boyer
(141). In this connection it should be ment ioned that , in
spite of considerable effort (142-144), absolute modulus
values obtained by Rheovibron are less reliable than
those obtained by the conventional torsion pendulum
(114). The Rheovibron and the torsional braid instru-
ment are very suitable for finding the exact values of
transition temperatures.
EXAMPLES O F TH E APPLICATION OF
TORSIONAL BRAID ANALYSIS
In the foregoing, I have stressed the great versatility of
TBA. The number of papers describing the technique
and its results has already exceeded 100.
I shall now proceed to present a general survey of the
topics tackled by Professor Gillham and coworkers by
means of TBA, and to compare a few of their results with
our own torsion pendulum measurements.
To start with epoxy-crosslinking systems: Gillham and
coworkers (127, 145-151) have increased the under-
standing of these systems by showing that in isothermal
curing two characteristic temperatu res can be observed:
an upper temperature, above which the material only
gelates and does not vitrify, and a lower temperature,below which the material only vitrifies. Between these
temperatures the two processes, gelation and vitrifica-
tion, are seen as separate loss peaks in the time-loss
curve during curing.
The influence of catalyst content on phase separation
in rubber-epoxy systems can also be understood from
results of TBA. At this symposium, the subject of
crosslinking systems will be introduced by Professor
Gillham himself (151).
TBA has proved to be particularly useful in the study
of the high-temperature polymers. The classical exam-
ple is polybenzimidazole (127, 152). Extensive investi-gations have been made into the effect ofchemical struc-
ture on the properties of polyimides (127, 153-155).
The formation of the tough poly(chromium I11
triphosphinate) from th e brittle poly(chromium I1
biphosphinate) could also be followed by TBA (156).The
effect of various fluorinated side groups R on the melt-
ing, the glass transitions and the subglass transitions of
polyphosphazenes, [NPR2],, have been studied on
homopolymers, copolymers, and polymer mixtures
(157, 158).
Roller and Gillham (127, 159-162) have made a very
extensive study of silicon-based high-temperature elas-
tomers, containing carborane cages (CB5H5C and/or
CBIoHIoC)n their polymer chain. They studied glass
temperatures, crystallization and thermal stability in
nitrogen and air. This investigation neatly illustrates the
wealth of information that- can be obtained on small
amounts of exotic polymers by TBA. These high-
temperatu re elastomers, and also the polyimides, often
crosslink at high temperatures. This crosslinking is
unambiguously revealed by TBA. So the technique is
particularly suitable for selecting systems having op-
timum high-temperature properties.
TBA has demonstra ted an unexpected relationship
between glass temperature and structure in two series ofpolyolefins, viz.
CH3
+(cH~)nJ-~rnIR
with n = 1,2, and 3, and R = CH3 or C2H5 (127, 163).
Figure 4 assigns the T , values obtained by Martin and
Gillham to the polymers in question.
It is very surprising that in both series an increase in n
from 1 to 2 is accompanied by an increase in T,; one
would, by contrast, expect a greater flexibility of the
main chain for n = 2. However, when the number of
interceding methylene groups is increased from two to
three, T , decreases as expected. To explain the
maximum in T , for n = 2, Martin and Gillham intro-
duced the concept of intermolecular interlocking. In the
first member of each series, the side groups shield the
main chain from the approach of neighboring chains; for
n = 2, the re is just space enough for two main chains to
T IKI OF P O L Y O L E F I N S
2 5 3 I 2 6 8 1 2 78 258
I296
Fig. . Glasr temperatures T,,(i n K ) of polyolejins, de terminedby T B A a nd by the torsion pendu lum ( i n paren theses ) .
668 POLYMER EN GINEERING AND SCKNCE, MID-AUGUST, 1979, Vol. 19 , No . 70
8/8/2019 Torsion Pendulm
http://slidepdf.com/reader/full/torsion-pendulm 6/12
The Torsion Pendulum in the Investigation of Polymers
fit nicely together at contact points between th e side
groups, whereas for n = 3, there is more space left,
resulting in a higher mobility. Martin and Gillham argue
that intermolecular interlocking can also manifest itself
in a lower density.
The rise of T , (forn = 1and n = 2) found when R =
methyl is exchanged for R = ethyl is also unexpected.
However, it does fit the concept of interlocking: the
lower symmetry of the chain favors interlocking.
At TNO we measured by torsion pendulum the first
number of the second series: poly(2-methylbutene-1),
and also the corresponding polymer with an n-propyl side
group: poly(2-methylpentene-1) (164).Our T , values are
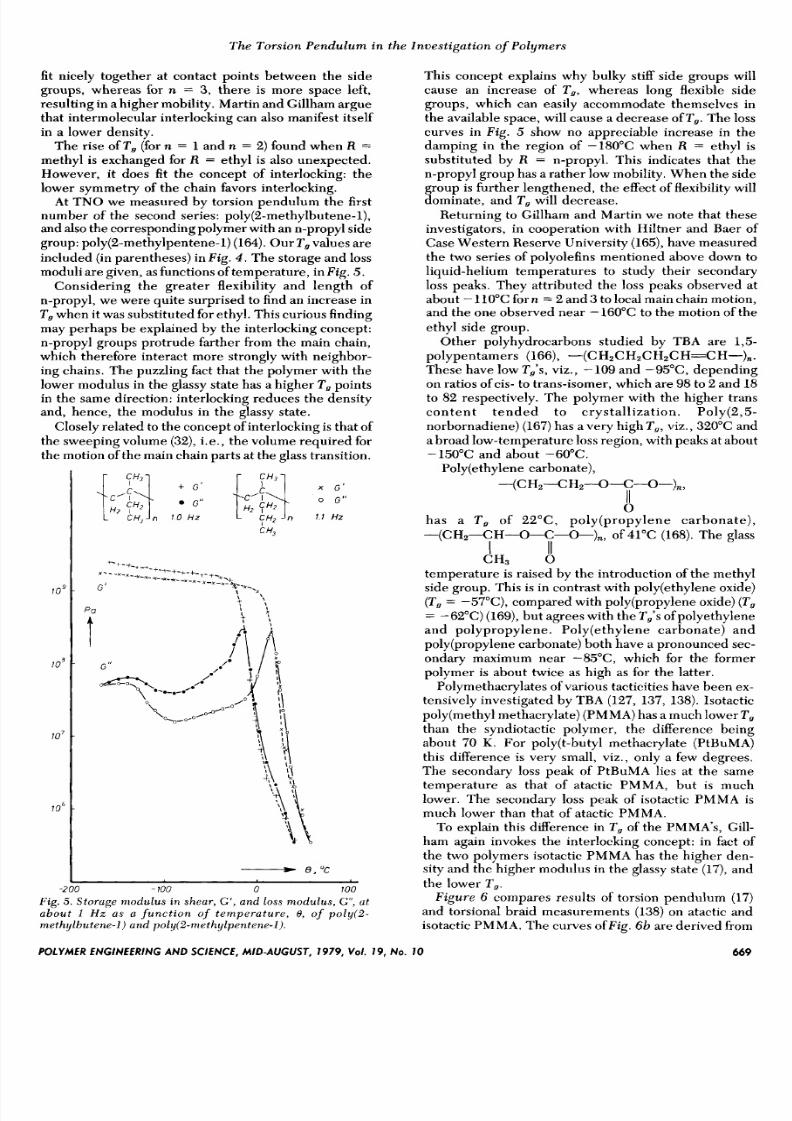
included (in parentheses) in Fig. 4 . The storage and loss
moduli are given, as functions of temperature, in Fig. 5 .
Considering the greater flexibility and length of
n-propyl, we were quite surprised to find an increase in
T , when it was substituted for ethyl. This curious finding
may perhaps be explained by the interlocking concept:
n-propyl groups protrude farther from the main chain,which therefore interact more strongly with neighbor-
ing chains. The puzzling fact that the polymer with the
lower modulus in the glassy state has a higher T , points
in the same direction: interlocking reduces the density
and, hence, the modulus in the glassy state.
Closely related to the concept of interlocking is that of
the sweeping volume (32), i.e. , the volume required for
the motion of the main chain parts at the glass transition.
l o s
10
10
lo 6
X G '
0 G "
7. 7 Hz
-,"c
I -700 0 100
Fig.5. Storuge niodulus in sheur, G', an d Loss modulus, G", u t
a b o u t I H z a s a f u n c t i o n of t e m p e r a t u r e , 8, of poly(2-
methy lbutene -1 ) und po l !y (2 -me thy lpentene - l ) .
This concept explains why bulky stiff side groups will
cause an increase of T,, whereas long flexible side
groups, which can easily accommodate themselves in
the available space, will cause a decrease of T,. The loss
curves in Fig. 5 show no appreciable increase in the
damping in the region of -180°C when R = ethyl is
substituted by R = n-propyl. This indicates that the
n-propyl group has a rather low mobility. When the side
group is further lengthened, the effect of flexibility willdominate, and T , will decrease.
Returning to Gillham and Martin we note that these
investigators, in cooperation with Hiltner and Baer of
Case Western Reserve University (165), have measured
the two series of polyolefins mentioned above down to
liquid-helium temperatures to study their secondary
loss peaks. They attributed the loss peaks observed at
about - 10°C forn = 2 and 3 to local main chain motion,
and the one observed near - 60°C to the motion of the
ethyl side group.
Other polyhydrocarbons studied by TBA are 1,5-polypentamers (166), -(C HZCHzCH2CH=C H-)n.
These have low T,'s, viz., - 09 and -95"C, depending
on ratios of cis- to trans-isomer, which are 98 to 2 and 18
to 82 respectively. The polymer with the higher trans
content tended to crystallization. Poly(2,5-
norbornadiene) (167)has a very high T,, viz., 320°C and
a broad low-temperature loss region, with peaks at about
-150°C and about -60°C.
Poly(ethy1ene carbonate),
--(CHZ--CHz--0<--0-),,
II0
has a T , of 22"C, poly(propy1ene carbonate),
-(CHz--CH-0-C-0-),, of 41°C (168). The glass
I IICH3 0
temperature is raised by the introduction of the methyl
side group. This is in contrast with poly(ethy1ene oxide)
(T, = -57"C), compared with poly(propy1ene oxide)(T ,
= -62°C) (169), but agrees with the T,'s of polyethylene
and polypropylene. Poly(ethy1ene carbonate) and
poly(propy1ene carbonate) both have a pronounced sec-
ondary maximum near -85"C, which for the former
polymer is about twice as high as for the latter.
Polymethacrylates of various tacticities have been ex-tensively investigated by TBA (127, 137, 138).Isotactic
poly(methy1 methacrylate) (PMMA) has a much lower T ,
than the syndiotactic polymer, the difference being
about 70 K . For poly(t-butyl methacrylate (PtBuMA)
this difference is very small, viz., only a few degrees.
The secondary loss peak of PtBuMA lies at the same
temperature as that of atactic PMMA, but is much
lower. The secondary loss peak of isotactic PMMA is
much lower than that of atactic PMMA.
To explain this difference in T , of the PMMA's, Gill-
ham again invokes the interlocking concept: in fact of
the two polymers isotactic PMMA has the higher den-sity and the higher modulus in the glassy state (17), and
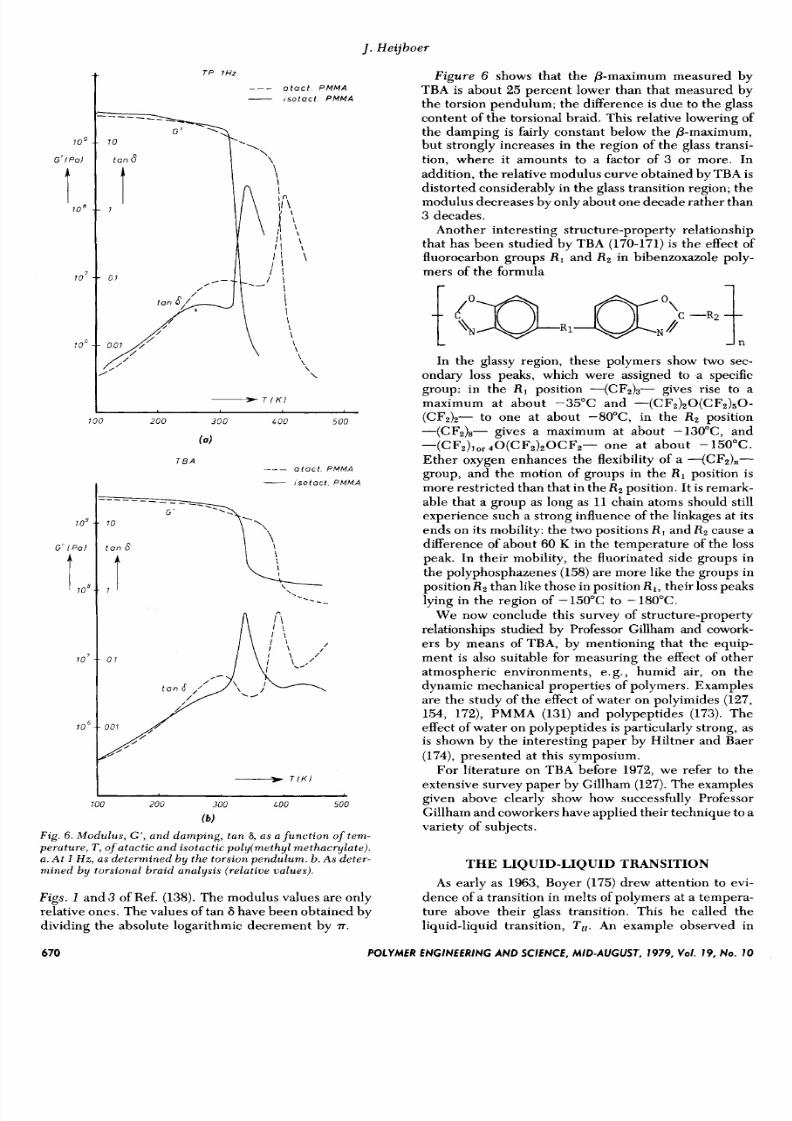
the lower T o .Figure 6 compares results of torsion pendulum (17)
and torsional braid measurements (138)on atactic and
isotactic PMMA. The curves ofFig. 6b are derived from
POLYMER ENGINEERING AND SCIENCE, MID-AUGUST, 197 9, Vol. 19, No. 10 669
8/8/2019 Torsion Pendulm
http://slidepdf.com/reader/full/torsion-pendulm 7/12
3 . Hegboer
TP 1Hz
_ _ _ o t o c t P M MA- s o t a c t P M M A
T / K I
TO O 200 3 0 0 LOO 500
( 0 )
T E A- _ _ a t a c t . P M MA
__ i s o t a c t P M M AI
l o 7 - - 01
__j l K lI100 20 0 300 LOO 500
(6)
Fig. 6. M o d u l u s , G', a n d d a m p i n g , t a n 8, a s a f u n c t i o n of t e m -
perature, T , of atac t ic and i so tac ti c po ly ime thy l me tha cy l a te ) .
a . A t 1 H z , a s d e t er m i n e d b y t h e t o r s io n p e n d u l u m . b. A s deter-mined b y tors ional bra id analysi s ( r e la t i ve ualues ).
Figs. 1 and 3 of Ref. (138).The modulus values are only
relative ones. The values of tan 6 have been obtained by
dividing the absolute logarithmic decrement by T.
Figure 6 shows that the p-maximum measured by
TBA is about 25 percent lower than that measured by
the torsion pendulum; the difference is due to the glass
content of the torsional braid. This relative lowering of
the damping is fairly constant below the &maximum,
but strongly increases in the region of the glass transi-
tion, where it amounts to a factor of 3 or more. In
addition, the relative modulus curve obtained by TBA is
distorted considerably in the glass transition region; the
modulus decreases by only about one decade rather than
3 decades.
Another interesting structure-property relationship
that has been studied by TBA (170-171) is the effect of
fluorocarbon groups R , and R z in bibenzoxazole poly-
mers of the formula
r 1
In the glassy region, these polymers show two sec-
ondary loss peaks, which were assigned to a specific
group: in the R , position -(CF&- gives rise to a
maximum at about -35°C and -(CF2)20(CFz)sO-
(CF&- to one at about -8O"C, in the R z position
-(CF&- gives a maximum at about -130"C, and
-(CFJIor 40(CF2)20CFz- one at about - 150°C.
Ether oxygen enhances the flexibility of a -(CFZ)n-
group, and the motion of groups in the R1 position is
more restricted than that in the Rz position. I t is remark-
able that a group as long as 11 chain atoms should still
experience such a strong influence of the linkages at itsends on its mobility: the two positions R , and R z cause a
difference of about 60 K in the temperature of the loss
peak. In their mobility, the fluorinated side groups in
the polyphosphazenes (158)are more like the groups in
position R z than like those in position R1, their loss peaks
lying in the region of -150°C to -180°C.
We now conclude this survey of structure-property
relationships studied by Professor Gillham and cowork-
ers by means of TBA, by mentioning that the equip-
ment is also suitable for measuring the effect of other
atmospheric environments, e.g., humid air, on the
dynamic mechanical properties of polymers. Examplesare the study of the effect of water on polyimides (127,
154, 172), PMMA (131) and polypeptides (173). The
effect of water on polypeptides is particularly strong, as
is shown by the interesting paper by Hiltner and Baer
(174),presented a t this symposium.
For literature on TBA before 1972, we refer to the
extensive survey paper by Gillham (127).The examples
given above clearly show how successfully Professor
Gillham and coworkers have applied their technique to a
variety of subjects.
THE LIQUID-LIQUID TRANSITION
As early as 1963, Boyer (175)drew attention to evi-
dence of a transition in melts of polymers at a tempera-
ture above their glass transition. This he called the
liquid-liquid transition, T I [ .An example observed in
67 0 POLYMER ENGINEERING AND SCIENCE, MID-AUGUST, 1979, Vol. 19, NO. 10
8/8/2019 Torsion Pendulm
http://slidepdf.com/reader/full/torsion-pendulm 8/12
The Torsion Pendulum in the Invest igation of Polymers
torsion pendulum measurements was the separate loss
peak in styrene-butadiene rubber near 280 K .
TBA clearly showed a loss peak in melts of mono-
disperse polystyrenes, and this observation prompted a
series of papers by Gillham, Boyer and coworkers on
studies of T t t by means of TBA (176-183).They investi-
gated monodisperse polystyrenes (176), mixtures ofmonodisperse polystyrenes (177), polystyrenes with
plasticizer (178, 179) and block-copolymers of styrene
(180, 182)with other monomers. A linear correlation has
been found between T t l and M;’, the inverse of the
number average molecular weight. Evidence for a
liquid-liquid transition has also been found in other
ways, e.g. , by DSC, by rheological measurements and
measurements of solubility and diffusion (181, 183-186).
In addition to polystyrene, many other polymers show
evidence of a Ttt-transition (181). Gillham and Boyer
(181) give a general review.
In this paper, I will restrict myself to the rheologicalaspects of T u. I will show how data obtained by TBA
compare with those obtained with a concentric-cylinder
viscometer, which measures physically well-defined
magnitudes. Den Otter (187) of TNO has developed a
very sensitive concentric-cylinder viscometer, which
enabled us to measure even the loss modulus ofcetane a t
25°C with an accuracy of 5 percent. By means of this
instrument we hoped to obtain interesting information
on the liquid-liquid transition. Den Otter (188) and
Wales (189)have published data on polystyrene (PS) and
polyethylene melts, obtained with the instrument.
To enable a good comparison to be made with dataobtained by TBA we investigated an atactic
“monodisperse” PS of Pressure Chemical Co., M , =
20,200, which had also been measured by Stadnicki,
Gillham and Boyer (176).Mr. J . L. B. de Groot at TNO
kindly performed the measurements. He immediately
ran into serious dimculties. As a rule, we fill our vis-
cometer by machining a cylindrical sample into a tube,
which exactly fits the gap of the viscometer. However,
this polystyrene sample proved to be too brittle to
machine. On the other hand its melt was too viscous to
fill the viscometer perfectly and tenaciously retained
some bubbles of air. We were therefore able to obtainaccurate data only for the loss modulus in shear, G ”, bu t
not for the storage modulus, G’. G” was measured at 9
temperatures and 3 frequencies. The reproducibility of
the results was checked by repeating a measurement at
an intermediate temperature after completion of the
series of measurements at increasing temperatures. The
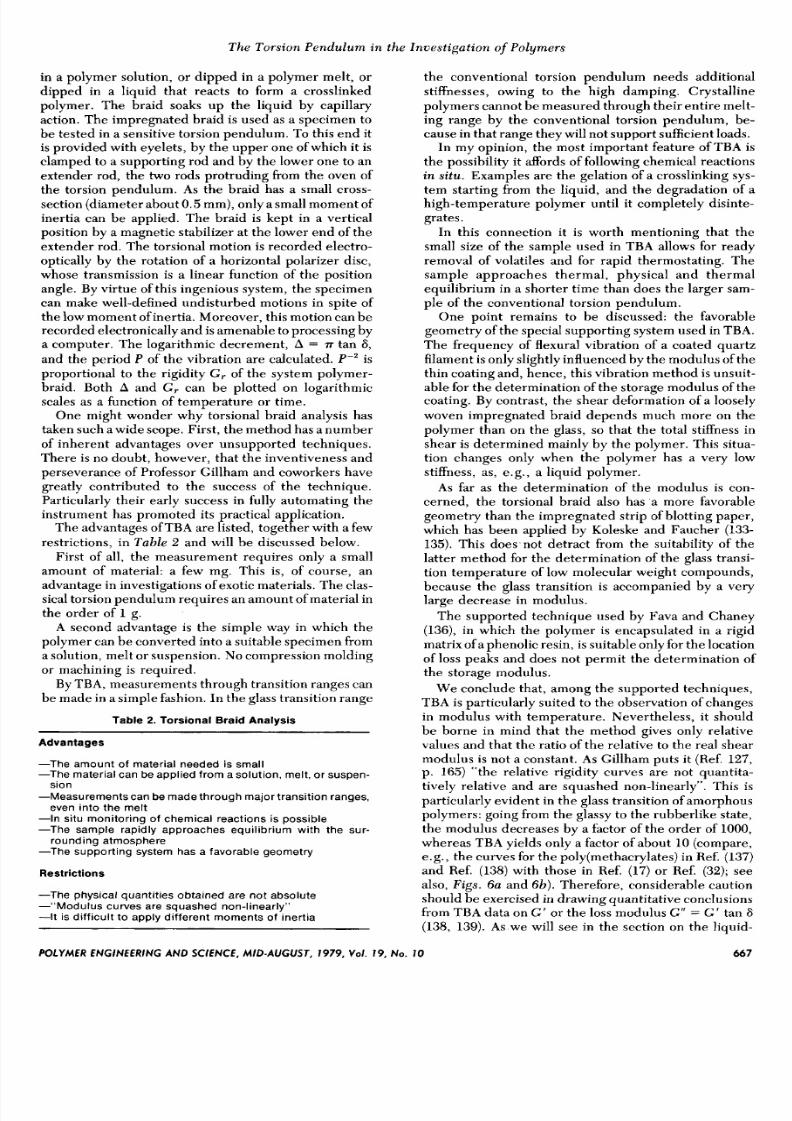
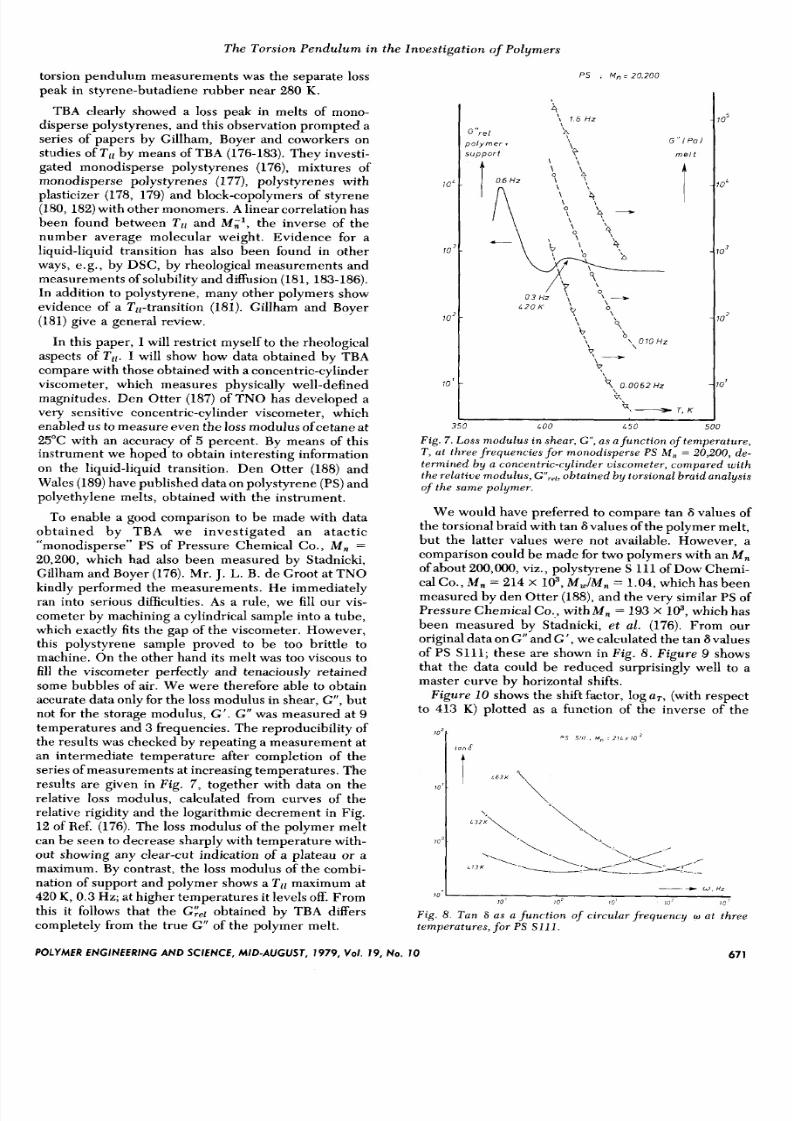
results are given in F i g . 7 , together with data on the
relative loss modulus, calculated from curves of the
relative rigidity and the logarithmic decrement in Fig.
12 of Ref. (176). The loss modulus of the polymer mel t
can be seen to decrease sharply with temperature with-
out showing any clear-cut indication of a plateau or amaximum. By contrast, the loss modulus of the combi-
nation of support and polymer shows a T ll maximum at
420 K , 0.3Hz; at higher temperatures it levels off. From
this it follows that the G&l obtained by TBA dfiers
completely from the true G ” of the polymer melt.
P 5 , M n - 20,200
m e l t
t
T. K
3 5 0 LO O L 50 5
F i g . 7 .Loss modulus in shear , G“ , s a func t ion of t emperature ,T , at three f r equenc ies fo r m onodisperse P S M , = 20,200, d e-termined by a concen tr ic -cy l inder u iscometer, compared w i ththe re la t i ve modulus , G‘lrvl,btained b y tors ional braid analys isof t h e s am e p o l y m e r .
We would have preferred to compare tan 6 values ofthe torsional braid with tan 6 values of the polymer melt,
but the latter values were not available. However, a
comparison could be made for two polymers with an M ,
of about 200,000, viz., polystyrene S 111 of Dow Chemi-
cal Co., M , = 214 x lo3,M J M , = 1.04,which has been
measured by den Otter (188),and the very similar PS of
Pressure Chemical Co,, with M , = 193 x 103, which has
been measured by Stadnicki, et al . (176). From our
original data on G“ and G ‘,we calculated the tan 8values
of PS S111; these are shown in Fig. 8. Figure 9 shows
that the data could be reduced surprisingly well to a
master curve by horizontal shifts.
Figure 10 shows the shift factor, log uT, with respect
to 413 K) plotted as a function of the inverse of the
O S S l l l , M n . 1 L x l o 3
A
Fig. 8. T a n 6 a s a f u n c t io n of circular frequen cy w at threetemperatures , fo r P S S111.
POLYMER ENGINEERING AND SCIENCE, MID-AUGUST, 1979 , Vol. 19, NO. 10 671
8/8/2019 Torsion Pendulm
http://slidepdf.com/reader/full/torsion-pendulm 9/12
J. Heijboer
P S M , z 200,000
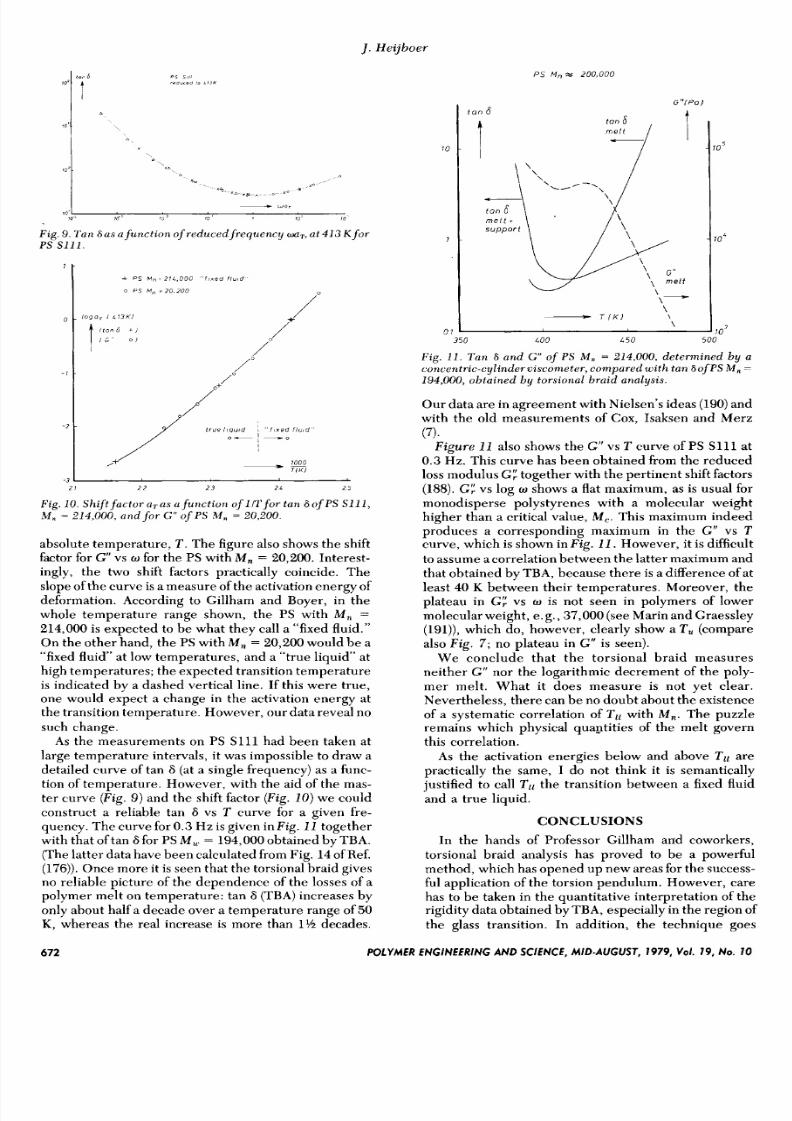
Fig . 9. Tun 6 u s u func tio n of reduced frequ ency waT, t 4 1 3 K f or
PS s111.
+ PS M n = 11.000 “f , xed f l u i d
0 PS M, =20.200
l o g o , I 1 7 3 K I
/,o/
/
“/+
2 2 2 3 24 2 5
Fig. 10. Shiftfuctora,asu function ofli? ’for tan SofPS S111,
M , = 214,000, and fo r G ” of P S M , = 20,200.
absolute temperature, T . The figure also shows the shift
factor for G” vs o or the PS with M , = 20,200. Interest-
ingly, the two shift factors practically coincide. The
slope of the curve is a measure of the activation energy of
deformation. According to Gillham and Boyer, in the
whole temperature range shown, the PS with M,, =
214,000 is expected to be what they call a “fixed fluid.”
On the other hand, th e PS with M , = 20,200would be a
“fixed fluid’ at low temperatu res, and a “true liquid” at
high temperatures; the expected transition temperature
is indicated by a dashed vertical line. If this were true,one would expect a change in the activation energy at
the transition temperature. However, our data reveal no
such change.
As the measurements on PS S l l l had been taken at
large tempera tur e intervals, it was impossible to draw a
detailed curve of tan 6 (at a single frequency) as a func-
tion of temperature. However, with the aid of the mas-
ter curve (Fig. 9) and the shift factor (Fig. 10)we could
construct a reliable tan 6 vs T curve for a given fre-
quency. The curve for 0.3Hz is given inFig. 11 together
with that oftan 6 for PS M , = 194,000obtained by TBA.
(The latter data have been calculated from Fig.14
of Ref.(176)).Once more it is seen that the torsional braid gives
no reliable picture of the dependence of the losses of a
polymer melt on temperature: tan 6 (TBA) increases byonly about half a decade over a temperature range of 50K , whereas the real increase is more than 1%decades.
10
7
07
G “ I P o l
to n 6
to n 6
1
\-
\- ( K I \
\
35 0LOO
L 5 0 50 0
Fig. 11. Tun 6 und G ” of PS M , = 214,000, determined by a
cot icentr ic-cyl inderviscometer , compared wit h tan Sof P S M , =
194,000, obtained by torsional braid analysis.
Our data are in agreement with Nielsen’s ideas (190)and
with the old measurements of Cox, Isaksen and Merz
Figure 11 also shows the GI’ vs T curve of PS S l l l at
0.3 Hz. This curve has been obta ined from the reduced
loss modulus G! together with the pertinen t shift factors
(188).G! vs log w shows a flat maximum, as is usual for
monodisperse polystyrenes with a molecular weight
higher than a critical value, M, . This maximum indeedproduces a corresponding maximum in the G ” vs Tcurve, which is shown in Fig. 11 . However, it is difficult
to assume acorrelation between the latter maximum and
that obtained by TBA, because the re is a difference of at
least 40 K between their temperatures. Moreover, the
plateau in G ! vs o s not seen in polymers of lower
molecular weight, e.g., 37,000 (see Marin and Graessley
(191)),which do, however, clearly show a T , (compare
also Fig. 7; no plateau in G “ is seen).
We conclude that the torsional braid measures
neither G” nor the logarithmic decrement of the poly-
mer melt. What it does measure is not yet clear.Nevertheless, there can be no doubt about the existence
of a systematic correlation of T I [with M,. The puzzle
remains which physical quantities of the melt govern
this correlation.
As the activation energies below and above Tl1 are
practically the same, I do not think it is semantically
justified to call T l l the transition between a fixed fluid
and a true liquid.
(7).
CONCLUSIONS
In the hands of Professor Gillham and coworkers,
torsional braid analysis has proved tobe
a powerful
method, which has opened up new areas for the success-
ful application of the torsion pendulum. However, care
has to be taken in the quantitative interpretation of the
rigidity data obtained by TBA, especially in the region of
the glass transition. In addition, the technique goes
672 P O L Y M E R E N G IN E E R IN G A N D S C I E N C E , M I D - A U G U S T , 1979, V o l . 19, N O . 10

8/8/2019 Torsion Pendulm
http://slidepdf.com/reader/full/torsion-pendulm 10/12
The Torsion Pendulum in the Investigation of Polymers
wrong if one at tem pts to use it for measuring the relative
shear modulus or relative losses of a polymer melt.
44. B. Maxwell, J . Polym. Sci., 20, 551 (1956).
45. K. Deutsch, E. A. W. Hoff, and W. Reddish,]. Polym. Sci.,
13, 565 (1954).
1.
2.
3.4.
5.
6.
7.
8.9.
10.
11.
12.
13.
14.
15.
16.
17.
18.
19.
20.
21.
22.
23.
24.
25.
26.
27.
28.
29.
30.
31.
32.
33.
34.
35.
36.
37.
38.39.
40.
41.
42.
43.
REFERENCES
M. Mooney and R. H. Gerke, Rubber C hem. Technol . , 14,
35 (1941).
W. Kuhn a n d o . Kuenzle,Helu. C hi m .A c t a ,30,839(1947).
L . E. Nielsen, ASTM Bull., 165, 48 (1950).L. E. Nielsen, Reu. Sci. Instr . , 22, 690 (1951).
L. E. Nielsen, R. Buchdahl, and R. Levreault, J . A p p l .Phys. , 21, 607 (1950).
L. E. Nielsen and H.Buchdahl, S P E J. , 9, 16 (1953).
W. P. Cox, R. A. Isaksen, and E . H. Merz,J. Polym. Sci., 44,
149 (1960).
K . Wolf, Kunststoffe, 41, 89 (1951).
K. Schinieder and K. Wolf, Kolloid-Z., 127, 65 (1952).
K. Schniieder arid K. Wolf, Kolloid-Z., 134, 149 (1953).
H . Thurn, Z. A ng ew . Phys., 7, 44 (1955).
H. Thurn, K. Schmieder, and K. Wolf, Vortrag PhysikerTagung Miinchen Mosbach Physik-Verlag (1957).
A. E. Woodward and J . A. Sauer, in “Physics and Chemis-try of the Organic Solid State,” vol. 2, p. 637, Edited by D.
Fox, hl. M . Labes & A. Weissberger Interscience Publ.(1965).A . W. Nolle, J . P o l y m . Sci., 5, 1 (1950).
J . Heijboer, P. Dekking, and A. J . Staverman, Proc. SecondInt. Cong. Rheology, Oxford 1953,p. 123,V. G. W. Harri-son, Ed., Buttenvorth, London (1954).
J . Heijboer, Kolloid-Z. , 148, 36 (1956).
J . Heijboer, Proc. Int . Conf. Non-Crystalline Solids, p. 231,
W. Prins, Ed., North Holland Publishing Co., Amsterdam(1965).
J . Heijboer, Kolloid-Z., 171, 7 (1960).
J . Heijboer, J . Polym. Sci. C , 16, 3413 (1968).
J . Heijboer, “hlechanical Properties of Glassy PolymersContaining Saturated Rings,” Doctoral Thesis, Leiden(1972).
J. Heijboer, L. C. E. Struik, H. A . Watemian, and M. P. vanDuijkeren, J . Macromol. Sci . -Phys . , B5, 375 (1971).J . Heijboer, “Midland Macromolecular Monograph No. 4,”
p. 279, Ed. D . J. Meier, Gordon and Breach Publ., New York
(1978).
F. R. Jensen, D. S . Noyce, C. H. Sederholm, and A. J.Berlin, J . A m . C h e m . Soc., 82, 1256 (1960).
F. A. L. Anet and A. J . R. Bourn,]. A m . C h e m .Soc., 89,760
(1967).
S. S . Lanting and H. W. Waterman, J . Sci. Instr . , 4, 605
(1964).
H. A . Waterman, Kolloid-Z., 192, l(1963).
C. J . Nederveen and C. W . van de r Wal, Rheol. Acta , 6,316
(1967).
C. W. van d er Wal and R. H. J . W. A. Drent, Rheol. Acta , 7,265 (1968).
C. W. van der Wal, C. J . Ncderveen, and G. A. Schwippert,Rheol . A ct a , 8, 130 (1969).
L. C. E. Struik, “Physical Aging in Amorphous Polymers
and Other hlaterials,” Elsevier Scientific Publ. Co.,Amsterdam (1978).
C. J . Xederveen and J . F. Tilstra,J. Phys. D . , A p p l .Phys., 4,
1661 (1971).
J . Heijboer, Brit . Polym. J . , 1, 3 (1969).
J. Heijboer, Znt . J . Polym. Muter. , 6, 11 (1977).
E. Jenckel, Kolloid-Z., 136, 142 (1954).
E. Jenckel and K.-H. Illers ,Z. Naturforsch.,9a, 440 (1954).
I<.-H. Illers and E. Jenckel, Kolloid-Z., 160, 97 (1958).
K.-H. Illers and E. Jenckel, Rheol. Acta, 1, 322 (1958).
K.-H. Illers and E. Jenckel, Kolloid-Z. , 165, 84 (1959).K.-H. I l lers and E. Jenckel,J. Polym. Sci., 41, 528 (1959).
N . G . McCrum, J . Polym. Sci., 27, 555 (1958).
S . G . XlcCruni, J . P oly m. Sci. , 34, 355 (1959).
K. M . Sinnott, J . A p p l . Phys., 29, 1433 (1958).
K . 11 . Sinnott, J . Polym. Sci . , 35, 273 (1959).
46. W. G . Oakes and D. W. Robinson, J . Polym. Sci., 14, 505
47. E. A. W. Hoff, D. W. Robinson, and A. H . Willbourn, J .
48. A. H. Willbourn, Trans. Faraday Soc., 54, 717 (1958).
49. G . W. Becker, Kolloid-Z., 140, 1 (1955).50. J . Koppelmann, Kolloid-Z., 144, 12 (1955); 164, 1 (1959).
51. G. W. Becker and H. Oberst, Kolloid-Z., 148,6(1950);152,
52. J . Koppelmann, Rheol . Actu, 1,20 (1958).
53. J . A. Sauer and D . E. Kline,J. Polym. Sci., 18,491 (1955).54. D. E. Kline, J. A. Sauer, and A. E. Woodward, J . Polym.
55. A. E. Woodward, J . A. Sauer, C . W. Deely, and D . E. Kline,
56. D. E. Kline, J . Polym. Sci., 22, 449 (1956).
57. M . Baccaredda and E . Butta,J. Polym. Sci . , 22,217 (1956);
58. E. Fukada,J.Phys. Soc.Japan , 6,254(1951);9,786(1954).
59. S. Iwayanagi and T. Hideshima,J. Phys.Soc. J a p a n ,8,365,
60. S. Iwayanagi, J . Sci. Research Inst . ( T o k y o ) ,49, 4, 13, 23
61. J . D. Ferry, “Viscoelastic Properties ofPolymers,” Ch. 12,
62. N . G . McCrum, ASTM Bull., 242, 80 (1959).
63. N. G . McCrum, J . Polym. Sc i . , 54, 561 (1961).64. N. G . McCrum, J . Polym. Sc i . B , 2, 495 (1964).
65. H. A . Flocke, Kolloid-Z., 180, 118 (1962).
66. K.-H. Illers and H. Breuer, J . Colloid Sci., 18, l(1963).
67. H. Thurn, Kolloid-Z., 165, 57 (1959).
68. C. G. Seefried, Jr., and J . V. Koleske, J . Tes t . Eual. , 4, 220
69. M. P. Drumni, C. W. H. Dodge, and L. E. Nielsen, Ind.
70. L. E . Nielsen, J . A p p l . Polym. Sci . , 8, 511 (1964).71. P. Mason, Polymer, 5, 625 (1964).
72. S . G . Turley,]. Polym. Sci. C , 1, 101 (1963).
73. R. Buchdahl and L. E. NielsenJ. Polym. Sci., 15, 1 (1955).
74. T. T. Jones, J . Polym. Sc i . C, 16, 3845 (1968).
75. E. R. Wagner and L .M. obeson, Rubber C hem. Technol . ,
76. G . Cigna, J . Appl . Po lym. Sci., 14, 1781 (1970).77. H. Keskkula, S. G . Turley, and R. F. Boyer,J. A p p l . P o l y m .
78. L. Morbitzer, D. Kranz, G . Hunime, and K. H. Ott,]. A p p l .
79. H. Keskkula and S. G . Turley, Polymer, 19, 797 (1978).
80. B. Rauer, J. Hennig, and G . Schreyer,Angew. Makromol.
81. C. F. Hammer, Macromolecules, 4, 69 (1971).
82. I,. M. Robeson, J . Polym. Sc i . B , 16, 261 (1978).
83. H. Oberst, Kunststoffe, 52, 4 (1962).
84. J . Heijboer, J . Polym. Sci. C, 16, 3755 (1968).
85. J. E. Kurz, J . C. Woodbrey, and M. Ohta,J. Polym. Sci.A-2 ,
86. G . A l l e n , J . McAinsh, and G . X I . Jeffs, Polymer, 12, 85
87. L. X l . Robeson, A. G . Farham, and J . E. McGrath, A p p l .
88. M . Baer, J . Polym. Sci. A , 2, 417 (1964).
89. A. Rornanov, Polymer, 9, 455 (1968).
90. R. P . Kanibour, J . P o l y m . Sci. B , 7, 573 (1969).
91. C. G . Seefried, J . V. Koleske, and F. L. Critchfield, J . A p p l .Polym. Sci. , 19, 2493, 2503, 3185 (1975).
92. R . E. Cohen and N. W. Tschoegl, Trans. Soc. Rheol., 20,
153 (1976).
93. D. Kaplan arid N . W. Tschoegl, Polyn i . Eng. S c i . , 15,343
(1975).
94. H. A. Waterman, L. C . E. Struik,J . Heijboer, and M . P. vanDuijkeren, “Amorphous Materials,” p. 29, Third Int. Conf.
(1954).
P o l y m . S c i . , 18, 161 (1955).
31 (1957).
Sci., 22, 455 (1956).
J. Colloid Sci., 12, 363 (1957).
31, 189 (1958).
368 (1953).
(1955).
2nd Ed., J . Wiley I% ons, Inc., New York (1969).
(1976).
Eng. Chem . , 48, 7 6 (1956).
43, 1129 (1970).
Sci., 15, 351 (1971).
Polym. Sci., 20, 2691 (1976).
C hem . , 11, 145 (1970).
8, 1169 (1970).
(1971).
Polym. Symp. , 26, 373 (1975).
POLYMER ENGINEERING AND SCIENCE, MID-AUGUST, 1979, YO/. 19, NO. 10 673
8/8/2019 Torsion Pendulm
http://slidepdf.com/reader/full/torsion-pendulm 11/12
J . Heijboer
Physics Non-Cryst. Solids, Sheffield 1970,Ed. R. W. Doug-
la s and B. Ellis, Wiley (1972).
95. J . Kolarik, Znt. J . Polym. Muter . , 1, 125 (1972).
96. M. Pineri, Polymer, 16, 595 (1975).97. C. G . Seefried, Jr. and J . V. Koleske, J . Polym. Sci. Phys.,
98. K.-H. Illers, Makromol. Chem., 38, 168 (1960).
99. J . Kolarik and J. Janacek, J. Polym. Sci. C, 16, 441 (1967).
100. J . Janacek, J . Polym. Sci. C, 23, 373 (1968).101. J . Kolarik and J . Janacek,]. Polym. Sci.A-2, 10, 11 (1972).
102. J . Kolarik and M. Stol, Polym. J . , 5, 158 (1973).
103. P . W . van Hoeve, “The Effect of Additives of LowMolecular Weight on the Mechanical Damping of SomePolymers,” Thesis, Leiden (1970).
14, 663 (1976).
104. L. Bohn, Kunststoffe, 53, 826 (1963).
105. G. Pezzin, G. Ajroldi, and C. Garbuglio, ]. A p p l . Polym.
106. L. 51. Robeson, Polym. Eng. Sci., 9, 277 (1969).
107. L. XI. Robeson and J . A. Faucher, J . Polym. Sci. B , 7, 35
108. C. D . Armeniades, I. Kuriyama, J . M . Roe, and E. Baer, J .
109. E. J. Parry and D. Tabor,J. Phys. D, 6, 1328 (1973).
110. H. Bartisch an d D. R. G. Williams,J. A p p l . Polym. Sci.,22,
111. D.W. James, J . D. Stott, and B. Emery,]. Test. Eual. , 5,270
112. M. B. Roller and J . K. Gillham, J . C o a t . Technol., 50, 57
113. G. W . Becker, Materialpruefung, 12, 5 (1970).
114. H. M. i and J. H. Magil, Polymer, 19, 829 (1978).
115. W . P. van Oort, Microtecnic, 7, 246 (1953).
116. H. Oberst and K . Frankenfeld, Acustica, 2, Beiheft 4 AB
117. H. Oberst, G. W. Becker, and K. Frankenfeld,Acustica, 4,
118. F. Schwarzl,Acustica, 8, 164 (1958).
119. H. Oberst, L. Bohn, and F. Linhardt,Kunststoffe, 51, 495
120. H. Thurn, Materialpruefung, 5, 114 (1963).
121. Y. Inoue and Y . Kobatake, Kolloid-Z., 160, 44 (19.58).
122. A. F. Lewis and J . K. Gillham, J . Appl. Polym. Sci.,6,422
123. A. F. Lewis and J . K. Gillham,]. Appl. Polym. Sci.,7, 685
124. J . K. Gillham and A . F. Lewis,]. Appl. Polym. Sci.,7,2293
125. J . K. Gillham and A. F. Lewis, J . Polym. Sci. C, 6, 125
126. J . K. Gillham and M . B. Roller,Polym. Eng. Sci., 11, 295
127. J . K. Gillham, Crit. Reu. Macromol. Sci., 1, 83 (1972).128. J. K. Gillham, AZChE ]., 20, 1066 (1974).
129. J. K. Gillham, ]. Macromol. Sci.-Phys., B9, 209 (1974).
130. C. L. M . Bell, J. K. Gillham, and J . A. Benci, Prepr. Am.
Chem. Soc., Diu. Polym. Chem., 15,KO. ,542 (1974).
131. Y . Hazony, S. J . Stadnicki, and J . K. Gillham, Prepr. Am.
Chem. Soc., D i u . Polym. Chem., 15, N o . 1, 549 (1974).
132. S. J . Stadnicki, J . K. Gillham, and Y . Hazony, Prepr. Am.
Chem. Soc., Diu. Polym. Chem. , 15, N o. 1, 556 (1976).
133. J . A. Fauch er and J . V. Koleske,Phys. Chem. Glasses, 7,202
(1966).
134. J . V. Koleske and J . A. Faucher,Phys. C h e m .Glasses, 15,65
(1974).135. J . V. Koleske and J . A. Faucher, This symposium; Prepr.
Am. Chem. Soc., D i c . Org. Coat.Plast. Chem.,N o . 38,355
(1978).
136. R. A. Fava and C. E. Chancy,]. Appl. Polym. Sci., 21,791(1977).
137. E. Kiran, J . K. Gillham, and E. Gipstein, J . Macromol.
Sci.-Phys., B9, 341 (1974).
138. J . K. Gillham, S. J. Stadnicki, and Y . Hazony, J . Appl.
Polym. Sci., 21, 401 (1977).
139. Y . Hazony, Thi s symposium; Prepr. Am. Chem. Soc. , D i u .
Sci., 11, 2553 (1967).
(1969).
Macromol. Sci.-Phys., B1, 777 (1967).
467 (1978).
(1977).
(1958).
182 (1952).
Beiheft 1, 433 (1954).
(1961).
(1862).
(1963).
(1963).
(1964).
(1971).
Org. Coat. Plast. Chem., N o . 38, 296 (1978).
(1977).
140. B. Hartmann and G . F. Lee,]. Appl. Polym. Sci., 21, 1341
141. R. F. Boyer, ]. Macromol. Sci.-Phys., B9, 187 (1974).
142. D. J . Massa, J . Appl. Phys., 44, 2595 (1973).143. D. J . Massa, J . R. Flick, and S. E. B . Petrie, Prepr. Amer.
Chem. Soc., Diu. Org. Coa t . P las t. Chem., 35 , N o . 1,371
(1975).
144. A . F. Yee and M. T. Takemori,J. Appl. Polym. Sci.,21,2597(1977).
145. P. G. Babayeski and J . K . Gillham,]. Appl. Polym. Sci., 17,
2067 (1973).
146. J . K. Gillham, J. A. Benci, and A. Noshay,]. A p p l . Polym.
Sci., 18, 591 (1974).147. J . K . Gillham, J . A. Benci, and A. Noshay,J. Polym. Sci. C ,
46, 279 (1974).
148. C. A. Gland t and J . K. Gillham,Prepr. Am. Chem.Soc., D i u .Polym. Chem. , 16, N o. 1, 694 (1975).
149. J . K. Gillham, Polym. E n g . Sci., 16, 353 (1976).
150. J . K. Gillham, C. A . Glandt, and C. A. McPherson, in“Chemistry and Properties of Crosslinking Polymers,” p.491, Ed . S. S. Labana, Academic Press, New York (1977).
151. J. K. Gillham, This symposium; Prepr. Am. Chem. Soc.,
D i u . Org. Coat. P las t . Chem., N o. 38, 221 (1978).152. J . K. Gillham, Polym. E n g . Sci.,7, 225 (1967).
153. J . K. Gillham and K. C. Glazier, J . Appl. Pdy m. Sci., 16,
154. J. K. Gillham, K. Hallock, and S. . Stadnicki, ]. Appl.
155. J . K. Gillham and H. C. Gillham, Polym. E n g . Sci.,13,447
156. J. K. Gillham, J . Appl. Polym. Sci., 16, 917 (1972).
157. T.&I.onnelly, Jr. and J. K . Gillham,]. A p p l . Polym. Sci.,
158. T. hl . Connelly, Jr . and J . K. Gillham,]. A p p l . Polym. Sci.,
159. hi . B. Roller and J . K. Gillham, J . A p p l . Polym. Sci., 16,
160. M. . Roller and J . K. Gillham, J. Appl. Polym. Sci., 17,
161. M . B. Roller and J. K . Gillham, Polym. E n g . Sci., 14, 565
l@2. X I . A. Roller, C. K. Schoff, an d J . K . Gillham, Soc . Plast.
163. J . R. Martin and J . K. Gillham,]. Appl. Polym. Sci., 6,2091
164. 0.E. van Lohuizen and K . S . d e Vries,]. Polym. Sc i . C, 16,
165. A. Hiltner, E. Baer, J . R. Martin, and J . K. Gillhani, J .
166. J. K. Gillham and J . A . Benci,]. Appl. Polym. Sci., 18,3775
167. hl. B. Roller, J . K. Gillham, and J . P. Kennedy, J . A p p l .
168. K. Udipi and J. K. Gillham, J . Appl. Polym. Sci., 18, 1575
169. B. E. Read, Polymer, 3, 529 (1962).
170. C. K. Schoff a ndJ . K. Gillham,]. A p p l . Polym. Sci . , 19,2731
(1975).
171. J . K. Gillham andC . K . Schoff,] .Appl.-Polym. Sci., 20, 1875
(1976).
172. Y.Ozari, R. H . Chow and J . K. Gillham, Prepr. Am . Che m.
Soc., D i u . Polym. Chem., 18, N o . 1, 649 (1977).
173. R. R. Krug and J . K. Gillham,]. Appl. Polym. Sci., 17,2089
(1973).
174. A. Hiltner and E. Baer,This symposium;Prepr.Am. Chem.
Soc., D i u . Org. C o a t . Plast. Chem., So. 38, 302 (1978).
175. R. F. Boyer, Rubber Chem . Technol., 26, 1303 (1963).176. S. J. Stadnicki, J . K . Gillham, and R . F. Boyer, J . Appl.
177. C. A. Glandt, H. K. Toh, J . K. Gillham, and R. F. Boyer, J .
178. J . K . Gillham,J . A. Benci, and R. F. Boyer,Polym.Eng. Sci.,
2153 (1972).
Polym. Sci., 16, 2595 (1972).
(1973).
19, 2641 (1975).
20 , 473 (1976).
3073, 3095, 3105 (1972).
2141, 2623 (1973).
(1974).
Eng., ANTEC, 20, 671 (1974).
(1972).
3943 (1968).
Macromol. Sci.-Phys., B9 , 255 (1974).
(1974).
Polym. Sci., 17, 2223 (1973).
(1974).
Polym. Sci.,20, 1245 (1976).
Appl. Polym. Sci.,20, 1277 (1976).
16, 57 (1976).
674 POLYMER ENGlNEERlNG AND SCIENCE, MID-AUGUST, 1979, Vol. 19, No . 10
8/8/2019 Torsion Pendulm
http://slidepdf.com/reader/full/torsion-pendulm 12/12
The Torsion Pendulum in the Investigation of Polymers
179. J . K. G i l l h a m a n d R. F. B o y e r , P r e p r .A m . C h e m . Soc., D i u . 185. J. B. E n n s a n d R. F. Boyer, P r ep r . A m . C hem . Soc., D i u .Polym. Chem . , 17, No. 2, 171 (1976). Polym. Chem. , 18, No. 1, 629 (1977).
180. J . K. i l lham and R. F. Boyer ,Prepr . Am . Chem .Soc., D i u .Polym. Che m. , 18, No. 2, 468 (1977).
181. J . K. Gi l lham an d R. F. Boyer,J. Mncromol. Sci.-Ph ys.,B13,
497 (1977).
182. J. K. Gi l lham an d R . F. Boyer, Th i s sympos ium; Prepr . Am .C h e m . S a c . , D i u . Org. Coat . P las t. Che m. , No. 38, 366
(1978).183. R. F. Boyer , Th is sympos ium;Prepr. Am . Chem . S O C . ,D i u .
Org. Coat . P last . Chem . , No. 38, 379 (1978).
184. R. F. Boyer and J . K. Gil lham, P r ep r . A m . C hem .Soc., D i u .Polym. Chem . , 18, N o. 1, 623 (1977).
186. R. F. Boyer , J . B. E n n s a n d J . K . Gi l lham,Prepr . A m . C h e m .
187. J . L. d e n O t t e r, Rheol. Actu , 8, 355 (1969).
188. J . L. d e n O t t e r , “ D y n a m i c P r o p e r t i e s of Som e Po lymer icSys t ems,” D oc to ral Thes i s , L e iden (1967).
189. J. L. S. Wales, Pure Appl . Chem . , 20, 331 (1969).
190. L. E. Nie l sen , Polym. E n g . Sc i . , 17, 713 (1977).
191. G.Mar in and W. W . Graessley,Rheol . Actu, 16,527(1977).
Soc., D i u . Polym. Chem . , 18, N o. 2, 462 (1977).