tornado occurrences in the united states - national …. department of commerce frederick h....
TRANSCRIPT

U.S. DEPARTMENT OF COMMERCE FREDERICK H. MuELLER, Secretary
WEATHER BUREAU F. W. REICHELDERFER, Chief
TECHNICAL PAPER NO. 20
Tornado Occurrences
in the United States
LAURA V. WOLFORD Office of Climatology
WASHINGTON, D.C.
Revised 1960
For sale by the Superinten-dent of Documents, U.S. Government Printing Office, Washington 25, D.C. • Pcice 45 cents


CONTENTS
Preface .. Sources and Reliability of Data
Tornadoes of Early Years.
Tornado Characteristics
Pressure.
Rates of Travel and Internal Wind Speeds.
Direction of Movement
Length and Width of Paths
Tornado Statistics.
Distribution of Tor-nado Occurrences
Loss of LifeQ
Property Damage
Frequency and Time of Occurrence.
Tornado Forecasting
Tornado OdditiesQ
Tornado Occurrences in Major Cities and Selected Communities.
Observer's Impressions of Tornadoes
Tornado Groups or Families.
Waterspouts
Tornadoes in Other Countries.
References.
Tables
Table lQ-~Some Outstanding Tornadoes, 1876-1958
Table 2.--Number of Tornadoes, Days, Deaths, and Damage for States and
Page
1
1
2
2
3
4
4
5
6
6
6
6
7
7
8
10
11
12
12
13
14
16
United States by Years, 1916-58 20
Table 3.--Number of Tornadoes, Days, Deaths, and Damage for United States by Months,for Years 1916-58 30
Table 4.--Total Number of Tornadoes and Tornado Days by States, and United States Totals and Means» 1916-58Q 34
Table 5.--Total Number of Tornadoes Beginning During the Specified Hours, 1916-58 35
Table Sa--Tornadoes Associated with Passage of Tropical Storms, 1916-58 36
CONTENTS.--Continued
Page
Table 7.--Tornado Occurrencesm Major Cities and Selected Communities 38
Table 8.--Selected Families of Tornadoes, 1916-58 • • 0 Q 40
Table 9.--List of More Damaging Tornadoes in Each State, 1916-58. 41
Table 10.--Number of Waterspouts and Days for States and United States, 1948-58 • • • • • • • • • • • • • • 48
Table 11.--Number of Funnels Aloft and Days by Months and Years in United States, 1953-58. • • • • • • • • • • • • • • 48
Table 12.--Number of Funnels Aloft for States and United States by Months, 1953-58 • • • • • • • • • • • • • • • 49
Figures
Figure I.--Automatic Records of Pressure, Temperature, Rainfall, Wind Direction, and Wind Speed at St. Louis, Mo., May 27, 1896 3
Figure 2.--Barogram Trace at Dyersburg, Tenn., March 21-22, 1952 4
Figure 3.--Tornado Rose for the United States 5
Figure 4.--Mean Monthly Number of Tornadoes in the Alabama-Florida-Georgia-Louisiana-Mississippi Area, 1916-58 ·• • • • • • • 50
Figure 5o--Mean Monthly Number of Tornadoes in the Arkansas-Kansas-Mis-souri-Oklahoma Area, 1916-58. o • • • • o o •• o o 50
Figure 6o--Mean Monthly Number of Tornadoes in the Iowa-Minnesota-Nebraska-North Dakota-South Dakota Area, 1916-58 •• o o 50
Figure 7.--Mean Monthly Number of Tornadoes in the United States, 1916-58 50
Figure So--Mean Monthly Number of Tornado Days in the United States, 1916-58 ••••• 0 •• 0 • • • • • • • • • • • • • • 50
Figure 9.--Mean Monthly Number of Tornadoes per Tornado Day in the United States~ 1916-58 • • • • • • • • • • • • • • • • • • 50
Figure lOo--Total Number of Tornadoes and Tornado Days Recorded on Each Date of the Year in the United States, 1916-58. • • • • 51
Figure lL--Percentage of Tornadoes Beginning During the Specified Hours in the Alabama-Florida-Georgia-Louisiana-Mississippi Area~ 1916-58 55
Figure 12o--Percentage of Tornadoes Beginning During the Specified Hours in the Arkansas-Kansas-Missouri-Oklahoma Area, 1916-58. • • • 55
Figurela--Percentage of Tornadoes Beginning During the Specified Hours m the Iowa-Minnesota-Nebraska-North Dakota-South Dakota Area, 1916-58 e e e 0 o 0 e 0 0 e e o o e 0 0 G 8 Q 0 0 0 56
Figure 14.--Percentage of Tornadoes Beginning During the Specified Hours in the Entire United States, 1916-58 • 56
Figure !~--Tornadoes by 2 Degree Squares, 1916-53 57
Figure 16.--Tornadoes by 1 Degree Squares, 1953-58 58

CONTENTS.--Continued
Charts
Chart 1.--Tracks of January Tornadoes, 1916-58. . Chart 2" --Tracks of February Tornadoes, 1916-58 . Chart 3 "--Tracks of March Tornadoes, 1916-58., 0
Chart 4.,--Tracks of April Tornadoes, 1916-58. . . Chart 5.--Tracks of May Tornadoes, 1916-58. . Chart 6.--Tracks of June Tornadoes~ 1916-58 . Chart 7. --Tracks of July Tornadoes~ 1916-58 . Chart B.--Tracks of August Tornadoes, 1916-58 . Chart 9 .--Tracks of September Tornadoes, 1916-58.
Chart 10.- -Tracks of October Tornadoes, 1916-58. . Chart 11.--Tracks of November Tornadoes, 1916-58 . Chart 12. --Tracks of December Tornadoes, 1916-58 0
Chart 13.--Tracks of All Tornadoes, 1953-58. • • •
. .
. . 0
. . . . . . . . . . . .
. . . . . . . . .
. .
. . 0
. . .
. Q .
Q
. Q
Page
59
60
61
62
63
64
65
66
67
68
69
70
71


Tornado Occurrences in the United States Laura V. Wolford
Office of Climatology U. s. Weather Bureau, Washington, D. C.
PREFACE This revision of the first edition of
Technical Paper No. 20 extends the data to include the years 1951 through 1958 and contains additional textual material, tabulations, and charts.
The primary purpose of this publication is to bring up to date the available records of all tornadoes in the United States in order to provide more useful information to the public and to business, commerce, and industry in general regarding the usual frequency of tornado occurrences in the different sections of the country.
The systematic recording and reporting of tornadoes by the Weather Bureau began in 1916. The detailed statistics presented herein relative to areal distribution, hours of occurrence, loss of life, property damage, and frequency of occurrence are based on the 43-year period beginning with 1916 and extending through 1958. Funnel clouds aloft and waterspouts are presented in separate tabulations and are not included in the tornado summarizations.
It is impractical to make an accurate comparison of recent tornado data with reports of previous years~ particularly in regard to number of tornadoes, tornado days,
and property damage, because of population growths, increased alertness to and general interest in these storms~ advances in observational techniques~ and changes in monetary value of property.
Grateful acknowledgment is made to State Climatologists and other U. S. Weather Bureau personnel at field stations; to the tens of thousands of cooperative observers and other public spirited persons over the country who, through their interest and cooperative efforts for several generations, have provided the basic data; to Dr. Helmut E. Landsberg for general guidance and review; to Messers Lilburn H. Seamon, Robert W. Schloemer, and Milton L. Blanc for valuable comments; to Miss Marjorie A. Clark of the Weather Bureau Library for assistance in research; to the Drafting Section of the Weather Bureau for drafting the figures and charts; and to Mrs. Lola M. Starbuck and Mr. William T. Pullen for assistance in the preparation of copy for publication. Planning and preparation of this publication were under the direct supervision of Mr. John L. Baldwin, Chief of Domestic Area Section, Office of Climatology.
SOURCES AND RELIABILITY OF DATA The tornado statistics presented herein
are based upon regular monthly and annual reports of tornadoes prepared by Weather Bureau State Climatologists or Meteorologists in Charge responsible for reporting such storms in specific areas (usually a single State, but in some cases consisting of two or more Sta 1es). During the 43-year period (1916-1958) covered by this summary, all State Climatologists and Meteorologists in Charge were operating under instructions to depend upon only the most reliable and unbiased sources of these data. The princ ipa 1 sources have been loca 1 Weather Bureau offices, the American National Red Cross Cooperative Weather Observers, State In~ surance Companies, and Federal, State, County, and Municipal offices. Weather Bureau officials responsible for reporting these data are instructed also to investigate and fully verify reports of all unusual
storms such as tornadoes before classifying them. The storms recorded here as tornadoes were so classified only if the characteristic funnel cloud was plainly seen, or subsequent examination of the destruction clearly indicated the characteristic whirling motion of the winds, the bursting effects on buildings, or the sucking up of objects into the air as the storm passed. It is realized, of course, that the judgment of field classifiers of such storms is not infallible, especially in borderline cases. It is also true that some tornadoes occur in areas either uninhabited or where there is no vegetation to indicate the occurrence, so that some have gone unrecorded. It is evident, however, that the increase in the number reported during ~ecent years, particularly since 1951, is due to increased public awareness of tornadoes, establishment of extensive
1

'reporting and warning networks, improved methods of tracking tornadoes, better communication facilities, and increases in population.
A table of monthly severe storm reports, including tornadoes, was published in the Monthly Weather Review from June 1921 through December 1949. Since 1949, these reports have been published in the Climatological Data National Summar~. Annual summaries of tornado occurrences were published in the Report of the Chief of the Weather Bureau from 1916 through 1934, in the United States Meteorological Yearbook from 1935 through 1949, and in the annual
issue of the Climatological Data National Summary from 1950 through 1958. These publications constitute the principal sources of data for this summary. (Beginning in 1959 tornado reports are included in the separate publication, Storm Data, each month.)
In the compilations of these statistics, questionable cases were referred back to Weather Bureau officials for further investigation. If some of the known characteristics of tornadoes were not found in the original records and notes made at the time of occurrence, the storm in question was not included in this summary.
TORNADOES OF EARLY YEARS Records of tornadoes in this country prior
to about 1875 are necessarily meager, for several reasons--lack of settlements in many areas, poor communication facilities, and absence of any organized plan for reporting. In early days, the reporting system caught only the major and more spectacular cases. Thus, the greater number of tornadoes reported in recent decades and particularly in the last 6 years does not necessarily indicate that tornadoes are becoming more frequent.
In the literature on the subject, there are references to approximately 150 tor-
nadoes which occurred in the United States during the period 1682-1874. The earliest one for which an authentic record exists occurred on June 10, 1682, at New Haven, Conn .[1]. Reports of tornadoes west of the Appalachian Mountains first appeared about 1805 and in the western Great Plains about 1859.
By the year 1875, more reliable and de-tailed reports of tornadoes became available. A selected list of 146 of the more outstanding of these storms that occurred during the period 1875-1958 is shown in table 1.
TORNADO CHARACTERISTICS The tornado, one of the most destructive
of storms, is characterized by rotary movement of extremely high-speed winds within a r~latively small storm circulation pattern. It frequently leaves great destruction along a narrow path, and is usually accompanied by heavy rain and hail, and often by lightning and thunder. A distinguishing feature of the tornado is the funnel-shaped cloud which frequently appears to hang from a heavy cumulonimbus cloud aloft. This funnel cloud often rises and falls~ turns and swings in various directions before touching the earth's surface. The sound of roaring wind is also· characteristic and pronounced. Some eyewitness descriptions are given in a later portion of this paper.
Tornadoes are barometric depressions roughly resembling the larger air mass circulations known as cyclones, but are very much smaller and of much shorter life with much steeper pressure gradients and terrifying wind speeds. The word tornado probably came from the Spanish "tronada," a thunderstorm, or "tornar'.' meaning to turn or to twist. English sailors used a similar
2
word, spelled in various ways, to describe severe loca 1 storms along the west coast of Africa and on tropical seas.
The very strong updraft of air in the tornado's funnel, which gives rise to furious in-blowing winds at and near its perimeter, is generally the cause of first destruction, and as the funnel drops toward the earth, objects appear to be sucked up, ascending spirally. Some persons who have lived through the passage of a tornado speak of a bursting sensation in their ears and chest. This is due to the partial vacuum, which is formed in the tornado funnel. The pattern of uprooted trees and scattered debris along the tornado path usually gives evidence of counterclockwise whirl around this partial vacuum as the storm moves along.
The amount and nature of the fall in atmospheric pressure inside a tornado funnel probably varies greatly from storm to storm. When a roofed enclosure, such as a house filled with air at normal pressure, is suddenly encompassed by the funnel of a tornado, the reduction in the surrounding outside air pressure causes the internal

air to expand outward with explosive force, since pressure may be several hundred pounds per square foot greater inside the house than outside. Many evidences have beeti observed of a vacuum effect in the tornado's funnel; kegs have been known to split open, chests to explode scattering their contents, and corks to fly out of bottles.
PRESSURE.--The lowest recorded air pressure during the passage of a tornado occurred at St. Louis, Mo., on May 27, 1896 [2]. An aneroid barometer was located at the edge of Lafayette Park in or very near the center of the tornado at its most destruc~ tive stage. The barometer was read about 6:30p.m., CST, as the storm struck, and later tests of the instrument produced a corrected low reading of 671 mm. or 26.42 inches. When reduced to sea level this reading was 26.94 inches, 2.42 inches lower than the pressure recorded at the same time at the Weather Bureau Office, seven blocks north. At 8 a.m., on that date, sea level pressure at the Weather Bureau Office in St. Louis was 29.92 inches; by noon it had
fallen to 29.87 inches; from noon to 1~45 p.m., it remained stationary; and at about 2 p.m., it began to fall rapidly but unevenly, until, by 6 p.m., the reading was 29.59 inches. From 6 to 6:10p.m., the barometer rose ~o 29.67, and fell almost immediately to 29.57 inches. It again rose in less than 5 minutes to 29.67 inches. During the next 15 minutes (6:15 to 6:30 p.m.) it fell to 29.36, then immediately rose to 29.76 inches and continued in a series of sharp oscillations of from 0.05 to 0.10 inch magnitude until 10 p.m. (a barograph trace of the uncorrected ~tation pressure during this period is shown in figure 1).
At 6:10p.m., the wind changed suddenly from southeast to northwest and the speed increased greatly, reaching a 5-minute maximum of 80 m.p.h., from 6:15 to 6:20 p.m., with an extreme speed of 120 m.p.h., at 6:18p.m. At 6:20p.m., the direction changed to northeast, and there was a decided decrease in speed, falling to 7 m.p.h., a t 6 : 45 p • m • (fig • 1) •
Pressure Temperature Rainfall ..;n;a/1 27 !896 ~
'2 4 6 8 10 XII 2 4 15 8 10 M 2 4 I
.. - w.. - - -·- - - - - - - -- -
""'-- ----~-- ------ -- -
---- - -- - - - - - -- - ·--- -
6PI'Il ! I I
I I
Sf SE SiiSE SE SE:Sf SE NEl E I
I I
I I I
6Ph7
E NE SE SE
:.~
Wind Direction
I I I 7PI'11 I ~ I
I I I I I I
NW:NW NE NiNE NE NE:NE SE E Sf SE SEiN~ NW NEiNE Nt REl N I I I I I I
I I I I ! I I
Wind speed
Figure 1.--AUTOMATIC RECORDS AT STo LOUIS 9 MOo, MAY 279
1896o
548368 0 - 60 - 2
-f-
8P•
NE N
3

--.60 .6 .60
0 0
H-++.30 .30 .30
~0 .2 .20
1-1-\--1--\ .1 0 .10 .10
0 .90 .9 .90++++
·.so .80 .80-'r-T-'i--'
.7 .70~
03 06 09 12 15 18 21 00 03 06 09 12
Figure 2o--BAROGRAM AT DYERSBURG, TENN o, MARCH 21-22, 1952
A more recent pressure record, associated with the passage of a tornado, was obtained at the Dyersburg, Tenn., Airport on March 21, 1952. From a subsequent survey of the path of destruction it was estimated that the center of this storm was approximately 40 yards north of the barograph when a sudden drop of about 0.65 inch was recorded. A study of this storm was made by Carr [3] o A print of the barograph trace is shown in figure 2.
RATES OF TRAVEL AND INTERNAL WIND SPEEDS.-Tornadoes usually move at a speed of about 40 m.p.h., a very slow rate compared with the rotary speed of winds within the tornado, which have been estimated to exceed 200 m.p.h., and possibly 500 m.p.h. Forward speeds ranging from stationary to as high as 68 m.p.h. (in Indiana during the tri-State tornado of March 18,. 1925) [4], have been observed. Recorded rates of forward movement of 60 m.p.h., or over for some tornadoes are: 65 m.p.h., on May 25, 1917, from Grenola to Uniontown, Kans.; 60 to 65 m.p.h., on March 15, 1938, at Batesville, Illo; 60 to 61 m.p.h,, pn April 19, 1927, in Macoupin, Morgan, and Sangamon Counties, Illinois; and 60 m.p.h., on April 30, 1954, in the tornado which moved 180 miles from Sturgeon~ Mo., to Kahoka, Iowa. Probably the slowest moving tornado (only 5 m.p.h.) occurred at Pratt, Kans., on May 24, 1930, although a few tornadoes have been observed to remain stationary for several minutes while the air composing them continued to whirl at tremendous speeds. The greatest wind speeds within the tornado are reached to the right of the path of forward motion. Although rotary wind speeds within a tornado funnel have been estimated to be as high as 500 m.p.h., the maximum speeds of these
4
whirling internal winds have never been measured directly and it is doubtful that any anemometer would survive such a test. Several calculated estimates have been made, however, from th~ effects produced upon objects by the high winds.
One such calculation by Loomis [5] after the tornado of February 4, 1842, at Mayfield, Ohio, was made when he found small pieces of boards with blunt ends driven into the turf to a depth of 18 inches. After making several experiments and by comparing the depth and force involved, he concluded that winds in this storm must have reached a speed of 682 m.p.h. A comparable speed in excess of 550 m.p.h., was given by Bigelow [6] for winds in the great tornado which passed across St. Louis, Mo., on May 27, 1896. Van Everdingen [7], on the other hand , writes, "all calculations of the force of wind from the pressure of the wind, estimated from its destructive effects, yield too high values, because it is certain that other forces of the same order of magnitude must have been present at the same time." However~ most authorities on the subject agree that extremely high wind speeds near the whirling centers of all tornadoes are the chief cause of their destructive effect. The ·weather Bureau's experimental Doppler ·radar equipment, a device which permits direct measurement of the high speeds in a spinning tornado funnel, received its first big test in the Wichita Falls, Tex., tornado of April 2, 1958. This was the first tornado tracked by the Doppler radar, and for the first time in history rotating winds up to 280 m.p.h., were clockedo The Doppler radar principle is used commonly for speed monitoring work by highway police~ and could prove very valuable in locating and tracking tornadoes.
DIRECTION OF MOVEMENT.--Surface winds in connection with developing tornadoes are usually from the southwest, and most tornadoes move from that direction (see tornado tracks in charts 1-13). Tornadoes, however, have been known to come from almost any direction, even stopping their forward movement, turning, and looping their path. For instance~ the tornado of June 15, 1942, in Buchanan County, Iowa, caused widespread destruction in a crescentshaped path curving from a southeasterly direction through south, west, and northwest to northeast. Also in 1942, a tornado at Oklahoma City, Okla., on June 12, moved southeastward, curved to the southwest, then recurved to the east, moved northward, and finally westward, its path describing almost a complete circle. A tornado on June 27, 1946, made a circuitous path from Windsor, Ontario, to Detroit, Mich., and another tornado on June 2, 1949, circled an area of 1-mile radius in Caddo County, Oklahoma.

A number of other tornadoes have described semicircular paths or have abruptly changed their direction of movement by 30° to over 45° • The tornado rose presented in figure 3 shows that about 58 percent of these storms moved from southwest to northeast and slightly over 87 percent came from some westerly direction.
LENGTH AND WIDTH OF PATHS.--The tornado, although very destructive to life and property, is one of the smallest of serious weather disturbances, and is limited in duration as well as in the length and width of its path. The cloud may tomh the ground only in a very narrow and short path and sometimes strikes the surface only at intervals as it moves along in a skipping fashion. In other cases, the storm may persist for hours, with a path of destruction several hundred yards wide and up to 300 or more miles long. The average width of tornado paths in the United States for the past 10 years is about 250 yards. Of the 2~288 tornadoes giving data on the lengths of paths during the 10-year period,
1949-58, 10 percent traveled for distances of less than 1/2 mile, 42 percent from 1/2 to 5 miles, 16 percent from 5 to 10 miles, 15 percent from 10 to 20 miles, and 17 percent exceeded 20 miles, the median length being 5 miles.
Two tornadoes crossed Georgia and South Carolina on March 20, 1875, with paths of 3.75 and 350 miles respectively [8]. There were, however, several gaps in these long paths where no destruction occurred, indicating that the funnels either failed to touch the ground in those areas or that the path in each case may have been made by; more than one storm. On April 29, 1909,· a long path in Tennessee extended for 315 miles, but reports of this storm do not indicate whether the path was continuous or interrupted by breaks. These three paths appear to be the longest of which we have any record. During the 43-year period of tabulation of these storms by the Weather Bureau, no tornado path of 300 miles or over has been reported and only nine have moved for distances of 200 miles
7.1
LEGEND 0 10 20 30 40 50 I, I I I I I I I I I I I I I,, I I I I, I I I,, I I ,I, I I I I, I I I I, I I I,, I I I I
57.8
FIGURE 3.-TORNADO ROSE FOR UNITED STATES, GIVING PERCENTAGE OF TORNADOES
MOVING FROM INDICATED DIRECTIONS. BASED ON 5746 TORNADOES, 1930-58.
5

or more. The Mattoon-Charleston, Ill., tornado of May 26, 1917, had the longest officially rEported path of 293 miles~ 188 miles in Illinois and 105 in Indiana. The next two longest paths extended for 240 miles each, one in Arkansas on December 21, 1947, and the other from Louisiana into Mississippi on November 5, 1948o The path of the Woodward, Okla., tornado of April 9, 1947, stretched across parts of Texas, Oklahoma, and Kansas, a total distance of 221 miles. A tornado on March 22, 1953, moved 180 miles across Louisiana arid 40 miles into Mississippi for a total of 220
~iles. A tri-State tornado with a path 219 miles in length traveled from Missouri, across Illinois, and into Indiana on March 18, 1925. Another tri-State tornado on April 17, 1922, traveled 210 miles over Illinois, Indiana, and Ohio. A 210-mile path extended from North Dakota into Minnesota on July 3, 1947. A South Dakota tornado on May 27, 1942, moved for 200 miles in that State.
Among the narrowest paths of tornadoes was one only 9 feet wide in North Carolina in 1940, and one of the shortest, only 45 feet long, occurred in Wyoming in 1954.
TORNADO STATISTICS DISTRIBUTION OF TORNADO OCCURRENCES.-
The areal distribution of the 9,167 tornadoes reported in the United States from 1916 through 1958 is presented by months in charts 1 through 12. Chart 13 shows tracks of all tornadoes reported during the 6-year period, 1953 through 1958. The great central and southern plains east of the Rocky Mountains in the United States is the area of most frequent tornado occurrence, although they may form in any part of the country and have been reported from every State, except Alaska~ during the 43-year period. They are rare, however, west of the Continental Divide and in mountainous areas. They are quite frequent in the Atlantic and Gulf coastal lowlands, sometimes developing during the passage of hurricanes. Tornado activity is not uncommon in connection with tropical storms or hurricanes. The tabulation on page 36 lists 99 such tornadoes, which caused 14 deaths, 189 personal injuries, and damage of over $3 million during the 43-year period.
As shown in table 2, Kansas reported 1,041 tornadoes, the greatest number in any State during the period 1916 through 1958. Texas had 999, Oklahoma 856, Iowa 599, Nebraska 450, Arkansas 448, and Missouri 446. These totals indicate that nearly one-third of the Nation's tornadoes have occurred in the three States-Kansas, Texas , and Oklahoma- and over one -ha 1 f in seven States in the central and southern Great Plains. No tornado has ever been reported in Alaskat, although several waterspouts have been sighted near the coast. Official reports record only one tornado in Nevada* and one in Rhode Island* during these 43 years. Two have been reported in
Hawaii, four in the District of Columbia, eight in Oregon, and eight in Utah.
LOSS OF LIFE.--During the 43-year period 1916-58, tornadoes have caused the loss of 9,241 lives in the United States. Arkan$aS suffered the greatest loss, with 9R4 persons killed in the 43 years. Illinois was second with 943 deaths, 606 of which resulted from the single tornado of March 18, 1925. Mississippi ranked third with a death toll of 869, followed by Texas with 844. Although tornadoes occurred, no deaths were reported in Arizona, California, Connecticut, Delaware, the District of Columbia, Nevada, Oregon, Rhode Island, Utah, Vermont, Washington, or Hawaii.
Eight tornadoes were responsible for 100 or more deaths each during the 1916-58 period. The greatest killer of all, the tri-State tornado which swept from Missouri across Illinois and into Indiana, March 18, 1925, was blamed for 689 deaths. Two hundred and sixteen persons were killed at Tupelo, Miss., April 5, 1936; on the next day, April 6, 1936, 203 at Gainesville, Ga.; on April 9, 1947, 169 deaths occurred along a path from White Deer, Tex., across Oklahoma, to Nashville, Kans.; on June 8, 1953, 116 died in the Flint to Lakeport, Mich.~ storm; on May 11, 1953, 114 at Waco, Tex.; on May 26, 1917, 101 in the Mattoon-Charleston, Ill., tornado; and on June 23, 1944, 100 lives were lost as a tornado moved across five counties in West Virginia.
PROPERTY DAMAGE.--Property losses are shown in table 2 in thousands of dollars. The estimated losses presented are based on values at the time of occurrence; consequently, due to the change in the price index, comparisons of dollar losses can not
t A small tornado was reported November 4, 1959, on Kayak Island, Alaska. * Records indicate the occurrence of two tornadoes in each of these States prior
to 1916. In Nevada, one occurred at Winnemucca on December 16, 1879, and the other at Fallon on April 29, 1915 [9]. Redfield [!<TI lists tornadoes as occurring on Au~ust 15, 1787, in New Jersey, Connecticut, Massachusetts, and Rhode Island. Finley [1~ reports one as occurring on August 30, 1838, at Providence, R. I.
6

accurately be made without adjustment. As this has not been done in this publication, no attempt has been made to present the total amount of property damage in each State for the period. The greatest damage, however, appears to have occurred in Texas, Oklahoma, Georgia, Illinois, and Missouri in that order. Negligible damage was reported in Nevada, and losses were mostly light in Arizona, Idaho, Oregon, Rhode Island, Utah, Washington, and Hawaii.
FREQUENCY AND TIME OF OCCURRENCE.--The annual number of tornadoes reported has increased in recent years. The mean yearly number for the country as a whole for the period 1916 through 1958 is 213, occurring on an average of 79 days a year, a great increase over the 149 tornadoes on an average of 66 days for the 1916-50 period. The average yearly number for the 6-year period, 1953-58, is 590 tornadoes on 154 days. The greatest yearly number (864) occurred in 1957. The next highest total of 592 was reported in 1955, followed by 565 in 1958, 550 in 1954, 53? in 1956, and 437 in 1953. Tornadoes have been reported during every month of the year. This is shown by tabulations in table 3, graphical presentation in figures 4 through 7, and charts 1 through 12. In this 43-year period of record, May was the month of greatest frequency, when 1,951 tornadoes occurred or an average of about 45 a year; June followed with 1,713, an average of 40 per year; April was next with 1,534, averaging nearly 36 a year.
Tornadoes are rare in fall and winter, wd. th an average of about 5 to 8 a month in the United States ·from October through February. A marked increase begins in March and continues through the peak months of April, May, and June, with a decrease beginning in July and continuing progressively through fall and winter.
As will be noted by the charts showing the locations of tornado occurrences by months (charts 1 to 12),these storms follow a welldefined seasonal frequency. Tornadoes are most frequent in the Gulf Coastal States of Alabama, Mississippi, Louisiana, and southern Texas in winter, moving over a widening area including Arkansas, northern Texas, Oklahoma, Kansas, and Missouri during April and early May, the middle portion of the Great Plains by late May and June, the Dakotas and Minnesota by July. By August, they begin to decrease in northern areas, and at the same time begin to increase on
the coast of Florida and in other Atlantic coastal regions, where some are associated with the passage of hurricanes. About 66 percent of all tornadoes occurred during the March through June period, 22 percent from July through October, and only about 12 percent during the other months. These storms rarely occur in northern portions of this country in the winter. During 1957, however, an unusual outbreak of 21 tornadoes in December occurred in Illinois where these storms had been reported during that month in only four previous years.
The greatest number of tornadoes for a calendar date appears to have been on April 30, with an accumulated total of 124 for that date duririg the past 43· years. The next highest total for a calendar date was 107 on May 1, followed by 100 on May 20. On May 20, 1957, 37 tornadoes were reported for the greatest number occurring on a single day in any year, followed by 35 each on June 7, 1953 and on April 3, 1956. No tornadoes have yet occurred on February 2 and 23, November 30, and December 14 and 16.
While tornadoes may appear at any hour of the day or night, 82 percent of those for which the times of beginning are available have occurred between noon and midnight. They appear to form most readily in the hours closely following the warmest part of the day, generally from 3 to 7 p.m., during which time about 42 percent have occurred in the past 43 years. The greatest hourly number was recorded between 4 and 5 p.m., and 5 and 6 p.m., with 931 or 11 percent of all tornado occurrences for each hour; the next highest hourly frequency was between 3 and 4 p.m., when 857 or about 10 percent were reported; followed by the hour ending with 7 p.m., with 837 or slightly less than 10 percent. The least hourly number (only about 1 percent) were reported between 7 and 8 a.m. Although the peak occurrence is during the afternoon hours in all areas, an examination of the graphical presentation of the times of beginning of tornadoes accompanying this article shows a larger proportion of these storms occurring between midnight and noon in the. Southern States than in the Great Plains. About 40 percent of the Alabama tornadoes and 36 percent of those in Louisia~a on which the time was given occurred between midnight and noon, while ~n Kansas only 9 percent and in Nebraska 6 percent were reported during that time.
TORNADO FORECASTING The need for tornado forecasts has been
recognized for many years, but the meteorological techniques required to provide a minimum area of alert were not fully de-
veloped until the early 1950's. The techniques were improved in cooperation with the military services, and warning networks were established to help reduce tornado
7.

casualties. There is now in operation the Severe Local Storms Forecasting Center in Kansas City devoting full attention to forecasting severe local storms for all vulnerable parts of the United States.
It is not possible to predict the exact spot where a tornado will strike, but whe~ weather conditions indicate that they are likely to occur the tornado forecasts define a specific area, usually about 10,000 square miles, in which there is a reasonable possibility of occurrence. These forecasts are disseminated to the public by radio and television stations in and near threatened areas up to 6 hours in advance and
serve to alert the public to take any necessary preliminary action so that a place of safety can be reached quickly if a warning is issued that a tornado is approaching. Warnings are announcements that a tornado has been sighted. The warning is flashed to the public over all available communication channels, stating that a tornado has formed at a particular spot and describing the likely path it will take and time of arrival at different locations. Safe shelter can then be taken by all persons in the path.o The forecast and warning service has been credited with saving many lives.
TORNADO ODDITIES Because of the erratic behavior and in
tense forces demonstrated by tornadoes, many unbelievable and freakish occurrences have resulted during their passage. The furious winds of a tornado turn normally harmless objects into missiles of great penetrative power. Frequently, reports show that boards or even stalks of straw were driven into tree trunks, posts, and sides of buildings, huge trees were ripped from the earth and hurled hundreds of yards, persons were lifted into tre air and carried for distances, and chickens were cleanly plucked of their feathers but unhurt. Other reports tell of fine dirt, stones, and bits of leaves being driven into the flesh of persons exposed to the wind, and clothes saturated with mud under similar conditions are said to be almost impossible to clean.
The terrific force and lifting power of the whirling tornadic winds are shown in the following descriptions. On April 16, 1879, a tornado at Walterboro, S.C., lifted a hickory tree, measuring 54 inches in circumference, out of the ground and moved it 10 feet up a bank; geraniums blooming in pots were found by the owner 1 mile away undamaged. At Marshall, Mo., an ice chest weighing 800 pounds was carried a distance of several miles on April 16, 1880. After the St. Louis, Mo. , tornado of May 27, 1896, a 2x4-inch scantling was found protruding several feet through iron 5/8 inch thick on the Eads Bridge; wheat straws were found foreed into a tree trunk to a depth of over 1 inch; and a 6x9-inch timber was driven 4 feet almost straight down into the hard ground. Following the tornado of November 10~ 1915, at Great Bend, Kans., an iron water hydrant was discovered full of wooden splinters. The force of the wind at Fergus Falls, Minn., on June 22, 1919, split a huge tree, hurled an automobile into the split, and closed the opening in the tree, holding the automobile as if it were in a
8
vise. After the tri-State tornado of March 18, 1925, a large plank several feet long was found driven horizontally into a tree trunk so firmly that the far end could support a man's weight with9ut loosening it from the tree; at Griffin, Ind., a piece of wallpaper about 2x3 inches was observed driven edgewise into the southwest side of a box elder tree about 6 feet above ground. At Nashville, Tenn., on March 14, 1933, a 2x4-inch timber was plunged through a panel door, without causing the· slightest splitting or splintering and fit the opening perfectly; another plank, measuring lx6 inches was forced through the trunk of a sturdy tree, splitting the tree in halfo On July 4, 1956, at Edison, Nebr., lx8-inch boards were driven into the ground in a straight line as if measured and placed there.
The powerful force of the rotating winds was shown in the tornado on May 27, 1931, at Moorhead, Minn., when farm implements of heavy iron and steel were twisted beyond recognition; at Nashville, Tenn., on March 14, 1933,when a high tension tower was bent to the ground in a tangled mass without breaking loose from its concrete moorings; and on April 6, 1936, at Gainesville j Ga.~ when a telephone pole was so twisted it resembled a huge corkscrew but still remained upright. On June 12, 1957, a tornado at a Dallas County, Texas, airport struck a steel hanger built to withstand winds up to 120 m.poh., and pulled the concrete piers from the groundo During the tornado of June 22, 1919, at Fergus Falls, Minn., a trunk containing clothing was carried from one house and deposited in the attic of another two blocks away, and when found was undamagedo Galvanized roofing was carried 50 miles from La Plata, Md., on November 9, 1926. On May 7, 1927, a 5-ton caterpillar tractor was turned over and rolled 500 feet at Hutchinson, Kans.; a span of steel highway bridge near

Medicine Lodge, Kans., was blown downstream for 100 feet. At Gothenberg, Nebr., on June 24, 1930, two concrete blocks, weighing 2,000 pounds each, were torn from their fastenings and moved several feet. The courthouse bell, weighing nearly a ton, was carried 350 yards in the Gainesville, Ga., tornado on April 6, 1936, and portions of a huge sign which extended across a Gainesville mill were found at Easley, S.C., over 85 miles away.
Clothing and other small articles have been recovered many miles away from the scene of the storm. An unmailed letter and check which had evidently been blown from Great Bend, Kans., on November 10, 1915, were found 85 miles to the northeast. An insurance policy from a home in Marion County, Ala., was blown into Lauderdale County, a distance of 75 miles during the tornado of April 20, 1920. A picture postcard bearing an Orestes, Ind., address was recovered on April 17, 1922, at Mt. Cory, Ohio, 124 miles away, torn at one corner, but otherwise in good condition. After the tri-State tornado of March 18, 1925, a pair of trousers with $95 in the pocket was picked up 39 miles away, and a check and calling card were carried 125 miles. An old postcard which had been kept in a trunk at Gainesville, Ga., was found, following the April 6, 1936, tornado, at Liberty, S.C., 80 miles distant. Pieces of stationery from Gainesville were picked up at Easley, s. c., over 85 miles away. A letter was carried 100 miles by a tornado in Pennsylvania on June 23, 1944. Various objects were reported to have been carried 90 miles from their original position at Corn, Okla., on June 8, 1951. A government bond from Kay County, Okla., was found at Williamsburg, Kans., over 100 miles away, following the April 2, 1956 storm. Another government bond and eight $100 bills were found intact many miles away in an envelope bearing an ElDorado, Kans., address, following the tornado of June 10, 1958. On April 3, 1956, a package of knitting products from a wrecked Berlin, Wis., mill was recovered undisturbed 35 miles northward; a package of papers was found 75 miles to the north-northeast and a carton of deer hides was recovered 60 miles northeastward. Debris from the Hickman Mills, Mo., tornado of May 20, 1957, was found 180 miles distant. A jar of fruit was reported to have been carried a long distance from Wilkes Barre, Pa., on August 19, 1890, and when found was undamaged, except for the porcelain lining of the cover.
There are a number of instances on record of human beings and animals being whisked up from the ground and carried through the air for varying distances. A farmer was picked up, carried 150 yards, and put down without serious injury on
May 12, 1896, at Elkhorn, Nebr. During the tri-State tornado of March 18, 1925, 16 pupils were blown 150 yards into a field from a country school and none was killed. On April 9, 1947, as a man opened the Gloor of his home near Higgins, Tex., the door was torn loose from his grip and he was picked up by the wind and carried for 200 feet over the tree tops. On November 4, 1950, in Pennsylvania a woman was carried 30 feet; on July 6, 1954, a Harding, Minn., farmer was lifted 40 feet and dropped to the ground unhurt; at Collinsville, 111., on May 3, 1958, a man was carried 50 feet, and another was carried 100 feet at St. Martin, Minn., on June 4, 1958. Also during the tornado at ElDorado, Kans., on June 10, 1958, a woman was sucked·through a window, blown 60 feet, and beside her was found a broken record entitled "Stormy Weather." An automobile with 2 passengers was carried 100 feet and dropped right side up without injury to the passengers on April 18, 1955, near Lanark, Ill.
Railroad trains have also been damaged and derailed by the wind force during the passage of these storms. On June 22, 1919, the Great Northern Limited was trayeling at about 30 to 40 m.p.h., when the tornado at Fergus Falls, Minn., struck the baggage car behind the tender, throwing 7 of the 11 coaches from the rails. The baggage car was torn from the train and set down about 30 feet from the rails at right angles. The tornado of May 27, 1931, at Moorhead, Minn., crossed the Great Northern Railroad track, striking tle "Empire Builder" at right angles. One 83-ton train coach with 117 passengers was lifted from the rails, carried through the air, and laid in a ditch 80 feet away, with only one death resulting when a passenger was hurled through the window and crushed beneath the coach. Other coaches were torn loose from the engine and pulled from the rails. On September 4, 1941, freight cars loaded with coal and weighing 80,000 pounds each were overturned near Minneapolis , Minn. At Gage, Okla., a train of 82 cars was struck by a tornado on June 21, 1958; 17 of the cars were derailed and 180 feet of track torn out.
Freakish and awesome stories are frequently reported in connection with the passage of tornadoes. In the town of Peggs, Okla., only one building was left undamaged by the tornado of May 2, 1920. It was the wooden, one-story jail, and not 30 feet away a concrete building was left in utter ruin. On July 2, 1924, 8 inches of snow, which seemed to come from a funnel cloud, covered an area of 20 square feet near Wabash, Ind. Small fish, crayfish, and tiny frogs fell during a shower of rain in a tornado associated with the passage of a hurricane in Alabama on June 28, 1957.
9

On November 10, 1915, during the Great Bend, Kans., tornado, a dresser was splintered, but its mirror was carried some distance and set down unbroken against a fence. At Fergus Falls, Minn., on June 22, 1919 9 a buffet was moved 2 feet from the wall without breaking a dish, although all other furniture was in splinters and the house so badly damaged, it was unsafe to enter. A similar story is told of the February 1950 tornado which scattered the roof and parts of a Shreveport, La., home over a half-mile area, but left the floor intact on which was a china closet filled with dishes, none broken. An incident of the Gainesville, Ga., storm of April 6, 1936, was told of three small boys who rushed under the front steps of their home in terror as the storm's roar approached. The house and all foundations were blown away, leaving only the front steps and the little boys frightened but unharmed. An awesome story is told about a boy who was found with a dozen splintered sticks protruding from his chest after the El Dorado, Ka ns • , tornado of June 10, 1958.
There have been incidences of several tornadoes striking the same area within a short space of time, namely; at Austin, Tex., on May 4, 1922, two at a 30-minute interval, and at Baldwyn, Miss., on March 16, 1942, two 25 minutes apart. In Ellis County, Okla., a destructive tornado occurred on April 9, 1947, and on May 31, another tornado passed over the same area. Due to the extensive destruction resulting from the first storm, further damage from the second was negligible as very little was left to destroy. The town of Cadell, Kans., was struck in three successive years, 1916, 1917, and 1918, and each time on May 20 and at about the same hour of the day.
In some instances damage by tornadoes may result at treetop or housetop levels, indicating that the cloud did not completely reach the earth's surface. This char-
acteristic was very noticeable in two great tornadoes, one at Louisville, Ky., on March 27, '1890, and the other at St. Louis, Mo., on May 27, 1896. In the majority of cases damage was confined to upper floors, and most wrecked buildings owed their destruction to the collapsing of their walls from the weight of debris of ruined upper levels. At St. Louis, nearly all trees in Lafayette Park were broken and twisted off at an elevation of about 30 feet. Reports of more recent years show the concentration of damages above the ground level in the following tornadoes:
April 16, 1954 -Ft. Valley, Ga. -$2,000 damage at rooftop level.
May 10, 1954 - East Hartland, Conn. -$1,000 damage at treetop level.
June 20, 1954 -Grand Island, Nebr. -$3,000 damage to upper parts of higher buildings.
July 19, 1954 -Kingsland, Ark. -$1,000 damage to tops of houses.
July 12, 1955 -Terrytown, Nebr. -damage (not estimated) to roofs and treetops.
February 25, 1956 -Cedarville, Ohio -overhead at elevation sufficient to tear roofs from houses, damage $250,000 0
July 21, 1956 -Collinsville, Okla. -slight damage as funnel reached to 100 feet of ground.
April 22, 1957 -Kingfisher, Okla. -passed just above ground, damage $100,000.
May 12, 1957 -Carnegie, Okla. -slight damage as funnel reached to rooftop level.
June 12, 1957 -Tuscola, Ill. - slight damage at treetop level.
July 1, 1957 - Tulsa, Okla. - dipped to treetop level, damage $20,000.
August 14, 1957 - Hanson, Okla. -about 20 feet above ground, no estimate of damage.
July 29, 1958 - Worcester to Shrewsberry, Mass. -slight damage at treetop level.
TORNADO OCCURRENCES IN MAJOR CITIES AND SELECTED COMMUNITIES
Records show that some of the larger cities in the country have been struck by two or more tornadoes as shown in the tabulation on page 38. Two of the St. Louis, Mo., tornadoes were among the most disastrous in history. On May 27, 1896, a tornado swept through St. Louis, causing a loss of 306 lives and property damage estimated at nearly $13 million. Although not as disastrous as the 1896 tornado in regard to loss of life, St. Louis suffered even greater property damage in another such storm on September 29, 1927. Two tor-
10
nadoes at Gainesville, Ga., resulted in high death tolls; on April 6, 1936, 203 persons lost their lives and property losses were placed at $13 million; a previous tornado, on June 1, 1903, caused 98 deaths and property damage of $1 million. Losses of $1 million or over have resulted from each of four tornadoes to strike Minneapolis~ Minn. In March of 1948, two very destructive tornadoes swept through· Oklahoma City, Okla., within 5 days, damaging aircraft to the amount of over $16 million at Will ·Rogers and Tinker Fields.

OBSERVERS' IMPRESSIONS OF TORNADOES Many observers state that the atmosphere
becomes sultry and peculiarly oppressive just before the tornado cloud appears. Also, that it is calm, but suddenly a terrific wind seems to come from all directions at once as the funnel cloud dips down. Descriptions of tornado formation include statements to the effect that two cloud masses seem to meet, one moving from the south and the other from the west or northwest, the clouds breaking up in a wild turmoil, in some cases darting toward the earth, then shooting high into the sky; in the middle of the confusion, portions of the clouds roll about each other and a whirling cloud starts descending toward the earth.
The descending funnel cloud has been described as a thin, dangling rope; a fairly wide and solid-looking funnel balloonshaped cloud; the tail of an enormous kite trailing to the ground; a grey revolving cloud, occasionally black and solid that began destruction as it touched the ground; a funnel rising from the earth and dipping down again a little farther on; a rotating cloud generally moving in a straight line, sometimes swinging from side to side, and occasionally changing form and shape and bouncing up and down. The noise accompanying the tornado is often referred to as a frightful roar, resembling a train passing throu&h a tunnel.
Flora 1!2] describes a well developed tornado as the most amazing and terrifying atmospheric phenomenon ever seen. The tornado approaches with a peculiar whistling sound that rapidly changes to a terrifying roar and is described as a gigantic elephant trunk writhing about on a long rope dangling from the sky that spreads destruction wherever it touches the ground. Flora's report on the tornado at Hardtner, Kans., on June 2, 1929, states that the sky was partly overcast and the sun shone full on the pendant cloud, a striking sight for 30 miles across almost level country. Instead of moving at excessive speed, it seems to loiter and remain almost stationary for nearly 1/2 hour. The funnel was described as a big, grey elephant trunk or sausage balloon strung across the town with the upper end in the clouds and the lower part switching about in a cloud of dust on the ground. It was accompanied by a heavy fall of hail. At Kiowa, 10 miles eastward, where the sun could still be seen shining over the top of the cloud, slugs of ice, disk-shaped and over 2-1/2 inches wide and almost 1 inch thick, fell in the sunlight like gleaming meteors out of the black cloud that backed in from the east. Finally the parent cloud of the
548368 0 -60 -3
tornado merged with the black hail cloud and the whole mass moved off toward the northeast.
Shipman ~3] , in reporting on the tornado at Fort Smith, Ark., stated that the general weather conditions on the morning of Aprill2, 1927, were sluggish and locally warm and sultry. At about 4 p.m., tornado signs appeared, with heavy rains west of Fort Smith. Clouds moved in opposite parallel paths, one from the north, and one from the south. A vortex apparently formed without a funnel. Under the vortex, debris rose, appearing like cinders or light trash ascending to the clouds. Open sky was oo ted to the north, east, and south near the horizon, but the horizon was obscured to the west. The formation of a small, but energetic, tornado whirl was seen in a break in the clouds near the horizon. The converging and turmoil of the clouds were observed with movement east-southeastward. Heavy rain and light hail lasted about a minute, then the skies began to clear on the western horizon and darken on the eastern. The first actual destruction occurred at Fort Smith at 4:04 p.m., with debris shooting upward under the vortex in a cloud of dust. The ascending wreckage had the appearance of a great explosion and was distributed in horizontal strata until drawn into the vortex. These ascending formations appeared three times without a tornado cloud being observed.and each successive formation seemed stronger and to produce more destructive effects than the previous one. The fourth ascending formation was met by a descending cloud appearing like a cornucopia which failed to reach the ground, but was accompanied by more dust and wreckage. The fifth formation with the second funnel appeared as two large bells connected with a thin, ropelike pendant, followed in a few seconds by the sixth formation and third funnel which widened, accompanied by rain and a cloud of debris, and moved slowly to the northeast and disappeared. Towering cumulus and cumulonimbus clouds in the direction in which the tornado disappeared presented an imposing sight.
Mr. Will Keller, a farmer of near Greensburg, Kans., stood in the doorway of his storm cellar on the afternoon of June 22, 1928~ and watched one of three tornado funnels rise above the ground and pass over his heado His description of what he saw was recounted by Justice [!4]. The following paragraph conveys some of the pertinent information contained in this report:
As the great shaggy end of the funnel
11

hung directly overhead, everything was as still as death. There was a strong gassy odor and breathing became difficult. A screaming, hissing sound came directly from the end of the funnel. Mr. Keller looked up and saw right into the heart of the tornado where there was a circular opening in the center of the funnel, about 50 to 100 feet in diameter, and extending straight upward for a distance of at least 1/2 mile. The walls of this opening were rotating clouds and the whole was made brilliantly visible by constant flashes of lightning which zigzagged from side to side. Around the lower rim of the great vortex, small tornadoes were constantly forming and breaking away. These looked like tails as they writhed their way around the end of the funnel. It was these that made the hissing sound. The direction of
the rotation of the great whirl was anticlockwise, but the small twisters rotated both ways, some one way and some another. The opening was entirely hollow, except for something which he could not make out, but supposed that it was a detached wind cloud. This thing in the center was moving up and down. The tornado was not traveling at a great speed. Its course was not in a straight line, but zigzagged across the country in a general northeasterly direction. Mr. Keller writes that he is not the first to lay claim to having seen the inside of a tornado. In 1915, a tornado passed near Mullinville, Kans., where a hired man on a farm over which the tornado passed looked up into the tornado and described it as being hollow and lit up by lightning.
TORNADO GROUPS OR FAMILIES Tornadoes frequently occur simultaneous
ly or within the space of a few hours in the same State or section of the country because weather conditions favorable for their development cover a large area. They are designated as a "family" or series of tornadoes. These tornadoes travel in the same direction, following parallel
paths that are rather close together, and sometimes a number of tornadoes break out many miles beyond the place where others ended.
A tabulation listing a few of these "families" of tornadoes which have occurred during the past 43 years is presented on page 40.
WATERSPOUTS A waterspout is defined as a small,
whirling storm over oceans or inland waters, with its chief characteristic a funnel extending in a fully developed spout. These whirling storms over water closely resemble tornadoes in many phases of outward appearance, and, like tornadoes, usually rotate in a counterclockwise whirl. Waterspouts may be divided into two classes, the tornado type ana the convective type. In the tornado spout, the vortex is formed in the clouds and develops downward, while the other type originates at the water surface in convectively unstable air and builds upward, frequently under fair skies. Waterspouts occur mainly along or near squall lines, quite frequently in connection with thunderstorms and over quiet and heated waters, they may move very slowly, but frequently appear to be traveling across the water at great speed and can cause considerable damage to shipping [l~.
Because of the absence of dust, the funnel of a waterspout is usually not as well defined as that of a tornado. In the tornado type, the funnel-shaped cloud dips toward the water, the water may appear to boil and turn white, rising to
12
meet the funnel. Most authorities say that the funnel of a waterspout is composed of condensed water vapor and is not, as is popularly thought, a column of water, except near the water surface. The height of a waterspout may vary from less than 100 feet to several thousand feet and the diameter from a few feet to several hundred feetG Some spouts assume fantastic shapes and even seem to coil about themselves, while others gradually narrow with descent until they are little more than points at the surface. Sometimes only one waterspout forms, but frequently they appear in groups, the number ranging to 15 or more.
Waterspouts may occur at any time of the year, but the maximum frequency_is reported to be from May to October. In a study of the 11-year period, 1948 through 1958, we find that 237 waterspouts were reported near the coasts and over inland lakes of this country, with 48 in June,the maximum month of occurrence, followed by July with 46, August 42, and September 40. The area of maximum activity during the 11-year period was off the coast of Florida, where 120 were reported. Twenty-three were observed off Florida's west coast, 37 from

the Texas coast, and 13 in the LouisianaMississippi-Alabama area, making a total of 73 in the Gulf of Mexico. Twenty-four were reported off the Florida Keys, 65 in the south Atlantic area, only 6 off the middle and north Atlantic coasts, and 12 in the Chesapeake Bay. Twenty-four of the total number occurred over inland lakes of this country and 16 others in the Great Lakes region. The remaining 17 were reported in the Pacific Ocean, 14 near the California coast, 2 from Alaska, and 1 from Hawaii.
Funnel clouds often leave the water and touch land or move from land to watero During the 1948-58 period, 54 of these storms moved from the water to the land surface and were termed tornadoes. On reaching land they often dissipated, but sometimes they gained new rotational energy
and became dangerous tornadoes. They have even been known to reverse themselves several times from waterspouts to tornadoes. For instance, on September 5, 1935, a tornado near Norfolk, Va. [1.6] , began by destroying trees and sheds on a point of land. The twister then crossed a creek, sending up the water so that the creek bottom was plainly visible and gouged out the exposed mud, carried anchored small boats onto the shore, ripped off part of a heavy pier, and destroyed some buildings. It became a waterspout in Hampton Roads, but changed back to a tornado and dumped a railroad gondola car and some refrigerator cars off the tracks in a railroad yard; then sucked up another creek, damaged some airplane hangars; and finally headed up Chesapeake Bay as a waterspout.
TORNADOES IN OTHER COUNTRIES Tornadoes are typically American, al
though they do occur in other parts of the world. According to Dr. Wegener [].. 7] , 192 tornadoes were reported in Europe during the 100-year period, 1814 to 1913, slightly less than 2 per year. They are rare in Scotland, Norway, Sweden, Russia, and Hungaryo Available publications report the occurrence of only 5 in Hungary in the 39 years, 1886 to 1925. In Holland~ usually 2 or 3 of these storms are noted each year, but they are reported as small and usually not destructive. However, on June 21, 1950. an exceptionally large and dangerous one swept over Dinteloord and Willemstad. Several other tornadoes were reported in Holland on August 21 in 1950 1!8] • About 50 destructive tornadoes were known to have occurred in the 82 years between 1868 and 1950 in the British Isles, mostly in the broad English lowlands or river basins, where they are reported as being most common in October, with the next greatest number during the first two weeks in June. In Europe, more than one-half of the tornadoes traveled from west or southwest, and about one-fourth from northwesterly direction.
Other principal tornado regions of the world, except the United States, are Canada, Africa, China, central Asia, Australia, and New Zealand. In New Zealand, the frequency of these storms is possibly 25 or more a year {1.9] • South Africa has had some tornadoes of great intensity. Several tornadoes are usually reported each year from India ~Q] , and the Island of Ceylon and Suva in the Fiji Islands [2!] have been visited by these twisters. In the tropics, this type of storm is generally rare, with only a few instances being on record.
The diurnal frequency in England shows the expected afternoon and early evening maximum. Paths in the British Isles vary in length from a few hundred yards to over 100 miles, the longer paths being of an intermittent or skipping nature. The historic Devon storm of October 21, 1638, although recorded to have been very severe, may not have been more so than the Welsh tornado of October 27, 1913, or the Buckinghamshire tornado of May 21, 1950 rn~. The latter, reported as one of the worst in 82 years , caused heavy damage in the town of Linslade and moved for a distance of 65 miles, one of the longest paths recorded in the British Isles or on the continent of Europe ~:!! . The West London tornado on December 8, 1954, caused damage comparable with that at Linslade as it traveled at about 40 m.p.h., leaving destruction over a path about 7 miles long and 100 to 400 yards wide ~i] . A tornado at Chartres-de-Bretagne, in central France, was reported to have damaged buildings, trees, and gravestones on March 22, 1955 ~~ • In Germany, great damage was done in forests near West Harz on May 4, 1952, as a tornado moved north-northeastward at the rate of 22 m.p.h., over a track in two stretches of 8 and 10 miles with a gap between of 11 miles ~EIJ • Also in Germany on June 26, 1951 tornadic damage occurre$1 near Potsdam {27] • A tornado, a rare phenomenon in Hungary, struck Tata on May 7, 1954, causing damage over a path 3 to 4 miles long and about 110 yards wide ~~ • In the Khimki district of Moscow, USSR ~9] , a very violent storm termed a tor
nado struck on August 17, 1951, and on August 25, 1956, another such storm was reported near Moscow [? Q}.
On the afternoon of August 11, 1923, a
13

tornado struck Peitaiho Beach 1 the principal. summer resort of the foreign community north of Shantung, China, seriously damaging all buildings in its path @~ • Bermuda was visited by four of these storms, which moved from north to south, on Easter Sunday 1 April 5, 1953 [?~ • One of these passed over Hamilton, causing 1 death, many injuries, and considerable property damage. Also in Bermuda, many buildings were damaged, tiles ripped from roofs, small sheds capsized, and fences blown down in an early morning tornado on December 12, 1925 [33] • A tornado, classed as a weather freak because it occurred in January, was reported in Nova Scotia, at White Point Beach, on January 30, 1954 I?iJ .
Tornadoes are not uncommon on the Canadian prairies and in northwestern Ontario. Most are of brief duration, causing little damage, but some destructive ones have been reported. A greater percentage of the Canadian tornadoes, move from the northwest, and they generally occur later in the year and later in the day than those in the United States @~ • A study of the past 30 years shows the occurrence of 55 of these storms, mostly in Manitoba and Saskatchewan during the May to September period, with the peak activity in July. On June 30, 1912, a violent tornado inflicted damage in the millions and killed many per-
sons at Regina, Saskatchewan. Another struck at Kamsack, Saskatchewan in 1944, causing property losses estimated at $2 million. In 1955, the town of Vita, Manitoba was leveled by a tornado. A small twister skipped along a 7-mile path southwest of Amaranth, Manitoba on July 5, 1957. Although three farmsteads were struck, the damage was slight due to the sparse settlement of the area. At the time the tornado cloud was small and quite isolated in the sky 9 a vicious storm deposited 3 inches of hail in the village of Amaranth, 5 miles to the northeast ~6] • These storms occasionally cross the United States-Canadian border. One on June 27, 1936, that moved from Hill County northeastward across Blaine County, Montana, apparently passed into Canada. On June 17, 1946, a Michigan tornado began at Melvindale, moved to River Rouge, and crossed to Ojibway, Ontario, Canada, causing $1 million damage and 35 injuries in the United States and $500,000 damage 7 15 deaths, and 39 injuries in Canada. In St. Clair County, Michigan. the tornado of May 21, 1953, struck the southern edge of Port Huron, crossed to Ontario and moved from Sarnia to Stratford. Another twister originated in Windsor, Ontario, on June 27, 1946, and traveled over a circuitous path to Detroit, Mich.
REFERENCES 1. Finley, J. P., "Tornadoes," American Meteorological Journal, vol. 7, 1890, pp. 165-
179. 2. Baier, Julius, "Low Pressure in St. Louis Tornado," Monthly Weather Review, vol.
24~ No. 9, 1896, p. 332. 3. Carr~ J. A.~ "A Preliminary Report on the Tornadoes of March 21-22, 1952," Monthly
Weather Review 7 vol. 80, No. 3, 1952, pp. 50-58. 4. Henry~ A. J., "The Tornadoes of March 18, 1925," Monthly Weather Review, vol. 53,
No. 4, 1925, pp. 141-145. 5. Loomis, Elias 9 "On a Tornado Which Passed over Mayfield, Ohio, February 4, 1842 9 "
American Journal of Science and Arts, vol. 43, No. 2, October 1842, pp. 278-300. 6. Bigelow, Frank H., "The Truncated Dumb-Bell Vortex Illustrated by the St. Louis,
Mo. 9 Tornado of May 27, 1896," Monthly Weather Review, vol. 36, No.8, 1908 9 pp. 245-250.
7. Everdingen, E. van, "The Cyclone-Like Whirlwinds of August 10, 1925," Verhandelingen, Koninklijk Akademie van Wetenschappen te Amsterdam, Proceedings of the Section of Sciences, vol. 28, No. 10, 1926, pp. 871-889.
8. U. s. Signal Office, "The Tornadoes of March 20, 1875 in Alabama, Georgia, North and South Carolina," Annual Report 1875, pp. 399-438.
9. Fulks~ J. R., "Violent Local Storm in Nevada, July 24, 1931," Monthly Weather Review 9 vol. 59, No. 9, 1931, p. 353.
10. Redfield, W. C., Whirlwind Storms, J. s. Redfield, New York, 1842, 65 pp. 11. Finley, J. P., "The Character of Six Hundred Tornadoes," U. S. Signal Office
Professional Papers, No. 7, 1881, 30 pp. 12. Flora 9 S.D., "What a Tornado Looks Like," Monthly Weather Review, vol. 57, No.
89 1929, pp. 337-338.
14

13 e
14.
15.
Shipman, T. G • ' "Observing a Tornado's Life," Monthly No. 4, 1927? pp. 183-184. Justice, A. A., "Seeing the Inside of a Tornado," Monthly No. 5, 1930, pp. 205-206. Hurd, w. E. ? "Waterspouts," Monthly Weather Review, 207-211.
Weather Review, vol. 55,
Weather Review, vol. 58,
vol. 56, No. 6, 1928, pp.
16. Murphy, J. J., "Meteorological Features and History of Tornado at Norfolk, Virginia," Bulletin of the American Meteorological Societ~, vol. 16, No. 11, 1935, pp. 252-255.
17. Wegener, Alfred, Wind- Und Wasserhosen in Europ~, Friedr~" Vieweg und Sohn, Braunschweig, 1917? 301 pp.
18. Feteris 9 P. J., "The Dutch Tornado of 21 June 1950," Weather, vol. 5, No. 8? 1920, p 0 287 0
19. See lye, C. J., "Tornadoes in New Zealand," New Zealand Meteorological Service, Meteorological Office Note No. 28, 1946, pp. 166-174.
20. India Meteorological Department, "Waterspout or Tornado Cloud," Indian Journal of Meteorology and Geophysics, vol. 1, 1950, pp. 240-241.
21. Twentyman, E. w. G., "Tornado at Suva," Quarterly Journal of the Royal Meteorological Societ~, vol. 57, 1931, p. 70.
22. Lamb, H. H., "Tornadoes of May 21, 1950?" Great Britain Meteorological Office, Geop~ysical Memoirs, No. 99, vol. XII, 1957, pp. 1-38.
23. Bonacina, L. C. w., "The Buckinghamshire Tornado," Weather, vol. 5, No.7, 1950, pp. 254-255.
24. Bull, G. A., and Harper, w. G., "WestLondon Tornado, December 8, 1954," Meteorological Magazine, vol. 84, October 1955, pp. 320-322.
25. Delpech, L., "Chartres-de-Bretagne, March 22, 1955," La Meteorologie, Series 4, No. 40, October-December 1955, pp. 317-323.
26. Kohlbach, w., "The West Harz Tornado of May 4, 1952," Meteorologische Rundschau, vol. 8, No. 5-6, 1955, pp. 90-92. ,
27. Klauser, Leopold, "Tornadoes Near Potsdam on June 26, 1951," Zei tschrift f~r Meteorologie, vol. 6, No. 5, 1952, pp. 151-155.
28. Ozorai, Zoltan, "Destructive Storm Near Tata," Idojaras, vol. 58, No. 3; 1954, pp. 190-192.
29. Remizov, G. A., "Tornado pod Moskvoi" ITornado Near Mosco~, Priroda, vol. 43, No. 8, 1954, pp. 100-102.
30. Kolobkhov ~ N. V. , "Smerch pod Moskvoi," ITornado Near Mosco~ , MeteorologiG i Gidrologi1a, No. 6, June 1957, pp. 32-33.
31. Barbour, G. B., "Waterspout and Tornado Within a Typhoon Area," Monthly Weather Review, vol. 52, No. 2, 1924, p. 106.
32. Macky, W. A., "The Easter Sunday Tornadoes at Bermuda," Weatherwise, vol. 6, No. 3, 1953, pp. 74-75.
33. Varney, B. M., "An Early Morning Tornado at Bermuda," Monthly Weather Review, vol. 54, No. 10, 1926, p. 428. ·
34. Hornstein,R. A., "The Tornado at White Point Beach, Nova Scotia of January 1954," Weather, vol. 9, No. 8, 1954, pp. 247-248.
3 5. McKay, G. A. , and Lowe , A. B. , "The Tornado in Western Canada," Bullet in of the American Meteorological Societ~, vol. 41, No. 1, pp. 1-8.
36. Lowe, A. B., and McKay, G. A., "A Tornado at Amaranth, Manitoba," Canada Meteorological Division, Circular 3043, May 1958, 7 pp.
BIBLIOGRAPHY.--For amore complete bibliography on the subject of tornadoes the reader is referred to Meteorological Abstracts and Bibliography~ vol. 1, No. 5, May 1950, and vol. 10? No. 2, February 1959, published by the American Meteorological Society, 45 Beacon Street, Boston 8, Mass.
15

Table 1.--SOME OUTSTANDING TORNADOES, 1876-1958
Year Month & day Location Time of occurrence Deaths Injured Damage t (thous.)
1876 May 6 Chicago, Ill. 5:10p.m. - - $250
1877 June 4 Mt. Carmel, Ill. 4:30 p.m. 16 100 400 July 7 Pensaukee, Wis. Afternoon 8 Many 300
1878 June 1 Richmond, Mo. 4:05 p.m. - - 100 Aug. 9 Wallingford, Conn. 5:45 p.m. 30 70 250 Oct. 8 Monticello, Iowa 5:30 p.m. - - 100
1879 Apr. 14 Collinsville, Ill. 2:35 p.m. 1 7 50 Apr. 16 Walterboro, s. c. 3:45 p.m. 11 - 200 May 29, 30 Kans., Mo., Nebr., Iowa Afternoon-evening 30 50 No estimate June 10 Delphos, Kans. Evening 2 14 100
1880 Apr. 18 Marshfield, Mo. 5:00 p.m. 65 200 110 Apr. 18 Licking, Mo. 8:15 p.m. 1 17 50 Apr. 18 Fayetteville, Ar}<. 8:30 p.m. 2 25 100 Apr. 25 Macon, Miss. 8:30 p.m. 22 72 100
1881 Apr. 12 Hernando, Miss. 2:00 p.m. 10 - 50 July 15 New Ulm, Minn. 4:45 p.m. 6 53 400 Sept. 24 Quincy, Ill. 5:00 p.m. - - 100
1882 Apr. 5 Stafford, Kans. 4:00 p.m. 1 Several 100 Apr. 18 Brownsville, Mo. 4:20 p.m. 11 150 180 May 8 Mt. Ida, Ark. 5:30 p.m. 2 Several 150 June 17 Grinnell, Iowa 8:45 p.m. 130 300 1,000
'
1883 Apr. 22 Copiah County, Miss. 1:10 p.m. 42 100 470 May 13 Kansas City, Mo. 4:30 p.m. - - 300 May 18 Racine, Wis. 7:00 p.m. 25 100 200 May 18 Orongo, Mo. 7:40 p.m. 6 33 75 A~g. 21 Rochester, Minn. 6:36 p.m. 31 - 200 Nov. 5 Springfiel<;l, Mo. 2:00 p.m. Several - Considerable
1884 Feb. 19 Bird's Point, Mo. - - - 80 Feb. 19 Ala., Ga., N. c.' s. c. Afternoon 420 1,000 3,000 Apr. 1 Oakville, Ind. 5:00p.m. 4 50 75 Apr. 27 Jamestown, Ohio 4:00-5:00 p.m. 6 - 200 July 21 Dell Rapids, s. Dak. 3:05 p.m. - - 100 Aug. 28 Huron, s. Dak. 3:00 p.m. 6 - Considerable Sept. 9 White Bear Lake, Minn. -Clear 5:00 p.m. 6 75 4,000
Lake, Wis. Sept. 28 Shong6, N. Y. 6:20 p.m. 2 20 80
1885 Aug. 3 Camden, N. J. 3:20 p.m. 6 100 500 Sept. 8 Washington Courthouse, Ohio 8:00 p.m. 6 100 500
1886 Apr. 14 St. Cloud & Sauk Rapids, Minn. 4:00 p.m. 74 136 500 May 12 Attica, Ind. 8:15 p.m. - 12 200
1887 Apr. 15 St. Clairsville & Martin's 3:20 p.m. - - 250 Ferry, Ohio
Apr. 21 Prescott, Kans. 5:30 p.m. 20 237 1,000 Apr. 22 Mt. Carmel, Ill. 6:00 p.m. 2 Several 50 Apr. 22 Clarksville, Ark. 6:30 a.m. 20 75 150 June 16 Grand Forks, N. Dak. 3:22 4 - 150 p.m. -
1888 Feb. 19 Mt. Vernon, Ill. 4:30 p.m. 18 54 400
18tl9 Jan. 9 Reading, Pa. 5:40 p.m. 40 - 78 Jan. 9 Brooklyn, N. Y. 7:40 p.m. - - 500
1890 Mar. 27 Louisville, Ky. 7:57 p.m. 78 - 4,000 May 10 Akron, Ohio 5:24 p.m. - - No estimate July 26 Lawrence, Mass. 9:10 a.m. 8 - No estimate
1891 May 20 Centralia & Mexico, Mo. 3:00 p.m. 4 35 71
1892 May 27 Harper, Kans. 7:40 p.m. 4 - 371
1893 Apr. 25 Cleveland County, Okla. 5:30p.m. 30 Many 25 Apr. 28 Cisco, Eastland County, Tex. 10:00 p.m. 23 - 400
16

Table 1.--SOME OUTSTANDING TORNADOES, 1876-1958 (Continued)
Year Month & day Location Time of occurrence Deaths Injured Damage (thous.)
t
1894 Oct. 2 Little Rock, Ark. 7:20 p.m. 4 26 $509
1895 July 13 Cherry Hill, N. J. 3:45 p.m. 4 50 93 July 5 Baxter Springs, Kans. Afternoon 5 10 120
1896 May 12, 15 Denton & Grayson, Tex. Afternoon 76 - 231 May 27 St. Louis, Mo. - 306 - 12,904
1897 Mar. 30 Chandler, Okla. 5:30 p.m. 14 40 100
1898 May 18 Iowa, Wis., Ill. 3:20 p.m. 47 Many 700
1899 June 12 New Richmond, Wis. - Many - No estimate
1900 Nov. 20 Ark., Miss., Tenn. Afternoon-evening 73 Many 500
1901 Aug. 24 Bayonne, Jersey City, & Afternoon - - 150 Hoboken, N. J.
1902 Mar. 28 Calhoun County, Miss. & 1:30-3:45 p.m. 2 - Considerable Franklin County, Ala.
1903 June 1 Gainesville, Ga. 12:45 p.m. 98 190 1,000
1904 Aug. 20 Minneapolis-St. Paul, Minn. 8:00p.m. 14 - 1,500
1905 May 10 Snyder, Okla. 6:45-8:45 p.m. 87 49 20
1906 Mar. 2 Meridian, Miss .. 6:30 p.m. 23 - 400
1907 Apr. 5 Alexandria, La., -southern 1:00 a.m. 20 - 200 Mississippi
1908 Apr. 24 Lamar-Wayne Cos., Miss. 3 :0.0 p.m. 100 649 880
1909 Mar. 8 Dallas-Monroe Cos., Ark. 5:00-7:10 p.m. 64 671 635
1910 May 29, 30 Charleston, w. Va. Night 1 - 100
19ll Apr. 12 Brown, Waubaunsee, Douglas, Evening 5 61 855 & Cherokee Cos . , ,Kans .
1912 Apr. 21 Illinois (Series of tornadoes) 4:30-6:00 p.m. 18 - 1,000
1913 Mar. 23 Omaha, Nebr. 5:49 p.m. 95 - 3,500 Mar. 23 Terre Haute, Ind. 9:45 p.m. 21 - 1,000
1914 Aug. 21 Wilkes-Barre, Pa. - 7 50 Considerable
1915 June 17 Pottawatomie, Coffey, Bourbon 4:00-9:00 p.m. 5 8 98 Counties, Kans.
1916 Apr. 19 Southeast Kansas-Vernon Co., Mo. 3:00-5:00 p.m. 12 168 1,235 June 5 Arkansas (series of tornadoes) 1:00 p.m. 83 400 Considerable
1917 Mar. 23 New Albany, Ind. 3:08 p.m. 45 - 2,000 May 26 Mattoon-Charleston, Ill. 12:00 noon 101 638 2,500 May 26 Lake County, Tenn.-Fulton, 4:00-9:00 p.m. 70 - 2,000 Hickman, Carlisle, & Graves Counties, Ky.
1918 Aug. 21 Tyler, Minn. 9:20 p.m. 36 - 1,000
1919 June 22 Fergus Falls, Minn. 4:45 p.m. 59 - 3,500
1920 Mar. 28 Chicago, Ill., & vicinity 12:05 p.m. 28 - 3,000 Mar. 28 Alabama-Georgia 2:30-4:00 p.m. 50 - 1,400 Apr. 20 Oktibbeka County, Miss.- 9:00 a.m. 87 - 1,500 Franklin County, Ala.
May 2 Rogers, Mayes, & Cherokee, Okla. 6:00-8:35 p.m. 64 - 175
1921 Apr. 15 Cass County, Tex.-Miller, I Hempstead, Pike Countie~Ark~ 4:00p.m. 61 - 1,300
17

Year Month & day
1922 Apr. 17 May 4
1923 Apr. 4
1924 Apr. 30 Apr. 30 June 28
1925 Mar. 18
1926 Nov. 9 Nov. 25
1927 Apr. 12 May 9
Sept. 29
1928 June 16 Sept. 14
1929 Apr. 5 Apr. 25
1930 May 6 June 13
1931 Jan. 5 Dec. 12,13
1932 Mar. 21
1933 Mar. 14 May 1
1934 Oct. 23
1935 Mar. 25 Apr. 6
1936 Apr. 2 Apr. 5 Apr. 6
1937 Feb. 20 Mar. 25
1938 Sept. 29
1939 Apr. 16 June 18
1940 Feb. 10
1941 June 9
Oct. 26
1942 Mar. 16 Apr. 27
1943 Apr. 27
1944 June 23
1945 Apr. 12
1946 Jan. 4
1947 Apr. 9
18
Table 1.--SOME OUTSTANDING TORNADOES, 1876-1958 (Continued)
Location
Illinois, Indiana, & Ohio Austin, Tex.
Alexandria-Pineville, La.
Georgia-South Carolina Central South Carolina Lorain-Sandusky, Ohio
Missouri, Illinois, Indiana
La Plata & Cedarville, Md. Belleville to Portland, Ark.
Rock Springs, Tex. Randolph County, Ark.-Poplar Bluff, Mo.
St. Louis, Mo.
Jackson County, Okla. Rockford, Ill.
Minnesota-Wisconsin Southeast to central Georgia
Hill & Ellis Counties,Tex. Minnesota-Wisconsin
Time of occurrence
3:30-8:00 p.m. 4:00p.m.
6:00p.m.
6:00-8:00 a.m. 7:30 a.m. 4:35 p.m.
1:00-4:00 ,P.m.
2:35-3:15 p.m. 4:30-9:30 p.m.
7:45 p.m. 2:05 p.m.
1:00 p.m.
6:15 p.m. 3:22p.m.
5:30 p.m. 4:00p.m~
3:30 p.m. 5:00p.m.
Caswell & Warren Counties,N.C. 4:00p.m. Columbia & Ouachita Counties, 11:45 p.m.-12:30 a.~
Ark.
Alabama(series of tornadoes) 3:15-7:00 p.m.
Nashville, Tenn. 7:30p.m. Webster-Bienville Parishes, La. 4:00 p.m.
Maryville, Mo. 5:15 p.m.
Massac County, Ill. 3:40p.m. Wilkinson-Amite Counties,Miss. 7:30 p.m.
Cordele, Ga. Tupelo, Miss. Gainesville, Ga.
South-central Missouri Fayette & Clark Counties, Ky.
Charleston, S. C.
7:30 p.m. 8:55 p.m. 8;27 a.m.
4:00-5:00 p.m. 6:00p.m.
6:45 a.m.
Drew County, Ark. 3:10p.m. Hennepin & Anoka Counties, Minn. 3:10p.m.
Dougherty County, Ga. 4:20 a.m.
Lamb, Swisher, Donley Counties, 4:00a.m. Tex.
Dardenelle to Hamburg, Ark. 11:15 p.m.
Central to northeast Mississippi 4: 00 p.m. Rogers & Mayes Counties, Okla. 3:45p.m.
Akron-Cleveland, Ohio 7:30 p.m.
Ravenna, Ohio~Pennsylvania-West6:00-9:30 p.m. Virginia to Cumberland, Md.
Oklahoma-Arkansas
Northeast Texas
Texa~ Oklahoma & Kansas
3:25-6:00 p.m.
2:10-9:00 p.m.
6:00-10:00 p.m.
Deaths Injured Damage t (thous.)
16 12
14
10 67 85
689
17 53
74 92
72
4 14
6 40
41 6
6 1
268
15 23
5
1 11
23 216 203
5
32
27 9
18
4
19
75 52
3
150
102
30
169
53 50
1,980
52
Several
1,874
Many 400
12
34 75
500 700 934
13 23
150
62 222
397
33
95
525 181
214
867
689
335
983
$ 900 500
750
2,202 1,000
12,000
16,500
100 627
1,230 2,287
22,000
1,500 1,200
1,010 850
2,100 1,100
45 1,250
5,000
2,200 1,250
900
300 190
3,000 3,500
13,000
190 150
2,000
20 1,200
3,200
510
200
1,400 2,000
3,500
4,200
4,000
2,700
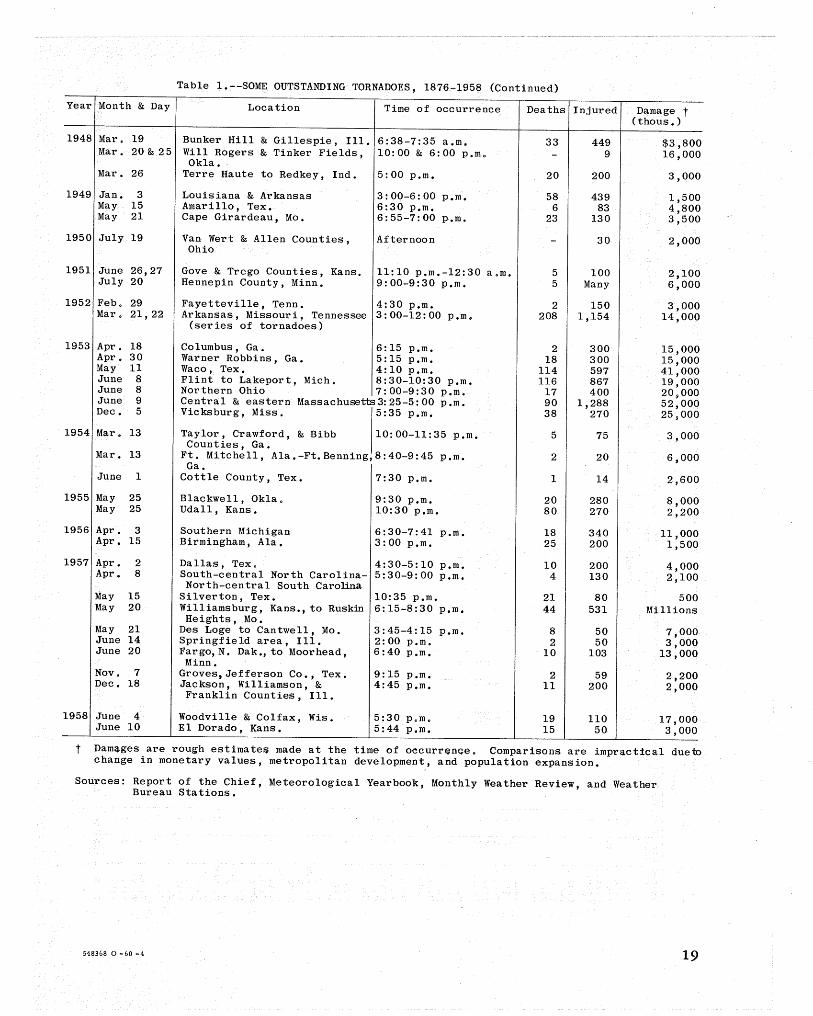
Year Month & Day
1948 Mar. 19 Mar. 20 &.25
Mar. 26
1949 Jan. 3 May 15 May 21
1950 July 19
1951 June 26,27 July 20
1952 Feb. 29 Mar. 21, 22
1953 Apr. 18 Apr. 30 May 11 June 8 June 8 June 9 Dec. 5
1954 Mar. 13
Mar. 13
June 1
1955 May 25 May 25
1956 Apr. 3 Apr. 15
1957 Apr. 2 Apr. 8
May 15 May 20
May 21 June 14 June 20
Nov. 7 Dec. 18
1958 June 4 June 10
Table 1.--SOME OUTSTANDING TORNADOES, 1876-1958 (Continued)
Location Time of occurrence
Bunker Hill & Gillespie, Ill. 6:38-7:35 a.m. Will Rogers & Tinker Fields, 10:00 & 6:00p.m. Okla.
Terre Haute to Redkey, Ind.
Louisiana & Arkansas Amarillo, Tex. Cape Girardeau, Mo.
Van Wert & Allen Counties, Ohio
Gove & Trego Counties, Kans. Hennepin County, Minn.
5:00p.m.
3:00-6:00 p.m. 6:30 p.m. 6:55-7:00 p.m.
Afternoon
11:10 p.m.-12:30 a.m. 9:00-9:30 p.m.
Fayetteville, Tenn. 4:30p.m. Arkansas, Missouri, Tennessee 3:00-12:00 p.m.
(series of tornadoes)
Columbus, Ga. Warner Robbins, Ga. Waco, Tex. Flint to Lakeport, Mich. Northern Ohio
6:15 p.m. 5:15 p.m. 4:10p.m. 8:30-10:30 p.m. 7:00-9:30 p.m.
Central & eastern Vicksburg, Miss.
Massachusetts 3:25-5: 00 p.m. 5:35 p.m.
Taylor, Crawford, & Bibb 10:00-11:35 p.m. Counties, Ga.
Ft. Mitchell, Ala.-Ft.Benning,8:40-9:45 p.m. Ga.
Cottle County, Tex. 7:30 p.m.
Blackwell, Okla. Udall, Kans.
Southern Michigan Birmingham, Ala.
9:30 p.m. 10:30 p.m.
6:30-7:41 p.m. 3:00 p.m.
Dallas, Tex. 4:30-5:10 p.m. South-central North Carolina- 5:30-9:00 p.m. North-central South Carolina
Silverton, Tex. Williamsburg, Kans., to Ruskin Heights, Mo.
Des Loge to Cantwell, Mo. Springfield area, Ill. Fargo,N. Dak., to Moorhead,
Minn. Groves,Jefferson Co., Tex. Jackson, Williamson, & Franklin Counties, Ill.
Woodville & Colfax, Wis. El Dorado, Kans.
10:35 p.m. 6:15-8:30 p.m.
3:45-4:15 p.m. 2:00p.m. 6:40p.m.
9:15 p.m. 4:45 p.m.
5:30 p.m. 5:44 p.m.
Deaths Injured Damage t (thous.)
33
20
58 6
23
5 5
2 208
2 18
114 116
17 90 38
5
2
1
20 80
18 25
10 4
21 44
8 2
10
2 11
19 15
449 9
200
439 83
130
30
100 Many
150 1,154
300 300 597 867 400
1,288 270
75
20
14
280 270
340 200
200 130
80 531
50 50
103
59 200
110 50
$3,800 16,000
3,000
1,500 4,800 3,500
2,000
2,100 6,000
3,000 14,000
15,000 15,000 41,000 19,000 20~000 52,000 25~000
3,000
6,000
2,600
8,000 2,200
11 ,ooo 1,500
4,000 2,100
500 Millions
7,000 3,000
13,000
2,200 2,000
17,000 3,000
t Damages are rough estimatee made at the time of oecurrence. Comparisons are impractical duem change in monetary values, metropolitan development, and population expansion.
Sources: Report of the Chief, Meteorological Yearbook, Monthly Weather Review, and Weather Bureau Stations.
548368 0-60 -4 19

N 0
States
Ala. Ariz. Ark. Calif. Colo.
Conn. Del. D. C. Fla. Ga.
Idaho Ill. Ind. Iowa Kans.
Ky. La. Md. Maine Mass.
Mich. Minn. Miss. Mo. Mont.
Nebr. Nev. N. H. N. J. N. Mex. N. Y. I N. C. N. Dak. Ohio Okla. Oreg. Pa. R. I. s. c. S. Dak.
Tenn. Tex. Utah Va. Vt.
Wash. W. Va. Wis .. Wyo.
u. s.
Num- Days ber
6 4 1 1
32 4
1 1
1 1 2 2 2 2 6 4 8 3
1 1 1 1
2 2 2 2 9 7 2 1
4 3
1 1
1 1 4 2
2 2
1 1 2 2 1 1
1 1
1 1
*90 136
Table 2.--NUMBER OF TORNADOES, DAYS, DEATHS, AND DAMAGE FOR STATES AND UNITED STATES BY YEARS 1916-58
1916 1917 1918 1919
Deaths Damage t Num- Days Deaths Damage t Num- Days Deaths Damage t Num- Days Deaths Damage t Num-(thous.) ber (thous .• ) ber (thous.) ber (thous.) ber
1 ,J/$4 4 2 40 Y$430 3 2 13 Y$1oo 2 2 5 $201 5
101 (2)
,Y10 8 7 28 178 7 5 1 148 3 3 6 98 2
30 2
2 2 1 ¥7 3 3 v31 1
(3) Y687 2 YlO 4 3 106 .3,342 5 3 6 7
(3) 9 4 75 ..,Y-3,200 3
tno 2 2 8 11 6 29 .¢/2,450 13 8 ~157 7 3 235 17 7 42 Y1,81o 6 4 10 -Y'810 5 4 5 229 5
30 4 4 75 ,Y2,000 1 2 40 3 2 4 J/45 1
(3) 3 2 4 ¢/1,000 3 3 Y2o 6 50 2 2 36 ¢/1,000 1 l 59 3;500 3
18 .J/313 5 4 1 31 1 1 1 20 2 2 36 1,050 5 9 1,000 30 7 84 ,Yl,550 7 5 13 .Y308 5 2 52 4
1 1 (3)
J/20 2 2 (3) 4 4 3 V3oo 5 2 1 ¥250 4
1
Y5 1 1 (2) 1
2 2 1 20 1 1 15 1 1 40 1 1 2 2
2 2 -V(3) 2 2 .¢15 4 1 100 4 2 4 275 2 2 ¢-'(3)
V535 7
9 ¥35 17 6 21 ..V425 3 3 3 20 7 4 24 5
3 3 1 (3) 2 2 175. 3 3 2 Y3o
2 2 33 1 1 1 15 2 2 6 8 4 206 11 8 1 YlOO 1 1 (2) 2
8 6 3 26 ~~95 1 1 8 4 v25 3 3 200 8 3 9 V5lo 9 3 64 V668 4
(2) 1 1 1 50 1 1 2
(3)
20 3 3 9 715 1 1 1 1 1 1 2 1
150 J,-1;2,266 *121 h8 509 ¢-$15,009 *81 f45 135 V$7,432 *64 't35 206 ¥$6,863 *87
1920
Days Deaths Damage t (thous .. )
3 108 V$2,155
2 18 V1oo
1 (3)
1 33 1,250
4 28 V3,19o 1 39 .¢/1,350 5 198 4 V2o1
1 (3) 1 (3)
2 12 J/2,000 2 2 (3) 2 135 1,500 3 13 316
3 (3)
1 (3) 1 (3) 1 2 200 2 3 28(] 3 1 ¥53 4 31 ] ,512 3 64 385
7 171 2 (3)
4 2 ~33 4 6 79
1 1 25 1 1(]
t 50 498 Y$15,ooa

N 1-l
States
Ala. Ariz. Ark. Calif. Colo.
Conn. Del. D. C. Fla. Ga.
Idaho Ill. Ind. Iowa Kans.
Ky. La. Md. Maine Mass.
Mich. Minn. Miss. Mo. Mont.
Nebr. Nev. N. H. N. J. N. Mex
N. Y, N. C. N. Dak. Ohio Okla.
Oreg. Pa. R. I. s. c. S. Dak
Tenn. Tex. Utah Va. Vt.
Wash. w. Va. Wis. Wyo.
u. s.
Num- Days ber
7 3
12 7 1 1 1 1
1 1 3 3
3 3 2 2
10 5 6 5
2 2 2 2
3 3 2 2
11 7 1 1
6 4
1 1 1 1
2 2 2 2 3 3 1 1
2 2 2 2
9 5 17 10
1 1
1 1 1 1
*105 t 55
Table 2.--NUMBER OF TORNADOES, DAYS, DEATHS, AND DAMAGE FOR STATES AND UNITED STATES BY YEARS 1916-58 (Continued)
1921 1922 1923 1924 1925
Deaths Damaget Num- Days Deaths Damage t Num- Days Deaths Damage t Num- Days Deaths Damage t Num- Days Deaths Damage t (thous.) ber (thous.) ber (thous.) ber (thous .) ber (thous.)
10 $756 8 5 3 Y$140 1 1 1 $12 13 5 40 _y $288 5 3 19 $295
73 Yl,503 9 6 14 V75 3 2 52 4 4 5 Y15o 5 4 43 17 1 1 50
(3) 2 1 5 130 2 1 (3) 1 1 10 6 1 1 100
1 1 (2) 15 2 2 5 270
30 -V25o 11 3 17 614
V3 2 2 7 295 1 1 10 3 3 87 4 4 606 13 ,303 .V5o 4 2 17 466
.V95 2 2 .V33 7 6 74 V3 ,o03
4 ¥684 9 8 1 747 7 6 6 6 5 1 .V99 18 8 6 V'2,150 .J/5 6 6 ¥5 18 12 1 .V212 16 9 2 1/2,142 12 8 .:v 367
50 1 1 (3) 8 3 21 1,360 8 160 1 1 3 50 5 5 25 965 3 2 2 YlOO 3 3 5 ¥5
1 1 100
1 1 200 1 1 2 750 1 1 1 200
.J/3o 3 2 y31 2 2 Y1 J/5oo
4 4 .¢-28o 2 .Y2oo 2 2 17 2 2 3 3 3 138
42 ,Y85 9 5 7 .V350 2 1 17 350 8 4 20 }'1,010 1 1 2 250 (2) 4 4 4 177 6 4 .61104 9 6 10 V3o4 4 4 13 V5n
1 1 (3) 7 6 2 ¥4 5 4 V50
(3) 5 4 1 Y1oo 6 4 3 !/32 5 5 1 (3) 7 4 3 ~57
1 1 10 (3) (3) 3 3 V1 2 2 12
2 2 125 1 1 5 1 .1 150 1 1 400 3 60 2 2 1 31 1 1 1 100 3 2 5 225 1 70 2 2 (3) 5 5 8 ¢-P> 2 1 6 V3oo 1 1 10
425 4 4 4 .Y8oo 2 2 75 5 3 91 ¥12,555 2 2 105 75 9 6 25 1,285 8 7 1 Yn3 7 4 25 1,307 8 4 2 .¢/90
2 2 :V1o 2 2 1 50 1 1 20 4 4 6 557 3 1 164
1 6 2 2 5 46 1 1 1 6 4 78 3,055 1 1 3 (2) 2 1 1 175 2 2 (3) 1 1 (3) 3 2 30
6 .v211 3 3 220 3 3 20 yl71 2 1 1 V25 6 4 29 168 22 ¥737 14 11 28 959 8 7 23 261 7 5 7 .Y'll8 6 6 3 Yl27
5 2 2 30 1 1 (3) 2 1 1 31 1 1 5
1 1 (2) 1 1 3 20
60 3 3 8 560 Y14
'l 3 43 1,618 4 4 2 67 (2) 7 5 1 1 1 0
202 -¥$5,457 *108 t 64 135 Y$6,881 *102 t 59 109 Y'$2,969 *130 t 57 376 V$26,074 *119 t 65 794 -Y$24 ,041

N N
States
Ala. Ariz. Ark. Calif. Colo.
Conn. Del. D. C. Fla. Ga.
Idaho Ill. Ind. Iowa Kans.
Ky. La. Md. Maine Mass.
Mich. Minn. Miss. Mo. Mont.
Nebr. Nev. N. H. N. J. N. Mex
N. Y. N. C. N. Dak Ohio Okla.
Oreg. Pa. R. I. s.· c. S. Dak
Tenn. Tex. Utah Va. Vt.
Wash. W. Va. Wis. Wyo.
u. s.
Num-ber
1
17 4 1
1
2
1 3 6
14
5 1
2
4 3
4
1 2
1 1 1 6 4
1 1
4 6
2 11
1 2 5
*111
Table 2.--NUMBER OF TORNADOES, DAYS, DEATHS, AND DAMAGE FOR STATES AND UNITED STATEaBY YEARS 1916-58 (Continued)
1926 1927 1928 1929
Days Deaths Damage t Num- Days Deaths Damage t Num- Days Deaths Damage t Num- Days Deaths Damage t Num- Days (thous.) ber (thous.) ber (thous.) ber (thous.) ber
1 4 $25 1 1 1 (3) 3 2 8 $65 3 1 5 $61 3 3
4415 ¥126 1{,225 4 60 23 8 115 $1,944 5 5 5 21 8 79 5 4 2 185
V2s1 1 1
1 5 5 5 5 1 1
1 8
.v35 2 2 301
2 1 4 3 66 1 1 1 10 6 3 1 145 7 5 8 63 9 3 55 1,196
lis' 070 1 200 18 7 36 7 7 14 1,240 4 4 2 74 7 6 3 V6o 9 7 1 3,264 3 3 ~ 82 2 2 1 35 2 2 5 2 V427 10 7 1 168 45 20 8 ~70 28 13 3 ~32 40 18 8 Vl61 21 12 19 Vl,742 26 13 1 277 20 12 1 15 24 10
~15 .!{65 2 1 94 3 2 ~, 610
4 21 6 3 32 1 1 1 13 2 2 14 5 3 1 17 100 1 1 65 1 1 1 10 2 1 6 190
1 1 25 1 1 1 100
1 3 40 5 4 235 4 3 Val 2 1 75 14 7 2 2 101 5 4 6 1,190 4 4
2: I 1,460 5 2
3 14 (3) 2 1 14 20 2 2 (3) 4 4 (3) 5 4 2 5 268 15 9 176 24,927 8 3 1 279 11 6 4 ;/549 7 2
1 1 6 2 2
3 M56 6 4 113 12 7 4 Yi,826 5. 4 !1130 13 9
1 1 50 1 1 200 1 50 1 1 1 55 1 1 2 10 1 1 (2) 3 3 !/so 1 1
1 200 1 1 1 1 25 1 1 75 2 2 3 100 4 2 1 ~90 1 1 1 20 4 3 ;)/25 6 5 65 5 1 224 4 4 50 5 5 2 .¥1,156 4 2 2 33 3 3 2 8 238 10 8 20 !/548 8 7 7 J-1.,583 11 9 3 Vs12 19 7
1 (2) Ysoo 1 100 1 1 200 2 2 3 3 65 2 2
Ysss 4 1 1 1 1 7 3 2! ~32 7 7 17 158 2 2 6 Yl31 2 2 167 5 5 4 86 1 1 5 1 1
2 5 ~,783
9 5 6 315 1 1 2 ~10 1 1 8 4 ~52 25 8 124 19 10 5 Y673 25 17 17 02 20 12
1 1 325 5 1 22 475 1 2 20 1 1 (3)
1 10 2 3 85 1 1 1 8 4 363 6 4 12 1,247 12 6 5 11 2 2 362 2 2
t 57 144 .V$4 ,326 *163 t 62 540 Y43....t.457 *203 t 79 92 ~13 239 *197 'I' 74 ~ -~10,113 *192 'I' 72
1930
Deaths .Damage t (thous.)
$20
19 289 20
3 10
789 6
3 yj 445 2 1,288
7 84
1,794 1 Y235 5 88 8 893
(2)
5 !k61
35 3 150
2
35 ifs61
650
28
16 (2)
25 80 2,436
8 2,164 3
179 ~l_g_,292

N ~
States
Ala. Ariz. Ark. Calif. Colo.
Conn. Del. D. C. Fla. Ga.
Idaho Ill. Ind. Iowa Kans.
Ky. La. Md. Maine Mass.
Mich. Minn. Miss. Mo. Mont.
Nebr. Nev. N. H. N. J. N. Mex.
N. Y. N. C. N. Dak. Ohio Okla.
Oreg. Pa. R. I. s. c. S.Dak.
Tenn. Tex. Utah Va. Vt.
Wash. W. Va. Wis. Wyo.
u s.
Table 2.--NUMBER OF TORNADOES, DAYS, DEATHS, AND DAMAGE FOR STATES AND UNITED STATES BY YEARS 1916-58 (Continued)
1931 1~32 1933 1934
Num- Days Deaths Damage 1 Num- Days Deaths Damage t Num- Days Deaths Damage t Num- Days Deaths Damage t Num- Days ber (thous.) ber (thous.) ber (thous.) ber (thous.) ber
6 3 5 $27 23 8 287 $5,141 11 5 26 V$648 4 2 5 $117 5 4
v'2~~ 4 5 1 1,264 5 4 137 26 16 17 6 4 2 47 13 10 2 1 1 1 Is 4 4 1'53 1 1 (3) 2 2 1 1
y'g Vs2 1 1 40 2 2 1 (3) 8 6 10 6 2 2 2 15 6 46 309 3 3 2 ¥77 3 1 2 Y5oo 6 3
1 1 (3) 1 1 50 4 2 28 4 4 6 1{80 3 1 19 2 2 3 3 107 5 3 387 5 3 v. 59 2 2 Y. 14 2 2
19 10 4 478 16 9 ls11 22 5 ~32 13 8 1 449 6 5 11 9 2 ¥73 19 15 7 94 29 20 5 50 20 16 1 !/98 15 8
Y15 !{ 2 1 36 ~ 245 2 1 6 350 5 4 2 2 2 15 8 46 2,133 6 3 2 ~~ 7 5 1 1 (2) 1 1 (3) 4 3 2 2 1 1 10
2 2 8 1 1
3 3 !Is 5 6 1,220 2 2 2 ~2 2 2 1 700
¥!so 5 4 1 929 15 11
3 3 5 2 8 5 5 J-25 25 9 58 6 3 14 !/35 13 8 3 2 47 2 2 Vs 11 9 3 !/96 4 4 5 Y9o6 2 2 2 1 3 1 1 5 5 4 !/52 3 3 53 1 1
1 1 65 4 3 2 !1{6 5 4 8 192 7 5 78 14 9
1 1 4 3 3 !ri,ol5 3 1 1 28 2 2 16 2 2 4 1 1
1 1 1 1 1 100 2 2 3 2 6 50
lhoo 1 1 (3)
2 2 30 1 1 5 3 2 4 1 1 (3) 2 2 2 2 ¢':60 4 3 Ys4 5 5 1 !11. '204 1 1 1 1 1 3 3 4 85 1 1 (2) 10 8 "11 V411 11 7 4 .!h4o 13 10
2 2 Vro 1 1 750 1 1 8 1 1 1 1 5
1 1 4 3 3 4 ~04 2 2 19 360 1 1 ln 8 6 2 2 31 6 4 278 11 9 1 V347 10 7 1 2 2
9 3 38 510 13 5 87 Vs ,143 2 2 13 4 2 8 8 2 133 10 8 3 173 21 13 30 :Y1 ,249 13 11 1 Yl64 28 19
3 3 1 17 7 2
4 3 1 333 1 1 2 7 6 2 265 8 8 ~5 7 5 3 3 (3)
_!~1_ j_Q1 36 .v$3 219 *151 f 67 394 ~8 890 *258 f 96 362 :)..116 193 *147 f77 47 -~4 427 *180 'f-77
1935
Deaths Damage t (thous.)
3 $37
7 365
1
4 1{,7
1 ~0 0
~69 58
9 1{10 205
(3)
~75 3 17 769
:Y38 10
8 280
6
2 M.o
5 (3) 5
1 !hl2
5
~~ 3 109 9 Y412
2 96
M53
70 ~4.f\f\::i

N ~
States
Ala. Ariz. Ark. Calif. Colo.
Conn. Del. D. C. Fla. Ga,
Idaho Ill. Ind. Iowa. Kans.
Ky. La. Md. Maine Mass.
Mich. Minn. Miss. Mo. Mont.
Nebr. Nev. N.H. N. J. N. Mex.
N. Y. N. C. N.Dak. Ohio Okla.
Oreg. Pa. R. I. s. c. s. Dak.
Tenn. Tex. Utah Va. Vt.
Wash. w. Va. Wis. Wyo.
u. s.
Num-ber
10
9 2
1
4 16
1
1 9
13
2
3
1 5 5 5 4
3
1 3
3 4 1
21
2 4
4 12
1 1
1
3
*151
Table 2.--NUMBER OF TORNADOES, DAYS, DEATHS, AND DAMAGE FOR STATES AND UNITED STATESBY YEARS 1916-58 (Continued)
1936 1937 i938 1939 1940
Days Deaths Damage t Num- Days Deaths Damage t Num- Days Deaths Damage t Num- Days Deaths Damage t Num- Days Deaths Damage t (thous.) ber (thous.) ber (thous.) ber (thous.) ber (tho us.)
5 20 Ji327 5 5 7 Jt$50 6 3 12 $205 10 6 4 $147 5 4 7 ~58 1 1 3
%95 6 3 107 5 4 3 272 22 7 20 413 15 6 31 2 2 6 14 2 (3)
3 3 10 3 2 32 1 1 0
1 (3) 2 2 50 1 1 50
Ys2 1}2 4 7 45 6 6 49 4 4 1 8 8 4 6 3 8 240 Jtl6,118 4 2 Y1 4 2 1 38 10 7 3 Yl61 3 3 18 3,202
1 2 4 1 1 1 1 1 25 1 1 88 16 6 24 2,002 4 4 175 7 3 3 555
1 (2) 3 3 20 2 2 274 4 3 59 2 1 1 160 3 2 ¥:662 31 18 1 Ys96 9 5 42 10 7 Y19e 10 7 !/134 8 139 15 7 1 92 31 11 17 885 16 12 y 57 10 8 Y25
1 1 5 150 2 1 2 Y1o2 1 2 54 2 2 1 55 7 6 26 277 7 4 10 16 8 14 613
9 8 329 4 4 80 3 3 1 62 1 1 3 1 1 (3)
3 201 1 1 3 1 1 2
1 !.-810 9 2 2 Yi,892 3 3 91 6 6 1 213 12 5 546 3 3 10 ,251 2 224 h~so 3 2 }'323 8 5 1 64 5 5 212 6 4 1 y:_55 4 4 65 12 6 3 26 18 .7 17 565 5 4 56 2 1 6 50 4 4 1 1 2 1 1 0
3 37 5 2 49 8 5 3 61 9 6 89
1 1 1 1 1 6 1 (3) 1 1 2 3 1 11 1 1 0
3 (3) 1 1 20 1 1 1 1 1 1 20 2 14 ~,073 2 2 50
~00 2 2 1 ~~ 3 3 (3)
1 5 2 2 2 J75 2 2 1 1 2 2 3 240
J4lo 3 2 3 15 2 2 2 (3)
M.o4 1 1 (3)
8 14 6 3 1 267 13 9 305 1 2 7 5 3 ¥->2
1 1 3 1 1 100 3 3 148 2 2 38 1 1 (3)
2 2 251 3 2 .¥,58 9 3 32 2,010 9 8 1 157 1 1 2 4 -!123 5 4 103 8 6 3 146 3 3 1 21 4 4 Y5s
2 11 217 1 1 6 1 1 25 3 3 5 45 2 2 .Yi88 8 3 M,313 7 7 1 164 16 13 22 379 22 14 5 ~64 18 12 4 178
1 45 1 1 2 2 2 3 7 2 2 1 104 1 1 J/3 1 2 1 1 3
1 0
3 35 1 1 10 3 3 15 2 1 2 8 4 3 13 1 1 (3)
'I' 71 552 J.-$26,229 *147 r 75 29 ~3,158 1*213 t 76 183 ~8,798 *152 t 75 87 ~5,893 *124 t 62 65 1}$6, o19

N VI
States
Ala. Ariz. Ark. Calif. Colo.
Conn. Del. D. C. Fla. Ga.
Idaho Ill. Ind. Iowa Kans.
Ky. La. Md. Maine Mass.
Mich. Minn. Miss. Mo. Mont.
Nebr. Nev. N.H. N. J. N. Mex
N. Y. N. C. N. Dak Ohio Okla.
Oreg. Pa. R. I. s. c. S. Dak
Tenn. Tex. Utah Va. Vt.
Wash. W. Va. Wis. Wyo.
u. s.
Num- Days ber
3 2 1 1 3 3
2 2
5 5 1 1
4 2
24 9 19 12
7 7 1 1
1 1
1 1 6 5
4 3
4 3
1 1 3 3
1 1
1 1 8 5
3 3
1 1
1 1 12 10
1 1 1 1
4 4 1 1
*118 t 57
Table 2.---NUMBER OF TORNADOES, DAYS, DEATHS, AND DAMAGE FOR STATES AND UNITED STATES BY YEARS 1916-58 (Continued)
1941 1942 1943 1944 1945
Deaths Damage t Num- Days Deaths Damage t Num- Days Deaths Damage t Num- Days Deaths Damage t Num- Days Deaths Damage t (thous.) ber (thous.) ber (thous.) ber (thous.) ber (thous.)
8 5 6 $121 3 2 6 $703 6 2 7 $630 8 2 36 $1,967
19 $210 7 2 33 2,265 16 2 40 641 3 3 27 535 (3)
Yso 1 1 50
52 3 3 4
1 1 (3) 155 1 1 (2)
1 1 0 Y1o 16 1 1 (3) 1 1 (2) 6 3 6 6 1 80
16 5 2 13 407 6 2 6 322 6 5 25 1,630 5 3 8 205
22 8 6 21 1,832 2 1 11 1 1 2 800 3 2 1 5,330
Yrnz 6 3 6 1,209 4 4 812 3 3 15 6 6 1,332
1 18 8 1 471 36 8 ¥865 29 10 3 2,204 6 5 245
8 596 18 11 22 Y161 13 5 1 ¥970 23 17 480 13 12 278
1 1 24 312 ~26 4 134 2 2 2 8 5 3 5 2 2 3 (3) 6 3 4 329
5 2 1 8 3 2 20 4 1 5 1,150 1 1 8
1 1 1 3
100 ~62
6 3 1k2o 6 698 6 5 2 8 6 1 !1428 1 1 250 Vs
Jt55o 5 3 76 .!11 .p5o 5 2 2 V7 3 3 8
6 9 7 3 31 5 5 4 85 3 2 100 7 3 6 765 1 1 (3) 1 1 2 1 1 (3) 1 1 0
33 7 4 6 213 2 2 2 34 4 3 177 3 2 7 306
1 400 1 1 50 3 1 1 25
1 1 5,000 4 1 1 1 45 1 1 6 128 3 3 298
?4,695 3 3 80
4 2 2 (3) 13 5 6 3 2 {3) 1 216 15 11 114 2,580 7 7 4 63 22 9 3 770 18 10 104 4,550
.hoo 3 2 45 5 3 44 2,050 3 2 140
7 4 1 73 4 4 19 324 6 4 2 127 (3) 4 4 2 6 4 3 1 22 1 1 200 1 1 (3)
{3) 10 4 28 1,075 3 3 7 9 6 7 y4 ,819 6 586 11 7 16 1,720 17 9 14 ~,133 4 4 4 1,132 18 12 5 680
4 1 50 1 1 5 3 2 3 606
3 1 103 2,000 27 9 6 1 259 i2 5 4 7 1,189 4 4 1 138
{3) 1 1 2 {3) 3 3 5 4 15
53 J.'$4,494 *167 f 66 384 ~15,272 *152 t 61 58 ~12,200 *169 f.68 275 Y$21,645 *121 t 66 210 ~22,071 -
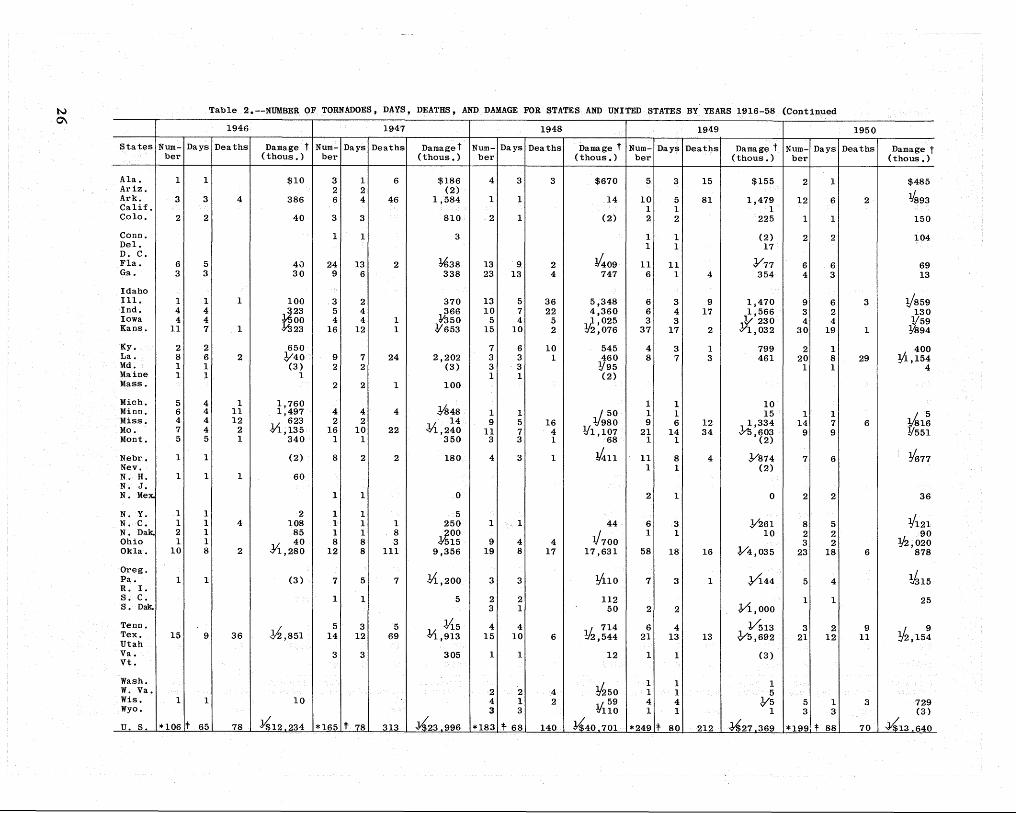
N 0\
States
Ala. Ariz. Ark. Calif. Colo.
Conn. Del. D. C. Fla. Ga.
Idaho Ill. Ind. Iowa Kans.
Ky. La. Md. Maine Mass.
Mich. Minn. Miss. Mo. Mont.
Nebr. Nev. N. H. N. J. N.Mex.
N. Y. N. C. N. Dak. Ohio Okla.
Oreg. Pa. R. I. s. c. S. Dak.
Tenn. Tex. Utah Va. Vt.
Wash. W. Va. Wis. Wyo.
u. s.
Num- Days ber
1 1
3 3
2 2
6 5 3 3
1 1 4 4 4 4
11 7
2 2 8 6 1 1 1 1
5 4 6 4 4 4 7 4 5 5
1 1
1 1
1 1 1 1 2 1 1 1
10 8
1 1
15 9
1 1
*106 t 65
Table 2.--NUMBER OF TORNADOES, DAYS, DEATHS, AND DAMAGE FOR STATES AND UNITED STATES BY YEARS 1916-58 (Continped
1946 1947 1948 1949 1950
Deaths Damage t Num- Days Deaths Damaget Num- Days Deaths Damage t Num- Days Deaths Damage t Num- Days Deaths Damage t (thous.) ber (thous.) ber (thous.) ber (thous.) ber (thous.)
$10 3 1 6 $186 4 3 3 $670 5 3 15 $155 2 1 $485 2 2 (2)
Ys93 4 386 6 4 46 1,584 1 1 14 10 5 81 1,479 12 6 2 1 1 1
40 3 3 810 2 1 (2) 2 2 225 1 1 150
1 1 3 1 1 (2) 2 2 104 1 1 17
4J 24 13 2 1t38 13 9. 2 ~09 11 11 Y77 6 6 69 30 9 6 338 23 13 4 747 6 1 4 354 4 3 13
VB 59 1 100 3 2 370 13 5 36 5,348 6 3 9 lp470 9 6 3
~23 5 4 366 10 7 22 4,360 6 4 17 1,566 3 2 130 00 4 4 1 !1350 5 4 5 !A,025 3 3 v 230 4 4 :J/59
1 23 16 12 1 V653 15 10 2 2,076 37 17 2 Y1,o32 30 19 1 !--894
650 7 6 10 545 4 3 1 799 2 1 400 2 J/40 9 7 24 2,202 3 3 1 460 8 7 3 461 20 8 29 ;1.,154
(3) 2 2 (3) 3 3 !/95 1 1 4 1 1 1 (2)
2 2 1 100
1 1,760 JtS4s
1 1 10 11 1,497 4 4 4 1 1 ~50 1 1 15 1 1 ~1~ 12 623 2 2 14 9 5 16 19so 9 6 12 Ji,334 14 7 6
2 M.;135 16 10 22 4'1,240 11 7 4 V1 ,101 21 14 34 ,603 9 9 !/551 1 340 1 1 350 3 3 1 68 1 1 (2)
(2) 8 2 2 180 4 3 1 ~11 11 8 4 Ys74 7 6 Y677 1 1 (2)
1 60
1 1 0 2 1 0 2 2 36
2 1 1 5 Y121 4 108 1 1 1 250 1 1 44 6 3 .V261 8 5
85 1 1 8 200 v1oo
1 1 10 2 2 90 40 8 8 3 ¥515 9 4 4 3 2 1}2,020
2 .Yi,280 12 8 111 9,356 19 8 17 17,631 58 18 16 V4,035 23 18 6 878
(3) 7 5 7 M,2oo 3 3 !h1o 7 3 1 044 5 4 Vsl5
1 1 5 2 2 112 1 1 25 3 1 50 2 2 VI.,ooo
~,851 5 3 5 .!,{5 4 4 1). 714 6 4 Vsl3 3 2 9 ~,15: 36 14 12 69 ~,913 15 10 6 1 2,544 21 13 13 ~5,692 21 12 11
3 3 305 1 1 12 1 1 (3)
~50 1 1 1
2 2 4 1 1 5 10 4 1 2 59 4 4 ¢/5 5 1 3 729
3 3 Y11o 1 1 1 3 3 (3)
78 Jil2 234 *165 t 78 313 Jt(23 996 *183 t 68 140 M(40 701 *249 t 80 212 ~27 369 !199' + 88 70 -Jt(13 640

tv .......
"'
~ 0 I 0' 0
I <.n
States
Ala. Ariz. Ark. Calif. Colo.
Conn. Del. D. C. Fla. Ga.
Idaho Ill. Ind. Iowa Kans. Ky. La. Md. Maine Mass.
Mich. Minn. Miss. Mo. Mont.
Nebr. Nev. N. H. N. J. N. Mex.
N. Y. N. C. N. Dak. Ohio Okla.
Oreg. Pa. R. I. s. c. S. Dak.
Tenn. Tex. Utah Va. Vt.
Wash. W. Va. Wis. Wyo. Hawaii u. s. --
Num-b~r
5 2 2 2 5
2
9 3
5 4 5
91 2
10
2
s 5 s 6
9
1 1 2
4 1 2
41
1 7
2
1 15
5
1 1 5
*272
Table 2.--NUMBER OF TORNADOES, DAYS, DEATHS, AND DAMAGE FOR STATES AND UNITED~TATES BY YEARS 1916-SS (Continued)
1951 i952 i953 1954 1955
Days Deaths Damage t Num- Days Deaths Damage t Num- Days Deaths Damage t Num- Days Deaths Damage t Num- Days Deaths Damage t (thous.) ber (thous.) ber (thous.) ber (thous.) ber (thous.)
3 $SS 11 7 6 $75S 24 12 16 $5,549 9 5 $40S 6 4 5 $16S 2 0 1 1 ~ (2)
v44o 2 1 Vs
2 V33 15 9 111 611:796 10 s 2S 16 1 Vsn 22 12 2 Ys59 1 1,550 3 2 100 1 1 7 1 1 10 5 145 4 4 !/73 16 s ¥44 13 10 Y11 19 14 M!9o
2 V13s 2 1 22 2 1 s 1 1 J/2 1 1 3
VJ.1s v42 ~3S V11 5 3 10 9 22 20 12 10 2 ¥16 13 12 2 27 12 6 M.,402 12 4 22 J.-3o, 723 26 10 9 JtiO,lOS 16 9 1 Y669
1 1 5 1 1 (2) 3 2 2,636 4 3 ss 3 2 1 2,355 7 7 1 671 25 10 V1,23o 4 1,302 2 2 ~ 355 6 4 2 1,021 32 20 2 .J1. '079 15 9 2,792 5 1 ~6,730 9 5 1 1
.v210 23 7 2 M.!,315 21 s 2 ¥1,902 7 5 91 3S 7 2,676 16 15 b130 30 17 !1216 6S 33 J/'3S2 S2 22 Sl ~,064
2 1 121 2 2 500 0,155
3 3 11S 3 3 300 s V1,o43 9 7 4 vl,315 20 12 13 11 8 2 .VlS9 3 3 .Y'3o
4 2 V2o 2 2 V4 2 3 (3)
ylo 2 2 V1 2 2 1 ~~ !/6 2 2 1 90 52,S74 2 2 4 3
6 1 ~77 Yr,97o
14 8 127 J/23~13 13 8 J1io7 12 9 203 3 6 ¥7,250 10 6 13 7 9 25 7 6 269 13 9 2 !-'ltt.S93 6 3 ll'l42 7 4 9 3S6 22 14 39 !126,909 15 10 J1,279 6 5 445 6 V63 9 s lS Y1;7,oo 5 5 V24 31 14 2 J(760 33 14 Y567
2 1 1 426 7 4 Y6o 4 4 M76 3 1 27
s ¥2o 9 s ¥96 47 21 16 Jh ,05S 17 15 7 JtS70 32 16 3 .,Y654
1 V4 2 1 100 1 1 25 1 1 4 1 50 2 2 30 1 1 (2) 2 (2) 8 5 1 1 1 2
1 1 10 1 1 20 1 1 35 4 57 7 7 Vsoo 3 3 124 9 9 455 7 7 1 570 1 (3) 9 7 2 505 11 5 2 Vl66 2 2 10 12 9 2 ¥'390 2 .v1 ,000 4 2 11630 3 3 17 20,029 11 s 1 Y424 7 5 1 1,171
24 .v SS9 20 15 !I4SS 57 25 5 !/1,160 55 22 2 M!,595 S2 35 23 !'9,124
1 ~~ J1. ,676 Jho 1 1 0
Yso 6 8 5 10 9 23 15 ~7 2 2
JJl32 ¥s3S 4 5 2 741 5 5 1 205 9 6 10 s 2 2 (3) 5 4 V5s 13 10 Y1s9 11 s Y.Ls6 14 5 !Iss
1 (3) 22 4 74 9,S57 11 5 4 !498 2 2 60 13 9 Yi,463 11 3 !-1.,704 13 11 382 32 lS 146 ¥45,563 77 40 3 Y4,on 105 42 2 V6,4SS
J/507 1 1 (2) 1 1 8 3 2 ¢115
5 3 2 102 6 5 ~D 5 5 (3) 1 1 5 1 1 1 1 1 0 2 2 10
1 M.o 1 1 6 1 4 2 2 .V3oo
~11 4 7 ..V637 1 1 2 250 3 2 4 Y2'Y,3o 12 s .V406 9 5 1 1 (2) s s 63 2 2 1 4 3 J/5
~9,489 ~35,196 .Jt$224,349 1 1 1
fll3 34 *236 f'98 230 *437 tl36 516 *550 fl60 35 Y$28 ,369 *592 h52 125 J433,979
-

28
Table 2.--NUMBER OF TORNADOES, DAYS, DEATHS, AND DAMAGE FOR STATES AND UNITED STATES BY YEARS 1916-58 (Continued)
1956
States Num- days Deaths Damage t ber (thous.)
Ala. 5 6 25 $1,608 Ariz, 3 2 Y:(2) Ark. 13 7 1 254 Calif. 2 2 35 Colo. 9 7 (3)
Conn. 1 1 (2) Del. D. C.
J1 ,310 Fla. 16 13 Ga. 17 16 h,l90
Idaho 5 5 YJ. Ill. 28 18 8 3,290 Ind. 34 12 1 4.,568 Iowa 7 5 523 Kans. 63 33 3 .Vl '941
Ky. 9 5 1 V969 La. 10 9 V295 Md. 4 1 (3) Maine 3 3 26 Mass. 10 6 1,086
Mich. 24 11 24 18~16 Minn. 9 9 85 Miss. 7 5 1 Y1, 120 Mo. 25 13 .V547 Mont.
Nebr, 34 21 J/1,002 Nev. N. H. 2 2 8 N. J. 4 3 .Y4o N. Mex', 4 4 1
N. Y.l 1 1 (3) N. c. 10 4 95 N, Dak. 15 11 .!444 Ohio 8 6 2 Y.L '129 Okla. 56 27 5 .J/.3 ,224
Oreg. 211.,170 Pa. 4 4
R. I. s. c. 6 6 {/1.16 S. Dak. 11 9 .Vl82
Tenn. 8 5 3 Vlt329 Tex. 57 32 :!/437 Utah Va. 4 1 M5o Vt.
Wash, 1 1 0 W. Va. 1 1 250 Wis, 6 4 9 1,391 Wyo. 2 2 5 Hawaii
u, s. *532 t 155 83 J-$48 '537
~ Additional losses incurred. ~Damage negligible. ~No estimate of damage,
Num-ber
51 5
27 1
24
1 2
l-9 18
1 42 27 17 64
4 30
2 8
15 16 26 36
1
53
2 1
17
1 8
13 4
106
2 9
8 20
17 145
!I 2
2 1
12 3 1
*864
1957 1958
Days Deaths Damage t Num- Days Deaths Damage t (thous.) ber (thous.)
14 10 Y$4,529 21 10 1 $ Y16s 5 :Vt';l4 4 4 6
12 3 984 7 7 Yl26 1 (2) 10 7 t:-39
14 :vs 18 15 52
1 350 3 3 Vs6 2 Y5 1 1 (2)
Vn Vt;6o5 14 25 16 1 9 3 Y997 11 10 1 476
1 0 1 1 9 13 15 .Vs,732 27 13 2 ~.11,627 12 426 25 12 !/732 12 Y'257 14 12 190 20 7 Y2,515 49 22 15 Y3, 176
4 J/288 8 6 ~h78 16 14 YI-,957 9 5 !/165
2 2 y 50 2 )13 7 5 v93 5 }':39 12 9 1 87
8 1 V5so 7 7 V11 12 J/677 14 9 2 ¥682 14 6 Vl,819 13 5 13 v,y2o3 15 55 y11 ,415 29 17 2 652
1 1 4 4 V4
25 1 .¥2.416 54 26 ~08
2 28 1 100 3 2 110 9 1 568 7 4 0
1 5 4 4 Y26 4 4 1,711 4 4 !/58 8 10 0o,os7 9 9 119 3 ~,050 9 8 ~86
27 22 4,762 42 26 !/275
1 t4 7 197 1 1 5
5 1.111 6 2 1 51 15 1 ¥162 1 1 5
9 ¢'2.242 2 2 1 105 42 37 J'l-2 ,400 74 43 !/3,967
1 6 3 -0.67 1 1 55 2 61
2 1 2 2 20 1 200
M:o, 183 6 1 ,Y434 17 10 27 3 tig 13 8 53 1
1 154 191 J$73,399 *565 fl66 66 hs,o49
* Corrected for boundary-crossing tornadoes. f Tornado days for country as a whole. t Damages are rough estimates made at the time of occurrence, Comparisons are im
practical due to change in monetary values, metropolitan development 9 and popula-tion expansion, ·

Table 2.--NUMBER OF TORNADOES, DAYS, DEATHS, AND DAMAGE FOR STATES AND UNITED STATES BY YEARS 1916-58 (Continued)
Totals for the Period 1916 - 1958
-~--
States Number Days Deaths
Alabama 320 164 776 At<izomt 21 19 ---Arkansas 448 238 984 california 35 27 ---Colorado 156 120 27
Connecticut 20 18 ---Delaware 10 10 ---Dist. of Col. 4 4 ---Florida 277 218 34 Georgia 278 151 550
Idaho 14 14 2 Illinois 301 172 943 Indiana 269 171 258 Iowa 599 315 89 Kansas 1041 553 270
Kentudky 76 57 181 Lottisiatla 279 189 334 MarYland 62 50 30 Maine 22 20 1 Mas!!lachusetts 56 44 96
Michigan 177 114 175 Minnesota 204 153 181 Mississippi 307 189 869 Missouri 446 256 536 Montana 70 60 5
Nebraska 450 275 91 Nevada 1 1 ---New Hampshire 15 14 1 New Jersey 25 23 2 New Mexico 75 58 6
New York 32 32 5 North Carolina 113 91 55 North Dakota 129 103 54 Ohio 159 121 176 Oklahoma 856 429 724
Oregon s 7 ...............
Pennsylvania 140 112 62 Rhode Island 1 1 ---South Carolina 154 121 191 South Dakota 189 148 20
Tennessee 204 119 366 Texas 999 560 844 Utah 8 7 ---Virginia 70 53 35 Vermont 11 12 ---
Washington 11 11 ---West Virginia 13 11 110 Wisconsin 187 130 155 Wyoming 78 68 3 Alaska --- --- ---Hawaii 2 2 ---
. -------~--~~···
United States *9,167 f3,412 9,241
* t Corrected for boundary-crossing tornadoeso Tornado days for country as a who1eo
Averages for the Period 1916 - 1958
Number Days Deaths
7.44 3.81 18.05 0.49 0.44 -----
10.42 5.54 22.88 0.81 0.63 -----3.63 2.79 0.63
0.46 0.42 -----0.23 0.23 -----0.09 0.09 -----6.44 5.07 0.79 6.47 3.51 12.79
0.33 0.33 0.05 7.00 4.00 21.93 6.26 3.98 6.00
13.93 7.33 2.07 24.21 1~.86 6.28
1.77 1.33 4.21 6.49 4.40 7.77 L44 1.16 0.70 0.51 0.46 0.02 1.30 1.02 2.23
4.12 2.65 4.07 4.74 3.56 4.21 7.14 4.40 20.21
10.37 5.95 12.46 1.63 1.40 0.12
10.46 6.40 2.12 0.02 0.02 -----0.35 0.33 0.02 0.58 0.53 0.05 1.74 1.35 0.14
0.74 0.74 0.12 2.63 2.12 1.28 3.00 2.40 1.26 3.70 2.81 4.09
19.91 9.98 16.84
0.19 0.16 -----3.26 2.60 1.44 0.02 0.02 -----3.58 2.81 4.44 4.40 3.44 0.46
4.74 2.77 8.51 23.23 13.02 19.63
0.19 0.16 -----1.63 1.23 0.81 0.26 0.28 -----0.26 0.~6 -----0.30 0.2'6 2.56 4.35 3.02 3.60 1.81 1.58 0.07 ---- ---- ----0.05 0.05 ----
*213 .19 f79.35 214.91
NOTE: The losses presented in this publication are based on values estimated at the time of occurrences; consequently, due to the change in the price index, comparisons of damages can not accurately be made without adjustment. This has not been done in this publication.
29

Year
1916 1917 1918 1919 1920 1921 1922 1923 1924 1925 1926 1927 1928 1929 1930 1931 1932 1933 1934 1935 1936 1937 1938 1939 1940 1941 1942 1943 1944 1945 1946 1947 1948 1949 1950 1951 1952 1953 1954 1955 1956 1957 1958
Total Avg.
Table 3 0 --NUMBER OF TORNADOES 7 DAYS, DEATHS, ANDDAMAGE FOR UNITED STATES BY MONTHS FOR YEARS, 1916-58
J .rlll!i."I'V Februarv March
Num- Days Deaths Damaget Num- Days Deaths Damage t Num- Days Deaths ber (thous.) ber (thous.) ber
3 2 - 11 - - - - 1 1 -2 2 - 5 - - - - 15 7 80 3 1 13 140 3 2 2 225 - - -- - - - - - - - 16 5 54 - - - - - - - - 22 6 180 - - - - 4 3 28 (2) 15 9 13 3 2 5 122 2 2 1 41 25 9 35 2 2 2 50 - - - - 8 3 37 1 1 - (1) 4 1 3 58 13 3 17 4 2 - 33 6 3 1 111 10 3 740 2 2 3 3 4 3 10 105 4 2 4 - - - - 6 4 45 185 9 3 37 5 3 4 221 - - - - 7 6 15 6 2 12 715 5 1 25 191 20 7 21 - - - - 2 2 - 152 10 5 4 3 1 7 48 - - - - 5 3 4 9 5 25 213 2 2 - 10 46 7 344
13 6 4 1,152 4 1 - 37 56 7 124 4 2 1 55 12 4 20 664 6 3 -- - - - 8 2 1 267 29 14 11 6 2 20 170 4 2 - 20 11 6 17 - - - - 13 6 - 416 5 4 8 - - - - 2 1 21 ) 300 60 10 76 7 5 6 115 16 9 4 419 13 7 5 2 1 7 20 3 3 18 3,206 20 5 9 2 2 - 2 - - - - 1 1 -6 3 2 74 16 2 22 2,307 21 5 150 6 2 6 322 1 1 - (2) 11 5 1 8 2 2 82 3 3 1 50 16 6 10 - - - - 9 3 42 1,977 31 13 3
10 4 45 2,958 5 3 1 1,012 3 3 -16 4 17 1,133 - - - - 2 2 2
5 2 1 295 7 3 8 300 46 10 79 8 2 61 1,847 6 5 - 78 31 10 35 8 5 1 766 20 4 45 1,125 21 5 1 3 2 - 1,725 10 4 1 170 6 6 -
12 4 - 368 27 6 9 4,729 32 9 208 14 6 - 335 17 3 3 1,122 40 10 24
2 1 - 13 19 9 2 1,039 69 13 10 2 2 - (1) 4 3 - 223 41 15 4 2 2 - 27 47 12 8 6,957 31 7 1
17 3 13 2,541 5 3 - 6 39 7 1 12 7 - 377 20 5 13 1,369 15 10 -
*208 t 94 257 15,938 *316 t120 334 28,871 *ss2 f 212 2,364 *4.8 "f2.2 6.0 - * 7.3 ·=t2 .8 7.8 - '*20.5 :t 6.3 55.0
See footnotes at end of table.
30
Damage t (thous.)
25 2,612
-1,680 9,773
888 770 577
1,132 18,047
232 554
90 427 108 115
6,076 4,581
177 1,083 1,432
210 3,709
285 577 (2)
4,279 820
5,270 1,457
435 115
26,628 3,293 1,546
151 15,164 3,920
11,274 4,935 2,885
590 89
138,011
-

Year
1916 1917 1918 1919 1920 1921 1922 1923 1924 1925 1926 1927 1928 1929 1930 1931 1932 1933 1934 1935 1936 1937 1938 1939 1940 1941 1942 1943 1944 1945 1946 1947 1948 1949 1950 1951 1952 1953 1954 1955 1956 1957 1958
Total Avg.
Table 3.--NUMBER OF TORNADOES, DAYS, DEATHS, AND DAMAGE FOR UNITED STATES BY MONTHS FOR YEARS, 1916-58 (Continued)
April May June Num- Days Deaths Damage t Num- Days Deaths Damage t Num- Days Deaths ber (thous.) ber (thous.) ber
8 2 13 1,249 15 6 9 140 41 9 105 6 5 2 120 49 10 376 9,567 41 9 48
18 8 17 902 34 15 58 4,992 8 6 7 15 6 83 1,024 12 8 - 84 3 2 59 18 11 243 4,187 13 6 65 475 13 11 2 39 13 112 3,082 16 9 8 642 6 5 -22 11 48 2,180 17 14 16 1,313 9 5 12 17 10 23 1,216 27 12 25 660 20 13 9 28 6 124 4,455 18 6 57 1,429 24 15 110 19 12 7 700 5 5 3 125 38 14 10 13 6 4 320 13 8 4 517 17 5 2 41 13 127 3,999 54 13 233 11,434 10 6 -24 9 5 704 21 11 4 917 71 20 16 67 18 170 5,964 48 17 42 1,532 20 11 3
4 4 - 26 89 15 127 7,645 33 17 8 4 3 - 26 14 9 2 286 23 10 3
11 5 13 160 14 8 3 77 30 16 -30 12 11 1,008 90 23 206 7,861 20 12 2 10 6 - 52 17 9 8 340 32 15 3 26 10 20 565 42 12 20 898 29 16 7 31 7 492 23,298 25 13 10 245 27 11 10 23 9 9 298 34 15 3 1,027 44 18 8 34 10 17 410 49 17 17 670 22 10 14 39 9 50 660 16 10 5 523 30 13 11 27 8 23 1,185 10 7 - 182 18 9 2 30 10 3 717 16 10 4 406 26 ll 15 19 8 87 3,840 30 12 37 1,745 33 14 46 19 7 17 4,258 45 10 10 2,339 25 13 5 52 12 93 5,301 28 9 8 1,401 35 13 161 25 9 148 7,975 14 9 1 541 22 14 3
4 3 - 22 33 14 15 3,006 18 12 2 29 10 198 12,026 29 17 9 1,773 33 14 47 28 7 15 3,061 25 9 18 4,850 25 13 2 31 8 13 2,068 99 17 69 16,692 23 11 4 16 7 12 1,420 59 22 2 1,602 27 12 6 26 9 2 982 66 19 7 713 77 22 9 37 12 4 3,826 36 16 2 1,987 35 17 3 45 16 34 39,757 99 21 162 55,306 114 24 244
117 22 3 3,800 97 22 8 4,125 101 26 5 101 18 7 6,548 150 26 103 14,141 148 28 2
87 15 67 24,133 88 24 4 7,424 66 21 -216 21 29 17,548 226 26 87 16,419 148 25 14
78 19 4 5,458 69 21 - 2,191 128 27 42 1
1,534 Jt426 I'~<
f582 ~:713 f595 2,349 200,530 ~951 1 847 190_L242 1 061 :!S5. 7 :f9.9 54.6 - *4:5.4 h3.5 - 43 .o - *39.9 rl3.8 24.7
See footnotes at end o£ table.
Damaget (thous.)
451 2,632
73 3,565
154 88
898 33
14,521 3,070
718 319
5,138 937
2,734 278 237 436
1,309 654 422 846 756
1,723 66
1,194 1,275 1,141 8,787 8,875 2,213 4,446 2,694
940 2,425
16,527 3,766
96,506 4,010 3,510 1,363
18,162 14,191
234,083 -
31

Table 3o--NUMBER OF TORNADOES, DAYS, DEATHS, AND DAMAGE FOR UNITED STATES BY MONTHS FOR YEARS, 1916-58 (Continued)
--·
July August September
Year Num- Days Deaths Damage t Num- Days Deaths Damage t Num- Days Deaths Damage t ber (thous.) ber (thous.) ber (thous.)
1916 4 4 2 $ 200 4 4 - $ 100 2 2 - $ (l) 1917 3 2 - (1) 1 1 1 (1) - - - ,....
1918 1 1 - (2) 6 5 36 1,000 4 4 - 5 1919 3 3 2 30 5 5 - 64 4 4 ~ 33 1920 12 8 3 319 2 2 - 5 5 4 1 15 1921 4 3 1 175 3 3 - 1 9 5 - 239 1922 9 6 1 677 7 7 - 50 4 4 - 15 1923 5 4 1 62 10 6 - 280 11 7 6 29 1924 14 9 4 2,876 9 7 20 474 10 5 37 984 1925 12 9 1 336 4 4 2 55 4 3 - 478 1926 14 12 6 172 11 8 2 364 9 6 1 474 1927 12 10 11 653 3 3 - 69 14 2 81 25,232 1928 25 12 1 485 23 9 18 2,232 13 2 22 2,625 1929 11 6 - 167 4 3 - 2 10 5 - 161 1930 11 9 - 63 4 4 - 81 17 9 5 708 1931 7 5 - 38 11 7 1 256 11 7 5 742 1932 22 12 8 1,904 4 4 - 9 7 4 - 84 1933 15 11 5 945 11 9 1 111 6 6 - 16 1934 24 13 - 186 9 8 - 38 10 4 - 134 1935 20 12 9 809 8 5 - 52 13 3 2 306 1936 21 12 2 405 9 8 - 72 9 7 - 56 1937 11 9 - 118 5 5 1 14 4 3 - 14 1938 15 10 3 746 15 9 - 134 7 3 32 2,030 1939 9 8 - 81 16 10 5 1,965 3 2 1 6 1940 11 8 - 127 13 9 3 182 4 2 2 39 1941 7 6 - 11 6 3 2 775 6 5 5 687 1942 9 6 - 742 6 4 - 68 5 5 - 25 1943 16 9 2 1,105 11 6 3 1,226 2 2 - 101 1944 11 10 - 327 6 5 - 44 4 4 - 198 1945 6 5 7 441 2 2 1 41 10 9 1 714 1946 8 8 1 152 8 6 11 937 7 5 - 678 1947 10 9 10 719 4 3 1 502 18 7 5 540 1948 21 13 3 207 2 2 - 625 6 3 2 434 1949 7 6 - 1,066 10 5 - 174 3 3 2 78 1950 23 14 - 2,914 12 11 - 305 3 3 - 85 1951 23 15 5 6,306 26 15 - 524 9 7 8 692 1952 30 14 3 1,366 15 11 1 1,779 1 1 - 20 1953 40 19 - 240 26 15 - 147 5 4 - 7 1954 46 23 - 642 46 21 1 773 20 10 3 270 1955 50 21 5 2,111 34 18 - 386 16 8 2 240 1956 101 26 1 1,640 43 20 2 1,721 19 10 - 266 '1957 54 19 - 1,732 26 14 - 72 17 10 2 765 1958 119 30 1 1,085 45 20 1 756 24 14 1 232
Total PI: 876 t451 98 $34,380 * 525 1'326 113 $18,465 * 365 f213 226 $40,457 Avg. 1+<20.4 f10.5 2.3 - ~12.2 f7 .6 2.4 - * 8.5 t5.0 5.3 -
See footnotes at end of table.
32
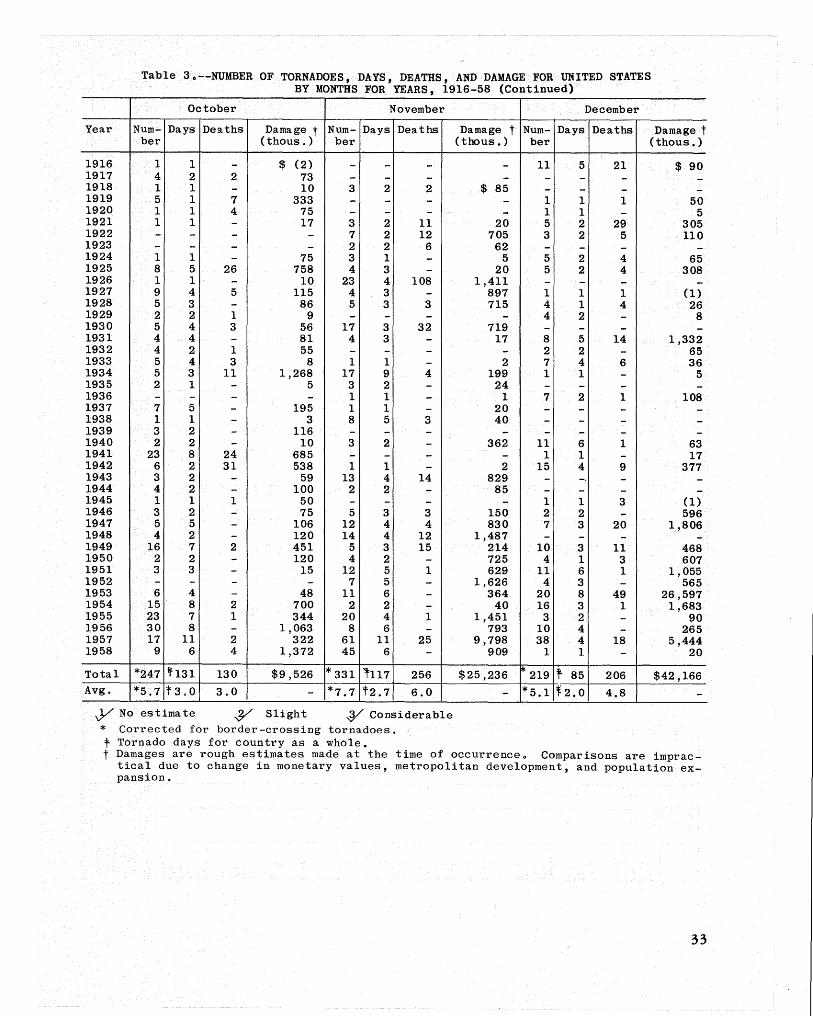
Year
Table 3o--NUMBER OF TORNADOES, DAYS, DEATHS, AND DAMAGE FOR UNITED STATES BY MONTHS FOR YEARS, 1916-58 (Continued)-
October November December
Num- Days Deaths Damage t Num- Days Deaths Damage t Num- Days Deaths Damage t ber (thous.) ber (thous.) ber (thous.)
1916 1 1 - $ (2) - - - - 11 5 21 $ 90 1917 4 2 2 73 - - - - - - - -1918 1 1 - 10 3 2 2 $ 85 - - - -1919 5 1 7 333 - - - - 1 1 1 50 1920 1 1 4 75 - - - - 1 1 - 5 1921 1 1 - 17 3 2 11 20 5 2 29 305 1922 - - - - 7 2 12 705 3 2 5 110 1923 - - - - 2 2 6 62 - - - -1924 1 1 - 75 3 1 - 5 5 2 4 65 1925 8 5 26 758 4 3 - 20 5 2 4 308 1926 1 1 - 10 23 4 108 1,411 - - - -1927 9 4 5 115 4 3 - 897 1 1 1 (1) 1928 5 3 - 86 5 3 3 715 4 1 4 26 1929 2 2 1 9 - - - - 4 2 - 8 1930 5 4 3 56 17 3 32 719 - - - -1931 4 4 - 81 4 3 - 17 8 5 14 1,332 1932 4 2 1 55 - - - - 2 2 - 65 1933 5 4 3 8 1 1 - 2 7 4 6 36 1934 5 3 11 1,268 17 9 4 199 1 1 - 5 1935 2 1 - 5 3 2 - 24 - - - -1936 - - - - 1 1 - 1 7 2 1 108 1937 7 5 - 195 1 1 - 20 - - - -1938 1 1 - 3 8 5 3 40 - - - -1939 3 2 - 116 - - - - - - - -1940 2 2 - 10 3 2 - 362 11 6 1 63 1941 23 8 24 685 - - - - 1 1 - 17 1942 6 2 31 538 1 1 - 2 15 4 9 377 1943 3 2 - 59 13 4 14 829 - -, - -1944 4 2 - 100 2 2 - 85 - - - -1945 1 1 1 50 - - - - 1 1 3 (1) 1946 3 2 - 75 5 3 3 150 2 2 - 596 1947 5 5 - 106 12 4 4 830 7 3 20 1,806 1948 4 2 - 120 14 4 12 1,487 - - - -1949 16 7 2 451 5 3 15 214 10 3 11 468 1950 2 2 - 120 4 2 - 725 4 1 3 607 1951 3 3 - 15 12 5 1 629 11 6 1 1,055 1952 - - - - 7 5 - 1,626 4 3 - 565 1953 6 4 - 48 11 6 - 364 20 8 49 26,597 1954 15 8 2 700 2 2 - 40 16 3 1 1,683 1955 23 7 1 344 20 4 1 1,451 3 2 - 90 1956 30 8 - 1,063 8 6 - 793 10 4 - 265 1957 17 11 2 322 61 11 25 9,798 38 4 18 5,444 1958 9 6 4 1,372 45 6 - 909 1 1 - 20
Total *247 ,131 130 $9,526 * 331 1117 256 $25,236 Pte 219 t 85 206 $42 '166 Avg. *5.7 t 3 .o 3.0 - *7.7 r2.1 6.0 - *5.1 12.0 4.8 -~No estimate ~ Slight ~Considerable * Corrected for border-crossing tornadoes. t Tornado days for country as a whole. t Damages are rough estimates made at the time of occurrenceo Comparisons are imprac
tical due to change in monetary values, metropolitan development, and population expansiono
33

~ ~
Table 4. TOTAL NUMBER OF TORNADOES AND·TORNADO DAYS BY STATES AND U.S. TOTALS AND MEANS, 1916-58
January February March April May June July August September October November
Torna- Days Torn a- Days Torna- Days Torna- Days Torna- Days Torna- Days Torna- Days Torn a- Days Torna- Days Torn a- Days Torna- :FJays does does does does does does does does does does
1does
Ala. 31 16 40 22 72 39 60 32 31 17 18 4 2 2 3 2 3 3 8' 6 30 9 Ariz. 1 1 1 1 1 1 2 1 4 3 8 8 2 2 1 1 Ark. 16 10 33 19 68 38 111 58 75 32 46 20 12 10 3 3 9 5 12 9 36 16 Calif. 4 2 2 2 6 5 10 6 4 4 1 1 1 1 1 1 1 1 2 2 Colo. 1 1 5 2 15 12 36 27 51 41 32 24 8 7 2 2 4 3 2 1
CQnn. 3 2 1 1 4 4 6 6 4 4 2 1 .Del. 1 1 1 1 4 4 2 2 1 1 1 1 D. C. 1 1 2 2 1 1 Fla. 18 11 19 15 22 20 36 30 23 20 28 21 24 24 21 20 34 19 23 17 13 11 Ga. 24 13 23 17 49 23 93 36 20 17 14 11 5 5 10 7 8 7 2 2 15 9
Idaho 1 1 2 2 6 6 3 3 2 2 Ill. 4 3 2 1 53 24 52 30 60 35 35 27 13 12 23 17 9 7 9 5 12 5 Ind. 4 3 13 5 50 25 47 21 43 35 51 33 34 28 5 4 8 7 4 4 8 4 Iowa 1 1 28 16 81 39 170 68 158 89 70 47 37 26 30 16 20 11 4 2 Kans. 3 1 6 3 51 25 137 74 309 128 300 153 92 65 61 49 33 33 28 13 19 8
Ky. 6 4 1 1 15 11 12 9 11 10 4 4 9 6 1 1 1 1 4 2 6 4 La. 11 10 25 16 40 25 47 30 44 26 12 10 12 11 8 7 4 4 14 11 41 22 Maine 1 1 2 2 2 2 9 7 3 3 5 5 Md. 1 2 1 1 6 4 13 10 7 4 13 11 13 11 3 3 1 1 4 3 Mass. 5 5 14 8 16 12 7 7 5 5 4 3 3 2
Mich. 1 1 1 1 6 2 16 11 46 23 52 34 17 13 20 13 14 13 2 1 2 2 Minn. 2 2 8 6 37 25 74 55 46 37 26 18 7 6 2 2 2 2 Miss. 13 12 41 19 79 41 55 33 32 19 14 10 8 8 4 4 5 4 3 4 30 16 Mo. 13 8 18 9 70 32 73 38 113 51 60 45 20 19 10 10 25 17 15 13 16 10 Mont. 1 1 1 1 10 7 23 19 24 21 8 8 1 1
Nebr. 2 1 47 30 109 66 145 80 86 55 33 26 19 11 7 4 2 2 Nev. 1 1 N. H, 2 2 4 3 4 4 2 2 2 2 1 1 N; J. 1 1 4 4 3 3 4 3 6 5 4 4 1 1 1 1 1 1 N. Mex. 1 1 5 2 35 24 14 11 6 6 6 6 4 4 4 4
N. Y. 1 1 5 5 8 8 7 7 5 5 4 4 1 1 1 1 N. C. 4 3 4 4 18 11 25 17 17 15 11 11 8 7 14 11 3 3 3 3 5 5 N. Dak. 1 1 17 13 43 32 46 39 16 14 6 4 Ohio 5 5 4 2 21 12 18 12 31 25 33 27 16 12 16 13 12 10 1 1 2 2 Okla. 16 9 22 14 56 26 213 89 265 114 146 77 47 34 22 18 23 18 16 15 26 12
Oreg. 1 1 3 2 1 1 1 1 1 1 Pa. 1 1 1 1 4 4 18 12 21 15 31 24 28 24 13 13 14 10 1 1 8 7 R. L s. c. 2 2 7 6 19 15 37 28 29 24 20 19 3 3 13 8 13 7 3 3 3 3 S. Dak. 1 1 19 7 30 21 71 58 36 31 22 20 9 9 1 1
Tenn. 12 9 23 10 70 31 30 18 25 17 14 9 7 6 3 3 3 3 2 2 9 8 Tex. 24 14 35 17 101 52 266 116 256 143 108 65 55 48 43 37 17 10 39 24 30 20 Utah 2 2 4 3 2 2 Vt. 1 1 1 1 3 3 3 4 2 2 1 1 Va. 1 1 2 2 5 4 12 10 17 11 7 7 6 3 8 8 9 4 1 1 2 2
Wash. 2 2 3 3 3 3 1 1 1 1 W. Va. 1 1 2 2 6 4 1 1 2 2 1 1 Wis. 3 3 30 16 27 20 53 37 36 26 12 10 20 14 6 4 Wyo. 1 1 18 15 35 31 17 14 5 5 2 2 Alaska Hawaii 1 1 1 1
*U.S. 'lbtall 20$ 94 316 120 882 272 1,534 426 1,951 582 1,713 595 876 451 525 326 365 213 247 131 331 117 *U.S.Meanj 4.8 2.2 7,3 2;8 20.5 6.3 35.7 9,9 45,4 13.5 39.9 13,8 20.4 10.5 12.2 7.6 8.5 5,0 5.7 3.0 7.7 2.7 *U.S. Mean!
tornadoei per tor- 2.2 2.6 3.2 3.6 3.4 2.9 2.0 1.6 1.7 1.9 2.8 nado day
~---·· --··· ---··--
*Corrected for boundary-crossing tornadoes.
December Total
Torna- Days Torna- Days does does
22 12 320 164 1 1 21 19
27 18 448 238 3 2 35 27
156 120
20 18 10 10
4 4 16 10 277 218 15 4 278 151
14 14 29 6 301 172
2 2 269 171 599 315
2 1 1041 553
6 4 76 57 21 17 279 189
22 20 62 50
2 2 56 44
177 114 204 153
23 19 307 189 13 4 446 256
2 2 70 60
450 275 1 1
15 14 25 23 75 58
32 32 1 1 113 91
129 103 159 121
4 3 856 429
1 1 8 7 140 112
1 1 1 1 5 3 154 121
189 148
6 3 204 119 25 14 999 560
8 7 11 12 70 53
1 1 11 11 13 11
187 130 78 68
0 0 2 2
219 85 9,167 3,412
5.1 2.0 213.2 79.3
2.6 2.7

~ V1
Table 5.--TOTAL NUMBER OF TORNADOES BEGINNING DURING THE SPECIFIED HOURS, 1916-1958
A.M. P.M. Total
12-1 1-2 2-3 3-4 4-5 5-6 6-7 7-8 8-9 9-10 10-11 11-12 12-1 1-2 2-3 3-4 4-5 5-6 6-7 7-8 8-9 9-10 10-11 11-12
Ala. 4 9 15 12 8 8 12 6 15 16 10 10 7 13 18 19 33 22 16 10 14 10 11 16 314 Ariz. 4 1 5 2 2 2 2 2 1 21 Ark. 7 4 8 6 9 3 5 1 3 9 6 11 16 11 30 45 42 28 27 27 29 14 30 22 393 Calif. 2 1 2 3 4 3 2 3 4 2 1 1 1 1 30 Colo. 1 1 1 1 2 1 3 4 6 20 16 23 25 15 4 4 8 4 3 2 144
Conn. 1 1 2 1 1 4 2 6 1 19 Del. 1 1 1 2 1 2 1 1 10 D. C. 2 1 3 Fla. 6 6 6 4 9 6 5 5 9 10 6 5 16 20 26 28 14 11 14 11 7 8 6 3 241 Ga. 1 4 7 8 4 5 4 11 12 10 7 5 6 18 14 24 27 17 16 15 18 13 12 6 264
Idaho 1 1 1 1 5 2 1 1 1 14 Ill. 4 5 10 2 1 2 1 1 1 2 6 10 9 24 43 38 43 29 19 9 11 11 13 294 Ind. 6 9 12 10 1 6 2 2 1 3. 2 1 6 9 22 25 19 34 24 20 11 12 7 9 253 Iowa 6 6 8 6 5 5 5 3 2 6 3 6 10 15 32 56 71 80 63 64 24 38 23 24 561 Kans. 16 13 9 5 6 2 2 4 3 4 12 12 19 37 62 81 122 141 135 99 63 70 42 31 990
Ky. 2 1 2 1 4 1 1 2 4 1 1 1 6 5 9 6 8 6 5 2 68 La. 4 8 7 12 6 4 11 6 9 10 7 12 10 19 22 17 14 18 17 8 9 9 12 13 264 Maine 1 1 2 6 4 3 2 3 22 Md. 1 1 1 1 1 1 4 1 1 5 7 5 7 5 4 7 3 1 4 60 Mass. 1 1 1 1 2 2 1 9 9 7 4 6 3 2 2 51
Mich. 3 1 1 1 1 1 5 3 3 4 8 9 14 21 22 20 14 11 6 7 1 156 Minn. 1 3 1 1 4 1 2 1 6 8 13 30 24 24 25 21 19 9 4 2 199 Miss. 5 14 8 7 1 5 3 7 7 4 11 9 15 7 18 14 16 14 24 21 17 7 9 14 257 Mo. 8 11 10 11 8 3 3 3 1 3 3 10 10 22 26 33 48 49 30 29 28 19 15 23 406 Mont. 2 1 1 1 1 7 8 17 5 5 2 3 2 1 2 58
Nebr. 4 4 2 3 3 2 1 3 3 7 9 26 40 60 59 51 45 37 21 21 16 417 Nev. 1 1 N. H. 1 1 3 4 3 1 1 14 N • J. 1 1 2 1 4 4 3 4 2 2 1 25 N. Mex. 1 2 2 6 5 11 10 12 4 9 4 2 1 69
N. Y. 1 1 3 3 5 6 3 1 3 1 27 N. C. 1 1 1 2 1 1 1 7 1 9 15 16 11 16 9 7 5 1 1 106 N. Dak. 2 1 1 1 2 5 8 10 18 14 13 9 12 7 5 1 109 Ohio 1 2 1 1 1 5 4 1 3 1 5 3 10 23 19 13 12 7 12 6 5 2 137 Okla. 22 23 17 15 10 10 8 8 14 5 19 6 8 12 38 79 76 82 94 58 75 66 44 43 832
Oreg. 1 1 1 2 2 1 8 Pa. 1 3 1 2 1 2 2 4 5 7 10 16 15 14 8 16 7 4 5 4 127 R. I. 0 s. c. 2 5 2 4 2 3 4 5 5 2 5 16 17 12 17 14 10 9 5 4 1 144 s. Dak. 1 1 3 1 3 1 1 1 4 4 14 14 15 27 22 18 10 12 8 4 164
Tenn. 2 7 7 4 7 1 3 1 1 9 2 5 5 6 9 12 14 28 12 19 10 7 13 13 197 Tex. 22 20 26 16 18 20 22 19 19 16 20 20 26 43 59 90 90 85 89 56 52 39 22 26 915 Utah 1 3 2 1 7 Vt. 1 1 4 2 1 9 Va. 2 1 1 1 3 2 6 4 e 7 9 7 8 5 2 2 3 69
Wash. 1 2 2 2 2 1 10 w. Va. 1 3 1 3 1 1 1 11 Wis. 4 4 3 1 2 1 1 1 1 2 8 7 20 19 19 20 20 19 10 5 2 6 175 Wyo. 1 3 6 6 12 17 4 6 3 4 1 1 1 65 Alaska 0 Hawaii 1 I 1 2
*U.S. Total 131 159 172 128 116 98 95 89 115 129 147 154 250 342 619 857 931 931 837 645 522 416 324 301 8,508
~U~Pe~-~·~ 1.9 2.0 1.5 1.4 1.2 1.1 1.0 1.4 1.5 1.7 1.8 2.9 4.0 7.3 10.1 11.0 11.0 9.8 7.6 6.1 4.9 3.8 3.5 100.0
* Corrected for boundary-crossing tornadoes.
This tabulation is based on the reported time of beginning of 8,508 tornadoes; the time of day is not available for the remaining 659 (7 percent) of the 9,167 tornadoes that occurred during the 43-year period. All entries based on local standard time.

Year
1916
1919
1924
1928
1929
1932
1933
1935
1937
1940
l944
1945
1947
1948
1949
1950
36
Table 6.~-TORNADOES ASSOCIATED WITH PASSAGE OF TROPICAL STORMS, 1916-58
Date
2 july 6
dct. 18
2 Sept. 10 Sept. 15
Location
Tallapoosa County, Ala.
Montgomery, Ala,
Goulds, Dade County, Fla. Uvalde; Uvalde County, Tex.
0
0
0 0
1 Sept.l6 North of Browntown, Wayne Count~ 1 Ga.
8 Aug, iO Aug. 10 Aug. 15 Aug. 15
Aug. 15 Atig. 15 Atig, 11 Aug, 16
Batesburg, Lexington County, s.c 2 Newberry 1 Newberry County, s. C, 0 Charleston, s. c 0 Little Mountain, Newberry County, 0 s. c.
Newberry County, s. C. o Bath, Aiken County, s. C. 0 Hookerton, Greene County, N, C. 1 Ashley Heights, Hoke County,N. ~ 2
5 Sep~ 28 Ft. Lauderdale, Broward County, Fla.
0
Sept.28 Sept.28
sept.29
Oct. 1
Miami, bade County, Fla. Stuart, Martin County, Fla.
Boca Raton, Palm Beach County, Fla,
Blackville, Barnwell Count~ Fla.
0 0
0
1
1 Sept.l9 Westover, West Baton RougePadsh, 0 La.
3 Oct. 4-5 Miami, Dade County, Fla. Oct. 5 Hollywood, Broward County,Fia,
0 0
Oct. 5 Pompano, Bfoward Courity 1 Fia. 0
4 sept, 4
Sept. 5 Sept. 5
Sept. 5
1 Sej;>t.20
1 Oct. 2()
3 Octo 18 Oct. 18 Oct. 18
3 June 24 Aug; 27
Sept. 17
Near Walterboro, Colleton Count~ 0 s. c.
qHapin; Lexington County, 9. C. 0 Near Florence, Florence County, 0 s. c.
Dillon, Dillon County, s, c. 0
St. Johns County, Fla. 0
Gainesville, Alachua county, Fla. 0
Polk County, Fla. 0 Wauchula, Hardee County, Fla, 0 Arcadia; De Soto County, Fla. 0
Melbourne; Brevard County, Fla. 0 Houston, Tex. 1
Gourdin, Williamsburg Count~ s,c, 1
(Jl Q) ·rl
.~ Damage t 1=1 (thous,)
1-1
Remarks
0 No esti- Hurricane June 29-July 10, mate
0 Slight Hurricane Oct. 12-19~
6 25 Hurricane Sept. 2-15 centered over Gulf of Mexico. 0 No esti- Hurricane Sept. 2-15,
mate
0 5 Hurricane Sept. 13-19.
0 6 Six tornadoes in South Carolina with hurricanes 0 25 Aug. 3-12 and Aug. 7-17, 0 Slight 0 6
0 30 2 5 0 50 Two tornadoes in North Carolina with hurricanes 0 50 Aug. 3-12 and Aug. 7-17.
0 100 Five tornadoes in Florida in northeast sector of hurricane Sept. 22-0ct. 4.
0 20 0 No esti
mate 0 No esti
mate 0 4 Center of hurricane Sept. 22-0ct. 4 not far away.
0 Consid~ Tropical storm Sept 18-21. able
0 5 In northwest quadrant hurricane Oct. 1-9. o No esti-
mate 0 No esti
mate
1 2 Four tornadoes in South Carolina with hurricane Aug. 31-Sept. 6.
0 2 0 Slight
0 2
0 6 Tropical storm Sept. 16-21.
0 Slight Tropical storm Oct. 15-21.
0 Sl ght In advance 'of hurricane Oct. 12-23. 0 Sl ght 0 Sl ght
0 15
4 Along forward edge hurricane June 20-27. 35 On northern edge approaching hurricane Aug. 24-
29 centered 60 miles southwest of Houston. 2 100 Hurricane Sept. 11-20.
12 Sept. 22
Sept. 23
Sept.23 Sept. 19
Tampa area, Hillsborough County, Fla.
Jacksonville area; Duval County; Fla.
Near Ocala, Marion County, Fia, Apalachicola, Franklin County,
0 0
0 1
0 () 2 100
6 Eleven tornadoes in Florida in 3 counties on northern edge tropical storm Sept. 20-25.
16
4 250 On periphery of hurricane Sept. 10-19.
Fla. Oct.ll-12 Miami, Dade County, Fla. 0 0 5 In northeast portion of hurricane Oct. 9-16.
5 Sept. 4 Sept. 4 Sept. 21 Oct, 5 Oct: 5
Havana, dladsdefi County, Fla. Milton, Santa Rosa County, Fla, ~omestead, Dade County, Fla. Opa Locka; Dade County 1 Fia. Ft. Lauderdale and Pompano, Bra
ward C6ilnty; Fla.
4 Aug. 28 Scotland County, N. c, Aug. 28 South of Raleigh, Wake County,
N. c.
2 0 0 0 b
0
0
Aug. 28 Aug, 28
Louisburg, Franklin Cou11ty, N. C. o Near Ridgeway, Vance Count~ N.C. 0
2 Atig. 30 Aug, 31
Apalachicola, Franklin Cbtinty, Fla. jackson County, Fla.
0 0
6 0 0 0 7
250 Hurricane Sept. 3-6. 5 4 In northeast sector of hurricane Sept. 18-25.
15 in forward sector of hurricane Oct. 3-15. 100
0 No esti- Hurricane Aug. 23~31. mate
0 60
16 100 6 No esti
mate
()
0 35 In northeast quadrant of hurricane Aug. 20-
6 sept. 1.

Yel:l,r
l9t:i2
liHi::l
l~PEi
'I-9Ei7
~
l
4
q
29
Dltte
Aug. 31,. Aug. 31 !\1-!!?j, ~1
Pet, !)
;'\ug, lQ 1\.u.g, 10 Au(5, 10 .1\u~, l!'!
E:Jept, iH t')ept. 24 E:)ept. 24
Jun~ f;l Jynoe 8 J>me 8 Junoe 8
J!Jne 8 June 8 JUPEl 8 Jun.e 27 Jm1e 27 Ju,p@ 27 JUil~ 28
JlJ!H? 28 J1lqe 21il
Jqpe 28
Jun.e 28 J\lPEl 28
June 28 Jun!9. 28 Ju,pe 28
J\IP!'l 28
.n.nw 28
June 28 JunE? 29
Location
Stokf.!!:i Go11nty 1 ~L C. 0 Franconia, Fa~r{a~ 9ounty, Va. o Potgwac, ~ont&owE!rY County, ~d. o
~ear Ft. ~y~r§, ~ef.! Cqunty, Fla, 0
Pepqerl~a. Peqqer Cgunty, N. c. 0 Copway, ~orry co11nty 1 S. C, P ~ear Dl!lon, PillaR County, s. ~ 0 ~aPca§ter-Che§ter county ±tne,~ Q
~rJqy, ~aylgr ggupty, Fla. Q §uwaPn~e County, Fla: 0 Wewahetch~a, Gu±f County, Fla. 0
Newberry, ~lachua County, fla. 0 ~ear Ocala, Marion county, Fla, o 0]:'an~e Park, Clay Cqun'j;y, Fla. 0 Near 9egrgetqwn,'pq'j;pam Co11pty, Q fla, Jac~§OPVille, Puval coupty, Fla, 0 Jack§onville; Duval County; Fla. o Je~yll I§!an4, Glynn county, Ga. o M~cheuq, Qrlean§ pari§h, La. 0 Philadelphia, N~§hoba County, P~ 0 Hou§ton, Qh~gka§aW co11nty, Mi§s. 0 Near Brooksville, Ngxqpee Coqpty 1 M~!:iS~ .
Clara, WaYne county, Miss. Q BateE:;ville anq northeast of Br11P41~g~, Barbour couqty 1 Ala,.
Butler Spring§, Greenbllle, Kpop city, Liperty 1 an@ Oa~y §trea~. Butler County, Ala.
Whl:l-HeY area, clarke County, Ala, ~vergrkleP aiiA §kiPnl=lrton, Cqpecuh cgupty, Ala.
Brook!:i) cgviugton county, Ala, Luverne, Gren~naw County, Ala· Devenport, Ft. DePO§it, apq Hayne§vllle, ~owpqe§ CountY, Ala.
8ermu4a, ~~g~l, anq Fri§co C~ty 1 Monroe county, Ala,
Pawning, Hope Hull, Se!l~r§, a.nq Sprague,Mantgomery County,Ala.
Oakhill, Wilcox coupty, Ala· Elkin!:i 1 Randolph couPty, w, Va., Q
Ul
.~ 1-< .~ Damage t .,:: (thous.)
Remarks
0 0 0
5 Hurricane "Able" Aug. 18-Sept. 2. 35 20
0 3 Hurrican~ "Haz~l" Oqt. 7.,12.
1 4 0 Q
10 In advance fringe of hqrrica11e "Connie" Aqg. ~.,.14. 10
1 50 fl.oemaips of P.urric::ane ":O:i.ll:Pen Aug, 7-21.
0 0 b
l,QO Ip aqvance of hurr tcane r'Flo:;;sy" E:lept. 21-30 20 35
0 2 Si~ tornadoE)S in FJ,.orida between 3 !J:nd 5:15p.m., 0 l and 1 :in Georgia lJ,t 8:15p.m., with qpnll:meq 0 25 tropic!J.l §torm June 8-14 .~ Q Slig;ht
0 12 0 21 0 12 0 20 Il\lrric;ftne "Audrey'' Junoe 25::-:28 ~ 9 g5 p 1
10 400
0 100 fifteen tgrpa4ooes :j_n Alabamll: QetwE)en 7:30a.m~,
and 5:45 p ·111· , hyrr ican§ "AudroeY" June 25::::28, wtth pq q~aths, 15 injuries., ll:PA $776 th.oqsanq damlJ:ge frgm tgrnadoe~.
() !25-c?()O WHh :j.p't§llS:i.ficatiqn hurr:J:~ane "AudroeY'' JllOVed qp Ohio Vf!.Hey.
t Damages are rough @st:i.mates. wage at th!3 t:j_me of occqrrE)nce, Gomparisons are impractical due to change in mon.etary values.~ moetrop0litap dev!3loPmePt, and Population !3~pansion.
37

City or community
Table 7.--TORNADO OCCURRENCES IN MAJOR CITIES AND SELECTED COMMUNITIES (Two or More Cases from Beginning of Record to February 1959)
Damaget in Date Deaths thousands City or community Date
of dollars
Oklahoma City, Okla. Mar. 22' 1893 0 15 Indianapolis, Ind. Mar. 4, 1880 14 tornadoes May 12, 1896 0 slight 10 tornadoes May 18' 1927
June 12, 1942 35 200 July 24' 1934 Apr. 12' 1945 8 1,000 June 20, 1942 Feb, 18' 1946 0 slight Apr. 9, 1944 Feb. 27, 1950 0 6 Mar. 26, 1948 Apr, 30, 1951 *0 *160 May 31, 1954 Apr. 30, 1951 June 13' 1954 Sept. 29, 1954 0 50 Mar. 22, 1955 May 11, 1955 0 0 Nov. 15, 1955 May 19, 1955 0 slight May 26' 1955 0 20 Kansas City, Mo. July 17' 1880 Apr. 2, 1957 0 slight 10 tornadoes May 13' 1883 May 24, 1958 0 4 May 11, 1886
June 10, 1887 Miami, F1a. Apr. 13' 1917 0 7 July 16, 1927
12 tornadoes Apr, 5' 1925 5 250 Oct. 6, 1941 July 14, 1926 0 slight May 23, 1946 Sept. 28, 1929 *0 *20 May 8, 1949 Sept. 28, 1929 Oct. 9, 1949 Oct. 4 & 5, 1933 0 5 June 22, 1957 Apr. 9, 1937 0 10 Oct.ll&l2, 1947 0 5 Little Rock, Ark. Dec. 8; 1885 June 26, 1956 0 0 10 tornadoes Oct. 2, 1894 July 15, 1957 0 slight June 5, 1916 Oct. 8, 1957 0 1 Oct. 8, 1919 July 25, 1958 0 0 May 14, 1923
Apr. 14, 1927 Cincinnati, Ohio May 28' 1809 *- *no estimate Mar. 16, 1932
12 tornadoes May 28' 1809 Mar. 18, 1933 May 28, 1809 Feb. 5, 1942 May 14, 1814 - no estimate Mar. 26, 1950 May 21, 1860 - no estimate May 21, 1862 - no estimate St. Louis, Mo. June 30, 1877 Feb. 19' 1880 - no estimate 10 tornadoes Jan. 12, 1890 Mar. 11' 1917 3 300 May 27' 1896 Jan. 19, 1928 0 100 Aug. 19, 1904 June 18' 1928 0 100 Sept. 29, 1927 May 2, 1954 0 250 Sept. 1' 1931 July 11, 1958 0 10 May 1' 1948
May 1, 1948 Wichita, Kans. Apr. 17' 1914 0 slight Aug. 28' 1948
12 tornadoes July 31, 1920 0 slight Feb. 10, 1959 Apr. 23' 1923 0 1 June 12, 1928 0 slight Topeka, Kans. July 21, 1887 Feb. 24, 1935 0 10 10 tornadoes Apr. 3' 1897 Apr. 17, 1939 0 slight Sept. 1, 1904 June 21, 1948 0 1,000 June 5, 1917 June 21, 1953 0 0 May 26, 1921 Oct. 4, 1954 0 40 June 3, 1927 Oct. 26, 1954 0 4 June 16, 1928 June 7' 1958 0 10 June 16, 1928 June 11, 1958 0 no estimate June 22, 1929
May 2, 1951 Charleston, s. c. May 4, 1761 - no estimate
11. tornadoes Sept. 10, 1811 - no estimate Chicago, Ill. May 6, 1876 Aug, 15, 1928 0 slight 9 tornadoes May 25, 1896 May 21, 1935 0 slight Apr. 6, 1912 Sept. 29, 1938 *32 *2,000 Mar. 28, 1920 Sept. 29, 1938 May 18, 1926 Sept.29, 1938 Apr. 7' 1929 Sept. 29, 1938 May 1, 1933 Sept. 29, 1938 May 26, 1955 May 22, 1957 0 slight Aug. 30, 1958 July 6, 1957 0 slight
Philadelphia, Pa. Apr. 12, 1856 Fort Smith, Ark. June 27, 1879 0 slight 8 tornadoes Aug. 3' 1885
10 tornadoes Nov. 8, 1879 - no estimate July 13' 1892 Jan. 12, 1898 52 450 Mar. 2.7' 1911 Mar. 16, 1919 0 500 Sept.l6, 1930 May 28' 1924 0 25 June 13, 1939 Apr. 23' 1926 0 25 July 19, 1951 Apr. 12, 1927 2 115 July 14, 1958 May 1' 1929 0 54 Dec. 17, 1929 0 2 (Over) Apr. 30, 1954 0 2
38
Damaget in Deaths thousands
of dollars
0 100 2 3,000 1 11 0 2 0 5 0 slight 0 slight 0 1 0 10 0 46
several much 4 300 0 slight - no estimate 0 25 4 250 2 290 0 2 0 5 0 250
0 slight 4 500 0 5 0 8 0 40 0 1 0 57 0 15 3 1,050 0 500
- no estimate 0 25
306 12,904 3 100
72 22,000 0 25
*0 *slight
0 0 21 no estimate
I - no estimate 0 slight 0 slight 7 500 0 slight 0 slight
*0 *slight
0 slight 0 slight
- 250 0 100 0 slight
28 3,000 0 500 0 3 4 500 0 51 0 25
0 slight 2 500 - no estimate 1 100 0 2 0 28 0 slight 0 5

Table 7.--TORNADO OCCURRENCES IN MAJOR CITIES AND SELECTED COMMUNITIES {Continued) {Two or More Cases from Beginning of Record to February 1959)
Damaget in Damaget in City or community Date Deaths thousands City or community Date Deaths thousands
of dollars of dollars
Terre Haute, Ind. Nov. 11, 1879 - no estimate Gainesville, Ga. Mar. 25, 1884 2 no estimate 8 tornadoes Sept. 16, 1886 0 135 4 tornadoes June 1, 1903 98 1,000
Dec. 5, 1909 0 25 Apr. 6' 1936 203 13 '000 Mar. 23, 1913 21 1,000 Apr. 15, 1944 0 20 Sept. 29, 1921 0 15 May 18, 1927 0 15 Great Bend, Kans. Nov. 10, 1915 11 1,000 Mar. 26, 1948 0 10 4 tornadoes May 4, 1950 0 250 May 21, 1949 3 1,000 Sept. 22, 1955 1 0
Oct. 29, 1956 0 250 New Orleans, La. Nov. 24, 1884 - no estimate
7 tornadoes Oct. 29, 1896 0 100 Louisville, Ky. Mar. 27, 1890 78 4,000 Oct. 5, 1906 3 300 4 tornadoes Mar. 18, 1925 3 100 Mar. 26, 1934 0 150 Jan. 12, 1928 0 84 Dec. 5' 1951 0 750 Jan. 19, 1928 0 85 July 17, 1953 0 50 July 13, 1957 0 slight Milwaukee, Wis. June 4, 1848 0 slight
4 tornadoes Oct. 15, 1870 0 no estimate Denver, Colo. Apr. 20, 1932 0 slight May 23, 1878 - no estimate
6 tornadoes July 19, 1932 0 3 June 14, 1891 - 4 Apr. 18, 1933 0 no estimate Apr. 20, 1937 0 slight Washington, D. c. Apr. 5, 1923 0 100 May 9, 1941 0 2 4 tornadoes May 14, 1927 0 slight May 15, 1941 0 0 Nov. 17, 1927 0 690
May 21, 1943 0 slight Evansvil.le, Ind. Apr. 25, 1887 - no estimate
6 tornadoes July 11, 1930 0 1 Wilkes Barre, Pa. Nov. 18, 1886 - 10 Mar. 31, 1932 0 200 4 tornadoes Aug. 19, 1890 16 500 Mar. 2, 1940 1 150 Aug. 21, 1914 7 much Apr. 14, 1944 0 5 Nov. 19, 1928 0 500 Nov. 15, 1955 0 175
Zanesville, Ohio July 16, 1912 2 5 St. Joseph, Mo. Apr. 2, 1913 0 slight 4 tornadoes Sept. 21, 1921 0 500
6 tornadoes Mar. 3, 1923 0 50 June 26, 1954 0 27 June 24, 1924 0 slight Apr. 13' 1955 0 1 May 24, 1927 0 200 Aug. 2, 1933 0 slight Cleveland, Ohio Apr. 27' 1943 0 1,000 Oct. 4, 1949 0 30 3 tornadoes June 22, 1951 0 500
June 8, 1953 17 20,000 Minneapolis, Minn. Sept. 8, 1884 6 2,000
5 tornadoes Aug, 20, 1904 14 1,500 Apr. 5, 1929 6 1,000 Codell, Kans. May 20, 1916 0 moderate Sept. 4, 1941 5 450 3 tornadoes May 20, 1917 0 no estimate July 20, 1951 5 6,000 May 20, 1918 0 no estimate
Omaha, Nebr. Aug. 25, 1877 - no estimate Heber Springs, Ark. June 5, 1916 4 6 5 tornadoes May 23' 1880 - no estinate 3 tornadoes Nov. 25, 1926 23 500
May 17, 1883 0 slight Nov. 15, 1955 0 150 Mar. 23' 1913 95 3,500 Apr. 6, 1919 0 250 .Mattoon, Ill. Sept. 23, 1864 0 no estimate
3 tornadoes June 4, 1877 0 no estimate Wilmington , De 1 • June 22, 1887 3 no estimate May 26, 1917 101 2,500
5 tornadoes Aug. 21, 1888 12 150 Apr. 18, 1938 0 50 Atlanta, Ga. July 12, 1881 - no estimate July 6, 1941 0 5 2 tornadoes Dec. 5, 1954 0 25 Aug. 25, 1941 1 150
Fostoria, Ohio July 7, 1881 - no estimate Akron, Ohio Feb. 11, 1887 - no estimate 2 tornadoes Apr. 20, 1896 0 50
4 tornadoes May 10, 1890 0 80 June 9, 1940 0 no estimate Tinker Field, Okla. Mar. 20, 1948 0 10,250 Apr. 27, 1943 0 2,000 2 tornadoes I Mar. 25, 1948 0 6,100
Erie, Pa. Nov. 17, 1890 - no estimate t Dainages are rough estima.tes made at the time of oc-4 tornadoes Oct. 21, 1909 0 150 currence. Comparisons are impractical due to change
July 29, 1954 0 slight in monetary values, metropolitan development, and Sept. 21, 1957 0 20 population expansion.
* Total for tornadoes on this date.
39

~ 0
Date
June May
March
May
March
5-6 p 1916 26-28, 1917
18, 1925
1 ~ 1930
21, 1932
March 30-31 » 1933
April 5-6, 1936
March 30, 1938 Apri 1 16-17, 1939
May 20-21, 1949
March 21-22, 1952
May
June
March April
May
April
May
10' 1953'
7' 1953
24, 1954 30~ 1954
25-27, 1955
2-3' 1956
20, 1957
Nov. 16-17, 1958
Table So--SELECTED FAMILIES OF TORNADOES, 1916-58
Number!Number ofiNumberiDamaget in of tornadoes . of thousands
hours deaths of dollars States
35 32
15
8
6
31
20
21 33
33
22
20
11
10 21
66
47
12
22
32 22
12
33
31
39
14
30 24
48
20
30
35
24 32
72
51
37
37
100 264
740
15
318
80
462
47 41
55
208
12
11
0 2
102
40
44
0
$305 6,630
17,947
Alabama, Arkansas, Mississippi, and South Carolina. Missouri, Arkansas, Mississippi, Alabama~ Tennessee» Kentucky, Indiana, and Illinois.
Kansas, Missouri, Tennessee, Kentucky, Alabama~ Indiana, and Illinois.
2 ,354 Kansas~ Missouri, Nebraska, Minnesota, Wisco'nsin, Iowa, and Illinois.
5~707 Alabama, Mississippi, Georgia, Tennessee, Indiana 11 and Illinois.
1 j415 Texas, Oklahoma, Kansas, Arkansas, Louisiana, Missi.ss:ippi~ Alabama, and Florida.
16,677 Arkansas, Mississippi, Alabama, Georgia~ South Carolina, and Tennesseeo
2,442 Oklahoma, Kansas, Missouri, Arkansas, and Illinois .• 332 Texas, Kansas, Arkansas, Louisiana~ Mississippi, and
Alabama. 8,752 Oklahoma, Colorado, Kansas, Nebraska, Missouri, Arkansas 11
Iowa, Kentucky, Tennessee, Indiana, and Illinois. 14,539 Missouri, Arkansas, Mississippi, Alabama, Tennessee, and
Kentucky. 3,993 South Dakota, Oklahoma, Kansas, Missouri, Nebraska, Minne
sota, Arkansas, Iowa, and Wisconsin. 2,089 Montana, Colorado, Kansas, Nebraska, South Dakota, Minne
sota, and Iowa. 383 Texas, Oklahoma, Colorado~ Kansas, Missouri~ and Arkansas.
2,391 Texa.s, Oklahoma, Missouri, Iowa, Arkansas,. Mississippi, Louisiana, and Florida.
11,753 Texas, Oklahoma, Kansas, Nebraska, Missouri, Arkansas, and Illinois.
19,575 Oklahoma, Kansas, Nebraska, Wisconsin, M:iehigaD > Illinois, Indiana, Kentucky, Tennessee, Missouri, Arkansas, and Mississippi.
3 ,554~·.0klahoma, Colorado, Kansas, Miss.ouri ~ Ne·braska, and Squth Dakota.
705 Texas, Oklahoma·' Kansas, M·issouri, Arkansas'» and Indiana.
t Damages are rough estimates made at the time of occurrence. Comparisons are impractical due to cha.nge· in monetary values, metropolitan development, a.nd population expansion.

Table 9o--LIST OF MORE DAMAGING TORNADOES IN EACH STATE
State & Date
ALABAMA Apr. 20, i920 Apr. 20, 1920
Mar. 21, 1932 Feb. 12, 1945 Apr. 15, 1956 Mar. 21, 1932 May 5, 1933 Oct. 25, 1925
Mar. 28, 1920 Mar. 21, 1932 Jan. 11, 1918 May 27, 1924 Nov. 24, 1949 Apr. 18, 1953 Apr. 8, 1957 Nov. 18, 1957
ARIZONA Aug. 29, 1957 June 13, 1955
ARKANSAS Mar. Jan. Apr. Mar. June Apr. Oct. Apr. Apr. Mar. May Nov. Mar. Apr. Apr. Oct. Mar. Apr. May May Apr. Mar. May May Feb. Dec.
21, 1952 3, 1949
15, 1921 21, 1952 1, 1947
10, 1929 29, 1942 12, 1945 16, 1939 18' 1927 9, 1927
25, 1926 26, 1949 10, 1929 18, 1920 26, 1941 21, 1952 10, 1944 18, 1930 27, 1917 21, 1929 17, 1927 9, 1927 9, 1927 5, 1942
12-13' 1931
CALIFORNIA Jan. 11, 1951 Apr. 6, 1926 Nov. 15, 1952
COLORADO Aug. 10, 1924 June 6, 1947 Nov. 4, 1922 June 29, 1928 Apr. 30, 1942 Oct. 2, 1930
Deaths
46 44
37 26 25 23 21 18
17 14 12 12 10
6 2 1
0 0
57 57 51 40 35 31 29 27 27 24 24 23 19 18 18 15 14 14 14 12 12 12 10 10
3
1
0 0 0
10 0 4 3 4 3
Damaget in thousands of dollars
$1,000 1,000
Considerable 1,700 1,000
Location
Fayette to Madison Counties. Marion, Franklin, Colbert, and Lawrence Counties.
Tuscaloosa County. Montgomery. Birmingham area. Perry to Randolph Counties. Bibb to St. Clair Counties.
Considerable 254 250 Butler, Crenshaw, Pike, Bullock, and Barbour
150 No estimate
100 30
3 5,000 1,000 1,000
10 8
3,727 1,318 1,225 1,573 1,000
308 500 500
20 503 500 438
No estimate 200 100 125
1,446 100
15 43
1 No estima.te
3oo 5
1,050
1,250
1,500 100 100
Counties. Deatsville. Shelby and Talladega Counties. Cowarts and Webb. Lathrop, Empire, and White Sulphur Spring. Hackneyville. Auburn. Morgan and Marshall Counties. Jefferson County.
Sentinel. Queen Creek.
Howard to Craighead Counties. Warren area. Miller, Hempstead and Pike Counties. Lonoke to Poinsett Counties. Pine Bluff area. Cleburne to Greene Counties. Berryville. Logan to Carroll Counties. Drew County. Green Forest. Strong. Heber Springs. Whelen Springs to Harrisburg. Cross County. Yell, Logan, and Johnson Counties. Hamburg. Lonoke to Mississippi Counties. Near Shiloh and Duncan. Arkansas and Phillips Counties. Manila. Tillar. Pike to Saline Counties. Hoxie and Walnut Ridge. Egypt. Little Rock .
Columbia and Ouachita Counties.
Los Altos-Sunnyvale area. National City. Orange County.
6 Washington County. 497 Julesburg. 105 Sugar City to Genoa. 250 Johnstown.
50 Kiowa County. 10 Pueblo County.
41

Table 9 0 --LIST OF MORE DAMAGING TORNADOES IN EACH STATE, 1916-58 (Continued)
State & Date
CONNECTICUT June 19, 1957 Aug. 21, 1951 July 14, 1950
DELAWARE Aug. 25, 1941 Apr. 18, 1938
Deaths
0 0 0
0 0
DISTRICT OF COLUMBIA Nov. 17, 1927 0
FLORIDA Jan. 18, 1936 Apr. 5, 1925 Mar. 30, 1939 Apr. 10, 1956 Sept.l9, 1947 Sept. 4, 1948 Apr. 15, 1958 Oct. 19. 1958
GEORGIA Apr. 6, 1936 Apr. 30, 1953 Apr. 18, 1953 Mar. 13, 1954 Mar. 28, 1920 Apr. 25, 1929 Feb. 10, 1921 Apr. 2, 1936 Apr. 16, 1944 Feb. 10, 1940 Mar. 22, 1932 Apr. 25, 1929 Apr. 30, 1924 Mar. 13, 1954
IDAHO Apr. 26, 1940 June 7, 1936
ILLINOIS Mar. 18, May 26, Mar. 1.9, Mar. 28, Apr. 19, Sept.l4, Dec. 18, Sept. 29, June 14, Mar. 28, Mar. 15, Mar. 16, Mar. 15, Feb. 25, May 21, June 27, Apr. 9, May 9, June 27, Dec. 18,
42
1925 1917 1948 1920 1927 1928 1957 1927 1957 1920 1938 1942 1938 1956 1949 1945 1953 1927 1951 1957
7 5 4 0 2 2 0 1
203 18
2 2
33 40 28 23 23 18 12 11 10
5
0 2
606 101
33 20 21 14 11
7 2 8
13 11 10
6 5 1 1 1 1 1
Damaget in thousands of dollars
$350 135 100
150 50
300
25 250
20 1,000
250 250 750 400
13,000 15,000 15,000 6,000 1,250
850 Considerable
3,000 1,000 3,200
60 275
40 3,175
Location
Hartford County. Litchfield and Middlesex Counties. Ridgefield.
Wilmington. Wilmington.
Washington and Jackson Counties. Hialeah. Duval County. Dania and Hollywood. Apalachicola. Gadsden County. Ft. Pierce. Pahokee.
Gainesville. Warner Robbins Air Force Base. Columbus area. Lawson Air Force Base. La Grange and West Point. Candler and Bulloch Counties. Gardners and Oconee. Cordele. Franklin and Hart Counties. Albany. Clarke and Madison Counties. Bleckley, Dodge, and Laurens Counties. Chipley Taylor, Crawford, and Bibb Counties.
25 Gooding County. 4 Nez Perce County.
13,193 2,500 3,765 2,000 1,349 1,200 2,000 3,000 3,000 1,000
905 200 550
1,700 1,300 2,300 2,250 1,125 1,005 1,000
Tri-State. Mattoon-Charleston. Gille~Spie-Bunker Hill. Will,' ·Du Page, and Cook Counties. Calhoun to Ford Counties. Rockford. Jackson, Williamson, and Franklin Madison. Springfield. Elgin. Adams to Woodford Counties. Vermilion County. Belleville and O'Fallon. St. Clair and Clinton Counties. Wood River. Rock Island to La Salle Counties Champaign and Vermilion Counties. Morrisonville to Decatur. Homer and Latham.
· Mount Vernon.
Counties.

Table 9o--LIST OF MORE DAMAGING TORNADOES IN EACH STATE, 1916-58 (Continued)
State & Date
ILLINOIS (Cont.) Apr. 12, 1945 June 27, 1951
INDIANA Mar. 18, 1925 Mar. 26, 1948 May 21, 1949 Mar. 28, 1920 Mar. 28, 1920 Mar. 11, 1917 Apr. 17, 1922 Mar. 28, 1920 Apr. 9, 1953 May 18, 1927 Mar. 6, 1956 .Mar • 3 , 1955 Mar. 17, 1945
IOWA May 21, 1918 May 9, 1918 June 25, 1951 Sept. 28, 1923 Apr. 23'"', 1948 Aug. 26, 1928 June 23, 1952 May 10, 1953
KANSAS May June May Apr. May Mar. May May June
June June July May July June June
25, 1955 10, 1958 25, 1917 29, 1942 7, 1927
30' 1938 20, 1918 20, 1957 26-27,
1951 8, 1941 5, 1917 4, 1932
22, 1933 13, 1924 21, 1948 15, 1957
KENTUCKY May 27, 1917 May 9, 1933 Mar. 16, 1942 Mar. 18, 1925
LOUISIANA May 1, 1933 Dec. 31, 1947 Feb. 17, 1938 Nov. 7, 1957 Feb. 12, 1950 Feb. 17, 1927 Apr. 4, 1923 Feb. 17, 1927 Nov. 25, 1926
Deaths
0 0
70 20 14 14 13 21 14 12
2 1 1 0 0
10 8 1 6 5 4 0 0
80 15 23 15 10 10 10
7
5 8 7 5 4 1 0 0
68 34 24 12
23 18 21
3 18 17 14 14 ll
Damaget in thousands of dollars
$2,230 1,250
2,775 3,000 1,000
No estimate 1,000
600 400 350
1,000 3,000 2,000 1,250 1,000
900 500
6,000 15
250 400
1,000 1,000
2,225 3,000
600 100
1,300 575 450
1,010
2,080 180 500 500 750
2,000 1,000 1,000
2,000 200 312 100
1;250 1,500
250 1,118
280 100 750
55 12
Location
Adams, Hancock, and McDonough Counties. Emden-Hartsburg.
Tri State. Coatesville-Danville. Sullivan and Clay Counties. Jay and Adams Counties. Wells, Adams, and Allen Counties. Henry and Wayne Counties. Warren to Jay Counties. Wayne and Randolph Counties. Attica to Muncie. Indianapolis. Marion. Lake to Allen Counties. Posey 1 Vanderburgh, Warrick, and Dubois Counties.
Boone to Grundy Counties. Butler to Winneshick Count~es. Duncan. Council Bluffs. Ionia. Montgomery, Cass, and Adams Counties. Cherokee County. 1
Ventura to Northwood.
Udall. Eldorado. Sedgwick and Harvey Counties. Decatur County. Comanche to McPherson Counties. Labette and Cherokee Counties. Ellis and Osborne Counties. Williamsburg.
Wakeeney. Sedgwick, Butler, and Marion Counties. Topeka. Washington County. Seward County. Augusta. Wichita. Kensington.
Fulton, Hickman, Carisle, and Graves Coun~ Monroe to Russell Counties. Muhlenberg to Nelson Counties. Allen to Adair Counties.
Minden. Haynesville-Cotton Valley. Rodessa. Boyce to Alexandria. Shreveport. Pleasant Hill. Alexandria and Pineville. Lake Bruin. Morehouse Parish.
43

Table 9.--LIST OF MORE DAMAGING TORNADOES IN EACH STATE, 1916-58 (Continued)
State & Date
MAINE Aug. 11, 1954
.May 16, 1929 July 7, 1954
MARYLAND June 23, 1944 Nov. 9, 1926 June 23, 1944
MASSACHUSETTS June 9, 1953
MICHIGAN June 8, 1953 Apr. 3, 1956 May 12, 1956 June 6, 1917 May 21, 1953 Aug. 8, 1939 May 2, 1930 Apr. 3, 1956 Jan. 19, 1933 June 17, 1946
MINNESOTA June 22, 1919 Aug. 21, 1918 June 18, 1939 July 20, 1951 Aug. 17, 1946 Aug. 20, 1928 Apr. 5, 1929
MISSISSIPPI Apr. 5, 1936 Dec. 5, 1953 Mar. 16, 1942 Apr. 20, 1920 Apr. 20, 1920 Mar. 16, 1919 Apr. 20, 1920 Apr. 20, 1920 Feb. 25, 1929 Mar. 31, 1933 Apr. 26, 1921 June 6, 1916 Jan. 6, 1946 Mar. 31, 1933 Apr. 6, 1935 Nov. 26, 1926 Feb. 16, 1956
MISSOURI Sept.29, 1927 May 9, 1927 May · 2()-, 1957 May ·. 21, 1949 May 21, ·1957 Mar. 21, 1952 Apr. 29, 1947 Mar •. 18, 1925 Apr. 19, 1916 May 8, 1927
_44
Deaths
1 0 0
2 17
3
90
116 18
3 4 2 2 0 0 0 0
59 36
9 5
11 6 6
216 38 65 43 36 35 27 24 19 16 15 13 12 12 11 10
1
72 87 37 23
8 17 14 13
9 10
Damaget in thousands of dollars
$10 25 20
1,000 100 150
52,193
19,000 10,500 4,000 1,000 2,500 1,050 1,050 1,010 1,000 1,000
3,500 1,000 1,200 6,000
225 1,000 1,000
3,000 25,000
625 Considerable Considerable
1,000 Considerable Considerable Considerable
15 Considerable
275 247
20 190
Considerable 1,000
22,000 2,132
Millions 3,500
5-10 million 1,425
772 564
1,000 346
Near Caribou. Portland a rea. Calais.
Cambridge. La Plata. Garrett County.
Worcester.
Flint area.
Location
Allegan, Ottawa, Kent, and Montcalm Counties. Flint area. Battle Creek, Eden, and Williamston. St. Clair County. Kalamazoo County. Ottawa to Gratiot Counties. Van Buren, Allegan, Kent, and Barry Counties. Monroe County. Wayne County.
Fergus Falls • Tyler. Anoka. Minneapolis-St. Paul. Blue Earth County. Freeborn and Mower Counties. Minneapolis.
Tupelo. Vicksburg. Leflore to Lee Counties. Oktibbeha, Clay, and Monroe Counties. Jasper and Lauderdale Counties. Issaquena to Sunflower Counties. Neslioba to Lowndes Counties. Union County. Bolivar and Quitman Counties. Jasper County. Braxton. Jackson. Carroll County. Clarke County. Wilkinson and Amite Counties. Marks. Prairie to Aberdeen.
St. Louis. Poplar Bluff. Jackson and Ray Counties. Cape Girardeau. Reynolds to St. Francois Counties. Cooter to Cottonwood Point. Worth County. Tri-State. Vernon to Cole Counties. Camden to Audrain Counties.

Table 9.--LIST OF MORE DAMAGING TORNADOES IN EACH STATE, 1916-58 (Continued)
State & Date
MISSOURI (Cont.) Mar. 11, 1920 Mar. 15, 1938 Dec. 18, 1957 Aug. 21, 1952 Nov. 16, 1952
MONTANA June 10, 1923 July 19, 1952 Aug. 20, 1947 Sept. 16, 1946 July 19, 1948
NEBRASKA June 7, 1953 May 9, 1953 Apr. 25, 1957
NEVADA Apr. 18' 1949
NEW HAMPSHIRE May 5, 1929 June 9, 1953 July 23, 1946
NEW JERSEY May 24, 1933 Aug. 25, 1941 Apr. 1, 1929
NEW MEXICO May 31, 1930 May 24, 1957
NEW YORK June 10, 1945 July 23, 1920
NORTH CAROLINA Apr. 2, 1936 Jan. 5, 1931
NORTH DAKOTA June 20, 1957 July 3, 1947 June 24, 1923
OHIO June 8, 1953 June 28' 1924 Mar. 28, 1920 Mar. 28, 1920 Apr. 27, 1943 July 19, 1950 June 18' 1928 Aug. 13' 1943 May 9, 1933 Apr. 27, 1943
OKLAHOMA Apr. 9, 1947 Apr. 12, 1945
Deaths
10 10
3 1 0
2 1 0 0 1
11 5 1
0
0 0 L
0 1 1
3 0
0 2
14 6
10 8 7
17 85 16 10
0 0 2 1 0 0
101 69
Damaget in thousands of dollars
$200 65
1,000 1,500 1,300
No estimate 326 350 300
68
156 2,500 1,500
Slight
200 100
60
1,000 400
55
150 450
5,000 200
2,015 35
10-15 million 200
Considerable
20,000 12,000
500 500
2,000 2,000 1,000 1,000 1,000 1,000
8,023 1,525
Location
Melva. Dunklin, Pemiscot, and New Madrid Counties. Chaffee. Sedalia. Hopkins and Burlington Junction.
Rivulet. Wibaux. Daniels County. Richland County. Three Forks.
Near Arcadia. Hebron to Milford. Seward to Douglas Counties.
Washoe County - Only tornado reported in Stata
Berlin. Exeter. Concord.
Camden and Burlington Counties. Swedesboro and Hopelawn. Blairstown.
Mora County. Curry County.
Jamestown. Allegany County.
Guilford, Alamance, and Orange Counties. Warren County.
Fargo area. Walsh County. Bowman and Adams Counties.
Cleveland area. Lorain-Sandusky. Darke, Auglaize, and Allen Counties. Paulding to Lucas Counties. Medina and Summit Counties. Lima. Franklin to Washington Counties. Canton Dayton area • Cleveland.
Ellis, Woodward, and Woods Counties. Antlers.
45

Table 9.--LIST OF MORE DAMAGING TORNADOES IN EACH. STATE,l916-58 (Continued)
State & Date
OKLAHOMA (Cont.) Mar. 20, 1948 May ·' 25, 1955 Mar. 25, 1948 May 2, 1920 Apr. 27, 1942 June 12, 1942 Nov. 19, 1930 May 2, 1942 Apr. 12, 1945 Mar. 25, 1948
Apr. 18, 1927 Apr. 9, 1919 Jan. 22, 1957 Mar. 13, 1922 Apr. 12, 1945 May 10, 1947 Apr. 2, 1956 June 16, 1928 Mar. 30, 1949 Apr. 2, 1957 Feb. 13, 1946
OREGON Apr. 15, 1925 Apr. 12, 1957
PENNSYLVANIA June 23, 1944 June 23, 1944 June 7, 1947 Apr. 5, 1952 May 13, 1956
RHODE ISLAND Dec. 1, 1934
SOUTH CAROLINA Apr. 30, 1924 Apr. 30, 1924 May 5, 1933 Apr. 16, 1944 Apr. 8, 1957
SOUTH DAKOTA July 31, 1949 Sept •. l3, 1928
TENNESSEE Mar. 21, 1952 May 9, 1933 Mar. 18, 1925 Mar. 11, 1923 Mar. 14, 1933 Mar. 26, 1944 Feb. 29, 1952 Apr. 3, 1956 Mar. 16, 1942
Mar. 14, 1933 May 27, 1917 Mar. 14, 1933 Mar. 21, 1952
46
Deaths
0 20
0 60 52 35 23 16 13 13
11 11 10 10
8 6 5 4 4 2 1
0 0
25 17
3 0 0
0
67 9
19 18
0
0 4
21 33 26 20 15
0 2 3
17
12 12 11 10
Damaget in thousands of dollars
$10,250 8,015 6,100
175 2 ,1>00
200 250 116
1,400 328
125 50
150 50
1,000 1,000 1,000 1,500 1,087 1,500 1,000
10 4
1,000 1,000 1,000 1,500 1,000
Location
Will Rogers and Tinker Fields. Blackwell. Tinker Field. Peggs. Claremore and Pryor. Oklahoma City. Oklahoma County. Pottawatomie to Creek Counties. Muskogee. Hughes, Mcintosh, Muskogee, and Sequoyah Counties.
Choctaw County. Roberta and Durant. Gans. Gowen. Oklahoma City. Leedey. Lincoln and Creek Counties. Blair and Headrick. Kenton and Longdale. Marshall County. Ardmore.
Condon. Clackamas.
Washington, Greene, and Fayette Counties. Beaver to Somerset Counties. Mercer County. Wrightsville and York. Beaver to Somerset Counties.
5 Washington County. Only tornado reported in State.
1,000 2,000
350 300
1,001
Aiken to Florence Counties. Anderson to York Counties. Anderson to Spartanburg Counties. Anderson to Newberry Counties. Lancaster, Chesterfield, and Marlboro Coun~.
1,000 Beresford and Elk Point. 245 Yankton and Turner Counties.
2,500 100 100 100
2,200 4,000 3,000 1,250
500
375 120 200 555
Henderson. Overton County. Sumner County. Deanburg to Pinson. Nashville area. Memphis. Fayetteville. Lexington. Chester, Henderson, Decatur, and Humphreys Counties.
Claiborne County. Dyersburg area. Sullivan County. Chesterfield.

Table 9.--LIST OF MORE DAMAGING TORNADOES IN EACH STATE, 1916-58 (Continued)
State & Date Deaths
TENNESSEE (Cont.) dan. 14, 1932 10 Jan. 22, 1957 0
'TEXAS May Apr. Apr. Apr.
May Apr. May May Apr. Jan. May May May May Apr. Mar. Jan. June Apr. May May Mar. Apr. May Apr. June Nov. May Nov. June Apr. Apr. Mar. Apr. Apr.
UTAH May Aug.
VERMONT
11, 1953 9, 1947
12, 1927 9, 1919
6' 1930 2, 1957
15, 1949 11, 1953 28, 1942 4, 1946 6' 1930 9, 1927
15, 1957 14, 1923 9, 1919
13' 1953 4, 1946
10, 1938 13, 1921 4, 1922 9, 1927
30, 1933 8, 1922 3, 1948 6, 1955 1, 1954 7, 1957
10, 1943 7, 1957 6, 1951
27, 1958 8, 1944
24, 1936 5, 1955
26, 1957
25, 1954 7, 1957
June 18, 1957 July 17-18,
1927
VIRGINIA May 2, 1929 May 2, 1929 May 2, 1929
WASHINGTON June 26, 1958 Oct. 2, 1951
WEST VIRGINIA June 23, 1944
June 23, 1944 June 23, 1944
114 68 74 42
41 10
6 11 11 10 36 28 21 23 20 17 15 14 12 12 11 10 12
0
3 1 1 2 4 1 0 0 1 0 0 0
0 0
0
13 3 6
0 0
100
3 0
Damaget in thousands Location of dollars
$ 75 Gibson County 1,800 Nashville.
41,150 1,550 1,230
450
2,100 4,000 4,779 3,239 1,500 1,500
127 900 500
Waco. White Deer and Higgins. Rocksprings. Henderson,Van Zandt, Wood, Camp, and Red River Counties.
Hill to Ellis Counties. Dallas Amarillo. San Angelo area. Crowell. Nacogdoches County .. Karnes and De Witt Counties. Collin, Hunt, Fannin, and Lamar Counties. Silverton. Howard and Mitchell Counties. Fannin County. Jud, O'Brien, and Knox City. Anderson County. Clyde. Melissa & Petty. Austin. Garland •'
50 125 600 500 110 500 500 100 200
82 2,000 2,850 2,612 2,225 1,000 1,500 1,500 1,475 1,000 1,200 1,000 1,000
Angelina, Nacogdoches, and San Augustine Count:ies. Rowena and Oplin.
8 6
McKinney. Sherman. Cottle County. Groves. Rusk County. Orange. White Deer. McKinney. Pottsville. Gregg County. Stamford and Woodson. Tyler.
Laketown. Salina.
58 Franklin to West Berkshire.
20 North Troy and Elkhurst.
100 200
50
20 10
*2,000
Rye Cove. Woodville and Flint Hill. Lagrange-Weaversville.
Wallula Junction. Battle Ground.
Harrison, Barbour, Upshur, Taylor and RandolPh Counties
Tucker County • Brooke, Preston, and Grant Counties. 47

·Table_9.--LIS~ OF MORE DAMAGING TORNADOES IN EACH STATE, 1916-58 (Continued)
Damaget in State ~ Date Deaths thousands Location
of dollars
WISCONSIN Sept. 21, 1924 26 $564 Eau Claire to Oneida Counties. June 4, 1958 1'9 7,010 Woodville -Colfax. Apr. 5, 1929 12 ·725 Pierce to Iron Counties. Sept. 21, 1924 10 250 Barron to Ashland Counties. June 22, 1944 7 1,023 Lafayette County. Apr. 3' 1956 7 1,000 Berlin area. June -4, 1958 4 1,500 Chippewa Falls . June 13, 1930 6 1,000 Pierce to Clark Counties. May· 10, 1953 4 1,000 Pierce·to Douglas Counties. May 10, 1953 0 1,000 Buffalo to Price Counties.
WYOMING June 25, 1942 2 Many thousands Platte County. June 26, 1928 0 360 Natrona County.
ALASKA**(None reported)
HAWAII Jan. 21, 1957 0 10 Wahiawa Valley. Mar. 19' 1955 0 1 Hilo.
t Damages··are rough -estimates made at the time of occurrence. Comparisons are impractical due to change in monetary values, metropolitan development, and population expansion.
* Total for tornadoes on this date in State. ** Small tornado reported on Kayak Island, Alaska, November 4, 1959.
Table 10.--NUMBER OF WATERSPOUTS AND DAYS FOR STATES AND UNITED STATES, 1948-58
January February March April May June July August September October November December Total State
No. Days No. Days No. Days No. Days No. Days No. Days No. Days No. Days No. Days No. Days No. Days No. Days No, Days
Ala. 2 2 3 1 5 3 Calif. 1 1 2 2 10 2 1 1 14 6 Del. 1 1 1 1 Fla.· 2 2 1 1 2 2 3 3 13 11 25 12 31 16 15 11 16 12 7 6 4 1 1 1 120 78 Ind. 2 1 2 1 4 2
La. 3 3 1 1 7 4 2 2 13 10 Maine 1 1 1 1 2 2 Md. 12 1 12 1 Mass. 2 1 2 1 Mich. 2 2 6 4 5 2 13 8
Miss. 1 1 1 1 N. H. 1 1 1 1 s. c. 1 1 3 3 4 4 s. Dak. 1 1 1 1 Tex. 1 1 17 8 3 3 11 8 3 3 1 1 1 1 37 25
Wis. 3 2 1 1 4 3 Alaska 2 2 2 2 Hawaii 1 1 1 1
United 3 3 4 4 5 5 3 3 20 17 48 24 46 24 42 30 40 20 18 9 7 4 1 1 237 144 States
TABLE 11-NUMBER OF FUNNELS ALOFT AND DAYS BY MONTHS AND YEARS IN UNITED STATES, 1953-58
January February March April May June July August September October November December Total Year
No. Days No. Days No. Days No. Days No. Days No. Days No. Days No. Days No. Days No. Days No. Days No. Days No. Days
1953 4 3 8 3 19 8 21 11 10 7 15 7 1 1 4 2 82 42 1954 2 1 1 1 7 3 20 10 21 9 29 14 2 2 12 10 7 3 2 2 1 1 104 56 1955 2 2 2 2 19 8 67 16 109 20 19 8 15 13 6 6 3 1 242 76 1956 2 2 27 7 86 16 31 13 79 23 30 12 1 1 17 8 1 1 1 1 275 84 1957 1 1 26 8 164 19 243 26 214 27 50 18 29 17 14 B 12 7 11 5 8 2 772 136 1958 5 1 5 4 9 7 93 21 94 21 200 26 203 30 52 20 42 20 10 8 11 5 724 163
Totals 8 3 8 7 50 25 331 68 530 96 604 111 363 88 153 79 70 36 45 27 24 12 13 5 2,199 557
48

Table 12.--NUMBER OF FUNNELS ALOFT FOR STATES AND UNITED STATES BY MONTHS,l953-58
Jan. Feb. Mar. Apr. May June July Aug. Sept. Oct. Nov. Dec. Total
Ala. 1 3 2 1 1 8 Ariz. 1 1 2 4 3 2 13 Ark. 3 3 3 5 4 1 19 Calit ... 2 3 6 1 1 13 Colo. 4 5 10 17 2 38
Conn. 0 Del. 0 D. C. 0 Fla. 2 1 6 6 4 11 16 22 8 1 10 4 91 Ga. 1 4 2 2 2 11
Idaho 1 4 1 6 Ill. 4 6 5 2 3 2 2 24 Ind. 8 6 20 16 7 1 1 59 Iowa 1 9 6 2 18 Kans. 1 3 33 105 132 42 17 10 1 344
Ky. 1 1 1 3 La. 3 1 11 8 5 2 5 4 1 1 41 Maine 1 1 Md. 1 1 Mass. 2 1 1 4
Mich. 4 11 15 4 2 36 Minn. 2 23 24 20 69 Miss. 2 4 5 3 4 2 1 21 Mo. 1 12 28 51 51 4 1 1 149 Mont. 8 3 11
Nebr. 1 5 15 27 41 2 91 Nev. 5 5 N. H. 2 2 :N. J. 0 N. Mex. 3 2 2 1 1 1 1 11
N. Y. 1 1 N. c. 1 1 N. Dak. 3 25 18 6 2 1 55 Ohio 1 2 3 7 13 Okla. 4 77 98 64 22 4 11 3 283
Oreg. 1 2 3 Pa. 0 R. I. 0 s. c. 1 1 1 3 S. Dak. 3 3 21 4 8 39
Tenn. 4 1 1 1 7 Tex. 5 1 22 147 189 152 52 34 ~ 30 6 3 670 Utah 2 1 1 4 Vt. 0 va. 1 1
Wash. 2 2 w. Va. 1 1 Wis. 3 2 11 2 18 Wyo. 1 2 4 2 9 Alaska 0 Hawaii 0
u.s. Total 8 8 50 331 530 604 363 153 70 45 24 13 2,199
49
~6 0 Cl <{ 5 z 0::
~ 4
lL 0 3
0::
~" :::;: ~1
(f)
LLJ
17
16
15
13
12
g 11 <{
~ 10 0 1-
lL 0
0:: LLJ
~ 7 :::> z
<1l LLJ 0 0 <{ z 0:: 0 1-
lL 0
11
10
8
FMAMJ J ASOND
MONTH Figure 4.--Mean monthly number of torna
does in the Alabama-Florida-Georgia-~~~!~i~ga!~i~~ilgfgfJo:~:a, 1916-58.
FMA MJJ SOND
MONTH Figure 5.--Mean monthly number of torna
does in the Ar~ansas-:Kansas-Missouri-~~;~~~~~s~rea,l916-58. Based on 2,739
11.3
0:: 5 LLJ CD :::;: 4 :::> z
50
0.0 0.0 0.0
FMAMJ J ASO ND
MON1'H Figure 6.--Mean monthly number of torna
does in the Iowa-Minnesota-NebraskaNorth Dakota-South Dakota area, 1916-58. Based on 1,544 tornadoes.
46
<11
42
40
38
36
34
32
30 (f)
LLJ
g 28 <{ z 0:: 26 0 1-
24 lL 0
0:: 22 LLJ
~ 20 :::> z
(f)
>-
18
16
14
12
10
14
<{ 12 Cl
glO <{ z 0:: 8 0 I-
lL 6 0
0:: 4 LLJ CD :::;: :::> z
45.4
M A M J J A 0 N D
MONTH Figure 7.--Mean monthly number of tornadoes in the Upited States, 1916-58. Based on 9,167 tornadoes.
FM AMJ JA OND
MONTH Figure 8.--Mean monthly number of torna
do days in the United States, 1916-58. ,Based on the 3,412 days on which torna does were reported.
Figure 9.--Mean monthly number of tornadoes per tornado day in United States, .1916-58. Based on 9,167 tornadoes that occurred on 3,412 days.

20
0::: w !D 15 ::;E :::)
2 10 __j <( 1- 5 0 1-
0 1 0 11 12 1 3 1 4 1 5 16 1 7 18 19 20 21 22 23 24 25 26 27 28 29 30 31
JANUARY 40
35
30 0::: w !D 25 :::'! :::)
z 20 __j <(
15 1-0 1-
10
51

52
125
120
115
110
105
100
95
90
80
75
.~ 70
~ 65
...J 60 <( f--0
55 f--
50
45
40
35
30
25
20
15
10
105
100
95
90
85
80
75
70
65
0: ~ 60
~ z 55
...J
;: 50 .o
f--45
40
35
30
25
20
15
10
10 II 12 13 14 15 16 17 18 19 20 21 22 23 24 25 26 27 28 29 30
APRIL
10 11 12 13 14 15 16 17 18 19 20 21 22 23 24 25 26 27 28 29 30 31
MAY LEGEND ~ Number of Tornadoes .m Number of Tornado Days
Figure 10,--Tota1 number of tornadoes United States, 1916-58, (Continued)
and tornado days recorded on each date of the year in the

100
95
90
85
80
75
70
65
60 0:: w CD 55 ::;: :::> z 50 _J
<t 45 f-0 f-
40
35
30
25
20
15
10
10 11 12 13 14 15 16 17 18 19 20 21 22 23 24 25 26 27 28 29 30 JUNE
55
50
45
40
0:: w 35 CD ::;: :::>
30 z _J
<t 25 f-0 f-
20
15
10
10 11 12 13 14 15 16 17 18 19 20 21 22 23 24 25 26 27 28 29 30 31
JULY
30
25 0:: w CD 20 ::;: :::> z 15 _J
<t f- 10 0 f-
10 11 12 13 14 15 16 17 18 19 20 21 22 23 24 25 26 27 28 29 30 31
~ N"mb" of Tomodo" AUGUST
LEGEND
Number of Tornado Days
Figure 10.--Tota1 number of tornadoes and tornado days recorded on each date of the year in the United States, 1916-58. (Continued)
53
30
25 0:: w co 20 ::;;! :::l z 15
_.J
<t I- 10 0 I-
10 11 12 13 14 15 16 17 18 19 20 21 22 23 24 25 26 27 28 29 30
SEPTEMBER
30
25
0:: w 20 co ::;;! :::l
15 z _.J
<t 10 I-0 I-
10 11 12 13 14 15 16 17 18 19 20 21 22 23 24 25 26 27 28 29 30
OCTOBER
50
45
40
35
0:: w
30 co :2: :::l z 25 _.J
;:: 20 0 I-
15
10
1 0 11 12 13 14 15 16 17 18 19 20 21 22 23 24 25 26 27 28 29 30
0:: w
35
30
co 25 ::;;! :::l z 20 _.J
;:: 15 0 I-
10
LEGEND
~ 10 11
Number of Tornadoes
Number of Tornado Days
Figure 10.--Tota1 number of tornadoes United States, 1916-58. (Continued)
54
NOVEMBER
12 13 14 15 16 17 18 19 20 21 22 23 24 25 26 27 28 29 30
DECEMBER
and tornado days recorded on each date of the year in the
31
31

8
7
6
1- 5 z w ~4 w Cl.. 3
2
12
11
10
9
8
1-7 z w (.) 6 a:: w Cl.. 5
4
3
2
[2M 1- 2- 3- 4- 5- 6- 7- S- 9- 10- IIA 12H 1- 2- 3- 4- 5- 6- 7- S- 9- 10- 11-lA 2A 3A 4A 5A 6A 7A SA 9A lOA IIA 12N IP 2P 3P 4P 5P 6P 7P SP 9P lOP liP 12M
TIME OF DAY Figure 11.--Percentage of tornadoes beginning during the specified hours in the
Alabama-Florida-Georgia-Louisiana-Mississippi area, 1916-58. Based on 1,312 tornadoes. Time of day not available for the remaining 117 tornadoes, or about 8 percent of the 1~429 reported in this area.
11.3
12M 1- 2- 3- 4- 5- 6- 7- S- 9- 10- IIA 12H 1- 2- 3- 4- 5- 6- 7- 8- 9- 10- li-lA 2A 3A 4A 5A 6A 7A SA 9A lOA IIA 12N IP 2P 3P 4P 5P 6P 7P BP 9P lOP liP 12M
TIME OF DAY
Figure 12 0 --Percentage of tornadoes beginning during the specified hours in the Arkansas-Kansas-Missouri-Oklahoma area, 1916-58o Based on 2,573 tornadoes. Time of day not available for the remaining 166 tornadoes, or about 6 percent of the 2,739 reported in this area.
55

15
14
13
12
II
10
9 1-z we (.)
0:: lJ.I7 0..
6
5
4
3
2
12
II
10
9
8
1- 7 z ~ 6 0:: LIJ 0..5
4
3
2
/3.9
12M 1- 2- 3- 4- 5- 6- 7- 8- 9- 10- IIA 12M 1- 2- 3- 4- 5- 6- 7- 8- 9- 10- li-lA 2A 3A 4A 5A 6A 7A SA 9A lOA IIA 12N IP 2P 3P 4P 5P 6P 7P SP 9P lOP liP 12M
TIME OF DAY
Figure 13.--Percentage of tornadoes beginning during the specified hours in the Iowa-Minnesota-Nebraska-North Dakota-South Dakota area~ 1916-58 0 Based on 1,427 tornadoes. Time of day not available for the remaining 117 tornadoes, or about 7-1/2 percent of the 1,544 reported in this area.
11.0 11.0
0 ~~~-4~~4-~~~-L~~~~~~-L~~~~~~~~~~~~~-4~~~~~~~~~~~~~
56
12M 1- 2- 3- 4- 5- 6- 7- 8- 9- 10- IIA 12H 1- 2- 3- 4- 5- 6- 7- 8- 9- 10- li-
lA 2A 3A 4A 5A 6A 7A SA 9A lOA IIA 12N IP 2P 3P 4P 5P 6P 7P SP 9P lOP liP 12M
TIME OF DAY
Figure 14.--Percentage of tornadoes beginning during the specified hours in the entire Unite~ States, 1916-58o Based on 8,508 tornadoes. Time of day not available for the remaining 659 tornadoes, or about 7 percent of the total number o.
Vl ........
LESS I
,_ . . -----~ I I
, ----· , I -----..., _____ , • I I
/ THAN '---, __ _ I ! I \ I i
\ I I
\ I N I \ ! __ TE i \ I ------_, ____ _ '\ '""'I I
' ) . I
'( I
? i r I
-----,~ I ., I
.... , I .. ,, I r---~::---
'·----.1__, ·,
·.'\ ... ""' t X
"
Figure 15.--TORNADOES 1916-55
(Isolines based on total number by 2° squares, counting first point of contact with ground of 7,206 tornadoes.) ·

VI 00
Figure 16o--TORNADOES BY 1 DEGREE SQUARES, 1953-58
(Based on first point of contact with ground of 3,540 tornadoeso)

Vl \0
~~ ..... ..,.....,
'b
G U L F M
ALPI:IU Z:(IUJ.L ARU. tii.OJT.CTION ~T.Ui'OAIIO I"J.IULt.I:LS :~· .uiD u•
~
----

0'\ 0
'b
G U L F 0 ,\
M
4LIII:R8 t:QUAL&RJ:4 l'llOH;C'riON --- STAHI;IJ.!ID PJ.Il.t.t.t.t:t.a n' £l'ID U'

0\ 1-A
0'\ N
't1
4.-Tracks of Apri
\ G U L F " 'I M
4LBJCII.a !;QUAL ... 1\~.l PROIJ:Ct'IOH -aTAHO.LRDP.UIALLZLS11'ANDU'
\

,0\ U.J
'b
G U L F
.,. ,.
l-~-~
C)
\
'' \ ,' \ ~1
__ 'L--- --\---
\
\
------
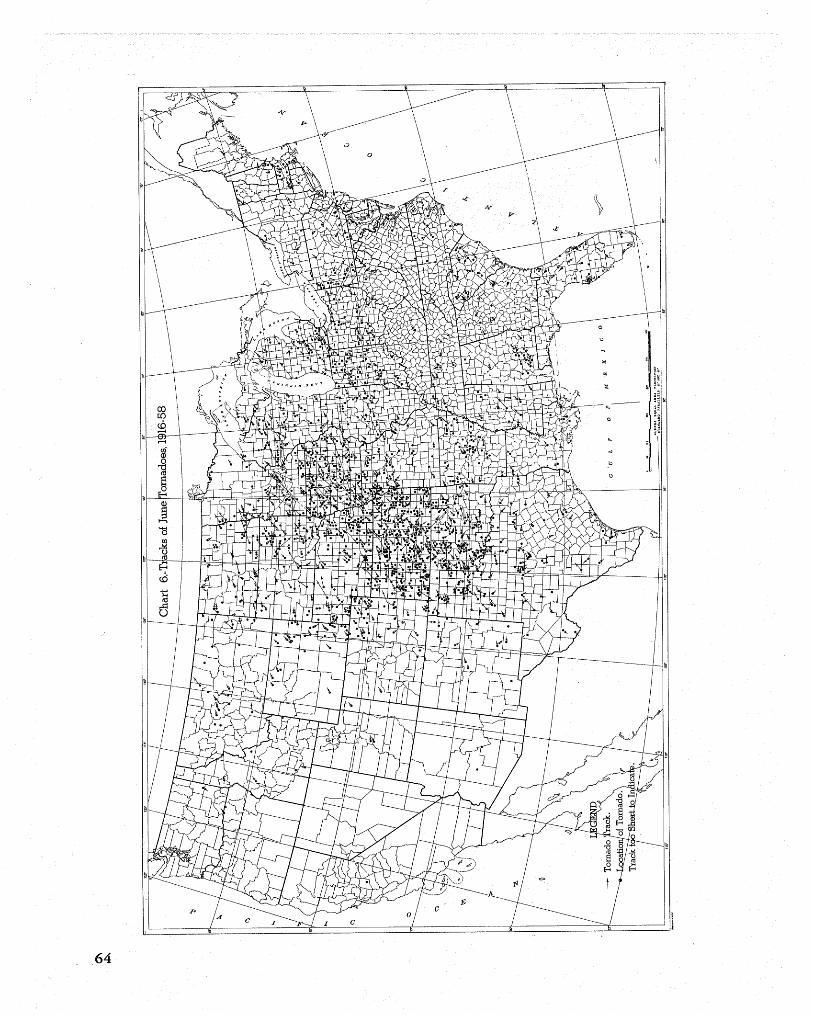
\ \ \
+~\ ~ -: 0 \
\
64

0\ VI
't7
7.-Tracks of JulyiTornadoes, 1.,.
G U L F M E X I
.I.L!IIOU tqUAL Ur.J;A. I'ROJI':CTIOK ---IT.I.KD,UI.DJ'J.IU.I.LtLtn",lNDU"

0'\ 0\
'11
G U L F
'LIII!fi.S J:QUJ.L.I.I\1:4 I'ROlr.CT[ON -~TAND.t.RD PA.RALLI!LS 2i"I.NDU"

0\ -.....!
IF ns- nO' 105" 1000 "" rn BS" 110' 75' 6S" 1
'b
G U L F 0 ' M E
ALDI:RS J:QUALARI:A PROIP:CTIOH ---- ST.LNOJ.RD PARALLJ:LS ~·J.JiD u•
A
-----
f.,
~
I ~.~\ ~
----
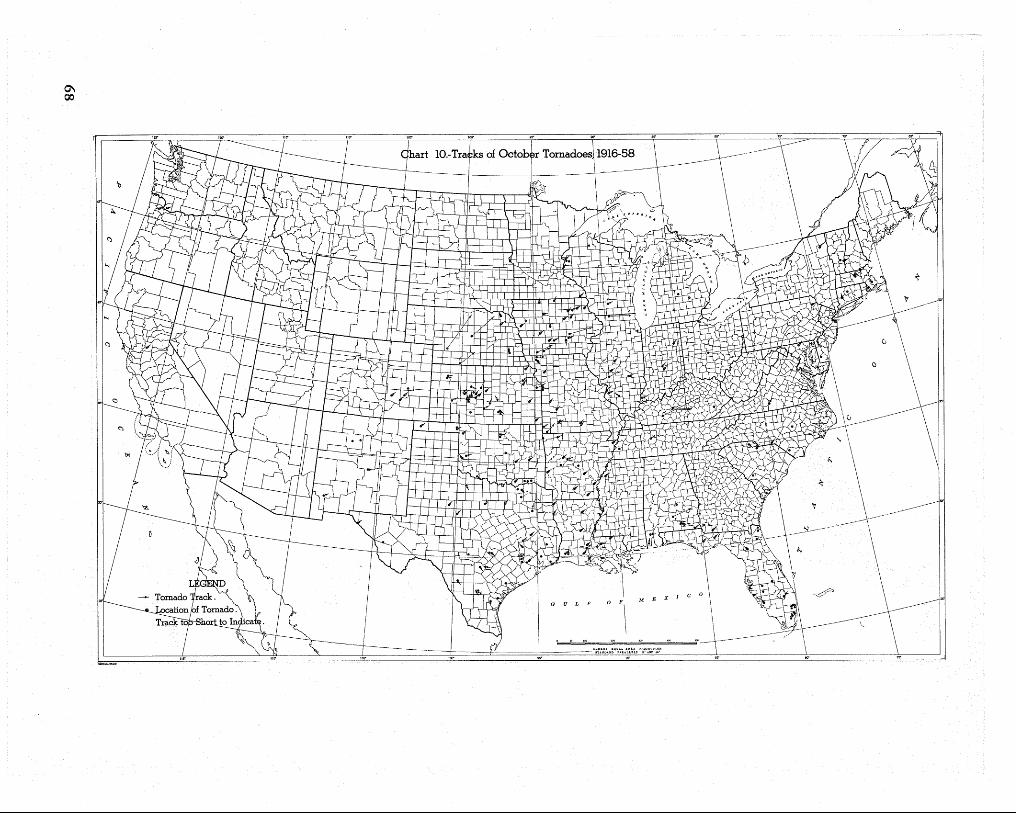
0\ 00
"t1
v
\)
,'·'\ I
\ ___________ ~j.,.,
-~--\ \
I I \ \ "-~ _'f:
\ ; . I
~b" . , , . 'I •• , , " • ~ ~ . \-~ ~~
I \ . ; - .. :~~~~~ . ~±-----· _j ..... ,. - ,. -------- "' ___ _

69

-......1 0
'b
G U L F M
ALBtll& £QUAl. ARC ... PROHC'I'ION ---•------ II'I'J.NOJ.IID I'ARU.t.t;U U"AXD U"
"' :,_ ... ··---\ \
~
---
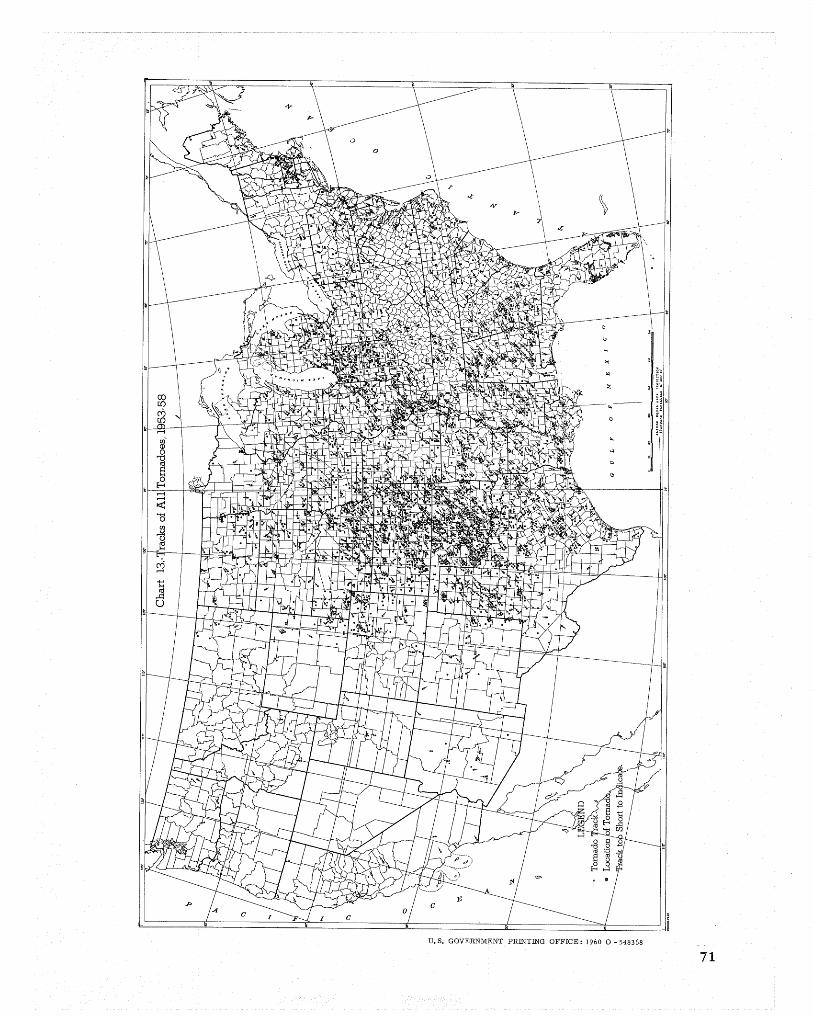
U.S. GOVERNMENT PRINTING OFFICE: 1960 0-548368
71