tornado climatology of finland - university of...
TRANSCRIPT

Tornado Climatology of Finland
JENNI RAUHALA
Finnish Meteorological Institute, Helsinki, Finland
HAROLD E. BROOKS
NOAA/National Severe Storms Laboratory, Norman, Oklahoma
DAVID M. SCHULTZ
Centre for Atmospheric Science, School for Earth, Atmospheric and Environmental Sciences, University of Manchester,
Manchester, United Kingdom, and Division of Atmospheric Science, Department of Physics, University of Helsinki,
and Finnish Meteorological Institute, Helsinki, Finland
(Manuscript received 31 July 2011, in final form 8 November 2011)
ABSTRACT
A tornado climatology for Finland is constructed from 1796 to 2007. The climatology consists of two
datasets. A historical dataset (1796–1996) is largely constructed from newspaper archives and other historical
archives and datasets, and a recent dataset (1997–2007) is largely constructed from eyewitness accounts sent
to the Finnish Meteorological Institute and news reports. This article describes the process of collecting and
evaluating possible tornado reports. Altogether, 298 Finnish tornado cases compose the climatology: 129 from
the historical dataset and 169 from the recent dataset. An annual average of 14 tornado cases occur in Finland
(1997–2007). A case with a significant tornado (F2 or stronger) occurs in our database on average every other
year, composing 14% of all tornado cases. All documented tornadoes in Finland have occurred between April
and November. As in the neighboring countries in northern Europe, July and August are the months with the
maximum frequency of tornado cases, coincident with the highest lightning occurrence both over land and
sea. Waterspouts tend to be favored later in the summer, peaking in August. The peak month for significant
tornadoes is August. The diurnal peak for tornado cases is 1700–1859 local time.
1. Introduction
As late as the mid-1990s, Finnish meteorologists gen-
erally assumed that severe convective storms or torna-
does did not occur in Finland and, if they occurred, they
were rare. Tornado reports were not collected, and no
research on severe convective storms was published
from the 1960s until recently. However, since 1997, severe
thunderstorms, and especially tornadoes, have received
a lot of media attention in Finland. Thus, Finnish mete-
orologists have started to appreciate the occurrence and
threat of severe weather. This appreciation has led to
several studies on severe weather in Finland: a climatol-
ogy of mesoscale convective systems (Punkka and Bister
2005), a case study of a severe thunderstorm outbreak
(Punkka et al. 2006), micrometeorological measure-
ments of a microburst (Jarvi et al. 2007), a severe hail
climatology (Tuovinen et al. 2009), and several case studies
of tornadoes (e.g., Teittinen et al. 2006; Teittinen and
Makela 2008; Outinen and Teittinen 2008; Rauhala and
Punkka 2008). Yet, no climatology of tornadoes exists
for Finland.
Historically, in Italy and France, scientific papers on
tornado cases were published by the seventeenth cen-
tury (Peterson 1982). The first research covering all of
Europe was Wegener (1917). Estonia, the southern neigh-
bor of Finland, has a long history in tornado research. Be-
tween the wars, tornado research was done by Johannes
Letzmann (Peterson 1992, 1995) and recently by Tooming
et al. (1995) and Tarand (1995). In Sweden, several case
studies have been performed (Peterson 1998).
More recently, European tornado climatologies have
been published for Ireland (Tyrrell 2003), the United
Corresponding author address: Jenni Rauhala, Finnish Meteo-
rological Institute, Erik Palmenin Aukio 1, P.O. Box 503, FI-00101,
Helsinki, Finland.
E-mail: [email protected]
1446 M O N T H L Y W E A T H E R R E V I E W VOLUME 140
DOI: 10.1175/MWR-D-11-00196.1
� 2012 American Meteorological Society

Kingdom (Elsom and Meaden 1982; Reynolds 1999;
Holden and Wright 2004), Lithuania (Marcinoniene 2003),
and the former Soviet Union (Peterson 2000). The
climatology of French tornadoes has been studied by
Dessens and Snow (1989, 1993) and Paul (2001). Tornado
statistics for Germany and Austria have been pub-
lished by Dotzek (2001) and Holzer (2001), respectively.
Climatologies for the Czech Republic by Setvak et al.
(2003) and for Hungary by Szilard (2007) have been
constructed. In southern Europe, tornado climatologies
have been documented in Greece (Sioutas 2003, 2011),
the Balearic Islands (Gaya et al. 2001), Spain (Gaya 2011),
Portugal (Leitao 2003), and Italy (Giaiotti et al. 2007).
Despite a long history of observing tornadoes, not all
European countries have a database of severe weather
reports. The European Severe Weather Database
(Brooks and Dotzek 2008; Dotzek et al. 2009) has im-
proved the collection of severe weather reports from
around Europe. Because many European national hydro-
meteorological services are actively developing their
severe thunderstorm forecast and warning services
(Rauhala and Schultz 2009), many countries have ac-
knowledged that understanding the local climatology is
important for forecasting.
The purpose of this article is to create a tornado clima-
tology for Finland. The definition of a tornado, methods
to collect reports, and the credibility evaluation process
are discussed in section 2. Sections 3–4 summarize the
geographical and intensity distributions of tornado cases,
and sections 5–6 summarize the monthly and diurnal dis-
tributions. Section 7 concludes this article.
2. Data
This section describes the development of the Finnish
tornado climatology. Because 10% of Finland is covered
by freshwater and because Finland has a relatively low
population density, we take care in defining the criteria
for tornadoes and waterspouts. Section 2a addresses this
issue. Then, having described our definition for a tor-
nado, the climatology is constructed in two steps. The
first step was to collect historical reports of tornadoes
from archived sources such as newspapers. The second
step was to collect recent reports of tornadoes in near–
real time through the Finnish Meteorological Institute
(FMI). Section 2b discusses the different methods em-
ployed to compile and evaluate tornado reports in these
two datasets. Finally, section 2c describes how the tor-
nado intensities are assessed.
a. Tornado definition and criteria
The Glossary of Meteorology (Glickman 2000) defines
a tornado as ‘‘a violently rotating column of air, in contact
with the ground, either pendant from a cumuliform cloud
or underneath a cumuliform cloud, and often (but not
always) visible as a funnel cloud.’’ Forbes and Wakimoto
(1983) suggested that a vortex would be classified as
a tornado if it were strong enough to cause at least F0
(Fujita 1981) damage. These definitions were adopted in
the United States where all tornadoes have been classi-
fied by the Fujita scale (F scale), even if there were no
damage. Since 2007, tornado intensity has been rated
in the United States with the Enhanced Fujita scale (EF
scale; Doswell et al. 2009). On the other hand, water-
spouts that do not hit land are not classified as torna-
does in the United States. This definition would be
a serious restriction for Finland, where almost 188 000
lakes cover the landscape. In this work, the following
tornado definition is used: A tornado is a vortex be-
tween a cloud and the land or water surface, in which the
connection between the cloud and surface is visible, or
the vortex is strong enough to cause at least F0 damage.
This definition allows all waterspouts to be included in
the definition of a tornado. This is consistent with the
Glossary of Meteorology (Glickman 2000) definition,
which defines a waterspout as ‘‘any tornado over a body
of water.’’ Also, tornadoes over land that do not cause
damage, but have a visible connection between ground
and the cloud base, are included.
In this article, we will also make use of the concept of
a tornado case. In one tornado case, there might be many
tornadoes. For example, several tornadoes might occur
near each other (e.g., within the same storm, along the
same boundary, etc.), but this would be classified as one
tornado case. This concept improves the database be-
cause, in several waterspout cases, for example, the
exact number, location, or timing of each individual
tornado is not known. Because waterspouts often occur
in groups of 5–20 single tornadoes, if each were recorded
as an individual event, the monthly, diurnal, intensity, and
geographical distribution of waterspouts would dominate
the database of all tornadoes.
On the other hand, if tornadoes are known to occur in
separate storms, or the starting points of the successive
tornadoes can be resolved, they are considered to be
separate cases. There is often not enough information to
split a report into several cases. Particularly in the his-
torical dataset, the path length would often suggest a
series of tornadoes, but the event is still recorded as
one case due to the lack of detailed information on
damage tracks. The problem of distinguishing between
long-track tornadoes and a series of short-track torna-
does is discussed by Doswell and Burgess (1988). The
starting point of the first tornado path in each event
characterizes the case on geographical maps. In several
instances, the same tornado moves over both water and
MAY 2012 R A U H A L A E T A L . 1447

land surfaces. If a tornado is first observed over land, it is
classified as a tornado over land. If it is first observed
over water, it is classified as a tornado over water. From
here on, ‘‘tornado over water’’ and ‘‘waterspout’’ will
be used interchangeably. A tornado day in this article is
defined as a day with at least one tornado case. A tor-
nado report is the original tornado observation (from
media, public, etc.); several tornado reports may exist
for each tornado case.
b. Collecting tornado reports
Because the methods of collection, evaluation, and
classification of tornado reports have changed over time,
the tornado climatology of Finland comprises two data-
sets. The historical dataset covers 1796–1996 when no
systematic tornado documentation was maintained at
FMI. The recent dataset covers 1997–2007 when FMI
has been actively collecting information on tornadoes
in Finland.
The tornado reports in the 1796–1996 historical dataset
were collected through five different approaches. First,
most of the reports in the historical dataset come from
old newspaper articles. The oldest articles were found
in the microfilm archives and digital collections of ma-
jor newspapers (Finlands Allmanna Tidning, Ilmarinen,
Keski-Suomi, Porin Kaupungin Sanomia, Sanomia Turusta,
Tapio, Vesta Nyland, Abo Tidningar, and Abo under-
rattelser) in the National Library of Finland. Second,
FMI’s archives contained an unsystematic collection
of weather-related newspaper clips and of FMI-related
articles from the 1990s. The more recent newspaper ar-
ticles were from Aamulehti, Borgabladet, Etela-Saimaa,
Etela-Suomi, Helsingin Sanomat, Iitinseutu, Ilta Sanomat,
Kainuun Sanomat, Kaleva, Karjalainen, Keskisuomalainen,
Kuorevesi-Mantta-Vilppula, Lapin Kansa, Maakansa,
Savon Sanomat, Suomenmaa, Suur-Keuruun Sanomat,
Syd-Osterbotten, Turun Sanomat, Uusi Aura, and Uusi
Suomi. Altogether, the archived and more recent news-
paper articles resulted in 98 tornado cases. Third, 17
tornado cases were obtained from the general public
during the 1970s and 1980s and were documented in
the forecasters’ notebook—an unsystematic collection
of reports of strange phenomena received from the
general public. Fourth, 12 cases, mainly from the 1930s,
come from published meteorological descriptions
(Keranen 1930; Simojoki 1931, 1935; Angervo 1949; Rossi
and Franssila 1960). Fifth, two tornado cases are from
Wegener’s (1917) book on European tornadoes. Be-
cause of the lack of detailed information on the tornado
cases, these historical data did not go through an ex-
tensive quality control and most of the reported tor-
nado cases were included in the statistics. Few cases
were rejected because the available information on the
event was too limited. This process resulted in 129 tor-
nado cases.
In the recent 1997–2007 dataset, most of the pre-
liminary reports were obtained from the general public.
The main source for these reports was through a tornado
observation report form placed on the FMI Web site
(http://www.fmi.fi) since 1998. In addition, preliminary
reports were received from the general public by phone
and by e-mail. Reports from news media were collected
also, including related newspaper articles and reporter
information. Data from different sources were gathered
into tornado cases and, in all except a few cases, eye-
witnesses were interviewed. Photos and videos of the
tornado and its damage were collected and, in some
cases, a damage survey was performed.
The credibility of a report was evaluated in the recent
1997–2007 dataset based on the observed information
available on the event. Each case was categorized as
confirmed, probable, or possible (Table 1). Similar defi-
nitions have been used in Canada to evaluate tornado
reports (Newark 1984). Only confirmed and probable
tornado cases were accepted into the recent dataset,
which has now become the official tornado dataset for
Finland. Radar pictures were also studied for the tornado
cases of the last 8 yr (2000–07). If there was no radar echo
during or after a reported tornado, and satellite pictures
did not show cloudiness, the case was not included in the
recent dataset. This process resulted in 169 tornado cases.
The historical dataset is undoubtedly incomplete, par-
ticularly the records of weak tornado cases, as indicated
by the change in number of tornado cases per decade
(Fig. 1a). Before the 1930s, there are only a few, if any,
known reports per decade. In the 1930s, 30 tornado cases
(10 of which had a F2 or greater tornado; Table 2) af-
fected Finland, causing two deaths, several injuries, and
vast material damage, which awoke the interest of me-
teorologists during that period. Both the attention paid
to tornadoes and the availability of documented reports
are reflected in the statistics with a larger number of
TABLE 1. Credibility categories of tornado reports. The report is
attributed to the highest class where any of the criteria are satisfied.
Category Criteria
Confirmed A photograph or videotape of a tornado
Damage survey indicates tornado damage
Probable Credible eyewitness observation of a tornado
Credible eyewitness report of typical tornado
damage
A photograph of a typical tornado damage
Possible No eyewitnesses
Cause of the damage is not confirmed by
the observations of an eyewitness
1448 M O N T H L Y W E A T H E R R E V I E W VOLUME 140

reports during the 1930s, 1990s, and 2000s. We hypoth-
esize that the movie Twister and an increase in television
documentaries on tornadoes led to an increased aware-
ness among the public about tornadoes in the late 1990s.
Both the increased awareness and the onset of active
collecting of tornado reports show in the statistics, as
during 1997–2007, a mean of 14 confirmed and proba-
ble tornado cases occurred each year, with a mean of
11 tornado days. The tornado database is likely to be
more consistent over time for the more intense torna-
does (e.g., Brooks and Doswell 2001; Verbout et al. 2006).
During 1930–2007, significant-tornado (F2 or stronger;
Hales 1988) cases occurred on average every second year,
but with a slight downward trend (Fig. 1b).
c. Estimating tornado intensity
The tornado intensity assessment is based on a dam-
age survey, photographs, or eyewitness description of
the damage. The estimate is based on the Fujita scale
(Fujita 1981) and guidance tables for assigning tornado
damage to buildings (Minor et al. 1977, their Table 4;
Bunting and Smith 1993, their appendix C). The esti-
mates were made by a single person (the first author), so
the data should not contain some of the inhomogeneities
discussed by Doswell and Burgess (1988), although sys-
tematic biases may occur. The information available on
events in the historical dataset is often so limited that
an accurate F-scale estimate cannot be assigned. In-
stead, for the historical dataset, the F-scale estimate is
the minimum intensity that could cause the described or
photographed damage. In this article, tornadoes without
damage are unrated on the Fujita scale. Only 22% of the
cases in the historical dataset were unrated, whereas
56% of the cases in the recent dataset were unrated.
There is uncertainty in estimating the intensity of
tornadoes using the F scale. Damage is not equivalent to
intensity because the damage depends, not only upon
the wind speed, but also upon the object receiving dam-
age (Doswell and Burgess 1988; Doswell 2007). Terrain,
building codes, debris, speed of the tornado, or rapidly
fluctuating winds can contribute to the damage and af-
fect the estimate of intensity. For example, tornadoes
without damage are often classified as weak, although
the true intensity could not be determined. Doswell and
Burgess (1988) argued that many tornadoes have inap-
propriate F ratings, perhaps by two categories or more.
On the other hand, the F scale is largely based on
damage to buildings, and the construction standards in
Finland, as well as Europe as a whole, may differ from
those in the United States (e.g., Feuerstein et al. 2011).
3. Geographical distribution
Tornado cases in our database are most frequent in
eastern and south-central Finland, as well as over the
southern and southwestern seawaters (Fig. 2a). The oc-
currence is lowest in Lapland in northern Finland and
in some inland areas of western Finland. The occurrence
of waterspout cases is high over the southern and south-
western seawaters, but also in the lakes of central Finland.
If each waterspout were recorded separately instead of
grouped into tornado cases, the frequency over the seas
would be much larger. The large number of lakes and
the large land area they cover helps to explain that 20%
of all tornado cases in this database spend part of their
time over land and part of their time over water.
The concentration of cases in eastern Finland is more
evident when only the significant tornado cases are con-
sidered (Fig. 2b). The annual probability of significant-
tornado cases was calculated during 1930–2007 because
significant tornadoes are less sensitive to changing re-
porting practice with time (e.g., Brooks and Doswell
2001; Verbout et al. 2006). The climatological probability
of at least one significant tornado within an 80 km 3
80 km area during a year in several areas in central-
southern and eastern-central Finland is 5%–7%. This
means that an F2 or stronger tornado occurs in the area
FIG. 1. (a) All and (b) significant tornado cases per decade in
Finland. The last decade includes only 2000–07.
MAY 2012 R A U H A L A E T A L . 1449

of maximum probability once every 14–20 yr. The belt
of highest risk extends from the coast of the Gulf of
Finland over central Finland to the Gulf of Bothnia.
The geographical distribution of tornado cases in
Finland is similar to the geographic distribution of
thunderstorm days (Fig. 2a, lightning data adapted from
Makela et al. 2011, their Fig. 2b), although cloud-to-
ground lightning flash rate itself is not a good indicator
of tornado occurrence (e.g., MacGorman et al. 1989;
Perez et al. 1997; Teittinen and Makela 2008). Indeed,
some tornadoes in Finland have been observed without
cloud-to-ground lightning (e.g., Rauhala and Punkka
2008). In southern Finland, where the yearly mean cloud-
to-ground flash density is low (Tuomi and Makela 2008;
Makela et al. 2011, their Fig. 1b), tornado cases and sig-
nificant tornado cases are relatively frequent. However,
cloud-to-ground flash density is only one measure of
the location of deep moist convection. Although the basic
conditions necessary for tornadoes and cloud-to-ground
lightning occurrence are not the same, both phenomena
require the existence of a convective cloud and a strong
updraft. Therefore, the geographical distribution of
TABLE 2. Significant (F2 and greater) tornado cases in Finland.
Date Time (LT) Location
Damage path
width (m)
Damage path
length (km) Intensity
No. of
fatalities
No. of
injuries
1 Jul 1838 1600–1700 Turku 25–35 F2
27 May 1930 1240–1250 Paltamo 3–4 F2
29 Jun 1931 1600–1800 Vehmersalmi 60 2 F2
4 Aug 1932 1500 Nurmijarvi 400–500 14 F3 1 1
4 Aug 1932 1530 Hausjarvi 100–150 39 F3
6 Aug 1932 1700 Rautavaara, Nurmes 100–150 7 F2
6 Aug 1932 1915 Kuopio 40–50 4 F2
11 Sep 1932 1700 Kannus 100 10 F2
12 Jul 1933 1400 Toholampi 2000 6 F3
11 Jul 1934 1125 Kiuruvesi 200 15 F4 1
11 Jul 1934 1330 Pulkkila 200 10 F3 1
9 Aug 1948 1200 Maaninka F2
1 Oct 1949 1615 Joutsa 100–150 F2
29 Jul 1954 1200 Hamina, Vehkalahti, Anjalankoski 20 F2
9 Jun 1956 Nilsia, Juankoski F2
27 Jul 1957 1800–1900 Imatra 2500–3000 10 F2 3
27 Jul 1957 2000–2100 Luhanka 25–30 F2
27 Jul 1957 Karvia F2
10 Jul 1958 1500 Polvijarvi F2
1 Aug 1961 Loviisa 250 F2
1 Aug 1961 Orimattila, Hollola, Lammi F2
29 Jun 1967 Evening Vierema 100 F2
26 Jul 1967 0830 Nurmo 1.5 F2
4 Aug 1967 Uusikaarlepyy 2000 7–8 F2
26 Aug 1967 1400 Kaavi 300 F2
7 Sep 1967 Evening Suomussalmi F2
8 Jul 1972 Evening Imatra, Joutseno, Puumala F2 1 l
12 Sep 1974 0900 Pyhtaa, Kotka 50 F2 1
15 Aug 1975 1750 Orimattila, Iitti, Kuusankoski 150 29 F2 1
30 Aug 1975 1035 Vantaa 50 1 F3
27 Jun 1976 1200 Leppavirta 500 2 F2
11 Aug 1985 1330 Liminka, Lumijoki 2000–3000 20 F2
7 Jul 1988 1350 Lieto 0.5 F2
22 Jul 1988 1630 Turku F2
3 Aug 1989 1800 Padasjoki 200 F2
28 Aug 1994 0600 Ylivieska 150 0.35 F3
15 Jun 1995 1730 Narpio F2
23 Jun 1997 1805 Lieksa 300 1.2 F2
12 Aug 1997 1800–1900 Kaustinen 150 1 F2
12 Jun 1998 1515–1540 Mikkeli 330 8.6 F2
15 Jul 2000 1800 Jamsankoski 50 15 F2
9 Aug 2001 1900 Rautavaara 150 1 F2
20 Aug 2004 1655–1720 Polvijarvi, Kontiolahti 20.2 F2
1450 M O N T H L Y W E A T H E R R E V I E W VOLUME 140
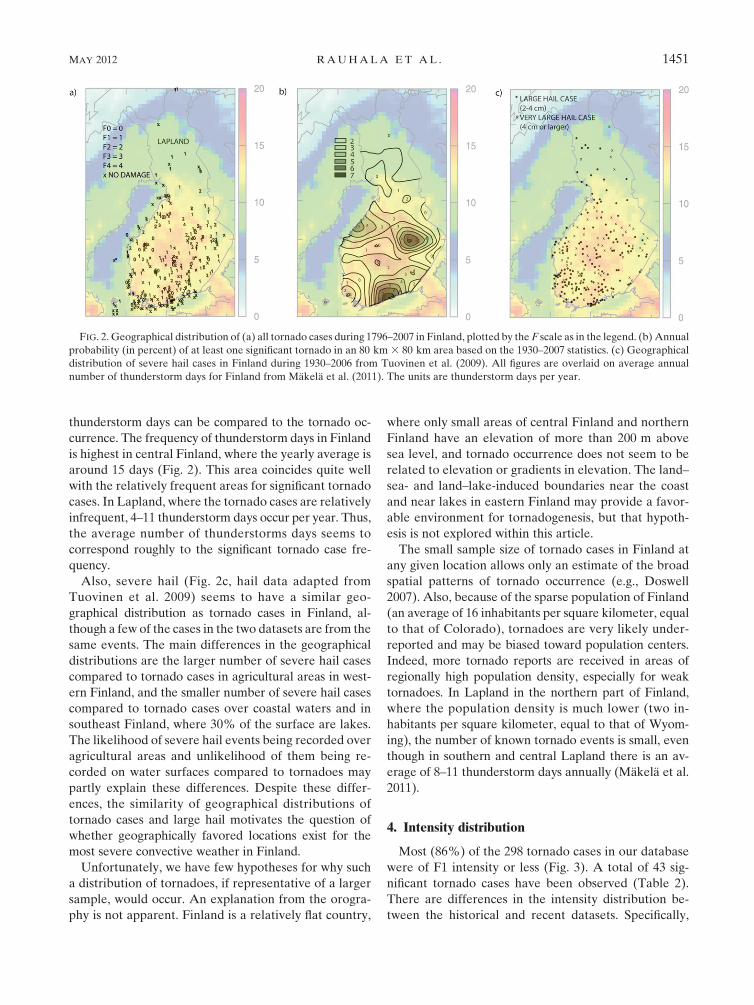
thunderstorm days can be compared to the tornado oc-
currence. The frequency of thunderstorm days in Finland
is highest in central Finland, where the yearly average is
around 15 days (Fig. 2). This area coincides quite well
with the relatively frequent areas for significant tornado
cases. In Lapland, where the tornado cases are relatively
infrequent, 4–11 thunderstorm days occur per year. Thus,
the average number of thunderstorms days seems to
correspond roughly to the significant tornado case fre-
quency.
Also, severe hail (Fig. 2c, hail data adapted from
Tuovinen et al. 2009) seems to have a similar geo-
graphical distribution as tornado cases in Finland, al-
though a few of the cases in the two datasets are from the
same events. The main differences in the geographical
distributions are the larger number of severe hail cases
compared to tornado cases in agricultural areas in west-
ern Finland, and the smaller number of severe hail cases
compared to tornado cases over coastal waters and in
southeast Finland, where 30% of the surface are lakes.
The likelihood of severe hail events being recorded over
agricultural areas and unlikelihood of them being re-
corded on water surfaces compared to tornadoes may
partly explain these differences. Despite these differ-
ences, the similarity of geographical distributions of
tornado cases and large hail motivates the question of
whether geographically favored locations exist for the
most severe convective weather in Finland.
Unfortunately, we have few hypotheses for why such
a distribution of tornadoes, if representative of a larger
sample, would occur. An explanation from the orogra-
phy is not apparent. Finland is a relatively flat country,
where only small areas of central Finland and northern
Finland have an elevation of more than 200 m above
sea level, and tornado occurrence does not seem to be
related to elevation or gradients in elevation. The land–
sea- and land–lake-induced boundaries near the coast
and near lakes in eastern Finland may provide a favor-
able environment for tornadogenesis, but that hypoth-
esis is not explored within this article.
The small sample size of tornado cases in Finland at
any given location allows only an estimate of the broad
spatial patterns of tornado occurrence (e.g., Doswell
2007). Also, because of the sparse population of Finland
(an average of 16 inhabitants per square kilometer, equal
to that of Colorado), tornadoes are very likely under-
reported and may be biased toward population centers.
Indeed, more tornado reports are received in areas of
regionally high population density, especially for weak
tornadoes. In Lapland in the northern part of Finland,
where the population density is much lower (two in-
habitants per square kilometer, equal to that of Wyom-
ing), the number of known tornado events is small, even
though in southern and central Lapland there is an av-
erage of 8–11 thunderstorm days annually (Makela et al.
2011).
4. Intensity distribution
Most (86%) of the 298 tornado cases in our database
were of F1 intensity or less (Fig. 3). A total of 43 sig-
nificant tornado cases have been observed (Table 2).
There are differences in the intensity distribution be-
tween the historical and recent datasets. Specifically,
FIG. 2. Geographical distribution of (a) all tornado cases during 1796–2007 in Finland, plotted by the F scale as in the legend. (b) Annual
probability (in percent) of at least one significant tornado in an 80 km 3 80 km area based on the 1930–2007 statistics. (c) Geographical
distribution of severe hail cases in Finland during 1930–2006 from Tuovinen et al. (2009). All figures are overlaid on average annual
number of thunderstorm days for Finland from Makela et al. (2011). The units are thunderstorm days per year.
MAY 2012 R A U H A L A E T A L . 1451

29% of the tornado cases from 1796–1996 were signifi-
cant tornado cases, but only 4% of the tornado cases
from 1997–2007 were significant. The smaller percent-
age of significant tornado cases in the recent dataset can
be explained by the more efficient collection of tornado
reports, especially for F1 and weaker tornadoes, similar
to that seen in the United States (Brooks and Doswell
2001; Verbout et al. 2006), and the fewer number of in-
tense tornado cases in the shorter 1997–2007 period
(Fig. 3). Because stronger tornadoes typically have larger
effects on society and influence larger areas (Brooks
2004), observations of the more intense tornadoes tend
to be less sensitive to variations in reporting practice over
time (e.g., Verbout et al. 2006), explaining the large
proportion of significant tornado cases in the historical
dataset.
There have been only six F3 cases, one F4, and no F5s
recorded in our database. The F4 tornado occurred on
11 July 1934 at Kiuruvesi in central Finland. By compar-
ison, F4 tornadoes have been observed in several other
European countries: Estonia (Tooming 2002), Germany
(Dotzek 2001), and the Czech Republic (Setvak et al.
2003). In France, a few F5 tornadoes have been ob-
served (Paul 2001). As in Finland (Fig. 3), a relatively
small number of tornadoes in these countries are strong.
The decline with intensity is similar to that seen in
Brooks and Doswell (2001) and Dotzek et al. (2003).
When greater attention is put into collecting reports
or there is greater public awareness of tornadoes, as in
Ireland (Tyrrell 2003), the relationship is closer to being
log–linear. The impact of the onset of active collecting
of reports can be also seen in Finland, where the number
of weak tornado cases has increased in the recent da-
taset compared to the historical dataset (Fig. 3). This
underreporting of weaker tornadoes has been observed
in other countries (e.g., Germany, France, etc.).
In east-central Finland, the fraction of tornado cases
that were significant was higher than elsewhere in
Finland. In Lapland and in large parts in western Finland,
significant tornadoes have not been observed. However,
because the F-scale rating depends on the damage the
tornado causes, tornadoes in rural areas may be un-
derrated (e.g., Doswell and Burgess 1988). Most tor-
nadoes and waterspouts occurring at the coast were F1
or weaker. If all waterspouts were recorded as single
events, the portion of nondamaging or weak tornado
cases would be higher, especially in the recent dataset.
5. Monthly distribution
Tornadoes have only been observed in Finland from
April to November, with almost three quarters of tor-
nado cases (73%) occurring during the warmest months
in July and August (Fig. 4a). In comparison, cloud-to-
ground lightning may occur in Finland from April to
November (Tuomi and Makela 2008), with the cloud-to-
ground flash rate the highest in continental Finland in
July and highest over the seas in July and August (Tuomi
and Makela 2007). The majority (94%) of severe hail
cases in Finland occur between June and August, with
July being the peak month (Tuovinen et al. 2009).
Based on the 1997–2007 statistics, the mean number of
tornado days by month is 1 in June, 5 in July, 4 in August,
and 1 in September. Days with at least three tornadoes
have been observed from July to October (Fig. 4b). For
all tornado cases that start on the land, the maximum is
in July (Fig. 4c). Of all tornado cases in July, more than
half (54%) are weak and start on land. The maximum for
significant tornadoes is in August when 17% of all ob-
served tornado cases are significant (Fig. 4d). Days with
at least two significant tornado cases have been observed
only in July and August.
Waterspout cases tend to occur toward late summer
compared to all tornado cases (Fig. 4c). Therefore, if
each waterspout were recorded as a single case instead
of grouping them into tornado cases, the monthly dis-
tribution of tornado cases in Finland would shift more
toward late summer and early autumn. The maximum
number of waterspout cases in our database occurs in
August when 53% of the tornado cases start over water,
although the maximum percentage of waterspout cases
occurs in October when 83% of the tornado cases start
over water. In July, the peak month in Finland for tor-
nado cases, only 36% of tornado cases are waterspouts.
There are only a few known waterspout cases in May,
June, October, and November. This is consistent with
the cold sea surface temperatures in the early summer
being less favorable for convection than the warmer
temperatures that occur in the late summer.
Some minor differences in the monthly distribution
between different geographical locations can be found
FIG. 3. Number of tornado cases both in historical (1796–1996) and
more recent (1997–2007) datasets by the F scale.
1452 M O N T H L Y W E A T H E R R E V I E W VOLUME 140

in our database, although the small sample size affects
the credibility of the interpretation (e.g., Doswell 2007).
In western inland areas, tornado cases seem to occur
mostly in July and August; in the east, they occur during
the whole season. Most tornado cases offshore occur in
August or September, and only a few rare events are
known to occur in June.
As in Finland, tornadoes in neighboring Estonia
(Tarand 1995) and Sweden (Peterson 1998) occur most
frequently during July and August. In central European
countries, the peak occurs earlier in the summer: in
Germany and in Austria in July (Dotzek 2001; Holzer
2001) and in the Czech Republic and Hungary between
May and July (Setvak et al. 2003; Szilard 2007). In Med-
iterranean countries, the peak is in late summer or au-
tumn (e.g., Paul 2001; Gaya et al. 2001; Sioutas 2003, 2011;
Giaiotti et al. 2007; Gaya 2011). Fujita (1973) found that
July and August are the peak months for tornadoes from
northern Russia to Germany, France, and northern Italy,
whereas, in other parts of western and southern Europe,
the peak moves toward the autumn. In the United States,
the peak frequency for tornadoes is in May and June
(Verbout et al. 2006).
6. Diurnal distribution
The tornado cases that had sufficient information on
time of occurrence were placed in 2-h bins in local
standard time (LT); 0500–0659, 0700–0859 LT, etc. Most
of the tornado cases in our database occurred between
0900–2059 LT (Fig. 5a). There were only 10 tornado
cases at night (between 2100 and 0659 LT), and no cases
between 0100 and 0459 LT. The diurnal distribution of
waterspout cases was more evenly spread throughout
the day than tornado cases over land (Fig. 5b). Most
(69%) of the tornado cases over land occurred in the
late afternoon and evening, between 1500 and 2059 LT,
with a peak at 1700–1859 LT, whereas waterspout cases
peaked at noon (Fig. 5b). If single waterspouts were
recorded separately instead of grouping them into
tornado cases, the diurnal maximum of tornadoes in
Finland would have two peaks, one before noon and
one in the afternoon.
The afternoon maximum in tornado cases is consistent
with the diurnal cycle of thunderstorms in Finland, al-
though the diurnal maximum in cloud-to-ground flash
rate in mainland Finland typically peaks around 1500–
1659 LT (Tuomi and Makela 2008), two hours before
the maximum of tornado cases. In comparison, large hail
(2–3.9 cm in diameter) is most frequent between 1400
and 1800 LT and very large hail (4 cm or larger) between
1600 and 2000 LT (Tuovinen et al. 2009). Tuovinen et al.
(2009) speculated this shift to be related to delayed ini-
tiation of convection in slightly capped environments,
which favor the most intense updrafts. We speculate
that capping inversions may occur in some of the tornado
situations in Finland, which would explain the later max-
imum of tornado cases compared to the cloud-to-ground
flash-rate maximum. Similar diurnal distributions of tor-
nadoes as in Finland occur in France (Dessens and Snow
FIG. 4. (a) Monthly distribution of all tornado cases in Finland in 1796–2007. (b) Distribution of days with at least
three tornado cases. (c) Distribution of tornado cases over land and water surface. (d) Monthly distribution of
significant (F21) tornado cases.
MAY 2012 R A U H A L A E T A L . 1453

1989), the United States (Kelly et al. 1978), and Germany
(Dotzek 2001), for example.
The observed diurnal cycle of waterspout cases in
Finland with a noon peak is similar to that observed by
Dotzek et al. (2010) with waterspouts near the German
coast at the North Sea and Baltic Sea. Distributions
with three maxima—two higher peaks near noon and in
the late afternoon, and a lower peak in morning—have
been observed by Golden (1973) with waterspouts in
the Lower Florida Keys and by Sioutas (2011) in Greece
(both tornadoes and waterspouts). A possible explana-
tion for the more evenly spread diurnal distribution of
tornado cases over water compared to tornado cases
over land is that the warm water surface may be a fa-
vorable location for the development of convection at
any time of the day or night. Accordingly, the cloud-to-
ground flash rate over the sea is somewhat more evenly
distributed throughout the day than over land areas,
but there is still a distinct afternoon maximum and minor
morning maximum (Tuomi and Makela 2008). Although
the diurnal cycle of thunderstorms over water likely has
a large influence on waterspout occurrence, the lack of
tornado reports at night may also be because of darkness
(in the late summer) or the smaller number of people
outdoors.
7. Conclusions
This study summarizes the tornado climatology of
Finland derived from 298 observed tornado cases during
1796–2007. The reports are collected and evaluated, re-
sulting in two datasets: a historical dataset from 1796–
1996 with 129 cases and a recent dataset from 1997–2007
with 169 cases. The number of tornado cases in our da-
tabase is highest from the area extending from southern
and southwestern seawaters to eastern Finland. The re-
gion of highest frequency of significant tornado cases
extends from the Gulf of Finland to the Gulf of Bothnia.
The geographical distribution of weak tornado cases shows
higher concentrations of reports near densely populated
areas, suggesting population bias and underreporting of
weak tornadoes in sparsely populated areas.
Likely underreporting of weak tornadoes can also be
seen in the historical dataset when comparing the in-
tensity distribution of the historical and recent datasets.
Whereas in the historical dataset, 29% of tornado cases
were significant, in the recent dataset only 4% were sig-
nificant. In the recent dataset, the large number of weak
tornado cases is the result of an efficient collection of
reports, whereas significant tornadoes are more likely
to be independent of the efforts put into collecting re-
ports. Altogether, 14% (43 cases) of all recorded tornado
cases in Finland are significant. The strongest docu-
mented tornado is of F4 intensity.
In our database, an average of 14 tornado cases occurs
every year in Finland from April to November. Coin-
cident with the highest lightning occurrence both over
land and sea, the peak months for tornado cases are July
and August. August is the peak month for both water-
spout cases (53% of all August tornado cases) and sig-
nificant tornado cases (17%), whereas typically (52%)
July tornado cases are weak tornado cases over land.
Most tornado cases over land occur between 1500 and
2059 LT, whereas tornado cases over water tend to occur
more equally throughout the day.
Acknowledgments. We thank Sylvain Joffre (Finnish
Meteorological Institute) for his comments on an earlier
version of the manuscript and Pentti Pirinen (Finnish
Meteorological Institute) for providing data for Fig. 2b.
Partial funding for Schultz comes from Vaisala Oyj and
Grant 126853 from the Academy of Finland.
REFERENCES
Angervo, J. M., 1949: Pyorremyrskyt lokakuun 1. P:na 1949 (Tor-
nadoes on 1st October 1949.) IK, kuukausikatsaus, 43 (10), p. 4.
Brooks, H. E., 2004: On the relationship of tornado path length and
width to intensity. Wea. Forecasting, 19, 310–319.
FIG. 5. Diurnal distribution of (a) all tornado cases and signifi-
cant tornado cases and (b) tornado cases over water and land
surface in Finland. One column indicates a 2-h period 0500–0659,
0700–0859 LT, etc. There are no tornado cases recorded between
0100 and 0459 LT.
1454 M O N T H L Y W E A T H E R R E V I E W VOLUME 140

——, and C. A. Doswell III, 2001: Some aspects of the international
climatology of tornadoes by damage classification. Atmos.
Res., 56, 191–201.
——, and N. Dotzek, 2008: The spatial distribution of severe con-
vective storms and an analysis of their secular changes. Cli-
mate Extremes and Society, H. F. Diaz and R. Murnane, Eds.,
Cambridge University Press, 35–53.
Bunting, W. F., and B. E. Smith, 1993: A guide for conducting
convective windstorm surveys. NOAA Tech. Memo. NWS
SR146, Scientific Services Division, Southern Region, Fort
Worth, TX, 44 pp.
Dessens, J., and J. T. Snow, 1989: Tornadoes in France. Wea.
Forecasting, 4, 110–132.
——, and ——, 1993: Comparative description of tornadoes in
France and the United States. The Tornado: Its Structure, Dy-
namics, Prediction and Hazards, Geophys. Monogr., Vol. 79,
Amer. Geophys. Union, 427–434.
Doswell, C. A., III, 2007: Small sample size and data quality issues
illustrated using tornado occurrence data. Electron. J. Severe
Storms Meteor., 2 (5), 1–16.
——, and D. W. Burgess, 1988: On some issues of U.S. tornado
climatology. Mon. Wea. Rev., 116, 495–501.
——, H. E. Brooks, and N. Dotzek, 2009: On the implementation
of the enhanced Fujita scale in the USA. Atmos. Res., 93, 554–
563.
Dotzek, N., 2001: Tornadoes in Germany. Atmos. Res., 56, 233–
251.
——, J. Grieser, and H. E. Brooks, 2003: Statistical modeling of
tornado intensity distributions. Atmos. Res., 67, 163–187.
——, P. Groenemeijer, B. Feuerstein, and A. M. Holzer, 2009:
Overview of ESSL’s severe convective storms research using
the European Severe Weather Database ESWD. Atmos. Res.,
93, 575–586.
——, S. Emeis, C. Lefebvre, and J. Gerpott, 2010: Waterspouts
over the North and Baltic Seas: Observations and climatology,
predictability and reporting. Meteor. Z., 19, 115–129.
Elsom, D. M., and G. T. Meaden, 1982: Tornadoes in the United
Kingdom. Preprints, 12th Conf. on Severe Local Storms, San
Antonio, TX, Amer. Meteor. Soc., 55–58.
Feuerstein, B., P. Groenemeijer, E. Dirksen, M. Hubrig, A. M.
Holzer, and N. Dotzek, 2011: Towards an improved wind
speed scale and damage description adapted for central
Europe. Atmos. Res., 100, 547–564.
Forbes, G. S., and R. M. Wakimoto, 1983: A concentrated outbreak
of tornadoes, downbursts and microbursts, and implications
regarding vortex classification. Mon. Wea. Rev., 111, 220–236.
Fujita, T. T., 1973: Tornadoes around the world. Weatherwise, 26,
56–62.
——, 1981: Tornadoes and downbursts in the context of general-
ized planetary scales. J. Atmos. Sci., 38, 1511–1534.
Gaya, M., 2011: Tornadoes and severe storms in Spain. Atmos.
Res., 100, 334–343.
——, V. Homar, R. Romero, and C. Ramis, 2001: Tornadoes and
waterspouts in the Balearic Islands: Phenomena and environ-
ment characterization. Atmos. Res., 56, 253–267.
Giaiotti, D. B., A. Pucillo, and F. Stel, 2007: The climatology of
tornadoes and waterspouts in Italy. Atmos. Res., 83, 534–541.
Glickman, T. S., Ed., 2000: Glossary of Meteorology. 2nd ed. Amer.
Meteor. Soc., 855 pp.
Golden, J. H., 1973: Some statistical aspects of waterspout forma-
tion. Weatherwise, 26, 108–117.
Hales, J. E., Jr., 1988: Improving the watch/warning program
through use of significant event data. Preprints, 15th Conf. on
Severe Local Storms, Baltimore, MD, Amer. Meteor. Soc.,
165–168.
Holden, J., and A. Wright, 2004: UK tornado climatology and the
development of simple prediction tools. Quart. J. Roy. Meteor.
Soc., 130, 1009–1021.
Holzer, A. M., 2001: Tornado climatology of Austria. Atmos. Res.,
56, 203–211.
Jarvi, L., and Coauthors, 2007: Micrometeorological observations
of a microburst in southern Finland. Bound.-Layer Meteor.,
125, 343–359.
Kelly, D. L., J. T. Schaefer, R. P. McNulty, and C. A. Doswell III,
1978: An augmented tornado climatology. Mon. Wea. Rev.,
106, 1172–1183.
Keranen, J., 1930: Voimakas pyorremyrsky Paltamon Mieslahdella
toukok. 27. P:na 1930 (A strong tornado at Mieslahti in Pal-
tamo on 27th May 1930.) IK, kuukausikatsaus, 24 (11), p. 4.
Leitao, P., 2003: Tornadoes in Portugal. Atmos. Res., 67–68, 381–
390.
MacGorman, D. R., D. W. Burgess, V. Mazur, W. D. Rust, W. L.
Taylor, and B. C. Johnson, 1989: Lightning rates relative to
tornadic storm evolution on 22 May 1981. J. Atmos. Sci., 46,
221–251.
Makela, A., P. Rossi, and D. M. Schultz, 2011: The daily cloud-to-
ground lightning flash density in the contiguous United States
and Finland. Mon. Wea. Rev., 139, 1323–1337.
Marcinoniene, I., 2003: Tornadoes in Lithuania in the period of
1950–2002 including analysis of the strongest tornado of 29
May 1981. Atmos. Res., 67–68, 475–484.
Minor, J. E., J. R. McDonald, and K. C. Mehta, 1977: The tornado:
An engineering-oriented perspective. NOAA Tech. Memo.
ERL NSSL-82, National Weather Service, Norman, OK,
196 pp.
Newark, M. J., 1984: Canadian tornadoes, 1950–1979. Atmos.–
Ocean, 22, 343–353.
Outinen, K., and J. Teittinen, 2008: Polarimetric radar observations
of a tornadic supercell in Finland. Proc. Fifth European Conf.
on Radar in Meteorology and Hydrology, Helsinki, Finland,
Finnish Meteorological Institute, P4.3. [Available online at
http://erad2008.fmi.fi/proceedings/extended/erad2008-0064-
extended.pdf.]
Paul, F., 2001: A developing inventory of tornadoes in France.
Atmos. Res., 56, 269–280.
Perez, A. H., L. J. Wicker, and R. E. Orville, 1997: Characteristics
of cloud-to-ground lightning associated with violent tornadoes.
Wea. Forecasting, 12, 428–437.
Peterson, R. E., 1982: Tornadic activity in Europe the last half-
century. Preprints, 12th Conf. on Severe Local Storms, San
Antonio, TX, Amer. Meteor. Soc., 63–66.
——, 1992: Letzmann and Koschmieder’s ‘‘Guidelines for research
on funnels, tornadoes, waterspouts and whirlwinds.’’ Bull.
Amer. Meteor. Soc., 73, 597–611.
——, 1995: Johannes Peter Letzmann: Pioneer tornado researcher.
Meteorology in Estonia in Johannes Letzmann’s Times and
Today, H. Eelsalu and H. Tooming, Eds., Estonian Academy
Publishers, 9–43.
——, 1998: Tornadoes in Sweden. Preprints, 19th Conf. on Severe
Local Storms, Minneapolis, MN, Amer. Meteor. Soc., 89–92.
——, 2000: Tornadoes of the former Soviet Union. Preprints, 20th
Conf. on Severe Local Storms, Orlando, FL, Amer. Meteor.
Soc., 138–141.
Punkka, A.-J., and M. Bister, 2005: Occurrence of summertime
convective precipitation and mesoscale convective systems in
Finland during 2000–01. Mon. Wea. Rev., 133, 362–373.
MAY 2012 R A U H A L A E T A L . 1455

——, J. Teittinen, and R. H. Johns, 2006: Synoptic and mesoscale
analysis of a high-latitude derecho–severe thunderstorm out-
break in Finland on 5 July 2002. Wea. Forecasting, 21, 752–763.
Rauhala, J., and A.-J. Punkka, 2008: Radar observations of a tor-
nadic severe frontal rainband. Preprints, 24th Conf. on Severe
Local Storms, Savannah, GA, Amer. Meteor. Soc., P9.6. [Avail-
able online at http://ams.confex.com/ams/24SLS/techprogram/
paper_142151.htm.]
——, and D. M. Schultz, 2009: Severe thunderstorm and tornado
warnings in Europe. Atmos. Res., 93, 369–380.
Reynolds, D. J., 1999: Revised UK tornado climatology, 1960–
1989. J. Meteor. UK, 24, 290–321.
Rossi, V., and M. Franssila, 1960: Ukkonen ja pyorremyrskyt
(Thunderstorm and tornadoes). Oma maa, 8, 54–65.
Setvak, M., M. Salek, and J. Munzar, 2003: Tornadoes within the
Czech Republic: From early medieval chronicles to the ‘‘in-
ternet society.’’ Atmos. Res., 67–68, 589–605.
Simojoki, H., 1931: Pyorremyrsky Wehmersalmella kesak. 29. p.
1931 (Tornado at Wehmersalmi on 29 June 1931). IK,
kuukausikatsaus, 25 (10), p. 4.
——, 1935: Die Tromben am 6. August 1932 im inneren Finnland
(Tornado on 6 August 1932 in central Finland). Ann. Acad.
Sci. Fenn., 44A, 1–26.
Sioutas, M. V., 2003: Tornadoes and waterspouts in Greece. Atmos.
Res., 67–68, 645–656.
——, 2011: A tornado and waterspout climatology for Greece.
Atmos. Res., 100, 344–356.
Szilard, S., 2007: A systematic approach to synoptic tornado cli-
matology of Hungary for the recent years (1996–2001) based
on official damage reports. Atmos. Res., 83, 263–271.
Tarand, A., 1995: How often do tornadoes occur in Estonia? Me-
teorology in Estonia in Johannes Letzmann’s Times and To-
day, H. Eelsalu and H. Tooming, Eds., Estonian Academy
Publishers, 132–138.
Teittinen, J., and A. Makela, 2008: Lightning and radar reflectivity
signatures in tornadic supercell thunderstorms in Finland.
Proc. Fifth European Conf. on Radar in Meteorology and Hy-
drology, Helsinki, Finland, Finnish Meteorological Institute,
4 pp. [Available online at http://erad2008.fmi.fi/proceedings/
extended/erad2008-0129-extended.pdf.]
——, H. Hohti, J. LaDue, and R. A. Brown, 2006: Analysis of
a tornadic mini-supercell in Finland by using Doppler radar.
Preprints, 23rd Conf. on Severe Local Storms, St. Louis, MO,
Amer. Meteor. Soc., P6.1. [Available online at ams.confex.
com/ams/pdfpapers/115430.pdf.]
Tooming, H., 2002: Strong tornadoes in Estonia. Extended Ab-
stracts, European Conf. on Severe Storms 2002, Prague, Czech
Republic, Czech Hydrometeorological Institute, p. 33.
——, H. Kotli, and R. E. Peterson, 1995: Vigorous tornadoes and
waterspouts during the last 35 years in Estonia. Meteorology in
Estonia in Johannes Letzmann’s Times and Today, H. Eelsalu
and H. Tooming, Eds., Estonian Academy Publishers, 168–
179.
Tuomi, T., and A. Makela, 2007: Lightning observations in Finland,
2007. Finnish Meteorological Institute, Rep. 2007:5, 49 pp.
——, and ——, 2008: Thunderstorm climate of Finland 1998–2007.
Geophysica, 44 (1–2), 67–80.
Tuovinen, J.-P., A.-J. Punkka, J. Rauhala, H. Hohti, and D. M.
Schultz, 2009: Climatology of severe hail in Finland: 1930–
2006. Mon. Wea. Rev., 137, 2238–2249.
Tyrrell, J., 2003: A tornado climatology for Ireland. Atmos. Res.,
67–68, 671–684.
Verbout, S. M., H. E. Brooks, L. M. Leslie, and D. M. Schultz, 2006:
Evolution of the U.S. tornado database: 1954–2004. Wea.
Forecasting, 21, 86–93.
Wegener, A., 1917: Wind- und Wasserhosen in Europa (Torna-
does and Waterspouts in Europe.) Fredr. Vieweg & Sohn,
301 pp.
1456 M O N T H L Y W E A T H E R R E V I E W VOLUME 140