topology and seasonal evolution of the network of extreme
TRANSCRIPT
Nonlin. Processes Geophys., 21, 901–917, 2014www.nonlin-processes-geophys.net/21/901/2014/doi:10.5194/npg-21-901-2014© Author(s) 2014. CC Attribution 3.0 License.
Topology and seasonal evolution of the network of extremeprecipitation over the Indian subcontinent and Sri LankaV. Stolbova1,2, P. Martin3, B. Bookhagen4,5, N. Marwan1, and J. Kurths1,2,61PIK Potsdam Institute of Climate Impact Research, P.O. Box 601203, 14412 Potsdam, Germany2Department of Physics, Humboldt-Universität zu Berlin, Newtonstr. 15, 12489 Berlin, Germany3University of Michigan, Ann Arbor, Michigan, USA4Department of Geography, University of California, Santa Barbara, USA5University of Potsdam, Institute of Earth and Environmental Science, Karl-Liebknecht-Str. 24–25,14476 Potsdam-Golm, Germany6Institute for Complex Systems and Mathematical Biology, University of Aberdeen, Aberdeen, AB243UE, UK
Correspondence to: V. Stolbova ([email protected])
Received: 17 November 2013 – Revised: 17 July 2014 – Accepted: 21 July 2014 – Published: 29 August 2014
Abstract. This paper employs a complex network approachto determine the topology and evolution of the network of ex-treme precipitation that governs the organization of extremerainfall before, during, and after the Indian Summer Mon-soon (ISM) season. We construct networks of extreme rain-fall events during the ISM (June–September), post-monsoon(October–December), and pre-monsoon (March–May) peri-ods from satellite-derived (Tropical Rainfall MeasurementMission, TRMM) and rain-gauge interpolated (Asian Pre-cipitation Highly Resolved Observational Data IntegrationTowards the Evaluation of Water Resources, APHRODITE)data sets. The structure of the networks is determined bythe level of synchronization of extreme rainfall events be-tween different grid cells throughout the Indian subconti-nent. Through the analysis of various complex-network met-rics, we describe typical repetitive patterns in North Pakistan(NP), the Eastern Ghats (EG), and the Tibetan Plateau (TP).These patterns appear during the pre-monsoon season, evolveduring the ISM, and disappear during the post-monsoon sea-son. These are important meteorological features that needfurther attention and that may be useful in ISM timing andstrength prediction.
1 Introduction
The Indian monsoon is a large-scale atmospheric pattern andone of the active components in the global climate systemin the tropics. It is an important weather phenomenon forother parts of the globe as well, because of the monsoon’scoupling with climate drivers such as the El Niño–SouthernOscillation, the Indian Ocean Dipole and the Equatorial In-dian Ocean Oscillation (Sankar et al., 2011; Achuthavarieret al., 2012; Sabeerali et al., 2011; Wu and Kirtman, 2003;Wu et al., 2012; Gadgil, 2004). Understanding the structureof the spatial heterogeneity of extreme rainfall during theISM plays a crucial role in the daily life and prosperity ofthe Indian population. Spatial rainfall distribution and espe-cially the distribution of extreme rainfall events is a signifi-cant question for Indian agriculture and economy, as extremerainfall is a common cause of floods on the Indian subconti-nent. It is therefore essential to track the origins and dynam-ics of the extreme events. In this study, we find such originsin the topology of networks of extreme rainfall events duringthe ISM, and the periods before and after the monsoon.
1.1 ISM, pre-monsoon and post-monsoon seasons of theIndian subcontinent
Changes in precipitation over the Indian subcontinent duringthe year can be divided into three phases: the pre-monsoonseason (March–May), the main rainy season (the Indian
Published by Copernicus Publications on behalf of the EuropeanGeosciences Union& the AmericanGeophysical Union.
902 V. Stolbova et al.: Network of extreme precipitation over the Indian subcontinent
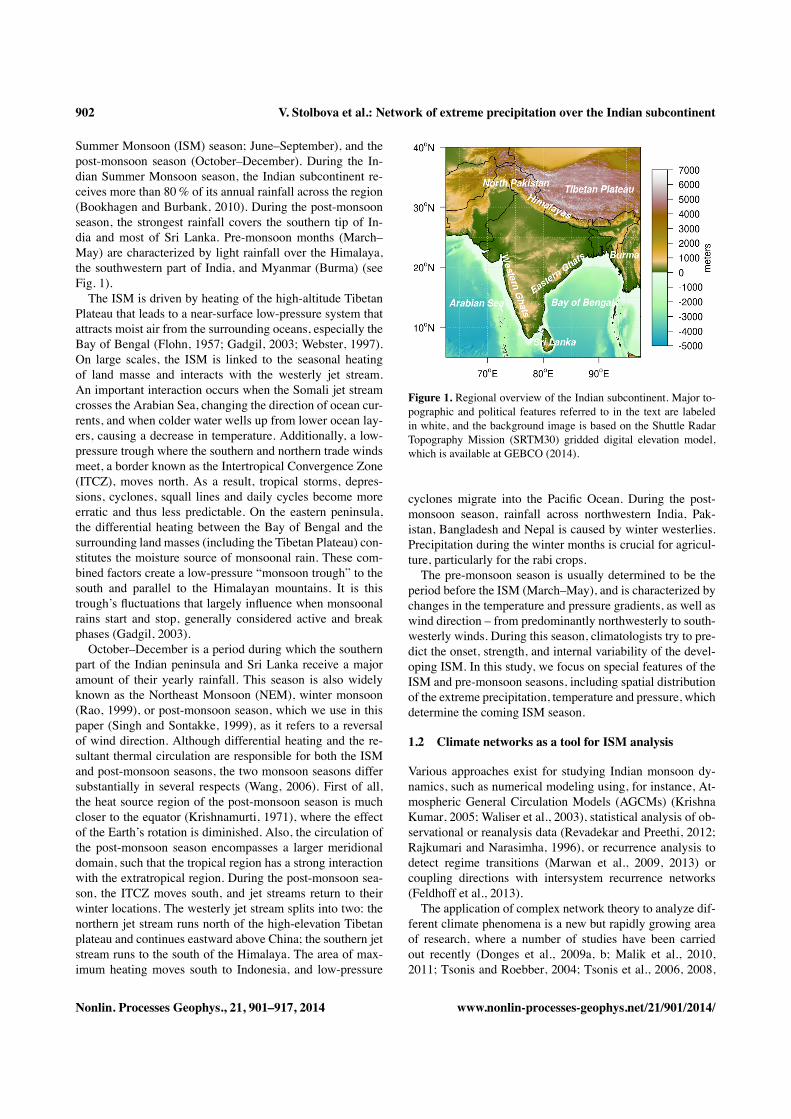
Summer Monsoon (ISM) season; June–September), and thepost-monsoon season (October–December). During the In-dian Summer Monsoon season, the Indian subcontinent re-ceives more than 80% of its annual rainfall across the region(Bookhagen and Burbank, 2010). During the post-monsoonseason, the strongest rainfall covers the southern tip of In-dia and most of Sri Lanka. Pre-monsoon months (March–May) are characterized by light rainfall over the Himalaya,the southwestern part of India, and Myanmar (Burma) (seeFig. 1).The ISM is driven by heating of the high-altitude Tibetan
Plateau that leads to a near-surface low-pressure system thatattracts moist air from the surrounding oceans, especially theBay of Bengal (Flohn, 1957; Gadgil, 2003; Webster, 1997).On large scales, the ISM is linked to the seasonal heatingof land masse and interacts with the westerly jet stream.An important interaction occurs when the Somali jet streamcrosses the Arabian Sea, changing the direction of ocean cur-rents, and when colder water wells up from lower ocean lay-ers, causing a decrease in temperature. Additionally, a low-pressure trough where the southern and northern trade windsmeet, a border known as the Intertropical Convergence Zone(ITCZ), moves north. As a result, tropical storms, depres-sions, cyclones, squall lines and daily cycles become moreerratic and thus less predictable. On the eastern peninsula,the differential heating between the Bay of Bengal and thesurrounding land masses (including the Tibetan Plateau) con-stitutes the moisture source of monsoonal rain. These com-bined factors create a low-pressure “monsoon trough” to thesouth and parallel to the Himalayan mountains. It is thistrough’s fluctuations that largely influence when monsoonalrains start and stop, generally considered active and breakphases (Gadgil, 2003).October–December is a period during which the southern
part of the Indian peninsula and Sri Lanka receive a majoramount of their yearly rainfall. This season is also widelyknown as the Northeast Monsoon (NEM), winter monsoon(Rao, 1999), or post-monsoon season, which we use in thispaper (Singh and Sontakke, 1999), as it refers to a reversalof wind direction. Although differential heating and the re-sultant thermal circulation are responsible for both the ISMand post-monsoon seasons, the two monsoon seasons differsubstantially in several respects (Wang, 2006). First of all,the heat source region of the post-monsoon season is muchcloser to the equator (Krishnamurti, 1971), where the effectof the Earth’s rotation is diminished. Also, the circulation ofthe post-monsoon season encompasses a larger meridionaldomain, such that the tropical region has a strong interactionwith the extratropical region. During the post-monsoon sea-son, the ITCZ moves south, and jet streams return to theirwinter locations. The westerly jet stream splits into two: thenorthern jet stream runs north of the high-elevation Tibetanplateau and continues eastward above China; the southern jetstream runs to the south of the Himalaya. The area of max-imum heating moves south to Indonesia, and low-pressure
Figure 1. Regional overview of the Indian subcontinent. Major to-pographic and political features referred to in the text are labeledin white, and the background image is based on the Shuttle RadarTopography Mission (SRTM30) gridded digital elevation model,which is available at GEBCO (2014).
cyclones migrate into the Pacific Ocean. During the post-monsoon season, rainfall across northwestern India, Pak-istan, Bangladesh and Nepal is caused by winter westerlies.Precipitation during the winter months is crucial for agricul-ture, particularly for the rabi crops.The pre-monsoon season is usually determined to be the
period before the ISM (March–May), and is characterized bychanges in the temperature and pressure gradients, as well aswind direction – from predominantly northwesterly to south-westerly winds. During this season, climatologists try to pre-dict the onset, strength, and internal variability of the devel-oping ISM. In this study, we focus on special features of theISM and pre-monsoon seasons, including spatial distributionof the extreme precipitation, temperature and pressure, whichdetermine the coming ISM season.
1.2 Climate networks as a tool for ISM analysis
Various approaches exist for studying Indian monsoon dy-namics, such as numerical modeling using, for instance, At-mospheric General Circulation Models (AGCMs) (KrishnaKumar, 2005; Waliser et al., 2003), statistical analysis of ob-servational or reanalysis data (Revadekar and Preethi, 2012;Rajkumari and Narasimha, 1996), or recurrence analysis todetect regime transitions (Marwan et al., 2009, 2013) orcoupling directions with intersystem recurrence networks(Feldhoff et al., 2013).The application of complex network theory to analyze dif-
ferent climate phenomena is a new but rapidly growing areaof research, where a number of studies have been carriedout recently (Donges et al., 2009a, b; Malik et al., 2010,2011; Tsonis and Roebber, 2004; Tsonis et al., 2006, 2008,
Nonlin. Processes Geophys., 21, 901–917, 2014 www.nonlin-processes-geophys.net/21/901/2014/
V. Stolbova et al.: Network of extreme precipitation over the Indian subcontinent 903
Table 1. Properties of the data sets. APHRODITE: interpolated rain-gauge data (Yatagai et al., 2009). TRMM 3B42V7: satellite-derived data(Huffman et al., 2007). NCEP/NCAR: reanalysis data (Kalnay et al., 1996).
Properties APHRODITE TRMM NCEP/NCAR
Period Jan 1951–Dec 2007 Jan 1998–Dec 2012 Jan 1949–Dec 2012Geographical coverage (62.5–97.5� E, 5–40� N) (62.375–97.125� E, 5.125–39.875� N) (62.5–97.5� E, 5–40� N)Spatial resolution 0.5� ⇥ 0.5� 0.25� ⇥ 0.25� 2.5� ⇥ 2.5�Temporal resolution Daily precipitation 3 hourly, resampled to daily precipitation Daily temperature and pressure anomalies,
seasonal mean of windsNumber of grid points 4900 19 600 196
2010; Gozolchiani et al., 2008, 2011; Yamasaki et al., 2009;Paluš et al., 2011; Barreiro et al., 2011; Deza et al., 2013,2014; Martin et al., 2013; Tirabassi and Masoller, 2013).While most of these studies are focused on global climatenetworks of temperature fields and precipitation (Dongeset al., 2009a, b; Tsonis and Roebber, 2004; Tsonis et al.,2006; Gozolchiani et al., 2011; Yamasaki et al., 2008, 2009;Scarsoglio et al., 2013), others consider smaller, regional net-works that focus on a specific climate phenomenon of inter-est, such as El Niño (Tsonis and Swanson, 2008; Gozolchianiet al., 2008), Rossby waves (Wang et al., 2013), continentalrainfall in Germany (Rheinwalt et al., 2012), the South Amer-ican Monsoon System (SAMS) (Boers et al., 2013), and theIndian Summer Monsoon (Malik et al., 2010, 2011; Rehfeldet al., 2012). In the work by Rehfeld et al. (2012) on IndianSummer Monsoon (ISM) dynamics, a paleoclimate networkapproach has revealed a strong influence of the ISM on theEast Asian Summer monsoon during the late Holocene pe-riod, but with varying strength according to the warm vs. coldepochs. In Malik et al. (2010, 2011), it was demonstrated thatby combining the climate network approach with the eventsynchronization method, it is possible to identify regions thatreceive rainfall only during the most active phase of the In-dian Summer Monsoon. Also, identification of the structureand organization, and in particular the spatial discontinuity ofthe rain field, was shown, and a predictability scheme for thesynchronization of extreme rainfall was introduced. Thesestudies were based on data sets covering only the land areaand only for the Indian political boundaries. Since the timethat these studies were published, new high-quality data setshave become available for larger regions, including rainfallover the ocean, which we employ in this work.The question of the spatial structure and organization of
present-day extreme rainfall during the pre-monsoon andpost-monsoon periods, however, remains open. Additionally,the spatial scale and teleconnections of regions that receiveextreme rainfall causing floods over the Indian subcontinentand Sri Lanka during the pre-monsoon, monsoon, and post-monsoon seasons have not yet been revealed. In this paper,we aim to explore the seasonal evolution of the synchroniza-tion of extreme rainfall events over the Indian subcontinentand Sri Lanka. In order to address this aim, we first constructand analyze climate networks of extreme rainfall during three
seasons: pre-monsoon, ISM, and post-monsoon. Second, wereveal the dominant patterns of synchronized extreme rain-fall events over the Indian subcontinent, which occur beforethe monsoon, develop during the monsoon season, and dis-appear after the monsoon. Third, we compare dominant pat-terns with wind fields to establish a linkage to atmosphericprocesses.
2 Data and methods
2.1 Data
We use observational satellite data from 1998 to 2012 fromthe Tropical Rainfall Measuring Mission (TRMM 3B42V7)(Huffman et al., 2007; TRMM, 2014), with a spatial reso-lution of 0.25� ⇠ 25 km and a temporal resolution of 3 h ag-gregated to daily data. We have extracted data for the SouthAsian region (62.375–97.125� E, 5.125–39.875� N; see Ta-ble 1 and Fig. 1). This data set is the most recent precipi-tation data product available. It has a high spatial resolutionand covers both land and sea. By the time of this study, how-ever, there are only 15 years of data.To confirm the significance of the results of this study,
we analyze reanalysis gridded daily rainfall data for a timeperiod of 57 years (1951–2007) (Asian Precipitation HighlyResolved Observational Data Integration Towards the Eval-uation of Water Resources, APHRODITE) (Yatagai et al.,2009). This data set forms a reliable reanalysis product;however, it is given only for the land masses, excludingthe ocean. We have extracted the data for the same region(62.5–97.5� E, 5–40� N) with a resolution of 0.5� ⇠ 56 km(APHRO-V1003R1) (see Table 1). This data set was usedpreviously in Malik et al. (2010, 2011) to study the spa-tial variability of the extreme Indian rainfall during the ISMperiod using the method of Event Synchronization (ES). Inthis study, we compare results with previous findings for theISM season and determine geographic patterns of extremeprecipitation over the Indian subcontinent during the pre-monsoon, monsoon, and post-monsoon seasons. We com-pare geographic patterns based on precipitation data setswith patterns of temperature and pressure networks derivedfrom reanalysis gridded daily data provided by the National
www.nonlin-processes-geophys.net/21/901/2014/ Nonlin. Processes Geophys., 21, 901–917, 2014
904 V. Stolbova et al.: Network of extreme precipitation over the Indian subcontinent
Center for Environmental Prediction and the National Cen-ter for Atmospheric Research (NCEP/NCAR) (Kalnay et al.,1996; NCEP/NCAR, 2014). In addition, we compare our re-sults with wind fields using reanalysis gridded seasonal meanwind data, also provided by NCEP/NCAR (Kalnay et al.,1996; NCEP/NCAR, 2014). The spatial resolution of the datais 2.5�. The data are extracted for (roughly) the same regionas for the APHRODITE data (see Table 1), and contain bothland and ocean points in the considered region.
2.2 Methods
We consider separately time series of rainfall events, tem-perature and pressure fields for three time periods: (i) pre-monsoon, (ii) ISM, and (iii) post-monsoon. The pre-monsoon period (March, April, May – MAM) is defined asthe period from 1 March to 31 May for each year, and con-sists of 92 days per year. This number multiplied by the num-ber of years in the data set gives the length of the time se-ries for each node in the MAM period. The monsoon period(JJAS) is defined as the period from 1 June to 30 Septemberfor each year, and consists of 122 days per year. The post-monsoon period (OND) is defined as the period from 1 Oc-tober to 31 December for each year, and consists of 92 daysper year. The time series at each node for the JJAS and ONDperiods are computed in the same manner as for the MAMperiod.
2.2.1 Event Synchronization (ES)
Considering rainfall time series, it is important to choose anappropriate method to infer similarity of dynamics betweendifferent geographical sites. Rainfall time series are not assmooth and continuous as those for temperature or pres-sure fields, but often contain a high-frequency component. Inthis study, we use ES as a method for climate network con-struction from precipitation data, as proposed in Malik et al.(2010). This method has advantages over other time-delayedcorrelation techniques (e.g., Pearson lag correlation), specif-ically for studying precipitation data, as it allows us to defineextreme event series of rainfall, depending on the kind of ex-treme, and uses a dynamic time delay. The latter refers to atime delay that is adjusted according to the two time seriesbeing compared, which allows for better adaptability to theregion of interest. Another advantage of this method is thatit can also be applied to a non-Gaussian and event-like datasets.We begin by extracting an event series, which is merely
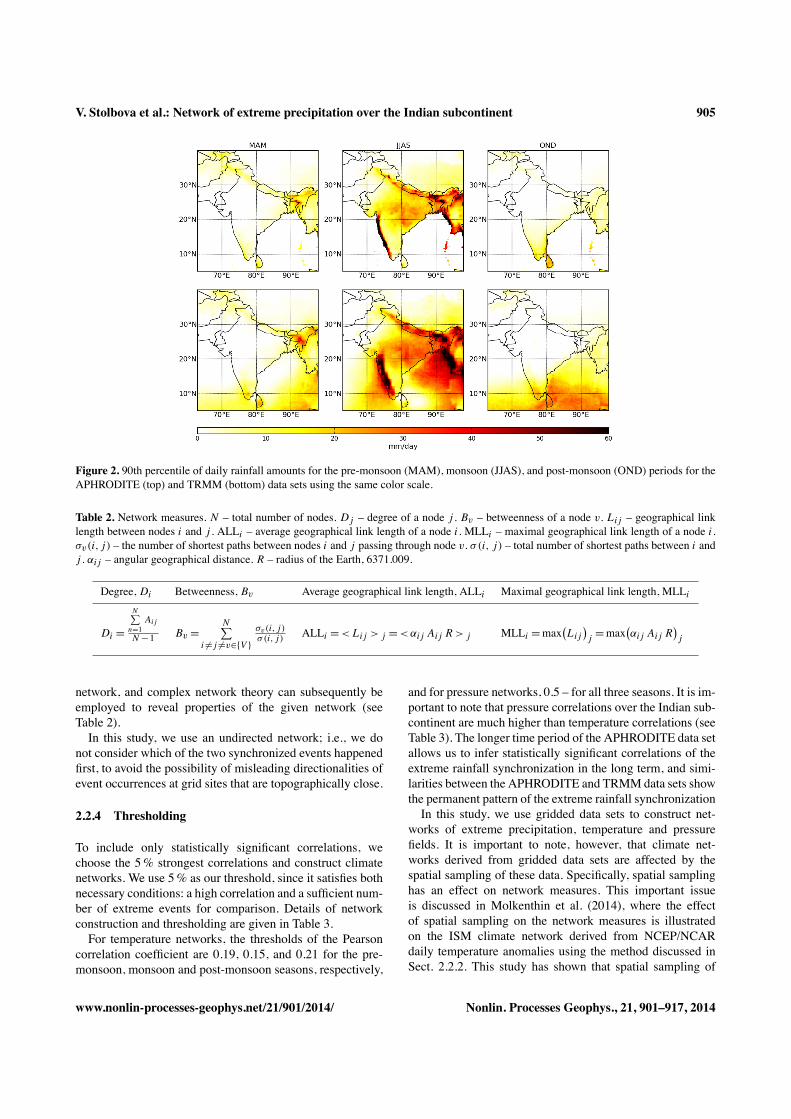
a time series that includes only the highest daily rainfallamounts, which we call “extreme events”. In the realm ofhydrology and climate sciences, extreme rainfall events aredays that receive rainfall amounts that exceed the 90th per-centile for all days in the time series at a given grid point (seeFig. 2). This threshold thus gives a unique amount of rainfallper day for each grid site. Only the daily rainfall events that
are above this threshold for a given site are considered to beextreme rainfall events, and are what make up an event series.To determine the synchronization between two grid points,
let us consider two grid sites, i and j . An event l that occursat a grid site i at time t il is considered to be synchronized withan eventm that occurs at a grid site j at time t
jm within a time
lag ±⌧ijlm if 0< til � t
jm < ⌧
ijlm, where ⌧
ijlm =min {t il+1� t il ,
t il � t il�1, tjm+1� t
jm, t
jm � t
jm�1}/2. Here, l = 1, 2, . . . , si ,
m = 1, 2, . . . , sj , where si and sj are the number of eventsat the ith and j th grid sites. Then, for each grid site, wecount the number of times when an event occurs at j after
i: c(i|j) =siP
l=1
sjPm=1
Jij , and vice versa: c(j |i). Here, Jij is an
event that happens at place j after place i within the time lag±⌧
ijlm:
Jij =
8><
>:
1, if 0 < til � tjm ⌧
ijlm,
1/2, if t il = tjm,
0, else.(1)
We then define the strength of synchronization
Qij = c(i|j) + c(j |i)q
(si � 2)�sj � 2
� (2)
between events at different grid sites i and j , and normalizeit to be 0 Qij 1. Here,Qij = 1 means complete synchro-nization, and Qij = 0 is the absence of synchronization. Af-ter repeating this procedure for all pairs (i 6= j ) of grid sites,we obtain a correlation matrix. In this case, the correlationmatrix for precipitation data is a square, symmetric matrix,which represents the strength of synchronization of the ex-treme rainfall events between each pair of grid sites.
2.2.2 Pearson correlation
In order to compare spatial patterns of extreme rainfall withspatial patterns of temperature and pressure fields, we alsoconstruct networks for these fields using NCEP/NCAR data.First, we remove the seasonal cycle by subtracting the long-term daily mean from the daily gridded temperature (pres-sure) data. We then use a zero-lag Pearson correlation coef-ficient as a measure of similarity between the nodes, as, forexample, in Donges et al. (2009a).
2.2.3 Network construction
Applying a certain threshold or link density, we yield an ad-jacency matrix
Aij =(1, ifQij � ✓
Qij ,
0, else.(3)
Here, ✓Qij is a chosen threshold (see Sect. 2.2.4), and Aij = 1
denotes a link between the ith and j th sites, and 0 de-notes otherwise. The adjacency matrix represents a climate
Nonlin. Processes Geophys., 21, 901–917, 2014 www.nonlin-processes-geophys.net/21/901/2014/
V. Stolbova et al.: Network of extreme precipitation over the Indian subcontinent 905
Figure 2. 90th percentile of daily rainfall amounts for the pre-monsoon (MAM), monsoon (JJAS), and post-monsoon (OND) periods for theAPHRODITE (top) and TRMM (bottom) data sets using the same color scale.
Table 2. Network measures. N – total number of nodes. Dj – degree of a node j . Bv – betweenness of a node v. Lij – geographical linklength between nodes i and j . ALLi – average geographical link length of a node i. MLLi – maximal geographical link length of a node i.�v(i,j) – the number of shortest paths between nodes i and j passing through node v. � (i, j) – total number of shortest paths between i andj . ↵ij – angular geographical distance. R – radius of the Earth, 6371.009.
Degree, Di Betweenness, Bv Average geographical link length, ALLi Maximal geographical link length, MLLi
Di =
NP
n=1Aij
N �1 Bv =NP
i 6=j 6=v2{V }�v(i,j)� (i,j) ALLi = < Lij > j = < ↵ij Aij R > j MLLi =max
�Lij
�j
=max�↵ij Aij R
�j
network, and complex network theory can subsequently beemployed to reveal properties of the given network (seeTable 2).In this study, we use an undirected network; i.e., we do
not consider which of the two synchronized events happenedfirst, to avoid the possibility of misleading directionalities ofevent occurrences at grid sites that are topographically close.
2.2.4 Thresholding
To include only statistically significant correlations, wechoose the 5% strongest correlations and construct climatenetworks. We use 5% as our threshold, since it satisfies bothnecessary conditions: a high correlation and a sufficient num-ber of extreme events for comparison. Details of networkconstruction and thresholding are given in Table 3.For temperature networks, the thresholds of the Pearson
correlation coefficient are 0.19, 0.15, and 0.21 for the pre-monsoon, monsoon and post-monsoon seasons, respectively,
and for pressure networks, 0.5 – for all three seasons. It is im-portant to note that pressure correlations over the Indian sub-continent are much higher than temperature correlations (seeTable 3). The longer time period of the APHRODITE data setallows us to infer statistically significant correlations of theextreme rainfall synchronization in the long term, and simi-larities between the APHRODITE and TRMMdata sets showthe permanent pattern of the extreme rainfall synchronizationIn this study, we use gridded data sets to construct net-
works of extreme precipitation, temperature and pressurefields. It is important to note, however, that climate net-works derived from gridded data sets are affected by thespatial sampling of these data. Specifically, spatial samplinghas an effect on network measures. This important issueis discussed in Molkenthin et al. (2014), where the effectof spatial sampling on the network measures is illustratedon the ISM climate network derived from NCEP/NCARdaily temperature anomalies using the method discussed inSect. 2.2.2. This study has shown that spatial sampling of
www.nonlin-processes-geophys.net/21/901/2014/ Nonlin. Processes Geophys., 21, 901–917, 2014
906 V. Stolbova et al.: Network of extreme precipitation over the Indian subcontinent
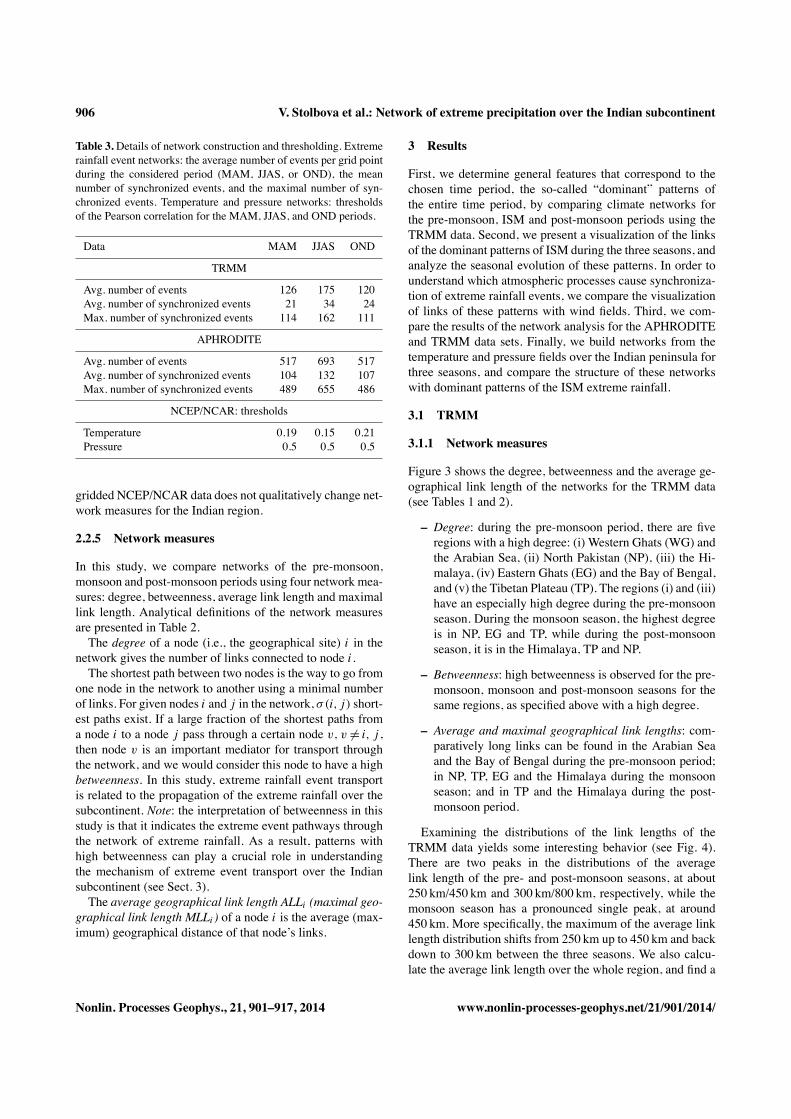
Table 3. Details of network construction and thresholding. Extremerainfall event networks: the average number of events per grid pointduring the considered period (MAM, JJAS, or OND), the meannumber of synchronized events, and the maximal number of syn-chronized events. Temperature and pressure networks: thresholdsof the Pearson correlation for the MAM, JJAS, and OND periods.
Data MAM JJAS OND
TRMM
Avg. number of events 126 175 120Avg. number of synchronized events 21 34 24Max. number of synchronized events 114 162 111
APHRODITE
Avg. number of events 517 693 517Avg. number of synchronized events 104 132 107Max. number of synchronized events 489 655 486
NCEP/NCAR: thresholds
Temperature 0.19 0.15 0.21Pressure 0.5 0.5 0.5
gridded NCEP/NCAR data does not qualitatively change net-work measures for the Indian region.
2.2.5 Network measures
In this study, we compare networks of the pre-monsoon,monsoon and post-monsoon periods using four network mea-sures: degree, betweenness, average link length and maximallink length. Analytical definitions of the network measuresare presented in Table 2.The degree of a node (i.e., the geographical site) i in the
network gives the number of links connected to node i.The shortest path between two nodes is the way to go from
one node in the network to another using a minimal numberof links. For given nodes i and j in the network, � (i,j) short-est paths exist. If a large fraction of the shortest paths froma node i to a node j pass through a certain node v, v 6= i, j ,then node v is an important mediator for transport throughthe network, and we would consider this node to have a highbetweenness. In this study, extreme rainfall event transportis related to the propagation of the extreme rainfall over thesubcontinent. Note: the interpretation of betweenness in thisstudy is that it indicates the extreme event pathways throughthe network of extreme rainfall. As a result, patterns withhigh betweenness can play a crucial role in understandingthe mechanism of extreme event transport over the Indiansubcontinent (see Sect. 3).The average geographical link length ALLi (maximal geo-
graphical link length MLLi) of a node i is the average (max-imum) geographical distance of that node’s links.
3 Results
First, we determine general features that correspond to thechosen time period, the so-called “dominant” patterns ofthe entire time period, by comparing climate networks forthe pre-monsoon, ISM and post-monsoon periods using theTRMM data. Second, we present a visualization of the linksof the dominant patterns of ISM during the three seasons, andanalyze the seasonal evolution of these patterns. In order tounderstand which atmospheric processes cause synchroniza-tion of extreme rainfall events, we compare the visualizationof links of these patterns with wind fields. Third, we com-pare the results of the network analysis for the APHRODITEand TRMM data sets. Finally, we build networks from thetemperature and pressure fields over the Indian peninsula forthree seasons, and compare the structure of these networkswith dominant patterns of the ISM extreme rainfall.
3.1 TRMM
3.1.1 Network measures
Figure 3 shows the degree, betweenness and the average ge-ographical link length of the networks for the TRMM data(see Tables 1 and 2).
– Degree: during the pre-monsoon period, there are fiveregions with a high degree: (i) Western Ghats (WG) andthe Arabian Sea, (ii) North Pakistan (NP), (iii) the Hi-malaya, (iv) Eastern Ghats (EG) and the Bay of Bengal,and (v) the Tibetan Plateau (TP). The regions (i) and (iii)have an especially high degree during the pre-monsoonseason. During the monsoon season, the highest degreeis in NP, EG and TP, while during the post-monsoonseason, it is in the Himalaya, TP and NP.
– Betweenness: high betweenness is observed for the pre-monsoon, monsoon and post-monsoon seasons for thesame regions, as specified above with a high degree.
– Average and maximal geographical link lengths: com-paratively long links can be found in the Arabian Seaand the Bay of Bengal during the pre-monsoon period;in NP, TP, EG and the Himalaya during the monsoonseason; and in TP and the Himalaya during the post-monsoon period.
Examining the distributions of the link lengths of theTRMM data yields some interesting behavior (see Fig. 4).There are two peaks in the distributions of the averagelink length of the pre- and post-monsoon seasons, at about250 km/450 km and 300 km/800 km, respectively, while themonsoon season has a pronounced single peak, at around450 km. More specifically, the maximum of the average linklength distribution shifts from 250 km up to 450 km and backdown to 300 km between the three seasons. We also calcu-late the average link length over the whole region, and find a
Nonlin. Processes Geophys., 21, 901–917, 2014 www.nonlin-processes-geophys.net/21/901/2014/

V. Stolbova et al.: Network of extreme precipitation over the Indian subcontinent 907
Figure 3. Common network measurements for the three time periods based on the TRMM data: pre-monsoon (MAM), monsoon (JJAS), andpost-monsoon (OND). From top to bottom: degree, betweenness, average geographical link lengths.
Figure 4.Average and maximal link length distributions for the three time periods based on the TRMM data: pre-monsoon (MAM), monsoon(JJAS), and post-monsoon (OND).
distance of 484 km for the monsoon season, compared to theshorter 382 and 390 km for the periods before and after themonsoon, exemplifying a trend toward longer links duringthe monsoon period. It is also worth noting the long tail of themonsoon season distribution, when compared with those ofthe pre- and post-monsoon seasons. The maximal link length
distributions are also shown in Fig. 4, and are bimodal in allthree seasons.Employing the network measures outlined above, we look
into the role of hubs (super nodes) in the organization ofthe spatial structure of the pre-monsoon, monsoon, and post-monsoon periods. We define the hubs of a network as the
www.nonlin-processes-geophys.net/21/901/2014/ Nonlin. Processes Geophys., 21, 901–917, 2014
908 V. Stolbova et al.: Network of extreme precipitation over the Indian subcontinent
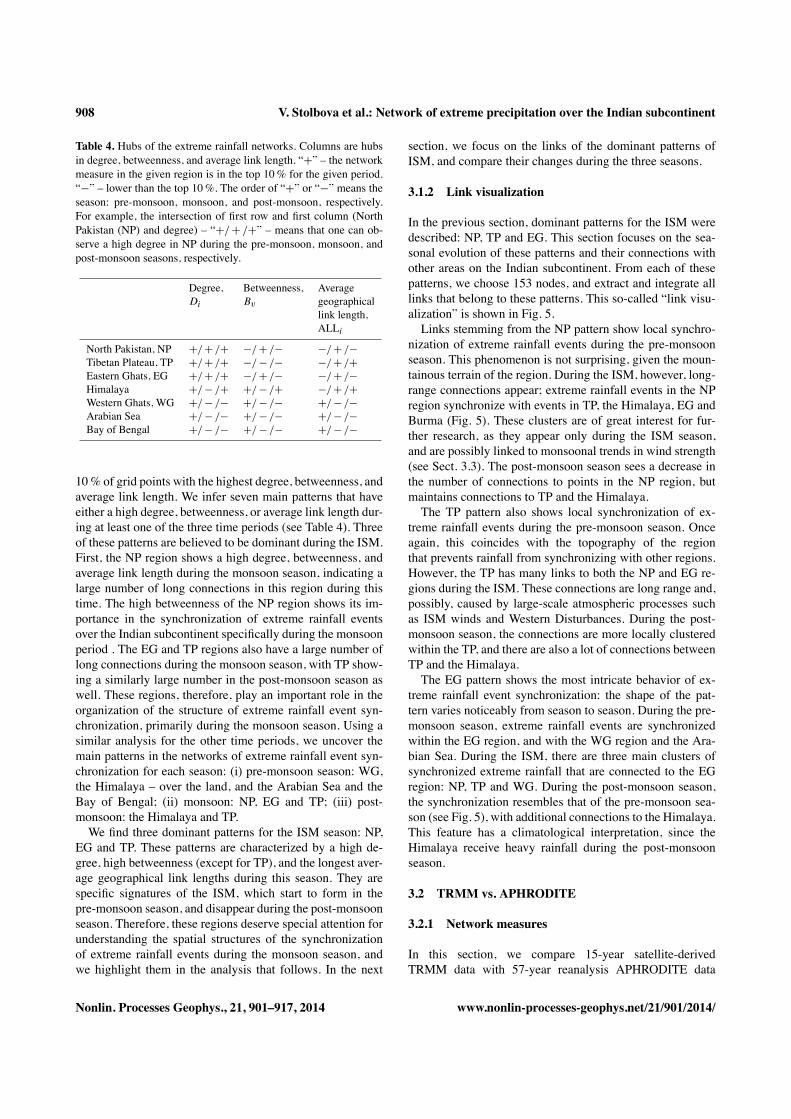
Table 4. Hubs of the extreme rainfall networks. Columns are hubsin degree, betweenness, and average link length. “+” – the networkmeasure in the given region is in the top 10% for the given period.“�” – lower than the top 10%. The order of “+” or “�” means theseason: pre-monsoon, monsoon, and post-monsoon, respectively.For example, the intersection of first row and first column (NorthPakistan (NP) and degree) – “+/ + /+” – means that one can ob-serve a high degree in NP during the pre-monsoon, monsoon, andpost-monsoon seasons, respectively.
Degree, Betweenness, AverageDi Bv geographical
link length,ALLi
North Pakistan, NP +/ + /+ �/ + /� �/ + /�Tibetan Plateau, TP +/ + /+ �/ � /� �/ + /+Eastern Ghats, EG +/ + /+ �/ + /� �/ + /�Himalaya +/ � /+ +/ � /+ �/ + /+Western Ghats, WG +/ � /� +/ � /� +/ � /�Arabian Sea +/ � /� +/ � /� +/ � /�Bay of Bengal +/ � /� +/ � /� +/ � /�
10% of grid points with the highest degree, betweenness, andaverage link length. We infer seven main patterns that haveeither a high degree, betweenness, or average link length dur-ing at least one of the three time periods (see Table 4). Threeof these patterns are believed to be dominant during the ISM.First, the NP region shows a high degree, betweenness, andaverage link length during the monsoon season, indicating alarge number of long connections in this region during thistime. The high betweenness of the NP region shows its im-portance in the synchronization of extreme rainfall eventsover the Indian subcontinent specifically during the monsoonperiod . The EG and TP regions also have a large number oflong connections during the monsoon season, with TP show-ing a similarly large number in the post-monsoon season aswell. These regions, therefore, play an important role in theorganization of the structure of extreme rainfall event syn-chronization, primarily during the monsoon season. Using asimilar analysis for the other time periods, we uncover themain patterns in the networks of extreme rainfall event syn-chronization for each season: (i) pre-monsoon season: WG,the Himalaya – over the land, and the Arabian Sea and theBay of Bengal; (ii) monsoon: NP, EG and TP; (iii) post-monsoon: the Himalaya and TP.We find three dominant patterns for the ISM season: NP,
EG and TP. These patterns are characterized by a high de-gree, high betweenness (except for TP), and the longest aver-age geographical link lengths during this season. They arespecific signatures of the ISM, which start to form in thepre-monsoon season, and disappear during the post-monsoonseason. Therefore, these regions deserve special attention forunderstanding the spatial structures of the synchronizationof extreme rainfall events during the monsoon season, andwe highlight them in the analysis that follows. In the next
section, we focus on the links of the dominant patterns ofISM, and compare their changes during the three seasons.
3.1.2 Link visualization
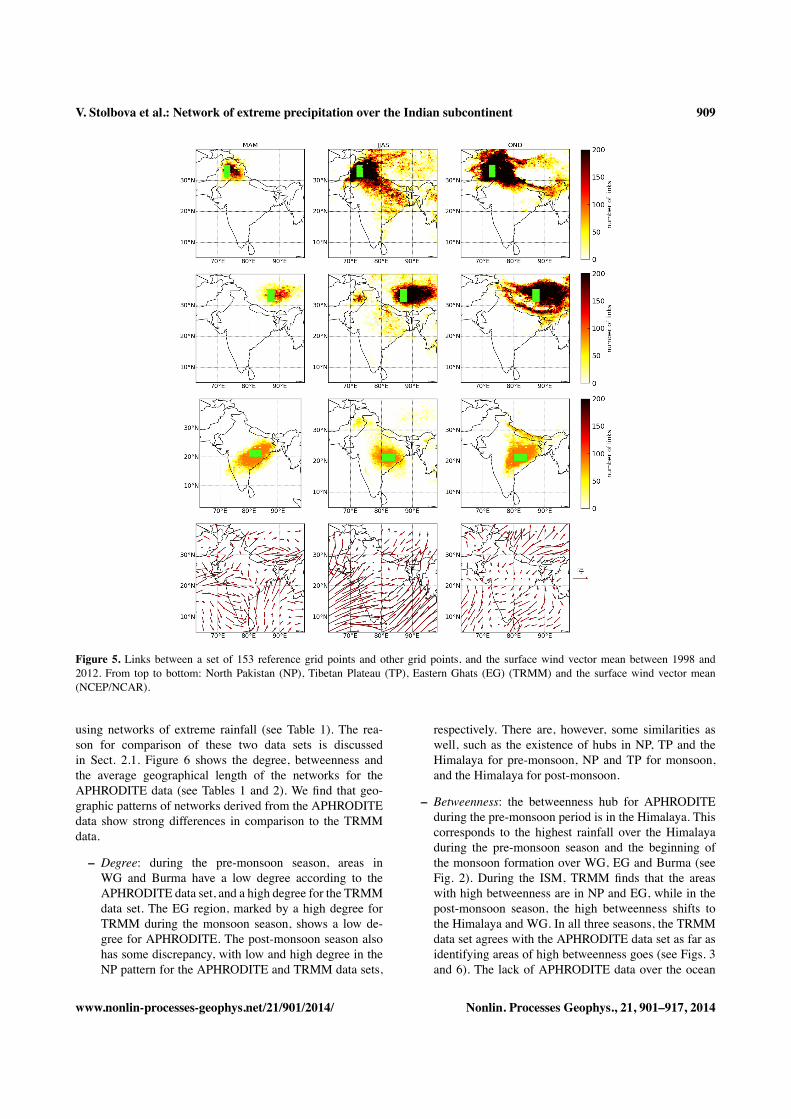
In the previous section, dominant patterns for the ISM weredescribed: NP, TP and EG. This section focuses on the sea-sonal evolution of these patterns and their connections withother areas on the Indian subcontinent. From each of thesepatterns, we choose 153 nodes, and extract and integrate alllinks that belong to these patterns. This so-called “link visu-alization” is shown in Fig. 5.Links stemming from the NP pattern show local synchro-
nization of extreme rainfall events during the pre-monsoonseason. This phenomenon is not surprising, given the moun-tainous terrain of the region. During the ISM, however, long-range connections appear; extreme rainfall events in the NPregion synchronize with events in TP, the Himalaya, EG andBurma (Fig. 5). These clusters are of great interest for fur-ther research, as they appear only during the ISM season,and are possibly linked to monsoonal trends in wind strength(see Sect. 3.3). The post-monsoon season sees a decrease inthe number of connections to points in the NP region, butmaintains connections to TP and the Himalaya.The TP pattern also shows local synchronization of ex-
treme rainfall events during the pre-monsoon season. Onceagain, this coincides with the topography of the regionthat prevents rainfall from synchronizing with other regions.However, the TP has many links to both the NP and EG re-gions during the ISM. These connections are long range and,possibly, caused by large-scale atmospheric processes suchas ISM winds and Western Disturbances. During the post-monsoon season, the connections are more locally clusteredwithin the TP, and there are also a lot of connections betweenTP and the Himalaya.The EG pattern shows the most intricate behavior of ex-
treme rainfall event synchronization: the shape of the pat-tern varies noticeably from season to season. During the pre-monsoon season, extreme rainfall events are synchronizedwithin the EG region, and with the WG region and the Ara-bian Sea. During the ISM, there are three main clusters ofsynchronized extreme rainfall that are connected to the EGregion: NP, TP and WG. During the post-monsoon season,the synchronization resembles that of the pre-monsoon sea-son (see Fig. 5), with additional connections to the Himalaya.This feature has a climatological interpretation, since theHimalaya receive heavy rainfall during the post-monsoonseason.
3.2 TRMM vs. APHRODITE
3.2.1 Network measures
In this section, we compare 15-year satellite-derivedTRMM data with 57-year reanalysis APHRODITE data
Nonlin. Processes Geophys., 21, 901–917, 2014 www.nonlin-processes-geophys.net/21/901/2014/
V. Stolbova et al.: Network of extreme precipitation over the Indian subcontinent 909
Figure 5. Links between a set of 153 reference grid points and other grid points, and the surface wind vector mean between 1998 and2012. From top to bottom: North Pakistan (NP), Tibetan Plateau (TP), Eastern Ghats (EG) (TRMM) and the surface wind vector mean(NCEP/NCAR).
using networks of extreme rainfall (see Table 1). The rea-son for comparison of these two data sets is discussedin Sect. 2.1. Figure 6 shows the degree, betweenness andthe average geographical length of the networks for theAPHRODITE data (see Tables 1 and 2). We find that geo-graphic patterns of networks derived from the APHRODITEdata show strong differences in comparison to the TRMMdata.
– Degree: during the pre-monsoon season, areas inWG and Burma have a low degree according to theAPHRODITE data set, and a high degree for the TRMMdata set. The EG region, marked by a high degree forTRMM during the monsoon season, shows a low de-gree for APHRODITE. The post-monsoon season alsohas some discrepancy, with low and high degree in theNP pattern for the APHRODITE and TRMM data sets,
respectively. There are, however, some similarities aswell, such as the existence of hubs in NP, TP and theHimalaya for pre-monsoon, NP and TP for monsoon,and the Himalaya for post-monsoon.
– Betweenness: the betweenness hub for APHRODITEduring the pre-monsoon period is in the Himalaya. Thiscorresponds to the highest rainfall over the Himalayaduring the pre-monsoon season and the beginning ofthe monsoon formation over WG, EG and Burma (seeFig. 2). During the ISM, TRMM finds that the areaswith high betweenness are in NP and EG, while in thepost-monsoon season, the high betweenness shifts tothe Himalaya and WG. In all three seasons, the TRMMdata set agrees with the APHRODITE data set as far asidentifying areas of high betweenness goes (see Figs. 3and 6). The lack of APHRODITE data over the ocean
www.nonlin-processes-geophys.net/21/901/2014/ Nonlin. Processes Geophys., 21, 901–917, 2014

910 V. Stolbova et al.: Network of extreme precipitation over the Indian subcontinent
Figure 6. Common network measurements for the three time periods based on the APHRODITE data: pre-monsoon (MAM), monsoon(JJAS), and post-monsoon (OND). From top to bottom: degree, betweenness, average geographical link lengths.
does not affect the betweenness of the network, besidescoastal areas.
– Average geographical link length: the longest links dur-ing the pre-monsoon season for the TRMM data can befound in the Arabian Sea and the Bay of Bengal, but inTP and EG for the APHRODITE data. During the ISM,the APHRODITE data show new patterns that appearin NP and Burma, while the pattern in WG disappears.The post-monsoon season sees a shift in the longest linklengths, and reveals three main patterns: the eastern Hi-malaya, TP and Burma, the first two of which coincidewith the TRMM data.
It is important to note that similarities in the spatial pat-terns obtained from 0.25� resolution TRMM data with pat-terns obtained from 0.5� resolution APHRODITE data allowus to conclude that the obtained patterns are reliable, and donot depend on the resolution of the data.
3.2.2 Link visualization
In this section, we compare the seasonal evolution of the con-nections of patterns for the APHRODITE and TRMM datasets. Similarly to Sect. 3.1.2, we choose 45 points from theAPHRODITE data set and obtain Fig. 7, which is an analogto Fig. 5 for the TRMM data.
Connections to the NP region do not qualitatively changefrom season to season for APHRODITE, unlike for TRMM.The NP pattern from the APHRODITE data set has a largerregion of synchronized rainfall during all three seasons (seeFigs. 5 and 7). The pre-monsoon season shows many linksbetween NP and the eastern Himalaya for APHRODITE, butnot for TRMM. During the monsoon season, there are nolong-range connections to TP in APHRODITE, as there arein TRMM. For the post-monsoon season, the connections areclustered locally, unlike the TRMM pattern, which also in-cludes links to the Himalaya.The TP region in APHRODITE shows a different spatial
distribution of links than in the TRMM data (see Figs. 5and 7). The APHRODITE TP region does not show strongseasonal changes in the connections. The pre-monsoon sea-son reveals connections to the eastern Himalaya, and the ISMshows no synchronization of extreme rainfall with NP, bothof which are contrary to the TRMM data. Moreover, duringthe post-monsoon period, the APHRODITE data set displaysa wider range of connections than the TRMM data do.The EG pattern from the APHRODITE data also differs
from the pattern obtained from the TRMM data. In the pre-monsoon season, connections extend to the Himalaya forAPHRODITE, but not for TRMM. The ISM season uncoverstwo main clusters - NP and Burma - where extreme rainfall is
Nonlin. Processes Geophys., 21, 901–917, 2014 www.nonlin-processes-geophys.net/21/901/2014/

V. Stolbova et al.: Network of extreme precipitation over the Indian subcontinent 911
Figure 7. Links between a set of 45 reference grid points and other grid points and the surface wind vector mean between 1951 and 2007.From top to bottom: North Pakistan (NP), Tibetan Plateau (TP), Eastern Ghats (EG) and the surface wind vector mean (NCEP/NCAR data).
synchronized with the EG region, while the TRMM data sethas additional links to WG and TP. Also, there is no synchro-nization of extreme rainfall events in the area between theNP and EG regions from both the APHRODITE and TRMMdata. During the post-monsoon season, events are synchro-nized locally, and not with the Himalaya, unlike the patternderived from TRMM (see Figs. 5 and 7).
3.3 Comparison of network structures of TRMM andAPHRODITE with surface vector mean wind fields
Here, we compare the mean surface wind fields for the threetime periods – pre-monsoon, ISM and post-monsoon – withthe patterns obtained previously from the network analysis(see Sects. 3.1.1 and 3.2.1, Figs. 5 and 7).The directionality of the winds over the Indian sub-
continent partially explains the synchronization of extreme
rainfall events within the patterns in NP and TP during thepre- and post-monsoon periods. These patterns follow the to-pography that prevents the rainfall from synchronizing withother locations across the subcontinent: NP is a low-elevationarea, bounded by mountains in the northwest, north andnortheast directions; TP is a high-elevation plateau, boundedby the Himalaya in the southwest. The TRMM data show astrong resemblance to the changing winds across the threeseasons (see Fig. 5), while the APHRODITE data show nosignificant changes (see Fig. 7).The shape of the APHRODITE EG region during the pre-
and post-monsoon seasons, however, matches the wind di-rection, whereas the TRMM data in the same region can-not be explained fully from the wind field. During the pre-monsoon season, the APHRODITE data set shows a spreadfrom south to north, following the winds. The post-monsoonpattern also corresponds to the wind direction: from northeast
www.nonlin-processes-geophys.net/21/901/2014/ Nonlin. Processes Geophys., 21, 901–917, 2014

912 V. Stolbova et al.: Network of extreme precipitation over the Indian subcontinent
Figure 8. Common network measurements for the three time periods based on the NCEP/NCAR data for the pre-monsoon (MAM), monsoon(JJAS), and post-monsoon (OND) temperature networks. From top to bottom: degree, betweenness, average geographical link lengths.
to southwest. The noteworthy observation is that during thepre-monsoon season, the spatial pattern in NP coincides withthe divergence of the surface vector mean winds, while theEG spatial pattern coincides with the convergence of surfacevector mean winds for both the APHRODITE and TRMMdata. During the monsoon season, surface vector mean windschange dramatically, and the NP spatial pattern coincideswith wind convergence, while during the post-monsoon sea-son, the NP spatial pattern coincides with wind divergence.The ISM season shows a difference between rainfall event
synchronization and wind fields, in both data sets. As men-tioned above, there are connections between NP and EG, butnot in the area between these two regions. This seems to in-dicate that winds are not the cause of this synchronization.However, this phenomenon may be caused by the topogra-phy of these regions and the influence of two branches of theISM: the Bay of Bengal branch that transports moisture andinteracts with the wind systems from the Arabian Sea branch.
3.4 Comparison of patterns of extreme precipitationwith patterns obtained from temperature andpressure fields
In this section, we analyze the seasonal evolution of cli-mate networks over the Indian subcontinent. We compare
networks of extreme rainfall (analyzed in previous sections)with networks of temperature and pressure fields (see Figs. 8and 9).
– Temperature network: degree: a temperature networkobtained from the NCEP/NCAR data (see Sect. 2.1, Ta-ble 1) for the pre-monsoon season exhibits degree hubsin NP/Afghanistan, TP and the southern part of the In-dian peninsula, including Sri Lanka (see Fig. 8). Dur-ing the ISM season, only two of the previously iden-tified patterns appear – NP/Afghanistan and TP. Thepost-monsoon season has the same hubs as during thepre-monsoon season.
– Temperature network: betweenness: betweenness hubsof the temperature networks do not show a distinctivestructure. They appear to be located in central India,and do not change qualitatively throughout the threeseasons.
– Temperature network: average link length: during thepre-monsoon period, average link length hubs appear inthe southern parts of the Indian peninsula, the Bay ofBengal and the Arabian Sea. The ISM hubs appear inNP/Afghanistan, TP, and in the southern Arabian Sea.As with degree, the post-monsoon season hubs matchthose of the pre-monsoon season.
Nonlin. Processes Geophys., 21, 901–917, 2014 www.nonlin-processes-geophys.net/21/901/2014/

V. Stolbova et al.: Network of extreme precipitation over the Indian subcontinent 913
Figure 9. Network measurements for the three time periods: pre-monsoon (MAM), monsoon (JJAS), and post-monsoon (OND) pressurenetworks. From top to bottom: degree, betweenness, average geographical link lengths (NCEP/NCAR data).
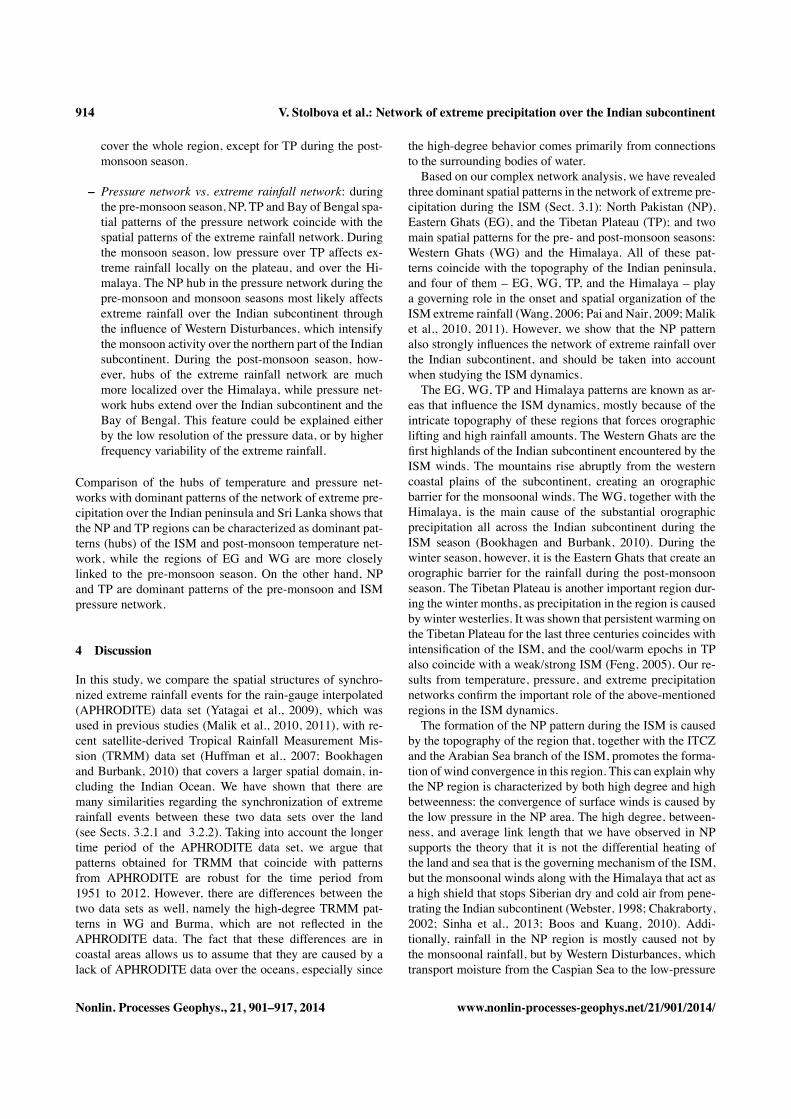
– Temperature network vs. extreme rainfall network: dur-ing the pre-monsoon season, coincidence of the degreeand the average link length hub of the temperature net-work with the WG and Arabian Sea hub of the ex-treme rainfall network (high degree, betweenness andthe average link length) emphasizes the role of the Ara-bian Sea in controlling extreme rainfall over the westerncoast of the Indian subcontinent. During the ISM, theNP and TP hubs of the temperature network coincidewith hubs of the extreme rainfall network, and the longaverage link length of the TP in the temperature networkpoints out the importance of the TP in the distribution ofthe temperature gradient over the Indian subcontinent,which creates a pressure gradient and affects the dis-tribution of the extreme rainfall through wind systems.During the post-monsoon season, the effect of the NPand TP hubs on the temperature and extreme rainfallsynchronization networks weakens. While temperaturechanges during the post-monsoon season are governedmostly by the surface air temperature of the Arabian Seaand the Bay of Bengal (see Fig. 8), extreme rainfall syn-chronization during this season is controlled by TP andthe Himalaya (see Figs. 3 and 5). For consideration ofthe important issue of annual and decadal evolution of
the temperature networks over the Indian subcontinent,we refer the reader to Tupikina et al. (2014).
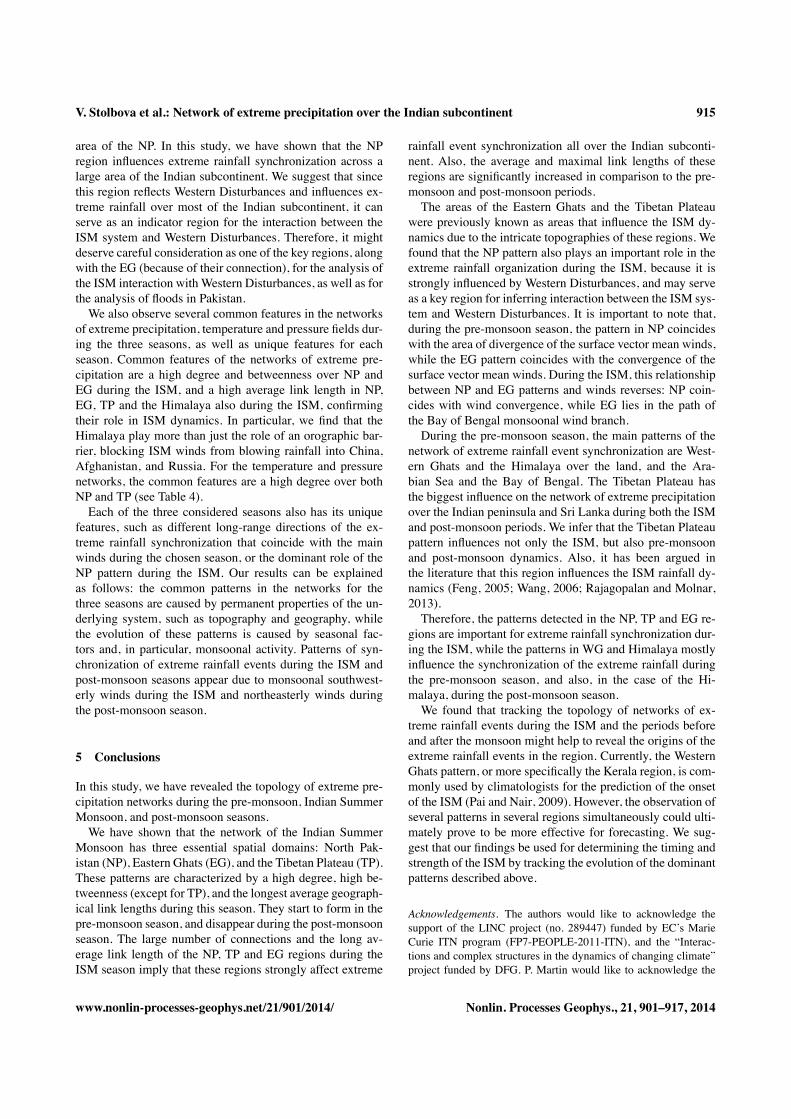
– Pressure network: degree: the pressure network con-structed based on data from NCEP/NCAR shows pre-monsoon degree hubs in the regions of NP, Afghanistan,TP, the Bay of Bengal and Sri Lanka (see Fig. 9). Thesehubs maintain their locations during the ISM seasonand, additionally, the Bay of Bengal hub extends acrossthe southern tip of India. During the post-monsoon sea-son, the hubs combine to form one large hub overthe central and northern parts of India and the Bay ofBengal.
– Pressure network: betweenness: the betweenness doesnot show well-defined patterns across all seasons, ex-cept for the EG hub during the pre-monsoon season.Difficulties in the pattern determination on the between-ness maps may be due to the relatively small number ofnodes in this network.
– Pressure network: average link length: the hubs of theaverage link length, although not very distinguished,are still observable in NP, Afghanistan and along the5–10� N belt over Sri Lanka. They appear during thepre-monsoon season, do not change across the ISM, and
www.nonlin-processes-geophys.net/21/901/2014/ Nonlin. Processes Geophys., 21, 901–917, 2014
914 V. Stolbova et al.: Network of extreme precipitation over the Indian subcontinent
cover the whole region, except for TP during the post-monsoon season.
– Pressure network vs. extreme rainfall network: duringthe pre-monsoon season, NP, TP and Bay of Bengal spa-tial patterns of the pressure network coincide with thespatial patterns of the extreme rainfall network. Duringthe monsoon season, low pressure over TP affects ex-treme rainfall locally on the plateau, and over the Hi-malaya. The NP hub in the pressure network during thepre-monsoon and monsoon seasons most likely affectsextreme rainfall over the Indian subcontinent throughthe influence of Western Disturbances, which intensifythe monsoon activity over the northern part of the Indiansubcontinent. During the post-monsoon season, how-ever, hubs of the extreme rainfall network are muchmore localized over the Himalaya, while pressure net-work hubs extend over the Indian subcontinent and theBay of Bengal. This feature could be explained eitherby the low resolution of the pressure data, or by higherfrequency variability of the extreme rainfall.
Comparison of the hubs of temperature and pressure net-works with dominant patterns of the network of extreme pre-cipitation over the Indian peninsula and Sri Lanka shows thatthe NP and TP regions can be characterized as dominant pat-terns (hubs) of the ISM and post-monsoon temperature net-work, while the regions of EG and WG are more closelylinked to the pre-monsoon season. On the other hand, NPand TP are dominant patterns of the pre-monsoon and ISMpressure network.
4 Discussion
In this study, we compare the spatial structures of synchro-nized extreme rainfall events for the rain-gauge interpolated(APHRODITE) data set (Yatagai et al., 2009), which wasused in previous studies (Malik et al., 2010, 2011), with re-cent satellite-derived Tropical Rainfall Measurement Mis-sion (TRMM) data set (Huffman et al., 2007; Bookhagenand Burbank, 2010) that covers a larger spatial domain, in-cluding the Indian Ocean. We have shown that there aremany similarities regarding the synchronization of extremerainfall events between these two data sets over the land(see Sects. 3.2.1 and 3.2.2). Taking into account the longertime period of the APHRODITE data set, we argue thatpatterns obtained for TRMM that coincide with patternsfrom APHRODITE are robust for the time period from1951 to 2012. However, there are differences between thetwo data sets as well, namely the high-degree TRMM pat-terns in WG and Burma, which are not reflected in theAPHRODITE data. The fact that these differences are incoastal areas allows us to assume that they are caused by alack of APHRODITE data over the oceans, especially since
the high-degree behavior comes primarily from connectionsto the surrounding bodies of water.Based on our complex network analysis, we have revealed
three dominant spatial patterns in the network of extreme pre-cipitation during the ISM (Sect. 3.1): North Pakistan (NP),Eastern Ghats (EG), and the Tibetan Plateau (TP); and twomain spatial patterns for the pre- and post-monsoon seasons:Western Ghats (WG) and the Himalaya. All of these pat-terns coincide with the topography of the Indian peninsula,and four of them – EG, WG, TP, and the Himalaya – playa governing role in the onset and spatial organization of theISM extreme rainfall (Wang, 2006; Pai and Nair, 2009; Maliket al., 2010, 2011). However, we show that the NP patternalso strongly influences the network of extreme rainfall overthe Indian subcontinent, and should be taken into accountwhen studying the ISM dynamics.The EG, WG, TP and Himalaya patterns are known as ar-
eas that influence the ISM dynamics, mostly because of theintricate topography of these regions that forces orographiclifting and high rainfall amounts. The Western Ghats are thefirst highlands of the Indian subcontinent encountered by theISM winds. The mountains rise abruptly from the westerncoastal plains of the subcontinent, creating an orographicbarrier for the monsoonal winds. The WG, together with theHimalaya, is the main cause of the substantial orographicprecipitation all across the Indian subcontinent during theISM season (Bookhagen and Burbank, 2010). During thewinter season, however, it is the Eastern Ghats that create anorographic barrier for the rainfall during the post-monsoonseason. The Tibetan Plateau is another important region dur-ing the winter months, as precipitation in the region is causedby winter westerlies. It was shown that persistent warming onthe Tibetan Plateau for the last three centuries coincides withintensification of the ISM, and the cool/warm epochs in TPalso coincide with a weak/strong ISM (Feng, 2005). Our re-sults from temperature, pressure, and extreme precipitationnetworks confirm the important role of the above-mentionedregions in the ISM dynamics.The formation of the NP pattern during the ISM is caused
by the topography of the region that, together with the ITCZand the Arabian Sea branch of the ISM, promotes the forma-tion of wind convergence in this region. This can explain whythe NP region is characterized by both high degree and highbetweenness: the convergence of surface winds is caused bythe low pressure in the NP area. The high degree, between-ness, and average link length that we have observed in NPsupports the theory that it is not the differential heating ofthe land and sea that is the governing mechanism of the ISM,but the monsoonal winds along with the Himalaya that act asa high shield that stops Siberian dry and cold air from pene-trating the Indian subcontinent (Webster, 1998; Chakraborty,2002; Sinha et al., 2013; Boos and Kuang, 2010). Addi-tionally, rainfall in the NP region is mostly caused not bythe monsoonal rainfall, but by Western Disturbances, whichtransport moisture from the Caspian Sea to the low-pressure
Nonlin. Processes Geophys., 21, 901–917, 2014 www.nonlin-processes-geophys.net/21/901/2014/
V. Stolbova et al.: Network of extreme precipitation over the Indian subcontinent 915
area of the NP. In this study, we have shown that the NPregion influences extreme rainfall synchronization across alarge area of the Indian subcontinent. We suggest that sincethis region reflects Western Disturbances and influences ex-treme rainfall over most of the Indian subcontinent, it canserve as an indicator region for the interaction between theISM system and Western Disturbances. Therefore, it mightdeserve careful consideration as one of the key regions, alongwith the EG (because of their connection), for the analysis ofthe ISM interaction with Western Disturbances, as well as forthe analysis of floods in Pakistan.We also observe several common features in the networks
of extreme precipitation, temperature and pressure fields dur-ing the three seasons, as well as unique features for eachseason. Common features of the networks of extreme pre-cipitation are a high degree and betweenness over NP andEG during the ISM, and a high average link length in NP,EG, TP and the Himalaya also during the ISM, confirmingtheir role in ISM dynamics. In particular, we find that theHimalaya play more than just the role of an orographic bar-rier, blocking ISM winds from blowing rainfall into China,Afghanistan, and Russia. For the temperature and pressurenetworks, the common features are a high degree over bothNP and TP (see Table 4).Each of the three considered seasons also has its unique
features, such as different long-range directions of the ex-treme rainfall synchronization that coincide with the mainwinds during the chosen season, or the dominant role of theNP pattern during the ISM. Our results can be explainedas follows: the common patterns in the networks for thethree seasons are caused by permanent properties of the un-derlying system, such as topography and geography, whilethe evolution of these patterns is caused by seasonal fac-tors and, in particular, monsoonal activity. Patterns of syn-chronization of extreme rainfall events during the ISM andpost-monsoon seasons appear due to monsoonal southwest-erly winds during the ISM and northeasterly winds duringthe post-monsoon season.
5 Conclusions
In this study, we have revealed the topology of extreme pre-cipitation networks during the pre-monsoon, Indian SummerMonsoon, and post-monsoon seasons.We have shown that the network of the Indian Summer
Monsoon has three essential spatial domains: North Pak-istan (NP), Eastern Ghats (EG), and the Tibetan Plateau (TP).These patterns are characterized by a high degree, high be-tweenness (except for TP), and the longest average geograph-ical link lengths during this season. They start to form in thepre-monsoon season, and disappear during the post-monsoonseason. The large number of connections and the long av-erage link length of the NP, TP and EG regions during theISM season imply that these regions strongly affect extreme
rainfall event synchronization all over the Indian subconti-nent. Also, the average and maximal link lengths of theseregions are significantly increased in comparison to the pre-monsoon and post-monsoon periods.The areas of the Eastern Ghats and the Tibetan Plateau
were previously known as areas that influence the ISM dy-namics due to the intricate topographies of these regions. Wefound that the NP pattern also plays an important role in theextreme rainfall organization during the ISM, because it isstrongly influenced by Western Disturbances, and may serveas a key region for inferring interaction between the ISM sys-tem and Western Disturbances. It is important to note that,during the pre-monsoon season, the pattern in NP coincideswith the area of divergence of the surface vector mean winds,while the EG pattern coincides with the convergence of thesurface vector mean winds. During the ISM, this relationshipbetween NP and EG patterns and winds reverses: NP coin-cides with wind convergence, while EG lies in the path ofthe Bay of Bengal monsoonal wind branch.During the pre-monsoon season, the main patterns of the
network of extreme rainfall event synchronization are West-ern Ghats and the Himalaya over the land, and the Ara-bian Sea and the Bay of Bengal. The Tibetan Plateau hasthe biggest influence on the network of extreme precipitationover the Indian peninsula and Sri Lanka during both the ISMand post-monsoon periods. We infer that the Tibetan Plateaupattern influences not only the ISM, but also pre-monsoonand post-monsoon dynamics. Also, it has been argued inthe literature that this region influences the ISM rainfall dy-namics (Feng, 2005; Wang, 2006; Rajagopalan and Molnar,2013).Therefore, the patterns detected in the NP, TP and EG re-
gions are important for extreme rainfall synchronization dur-ing the ISM, while the patterns in WG and Himalaya mostlyinfluence the synchronization of the extreme rainfall duringthe pre-monsoon season, and also, in the case of the Hi-malaya, during the post-monsoon season.We found that tracking the topology of networks of ex-
treme rainfall events during the ISM and the periods beforeand after the monsoon might help to reveal the origins of theextreme rainfall events in the region. Currently, the WesternGhats pattern, or more specifically the Kerala region, is com-monly used by climatologists for the prediction of the onsetof the ISM (Pai and Nair, 2009). However, the observation ofseveral patterns in several regions simultaneously could ulti-mately prove to be more effective for forecasting. We sug-gest that our findings be used for determining the timing andstrength of the ISM by tracking the evolution of the dominantpatterns described above.
Acknowledgements. The authors would like to acknowledge thesupport of the LINC project (no. 289447) funded by EC’s MarieCurie ITN program (FP7-PEOPLE-2011-ITN), and the “Interac-tions and complex structures in the dynamics of changing climate”project funded by DFG. P. Martin would like to acknowledge the
www.nonlin-processes-geophys.net/21/901/2014/ Nonlin. Processes Geophys., 21, 901–917, 2014

916 V. Stolbova et al.: Network of extreme precipitation over the Indian subcontinent
support of the National Science Foundation Graduate ResearchFellowship Program. The authors thank Henk Dijkstra for helpfuldiscussions, and Kira Rehfeld for visualization of topographicaldata. The authors would like to thank the two anonymous reviewersfor their helpful comments. Complex-network measures have beencalculated on the IBM iDataPlex cluster at the Potsdam Institutefor Climate Impact Research using the pyunicorn software package.
Edited by: A. LoewReviewed by: two anonymous referees
References
Achuthavarier, D., Krishnamurthy, V., Kirtman, B. P., and Huang,B.: Role of the Indian Ocean in the ENSO–Indian Summer Mon-soon Teleconnection in the NCEP Climate Forecast System, J.Climate, 25, 2490–2508, 2012.
Barreiro, M., Marti, A. C., and Masoller, C.: Inferring long mem-ory processes in the climate network via ordinal pattern analysis,Chaos, 21, 013101, doi:10.1063/1.3545273, 2011.
Boers, N., Bookhagen, B., Marwan, N., Kurths, J., and Marengo, J.:Complex networks identify spatial patterns of extreme rainfallevents of the South American Monsoon System, Geophys. Res.Lett., 40, 4386–4392, 2013.
Bookhagen, B. and Burbank, D. W.: Toward a complete Himalayanhydrological budget: Spatiotemporal distribution of snowmeltand rainfall and their impact on river discharge, J. Geophys. Res.,115, F03019, doi:10.1029/2009JF001426, 2010.
Boos, W. R. and Kuang, Z.: Dominant control of the South Asianmonsoon by orographic insulation versus plateau heating, Na-ture, 463, 218–222, 2010.
Chakraborty, A.: Role of Asian and African orography inIndian summer monsoon, Geophys. Res. Lett., 29, 1989,doi:10.1029/2002GL015522, 2002.
Deza, J., Barreiro, M., andMasoller, C.: Inferring interdependenciesin climate networks constructed at inter-annual, intra-season andlonger time scales, Eur. Phys. J. Spec. Top., 222, 511–523, 2013.
Deza, J. I., Masoller, C., and Barreiro, M.: Distinguishing theeffects of internal and forced atmospheric variability in cli-mate networks, Nonlin. Processes Geophys., 21, 617–631,doi:10.5194/npg-21-617-2014, 2014.
Donges, J. F., Zou, Y., Marwan, N., and Kurths, J.: The back-bone of the climate network, Europhys. Lett., 87, 48007,doi:10.1140/epjst/e2009-01098-2, 2009a.
Donges, J. F., Zou, Y., Marwan, N., and Kurths, J.: Complex net-works in climate dynamics, Eur. Phys. J. Spec. Top., 174, 157–179, 2009b.
Feldhoff, J. H., Donner, R. V., Donges, J. F., Marwan, N.,and Kurths, J.: Geometric signature of complex synchronisa-tion scenarios, Europhys. Lett., 102, 30007, doi:10.1209/0295-5075/102/30007, 2013.
Feng, S.: Regulation of Tibetan Plateau heating on variation of In-dian summer monsoon in the last two millennia, Geophys. Res.Lett., 32, L02702, doi:10.1029/2004GL021246, 2005.
Flohn, H.: Large-scale aspects of the “summer monsoon” in southand East Asia, J. Meteorol. Soc. Jpn., 75, 180–186, 1957.
Gadgil, S.: The Indian monsoon and its variability, Annu. Rev. EarthPlanet. Sci., 31, 429–467, 2003.
Gadgil, S.: Extremes of the Indian summer monsoon rainfall, ENSOand equatorial Indian Ocean oscillation, Geophys. Res. Lett., 31,L12213, doi:10.1029/2004GL019733, 2004.
GEBCO: http://www.gebco.net/data_and_products/gridded_bathymetry_data/, last access: 21 May 2014.
Gozolchiani, A., Yamasaki, K., Gazit, O., and Havlin, S.: Pattern ofclimate network blinking links follows El Niño events, Europhys.Lett., 83, 28005, doi:10.1209/0295-5075/83/28005, 2008.
Gozolchiani, A., Havlin, S., and Yamasaki, K.: The Emergence ofEl Niño as an Autonomous Component in the Climate Network,Phys. Rev. Lett., 107, 14, doi:10.1103/PhysRevLett.107.148501,2011.
Huffman, G. J., Bolvin, D. T., Nelkin, E. J., Wolff, D. B., Adler,R. F., Gu, G., Hong, Y., Bowman, K. P., and Stocker, E. F.: TheTRMM Multisatellite Precipitation Analysis (TMPA): Quasi-Global, Multiyear, Combined-Sensor Precipitation Estimates atFine Scales, J. Hydrometeorol., 8, 38–55, 2007.
Kalnay, E., Kanamitsu, M., Kistler, R., Collins, W., Deaven, D.,Gandin, L., Iredell, M., Saha, S., White, G., Woollen, J., Zhu,Y., Chelliah, M., Ebisuzaki, W., Higgins, W., Janowiak, J., Mo,K. C., Ropelewski, C., Wang, J., Leetmaa, A., Reynolds, R.,Jenne, R., and Joseph, D.: The NCEP/NCAR 40-year reanalysisproject, B. Am. Meteorol. Soc., 77, 437–440, 1996.
Krishna Kumar, K.: Advancing dynamical prediction of In-dian monsoon rainfall, Geophys. Res. Lett., 32, L08704,doi:10.1029/2004GL021979, 2005.
Krishnamurti, T. N.: Tropical East-West Circulations During theNorthern Summer, J. Atmos. Sci., 28, 1342–1347, 1971.
Malik, N., Marwan, N., and Kurths, J.: Spatial structures and di-rectionalities in Monsoonal precipitation over South Asia, Non-lin. Processes Geophys., 17, 371–381, doi:10.5194/npg-17-371-2010, 2010.
Malik, N., Bookhagen, B., Marwan, N., and Kurths, J.: Analysis ofspatial and temporal extreme monsoonal rainfall over South Asiausing complex networks, Clim. Dynam., 39, 971–987, 2011.
Martin, E., Paczuski, M., and Davidsen, J.: Interpretation of linkfluctuations in climate networks during El Niño periods, Eu-rophys. Lett., 102, 48003, doi:10.1209/0295-5075/102/48003,2013.
Marwan, N., Donges, J. F., Zou, Y., Donner, R. V., and Kurths, J.:Complex network approach for recurrence analysis of time se-ries, Phys. Lett. A, 373, 4246–4254, 2009.
Marwan, N., Schinkel, S., and Kurths, J.: Recurrence plots 25 yearslater – Gaining confidence in dynamical transitions, Europhys.Lett., 101, 20007, doi:10.1209/0295-5075/101/20007, 2013.
Molkenthin, N., Rehfeld, K., Stolbova, V., Tupikina, L., and Kurths,J.: On the influence of spatial sampling on climate networks,Nonlin. Processes Geophys., 21, 651–657, doi:10.5194/npg-21-651-2014, 2014.
NCEP/NCAR: http://www.erls.noaa.gov/psd, last access: 25 Febru-ary 2014.
Pai, D. and Nair, R. M.: Summer monsoon onset over Kerala: Newdefinition and prediction, J. Earth Syst. Sci, 118, 123–135, 2009.
Paluš, M., Hartman, D., Hlinka, J., and Vejmelka, M.: Discerningconnectivity from dynamics in climate networks, Nonlin. Pro-cesses Geophys., 18, 751–763, doi:10.5194/npg-18-751-2011,2011.
Nonlin. Processes Geophys., 21, 901–917, 2014 www.nonlin-processes-geophys.net/21/901/2014/
V. Stolbova et al.: Network of extreme precipitation over the Indian subcontinent 917
Rajagopalan, B. and Molnar, P.: Signatures of Tibetan Plateau heat-ing on Indian summer monsoon rainfall variability, J. Geophys.Res.-Atmos., 118, 1170–1178, 2013.
Rajkumari, G. and Narasimha, R.: Statistical analysis of the positionof the monsoon trough, Proc. Indian Acad. Sci., 105, 343–355,1996.
Rao, N. G.: Variations of the SO Relationship with Summer andWinter Monsoon Rainfall over India: 1872–1993, J. Climate, 12,3486–3495, 1999.
Rehfeld, K., Marwan, N., Breitenbach, S. F. M., Kurths, J., and Dy-namics, C.: Late Holocene Asian Summer Monsoon dynamicsfrom small but complex networks of palaeoclimate data, Clim.Dynam., doi:10.1007/s00382-012-1448-3, in press, 2012.
Revadekar, J. V. and Preethi, B.: Statistical analysis of the relation-ship between summer monsoon precipitation extremes and food-grain yield over India, Int. J. Climatol., 32, 419–429, 2012.
Rheinwalt, A., Marwan, N., Kurths, J., Werner, P., and Ger-stengarbe, F.-W.: Boundary effects in network measures ofspatially embedded networks, Europhys. Lett., 100, 28002,doi:10.1209/0295-5075/100/28002, 2012.
Sabeerali, C. T., Rao, S. A., Ajayamohan, R. S., and Mur-tugudde, R.: On the relationship between Indian summer mon-soon withdrawal and Indo-Pacific SST anomalies before and af-ter 1976/1977 climate shift, Clim. Dynam., 39, 841–859, 2011.
Sankar, S., Kumar, M. R. R., Reason, C., and Paula, D.: On theRelative Roles of El Nino and Indian Ocean Dipole Events on theMonsoon Onset over Kerala, Theor. Appl. Climatol., 103, 359–374, 2011.
Scarsoglio, S., Laio, F., and Ridolfi, L.: Climate dynamics: anetwork-based approach for the analysis of global precipitation,PloS One, 8, e71129, doi:10.1371/journal.pone.0071129, 2013.
Singh, N. and Sontakke, N. A.: On the Variability and Prediction ofRainfall in the Post-monsoon season over India, Int. J. Climatol.,19, 309–339, 1999.
Sinha, P., Mohanty, U. C., Kar, S. C., and Kumari, S.: Role of theHimalayan Orography in Simulation of the Indian Summer Mon-soon using RegCM3, Pure Appl. Geophys., doi:10.1007/s00024-013-0675-9, in press, 2013.
Tirabassi, G. and Masoller, C.: On the effects of lag-times in net-works constructed from similarities of monthly fluctuations ofclimate fields, Eur. Phys. Lett., 102 59003, doi:10.1209/0295-5075/102/59003, 2013.
TRMM: http://disc.sci.gsfc.nasa.gov/precipitation/documentation/,last access: 25 February 2014.
Tsonis, A. and Roebber, P.: The architecture of the climate network,Physica A, 333, 497–504, 2004.
Tsonis, A. A. and Swanson, K.: Topology and Predictability ofEl Niño and La Niña Networks, Phys. Rev. Lett., 100, 228502,doi:10.1103/PhysRevLett.100.228502, 2008.
Tsonis, A. A., Swanson, K. L., and Roebber, P. J.: What Do Net-works Have to Do with Climate?, B. Am. Meteorol. Soc., 87,585–595, 2006.
Tsonis, A. A., Swanson, K. L., and Wang, G.: On the Role of Atmo-spheric Teleconnections in Climate, J. Climate, 21, 2990–3001,2008.
Tsonis, A. A., Wang, G., Swanson, K. L., Rodrigues, F. A., andCosta, L. D. F.: Community structure and dynamics in climatenetworks, Clim. Dynam., 37, 933–940, 2010.
Tupikina, L., Rehfeld, K., Molkenthin, N., Stolbova, V., Mar-wan, N., and Kurths, J.: Characterizing the evolution of cli-mate networks, Nonlin. Processes Geophys., 21, 705–711,doi:10.5194/npg-21-705-2014, 2014.
Waliser, D. E., Jin, K., Kang, I.-S., Stern, W. F., Schubert, S. D.,Wu, M. L. C., Lau, K.-M., Lee, M.-I., Krishnamurthy, V., Kitoh,A., Meehl, G. A., Galin, V. Y., Satyan, V., Mandke, S. K., Wu,G., Liu, Y., and Park, C.-K.: AGCM simulations of intraseasonalvariability associated with the Asian summer monsoon, Clim.Dynam., 21, 423–446, 2003.
Wang, B.: The Asian Monsoon, Springer Praxis Books, Springer,Berlin, Germany, 2006.
Wang, Y., Gozolchiani, A., Ashkenazy, Y., Berezin, Y., Guez,O., and Havlin, S.: Dominant Imprint of Rossby Wavesin the Climate Network, Phys. Rev. Lett., 111, 138501,doi:10.1103/PhysRevLett.111.138501, 2013.
Webster, P.: The Elementary Monsoon, John Wiley, New York,32 pp., 1997.
Webster, P.: Monsoon: Processes, predictability, and the prospectsfor prediction, J. Geophys. Res., 103, 14451–14510, 1998.
Wu, R. and Kirtman, B. P.: On the impacts of the Indian summermonsoon on ENSO in a coupled GCM, Q. J. Roy. Meteorol. Soc.,129, 3439–3468, 2003.
Wu, R., Chen, J., and Chen, W.: Different Types of ENSO Influ-ences on the Indian Summer Monsoon Variability, J. Climate,25, 903–920, 2012.
Yamasaki, K., Gozolchiani, A., and Havlin, S.: Climate Networksaround the Globe are Significantly Affected by El Niño, Phys.Rev. Lett., 100, 228501, doi:10.1103/PhysRevLett.100.228501,2008.
Yamasaki, K., Gozolchiani, A., Havlin, S., and Gan, R.: ClimateNetworks Based on Phase Synchronization Analysis Track El-Niño, in: Progress of Theoretical Physics Supplement, 178–188,doi:10.1143/PTPS.179.178, 2009.
Yatagai, A., Arakawa, O., Kamiguchi, K., and Kawamoto, H.: A44-Year Daily Gridded Precipitation Dataset for Asia, B. Am.Meteorol. Soc., 5, 3–6, 2009.
www.nonlin-processes-geophys.net/21/901/2014/ Nonlin. Processes Geophys., 21, 901–917, 2014